
Abstract
Background:
The alterations in gait pattern of people with transfemoral amputation leave them more susceptible to musculoskeletal injury. Principal component analysis is a method that reduces the amount of gait data and allows analyzing the entire waveform.
Objectives:
To use the principal component analysis to compare the ground reaction force and center of pressure displacement waveforms obtained during gait between able-bodied subjects and both limbs of individuals with transfemoral amputation.
Study design:
This is a transversal study with a convenience sample.
Methods:
We used a force plate and pressure plate to record the anterior–posterior, medial–lateral and vertical ground reaction force, and anterior–posterior and medial–lateral center of pressure positions of 12 participants with transfemoral amputation and 20 able-bodied subjects during gait. The principal component analysis was performed to compare the gait waveforms between the participants with transfemoral amputation and the able-bodied individuals.
Results:
The principal component analysis model explained between 74% and 93% of the data variance. In all ground reaction force and center of pressure waveforms relevant portions were identified; and always at least one principal component presented scores statistically different (p < 0.05) between the groups of participants in these relevant portions.
Conclusion:
Principal component analysis was able to discriminate many portions of the stance phase between both lower limbs of people with transfemoral amputation compared to the able-bodied participants.
Clinical relevance
Principal component analysis reduced the amount of data, allowed analyzing the whole waveform, and identified specific sub-phases of gait that were different between the groups. Therefore, this approach seems to be a powerful tool to be used in gait evaluation and following the rehabilitation status of people with transfemoral amputation.
Background
Prosthetic components are devices that intend to substitute a limb of the human body, aiming to allow functionality as close as possible to the original function of the amputated limb (AL). The prosthetic devices available for amputations above the knee induce a pattern of movement different from the normal, with high asymmetry between limbs.1–5 Possibly, this asymmetric pattern in people with transfemoral (TF) amputation contributes to the higher incidence (+71%) of pain in the sound limb (SL) and lower back,6,7 and higher oxygen consumption (+56%) than their able-bodied counterparts. 8
Alterations in biomechanical gait pattern have already been observed in the SL and prosthetic limb of individuals with TF amputation,3,9–11 and between both limbs of prosthesis users compared to able-bodied participants.1,3,5,12 All of these studies analyzed discrete parameters extracted from the kinematic or kinetic gait waveforms. This approach results in a large amount of data that may be difficult to interpret. A significant barrier to the clinical use of gait information is the successful reduction and analysis of data. 13 Moreover, this traditional approach relies on the definition of discrete parameters making it difficult to extract the same values in all temporal waves, 14 and most of the gait information is not considered for analysis.
Deluzio et al. 15 introduced a novel application of principal component analysis (PCA) to the analysis of kinematic and kinetic data, and since then, PCA has become a method of reducing the amount of data and analyzing the entire waveforms in gait.16,17 Some studies calculated PCA in able-bodied subjects in order to obtain standard waveforms for comparisons with groups with pathologies such as osteoarthritis,18–20 tibial fracture, 16 and Parkinson’s disease. 21 The main aim of these cited studies16,18–21 was to determine alterations in gait pattern throughout stance phase of the gait cycle in pathological groups, in order to improve clinical evaluation of these patients.
The PCA of biomechanical gait parameters may bring new insights into the behavior of the gait of prosthesis users. In clinical environments where biomechanical gait analyses are performed, only small portions of the gait waveforms (e.g. peaks or ranges) are considered. Thus, important gait features can be overlooked. PCA by evaluating the entire waveform would increase the capacity of clinicians to identify gait deviations, and their ability to assess the influence of either treatments or prosthetic components on the gait pattern. Therefore, the main purpose of this study was to use PCA to compare the ground reaction force (GRF) and center of pressure (COP) displacement waveforms obtained during gait between able-bodied subjects and both limbs of individuals with TF amputation. We hypothesized that differences in GRF and COP waveforms among groups could be determined using PCA.
Methods
Participants
Two groups of participants were analyzed. First, for the experimental group, 74 patients with TF amputation were selected from the database of the rehabilitation center in order to verify whether they were suitable to participate in the study. The including criteria comprised having the amputation for more than 5 years, and the prosthetic device aligned and well adapted. Those people whose prosthetic knee was electronically controlled had an ankle with energy accumulation system, presenting with pain or presenting incapacity of independent walking without the use of gait aid devices were excluded. For the control (CON) group, the subjects were selected from the physical activity project for the elderly, developed in the University involved in this study. They should be physically active and, as exclusion criteria, they could not have any musculoskeletal alteration, limitation, or pain during gait.
In all, 12 persons with TF amputation, 11 males and one female (mean age ± standard deviation (SD) of 56.7 ± 11.7 years old and mean body mass of 71.4 ± 11.7 kg) were enrolled in the study. All participants had their amputation more than 9 years before (mean of years since amputation of 28.41 ± 13.40 years). The participants did not show any symptom of comorbidity or any pathology other than the amputation. The detailed description of the prosthetic components is presented in Table 1. A CON group with 20 physically active able-bodied subjects (mean age of 67 ± 8.56 years old and mean weight of 68.5 ± 6.2 kg) was also enrolled in this study. They all signed an informed consent and the study was approved by the ethics committee from the Rehabilitation Center enrolled in the study.
Subjects and components.
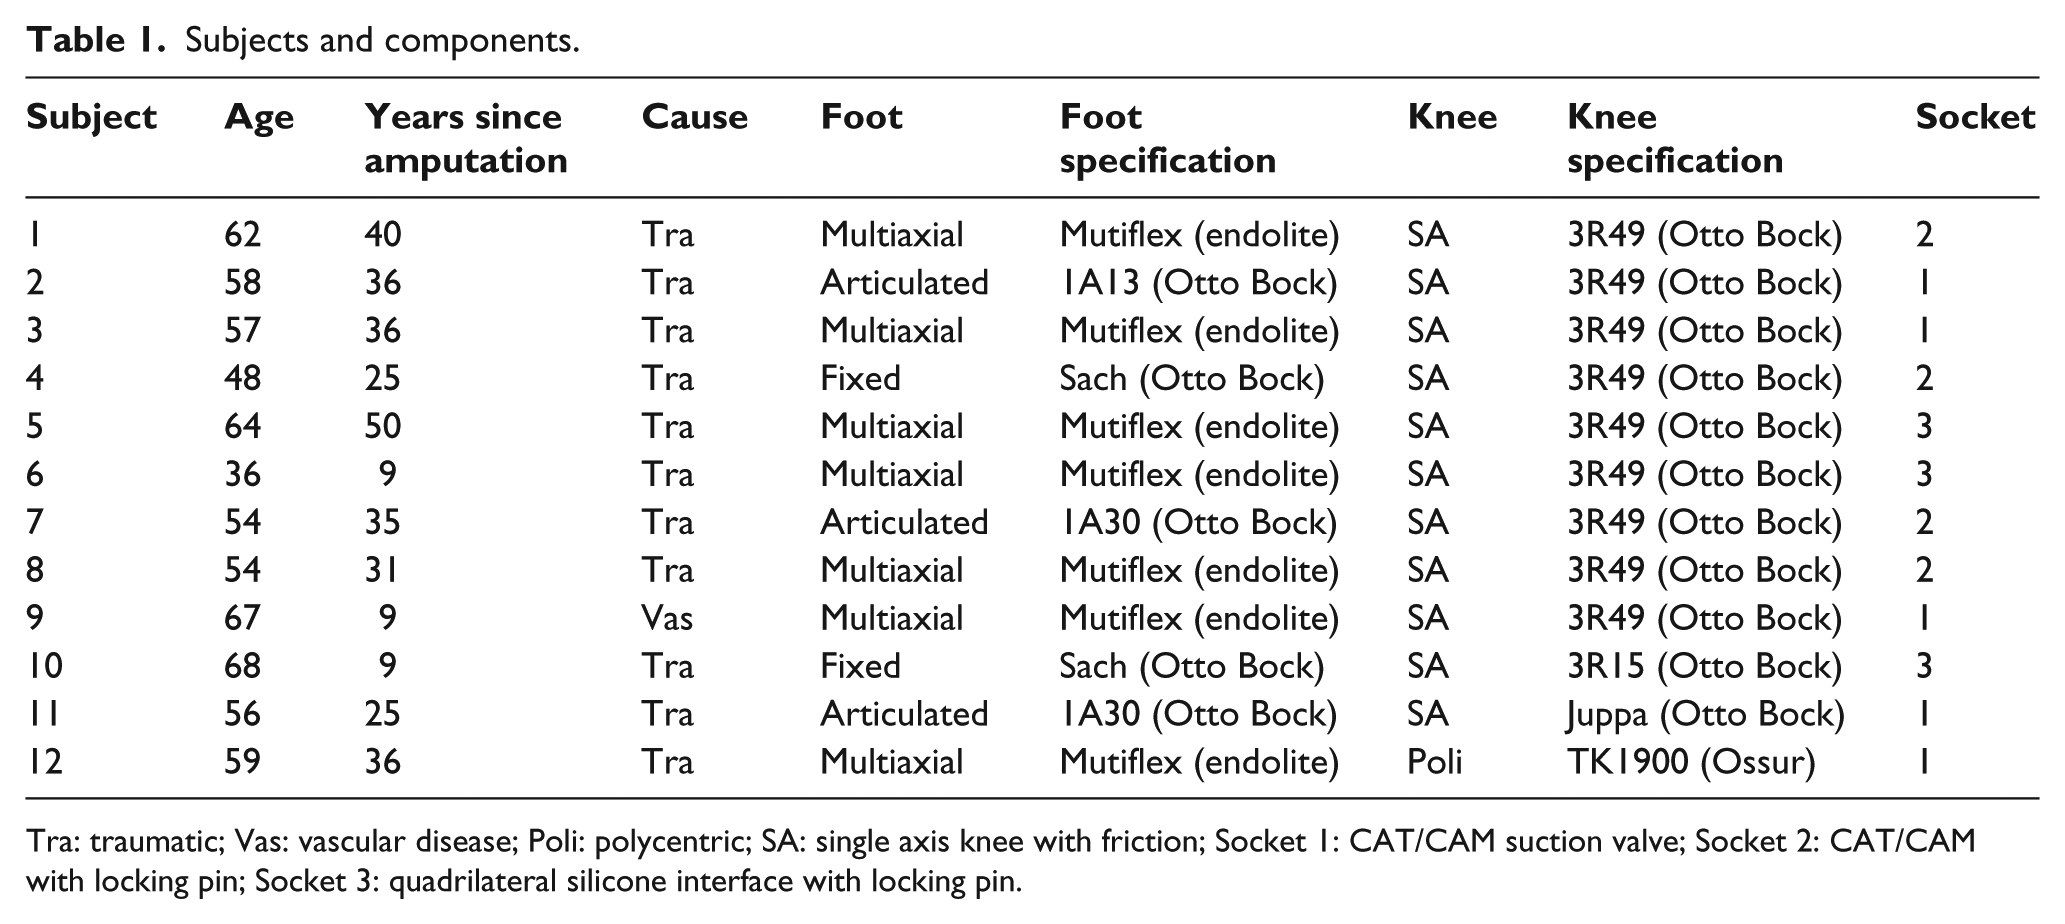
Tra: traumatic; Vas: vascular disease; Poli: polycentric; SA: single axis knee with friction; Socket 1: CAT/CAM suction valve; Socket 2: CAT/CAM with locking pin; Socket 3: quadrilateral silicone interface with locking pin.
Instruments
A piezoelectric force plate (Kistler™ Instruments AG, Winterthur, Switzerland) sampled at 1000 Hz was used to acquire the GRF. The COP trajectory was recorded at 300 Hz using a pressure plate FootScan™ (RsScan, Olen, Bélgica) with 0.5 m length, 0.4 m wide, and 4096 sensors.
Protocol
First, the questionnaire SF-3622 v.2 was applied and the physical function field was analyzed in order to obtain a measure of capacity and physical independence of the participants. Then, the participants walked at their self-selected speed on an 8 m walkway with the shoes they were currently using since for the individuals with TF amputation the change in the shoe could alter the gait pattern. Prior to the test, the participants were familiarized with the environment by walking on the walkway. The force plate was embedded in the middle (length and width) of the pathway. The pressure plate was placed on the top of the force plate. The right and left corners from both plates were aligned, and the pressure plate was about 2 cm smaller than the force plate in length. The right corner was then set as the origin of the system. The pathway was covered with mats to avoid unevenness in the walking level. During data collection, the participants performed three steps before and three steps after reaching the force plate. A variable number of trials were performed to record three valid ones with the AL and three with the SL, while three valid trials with the right leg were acquired for the subjects in the CON.
Data processing
The GRF data were acquired in the software SIMI™ 7.0 (Simi Reality Motion Systems, Unterschleissheim, GmbH, Germany), and the COP data by the software FootScan™ 7 gait second generation (RsScan, Olen, Belgium). The data processing, filtering, and PCA analysis were performed using MATLAB™ 7.0 (MathWorks, Natick, MA, USA). As the data were analyzed independently, the start of both systems was synchronized using a trigger that started them simultaneously, to ensure that the same step was being recorded.
To reduce the effect of random noise, the data were filtered using a Butterworth filter with cutoff frequency of 10 Hz, both in fourth order. 23 The signals were interpolated and resampled in order to obtain 100 points, providing one point for each percent of the stance phase.
PCA
PCA was performed based on a previous study 15 and is described in detail by Soares et al. 17 (Figure 1). In summary, the aim of PCA is to summarize the information contained in 100% of the stance phase—which is represented by 100 variables—in a smaller number of components that explain the greater variance through linear combinations from those variables, by considering each 1% in time axis as one variable (100 variables—matrix X and A below), and to represent the full waveform by a smaller number of components (PC model—matrix Z). 24 Principal components (PCs) are arranged in decreasing order in such a way that the first PC accounts for most of the variability in the data, and each succeeding component accounts for as much of the remaining variability as possible. 25 In this study, the number of PCs retained for analysis (from matrix Z) was based on the criteria established in a previous study, considering the fact that most of the variance is explained by the first PCs and to avoid confusion by having a different number of PCs for each data variable and was always three. 15
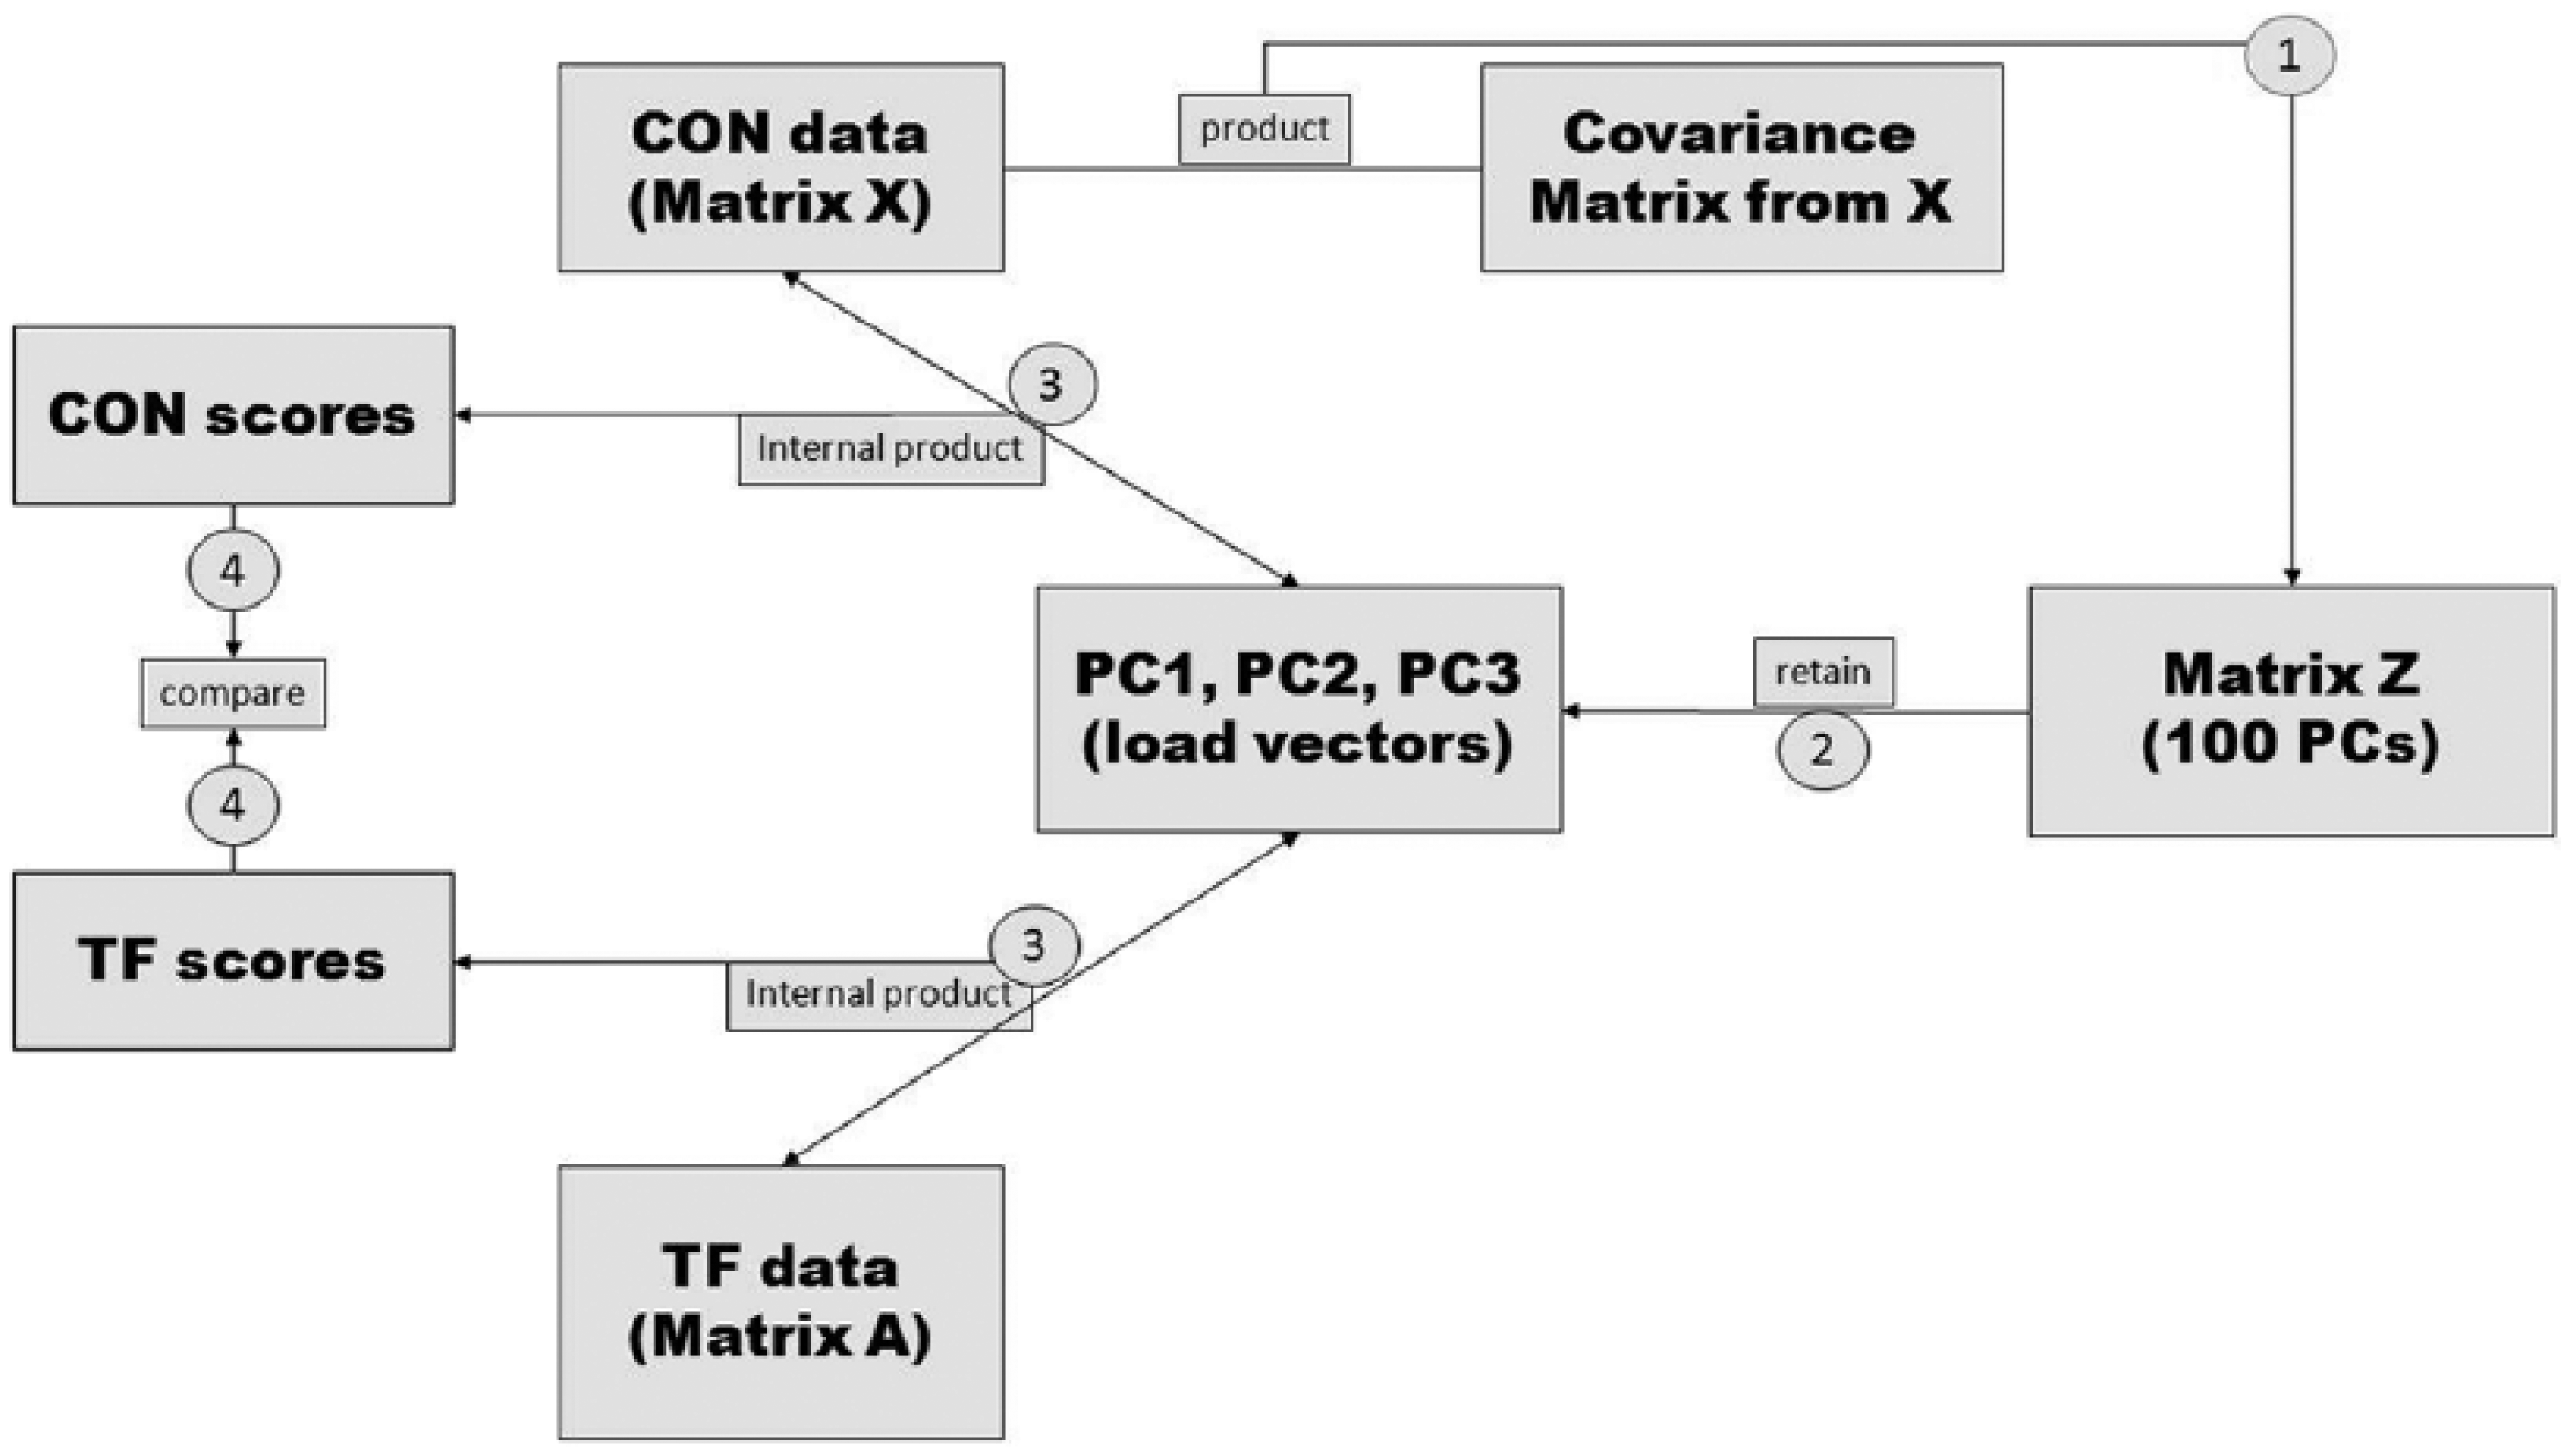
Diagram explaining the procedures to obtain the scores for the control (CON) group and the experimental group (TF). First phase: product from CON dataset and the covariance matrix of CON data; second phase: retain three PCs from matrix Z; third phase: internal product from retained PCs and the data from CON and the experimental groups (AL and SL from TF); fourth phase: statistical compare among scores.
PC model calculation: PCs are an orthogonal transformation which converts p variables X = x1, x2, x3, … xp (in this case from 0% to 100% stance phase) into p new uncorrelated PCs Z = z1, z2, z3, … z, which are defined by the equation Z = UtX, where U are the eigenvectors of the covariance matrix of X. Un is calculated by the equation SUn = λUn where λ are the p eigenvalues ranked in decreasing order and S is the covariance matrix of X. PC score values (sn) are obtained applying the equation zn = ZA where A is the matrix (100 variables) containing the data from the conditions where the model is expected to be applied. This procedure generates a matrix of data where each waveform (each subject in each condition) is represented by a number (score).
In this study, the PC model (matrix Z) was developed based on the gait pattern of the CON group (matrix X). This model was afterwards applied to the individuals with TF amputation (matrix A), in the mean waveform of the three valid trials of each participant, and then the PC score values (internal product from PC1, PC2, and PC3 to each waveform) for each subject were retained for analysis. The waveforms of five dependent variables were analyzed: vertical GRF (GRFvt), medial–lateral GRF (GRFml), anterior–posterior GRF (GRFap), medial–lateral COP (COPx), and anterior–posterior COP (COPy) each with its own set of three PCs, totaling 15 PC score values to analyze per subject.
In the last phase, the loading vectors (PC1, PC2, and PC3 data) were normalized between −1 and 1 according to Jones et al. 26 After the normalization, a threshold of |0.71| was adopted to consider a load vector from one variable as relevant, 27 which means that a variable only with values above this loading have a biomechanical interpretation in that portion of the curve. 27
Statistical procedures
We used the intra-class correlation coefficient (ICC) to assess the between-trial reliability. The mean score of the three valid trials of each participant was computed and the statistical procedures were performed with these mean values. The normality of the data was verified using the Shapiro–Wilk’s test and the homogeneity of the variances using Levene’s test. The PC scores of the five dependent variables analyzed (GRFv, GRFml, GRFap, COPx, and COPy) were compared between the CON and the SL, and between the CON and the prosthetic limb of the participants with TF amputation using an independent student t-tests. The level of significance used was α = 0.05.
Results
As a measure of the capacity and physical independence of the subjects, the questionnaire SF-3622 v.2 was applied and the field physical function was analyzed. The values of 62.8 ± 24.9 for the experimental group and 82.3 ± 18.0 for the CON were found. Even with the CON presenting higher values, this data indicate that both groups can be considered physically active.
The data showed good to excellent between-trial reliability (for the GRF (ICC > 0.9) and COP parameters (ICC > 0.8). In all dependent variables, at least one PC was considered as relevant (load vector ⩾ 0.71), and the three selected PCs explained between 74.5% and 93.9% of the variance. In the results, the PC data will be presented only if the PC load vector was relevant and if this PC load vector was significantly different among the groups.
All PCs extracted from the GRFvt were relevant at any part of the stance phase (gray areas in Figure 2(a)). The PC1 was relevant between 20%–30% and 80%–95% of the stance phase (Figure 2(b)), and its scores were significantly different between the CON and the prosthetic limb. The analysis of the curves suggests higher magnitudes of GRFvt in the CON compared to the prosthetic limb (Figure 2(b)). PC2 was relevant from 35% to 75% (Figure 2(c)), and PC3 from 7% to 12% (Figure 2(d)) of the stance phase. Both PC2 and PC3 showed the CON significantly different than the prosthetic and SLs of the participants with TF amputation (Table 2). These PCs suggest that in their relevant portions the SL showed higher values, whereas the prosthetic limb showed lower magnitudes of GRFvt than those found in the CON (Figure 2(c) and (d)).
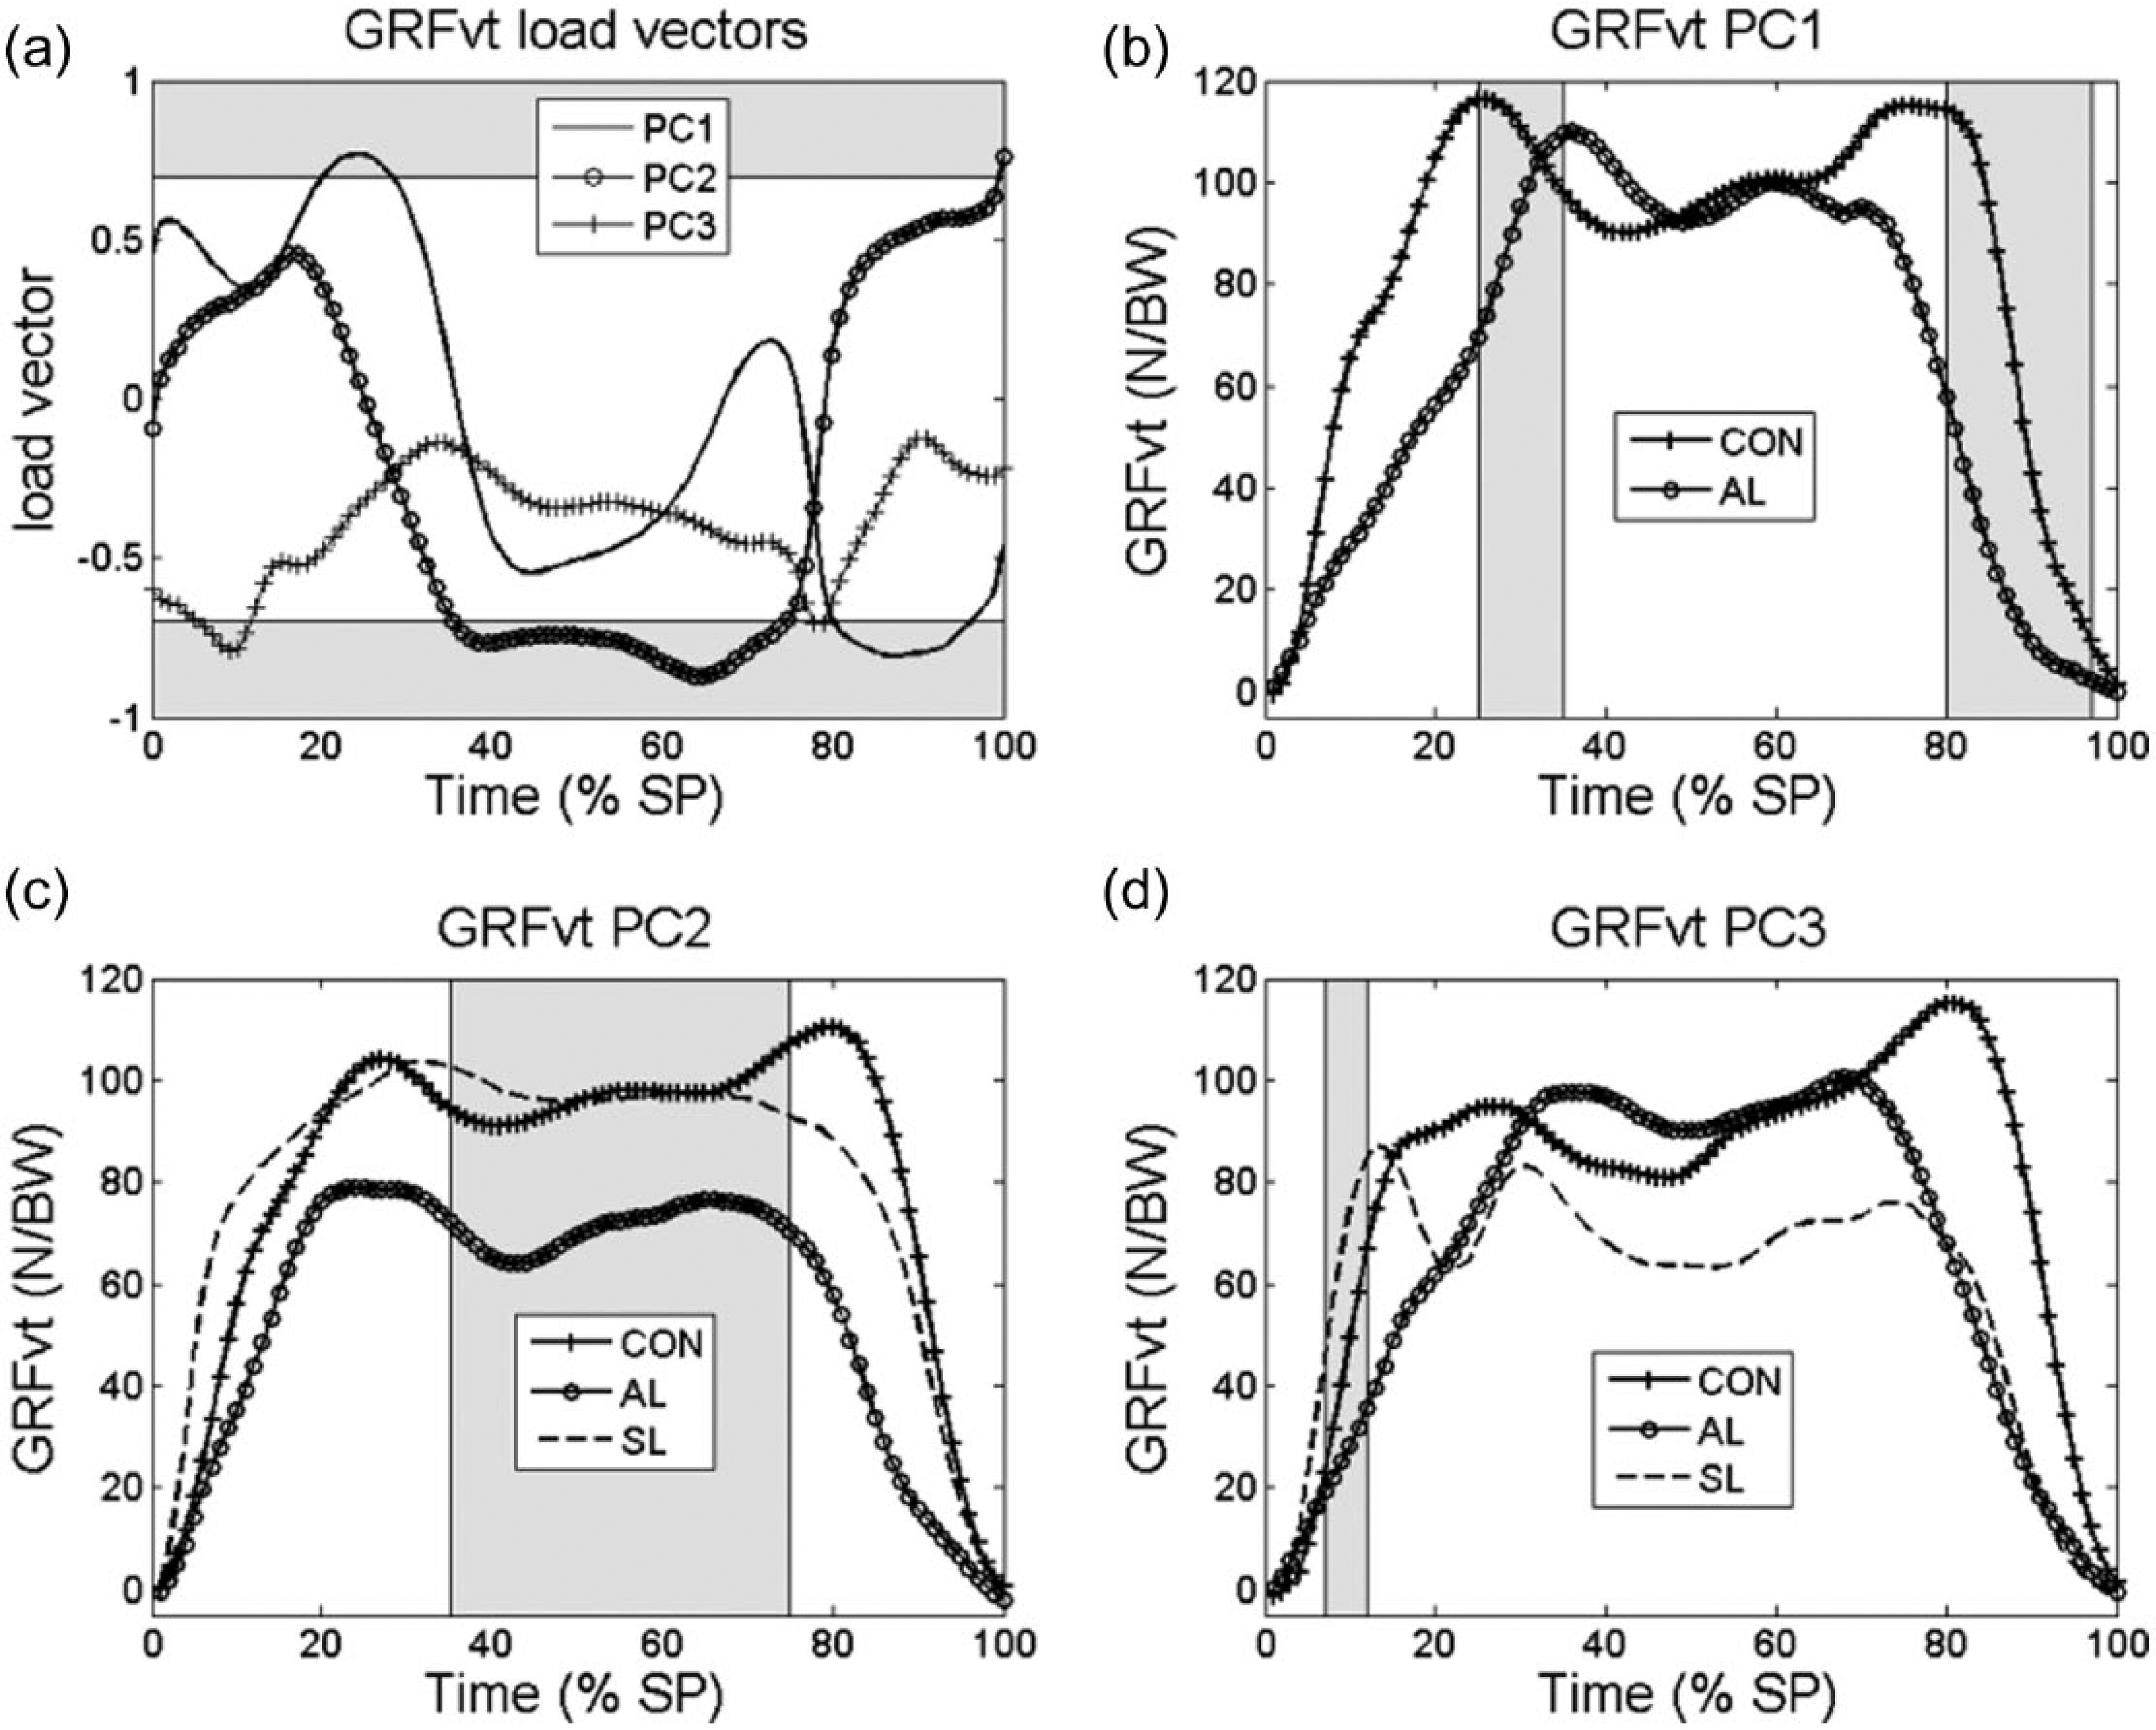
(a) Load vectors of the principal components PC1, PC2, and PC3 of the vertical ground reaction force (GRFvt); (b–d) PC1 highest scores observed in one participant from the control (CON) group and lowest scores of the participant from the amputated limb (AL) group obtained from the confidence interval of 95% generated with the scores of all participants; The PC data are presented only if the PC load vector was relevant and if this PC load vector is statistically significantly different at least from one of the groups. The gray area represents relevant portions of the stance phase (load vector ⩽ 0.71). The same procedure is used in the next figures.
PC1, PC2, and PC3 scores a obtained in CON, AL, and SL (mean ± SD).
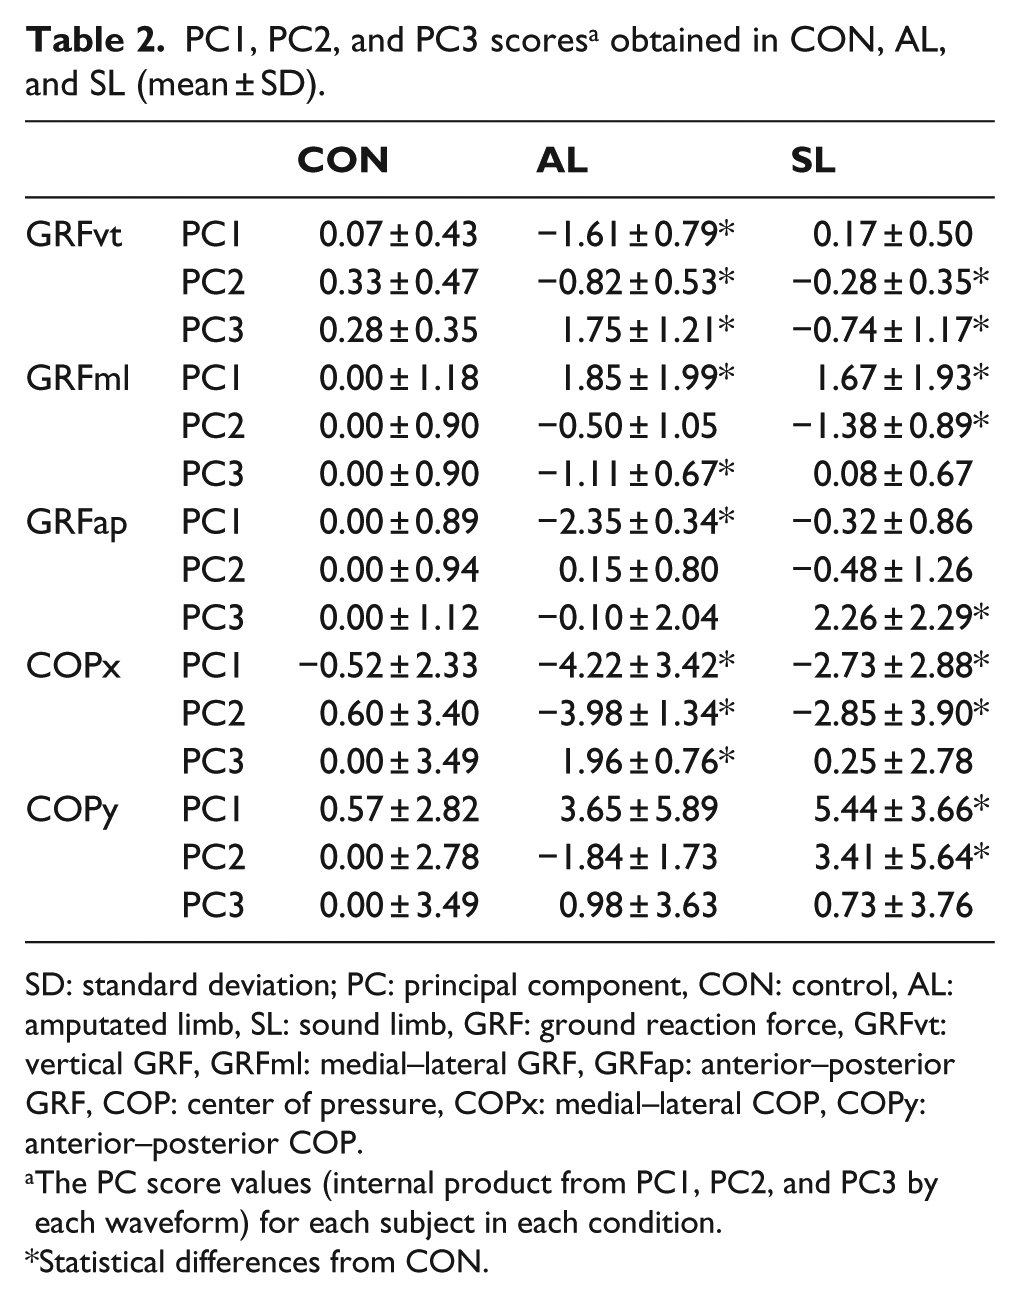
SD: standard deviation; PC: principal component, CON: control, AL: amputated limb, SL: sound limb, GRF: ground reaction force, GRFvt: vertical GRF, GRFml: medial–lateral GRF, GRFap: anterior–posterior GRF, COP: center of pressure, COPx: medial–lateral COP, COPy: anterior–posterior COP.
The PC score values (internal product from PC1, PC2, and PC3 by each waveform) for each subject in each condition.
Statistical differences from CON.
Regarding the GRFml waveforms, the PC1 was found to be relevant between 30% and 55% of the stance phase (Figure 3(a)). In this portion, both limbs of the people with TF amputation were significantly higher than the CON (Table 2; Figure 3(b)). The PC2 was relevant only in between 12% and 16% of the stance phase; in this phase, lower GRFml values were found in the SL of the participants with amputation compared to the CON. The PC3 was relevant only from 2% to 8% of the stance phase, in which the CON showed significantly higher values that those found in the prosthetic limb group (Figure 3(d)).
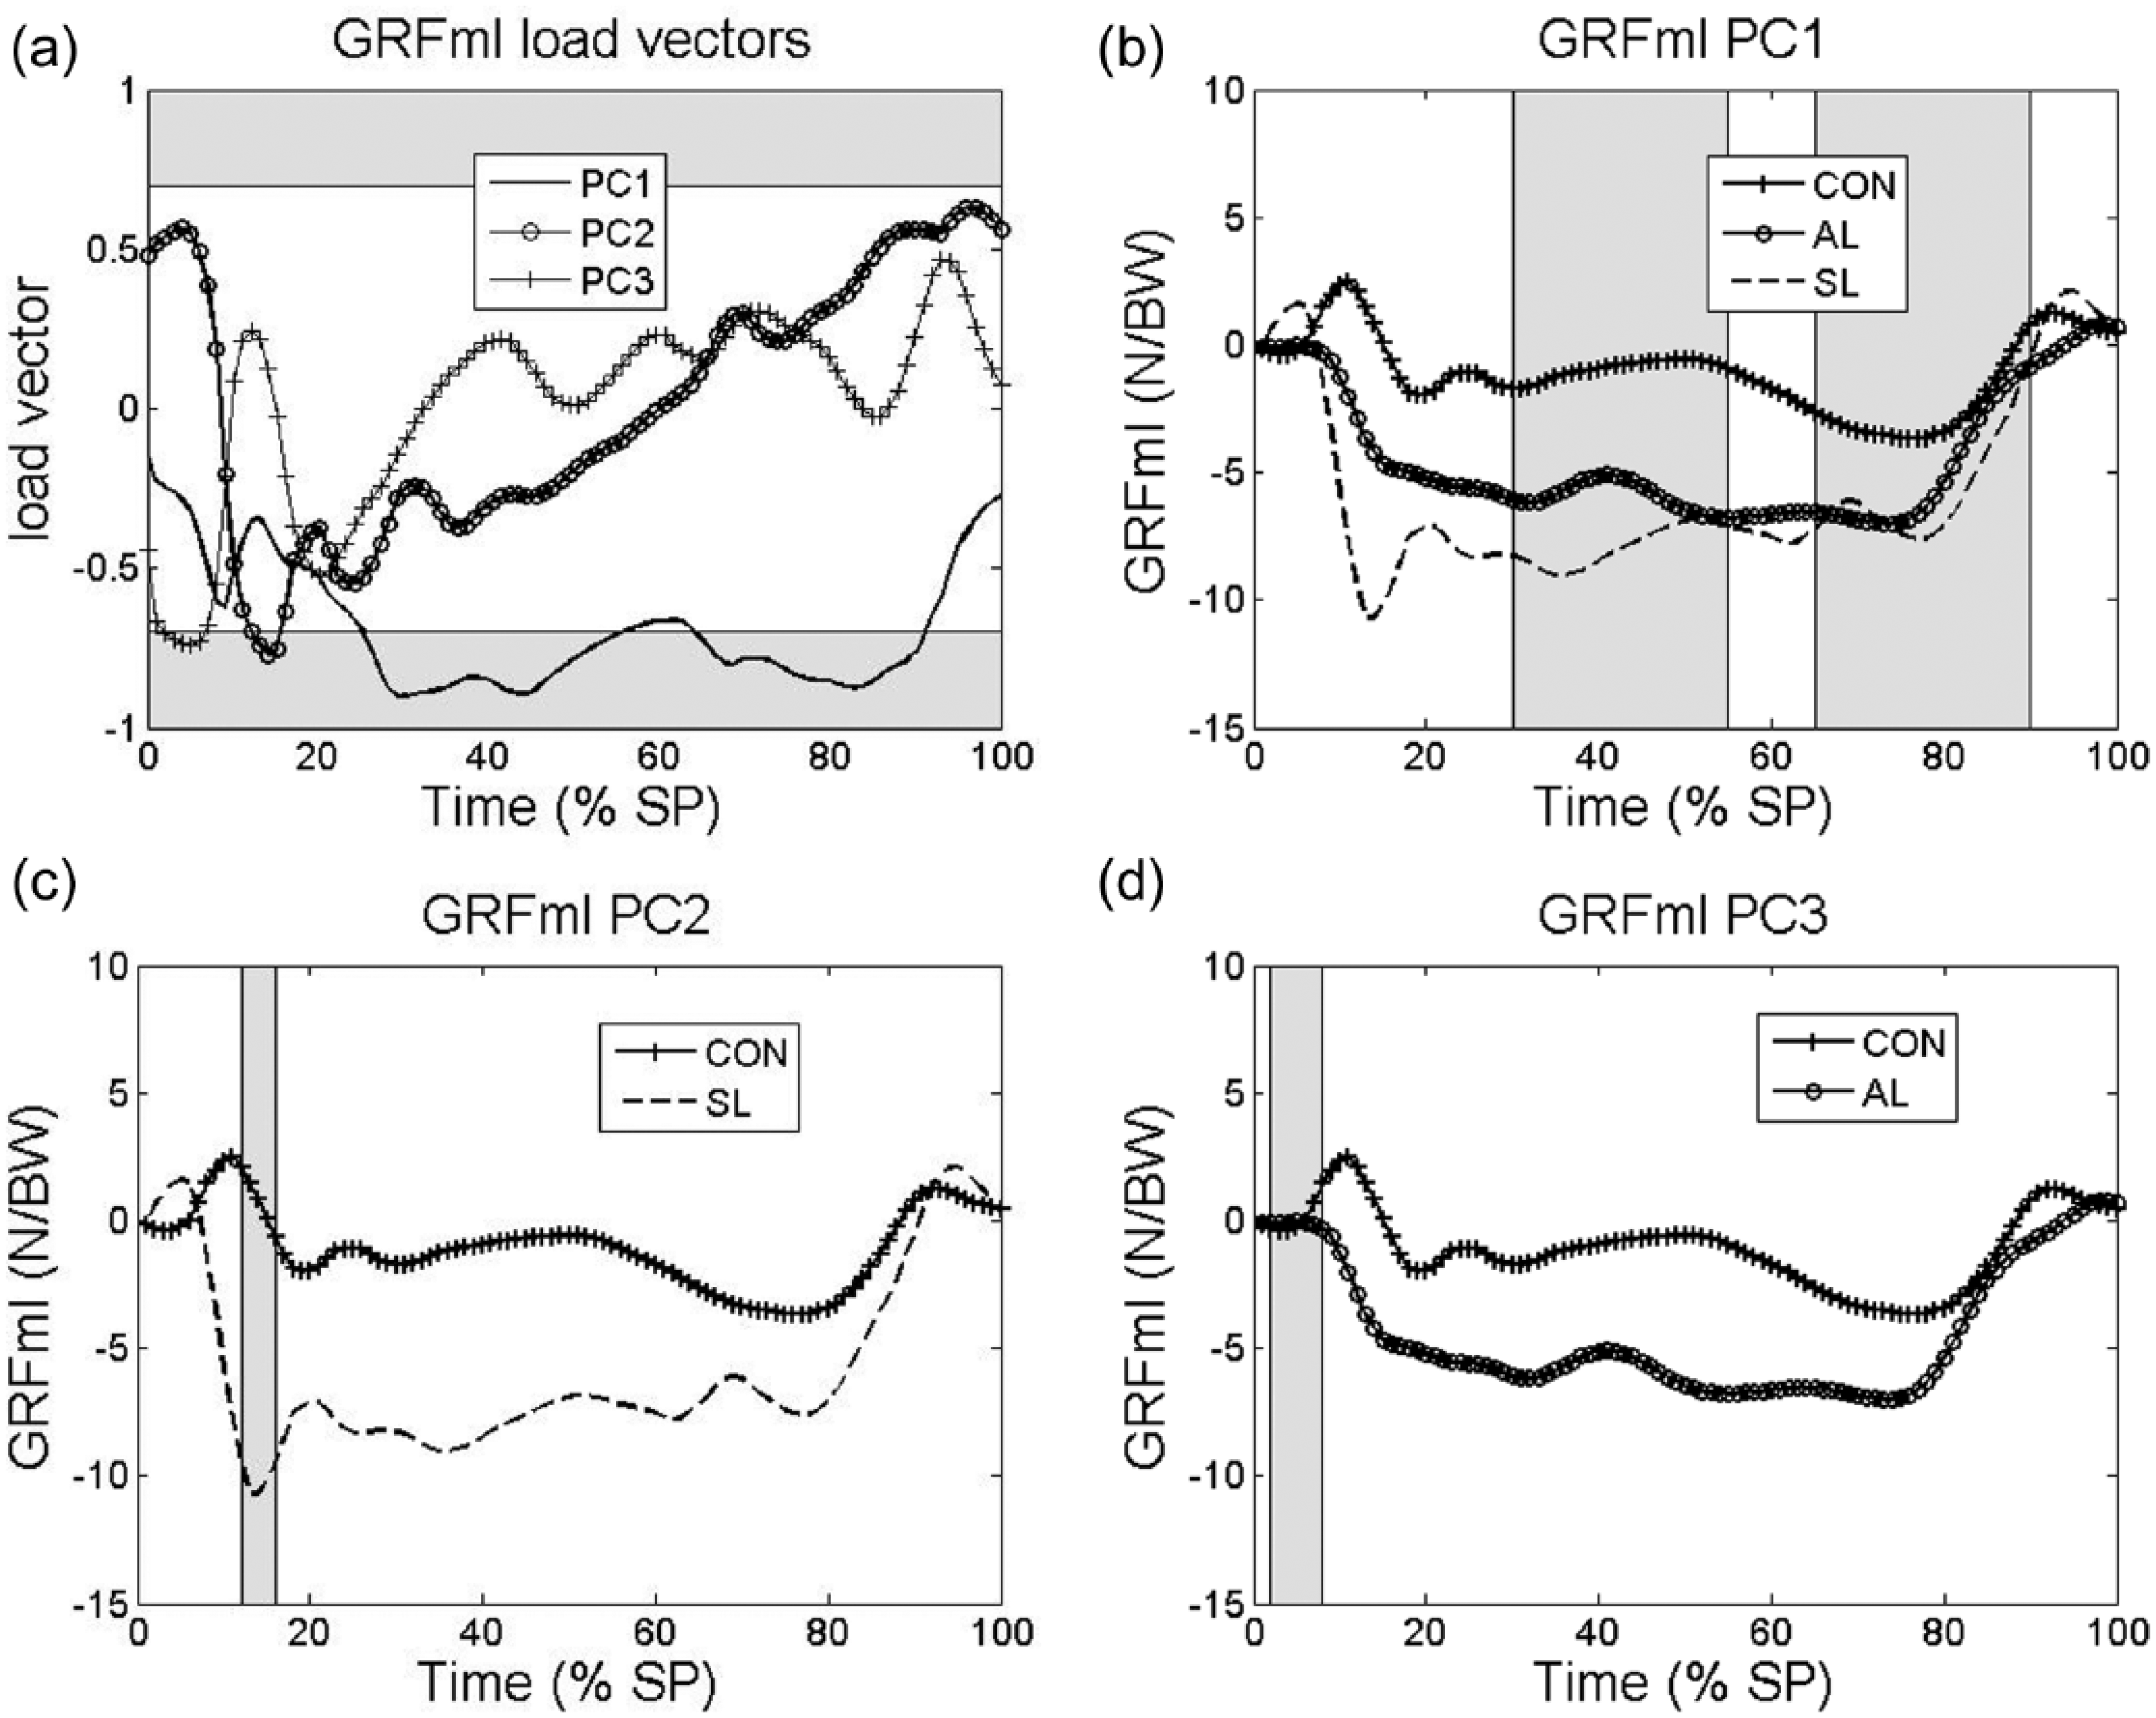
(a) Load vectors of the principal components PC1, PC2, and PC3 to the medial–lateral ground reaction force (GRFml) and (b,c,d) highest score from one participant from the control (CON) group and lowest scores from the participnt from the amputated limb (AL) and sound limb (SL) in PC1, PC2, and PC3, respectively.
The PC1 of the GRFap was relevant in two different portions of the stance phase (15%–30% and 60%–98% in Figure 4(a)). In both phases, lower GRFap were observed in the prosthetic limb compared to able-bodied participants (Table 2; Figure 4(b)) The PC2 was relevant from 5% to 15% of the stance phase and it showed differences between the CON and SL groups. While the PC3 was found to be relevant only in a small portion (2%–4% of the stance phase), it did not indicate a difference between the groups. Lower magnitudes of braking and propulsive GRFap were shown in the prosthetic limb of the individuals with TF amputation compared to the able-bodied subjects from the CON (Figure 4(b)). In the relevant portion of the PC3, the SL group showed higher GRFap values than the CON (Figure 4(c)).
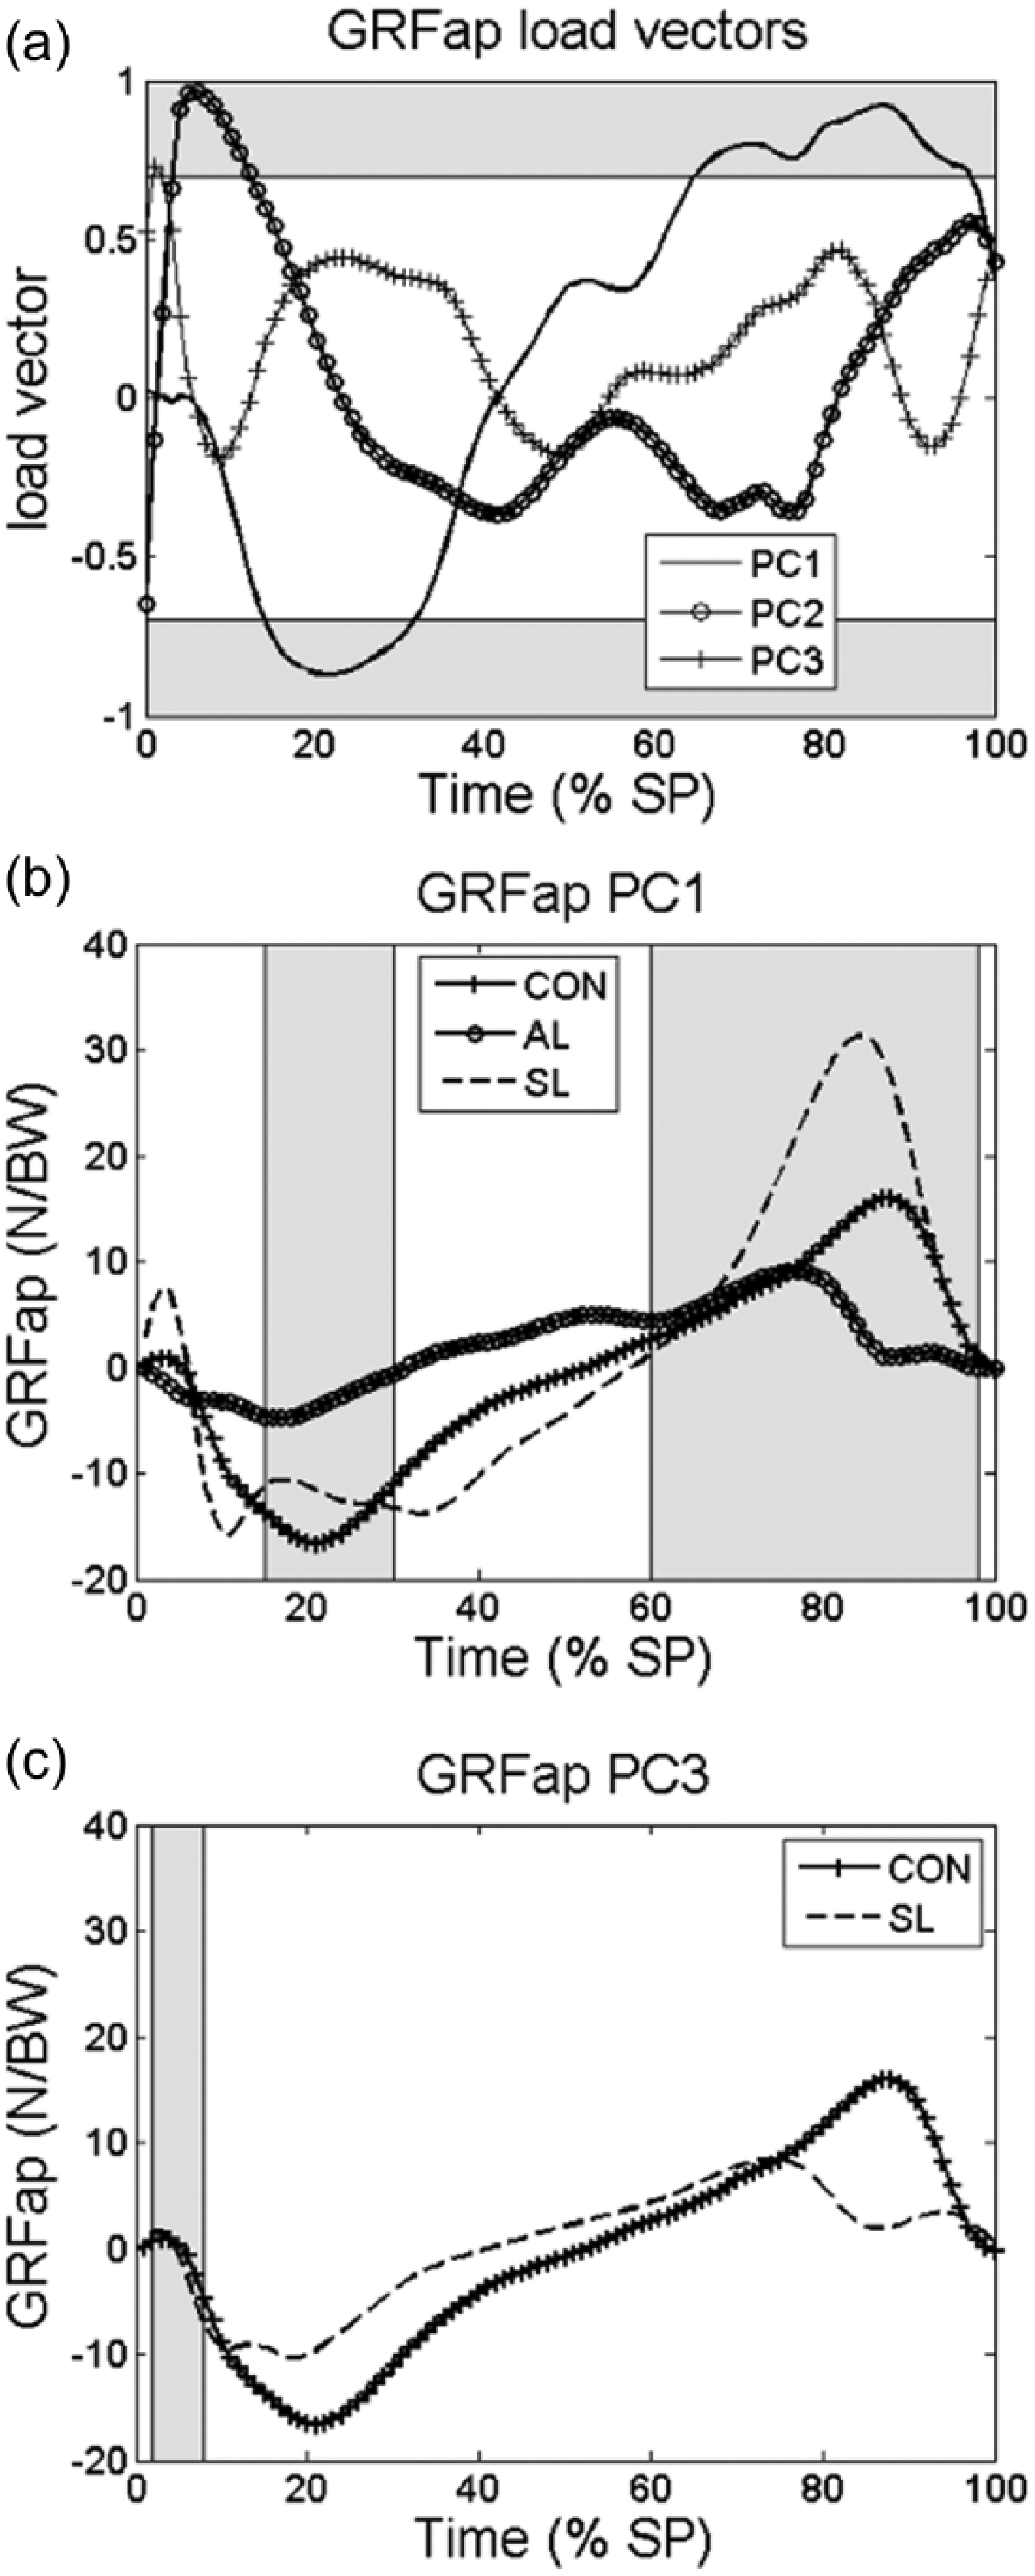
(a) Load vectors of the principal components PC1, PC2, and PC3 to the anterior–posterior ground reaction force (GRFap) and (b) highest score from one participant from the control (CON) group and lowest score from the participant from the amputated limb (AL) and sound limb (SL) groups in PC1 (b) and PC3 (c).
The PC1 of the COPx was relevant from 30% to 70% of the stance phase (Figure 5). In this region, statistical differences between the CON and both limbs of the individuals with TF amputation were found (Table 2), and suggest that the COP of the able-bodied participants is in a more lateralized position than those observed in the participants with amputation (Figure 5(b)). The PC2 and PC3 were relevant only in a small portion of the beginning of the stance phase (Figure 5(a)). In PC2, both limbs of the individuals with TF amputation showed lower scores than the able-bodied participants (Figure 5(c)), whereas for the PC3 only the prosthetic limb group was different than the CON in the relevant portion (Figure 5(d)).
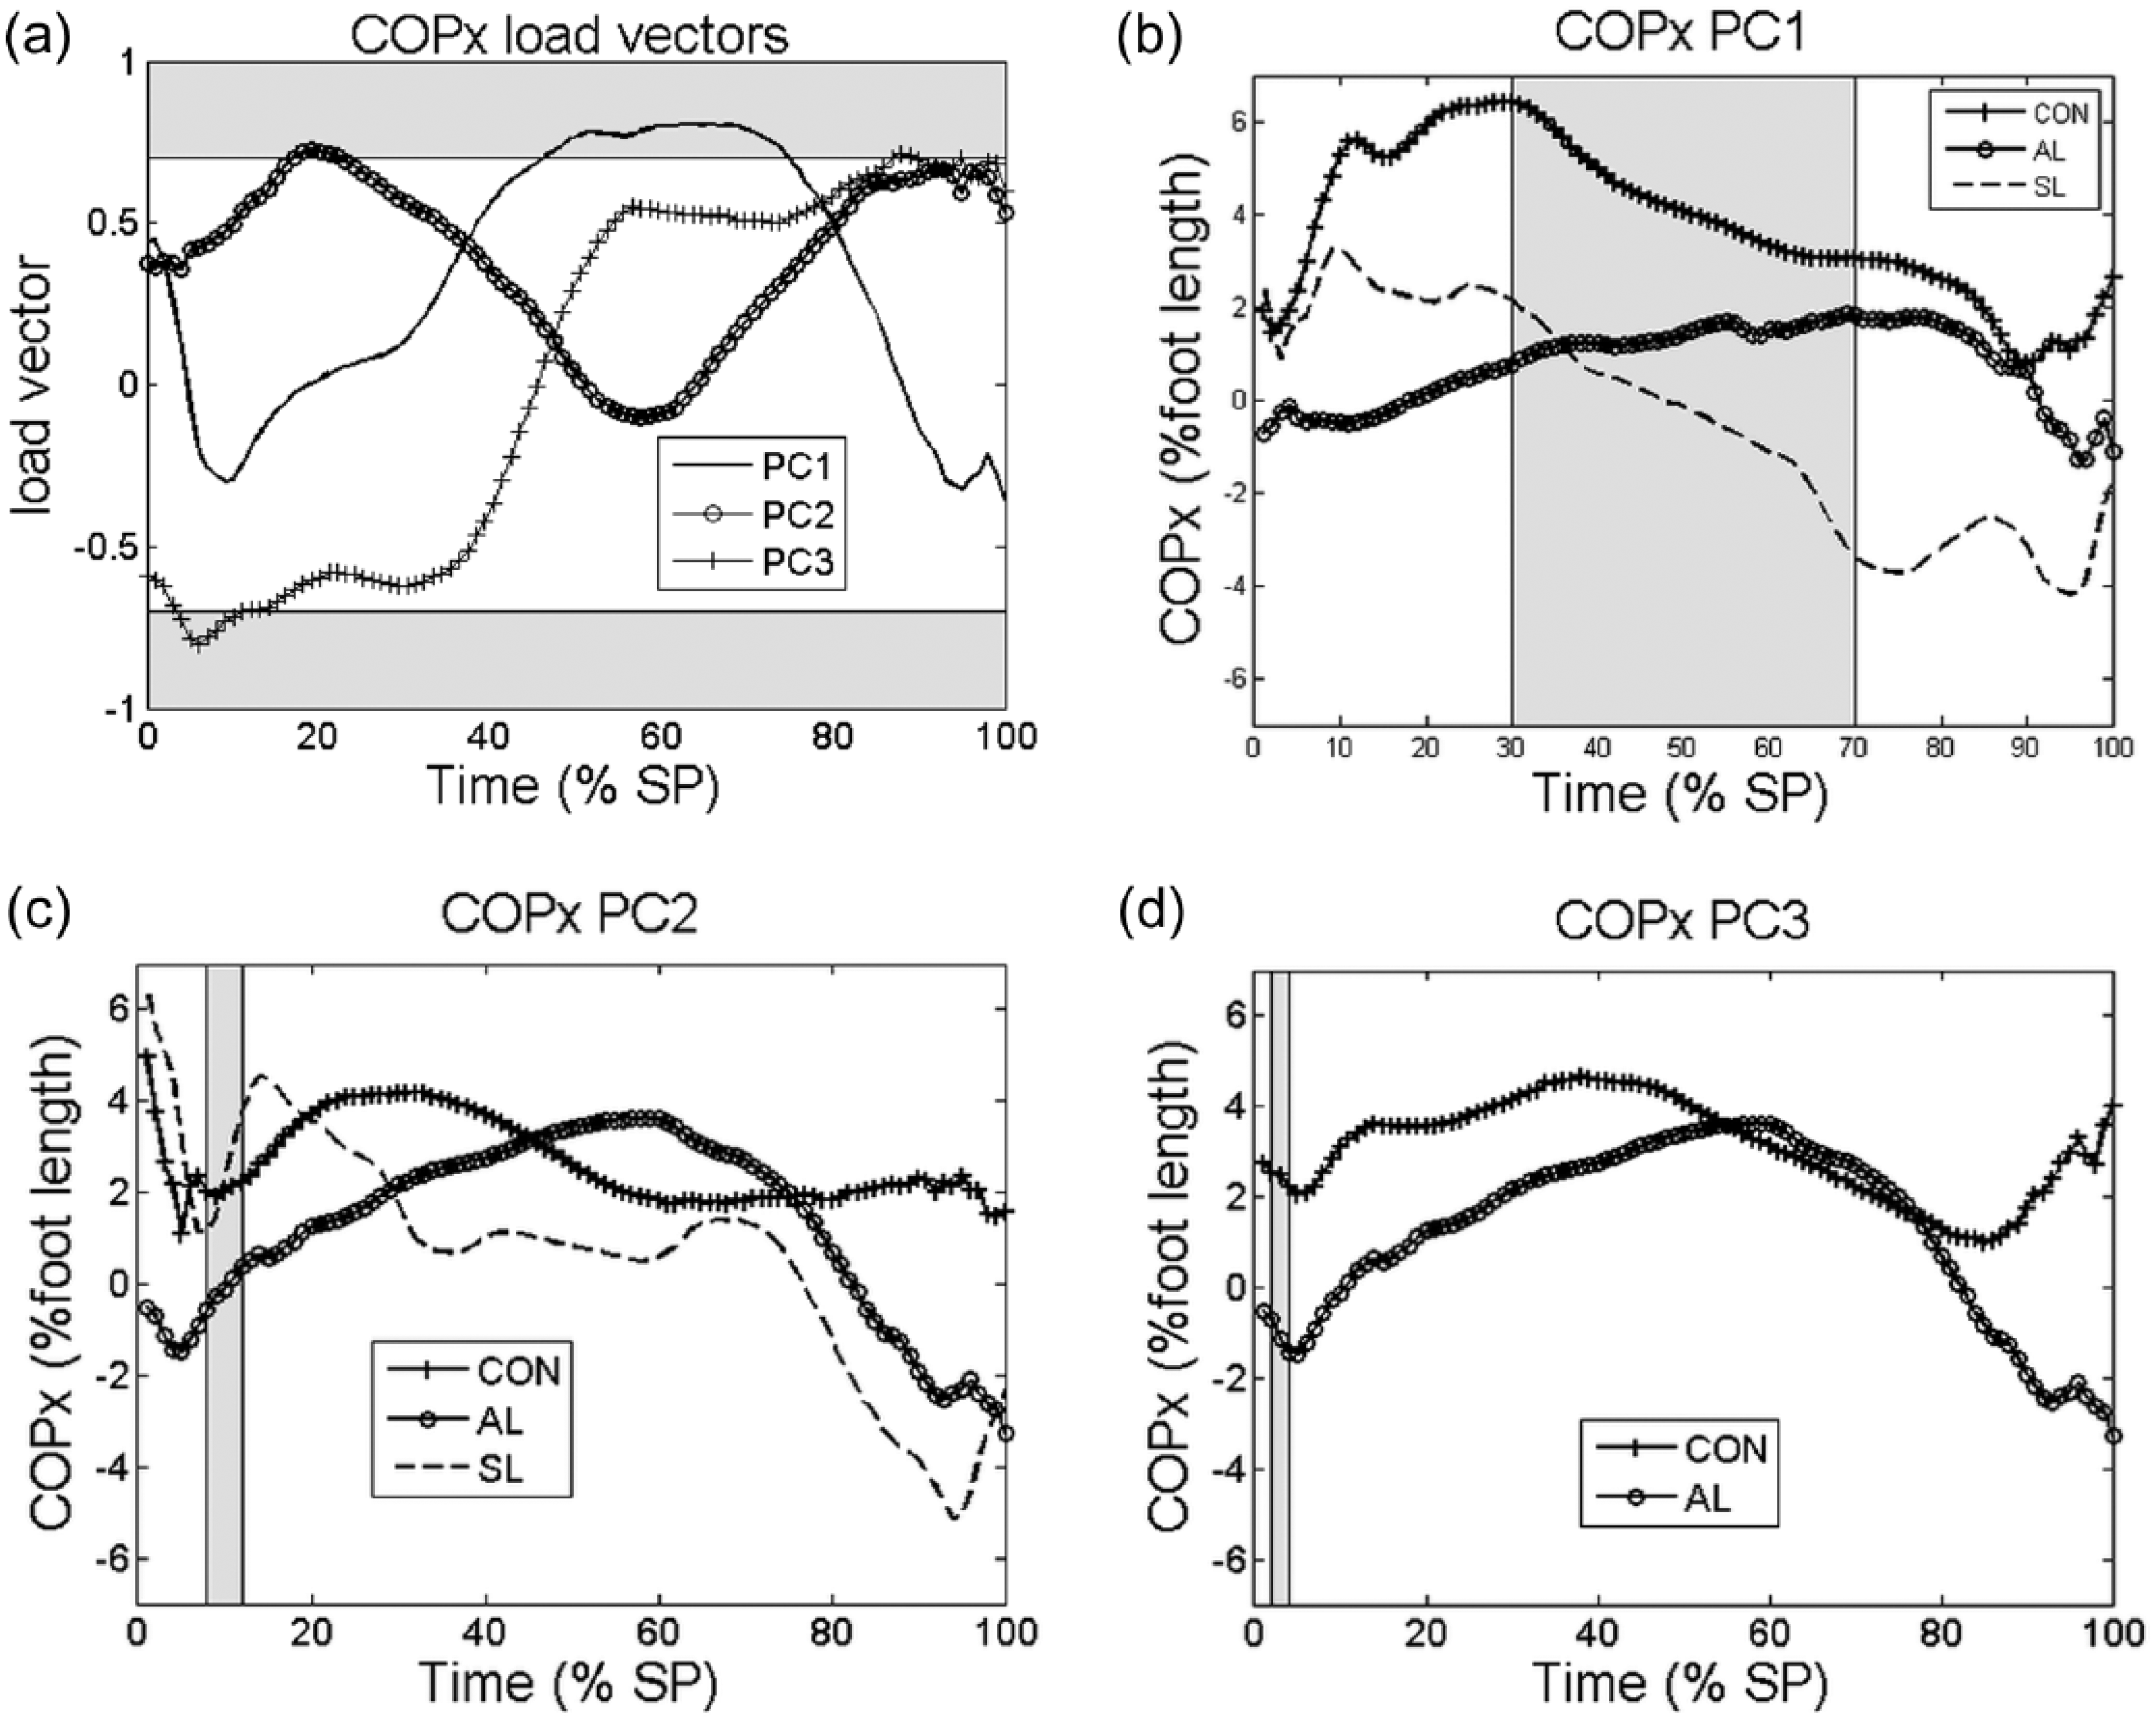
(a) Load vectors of the principal components PC1, PC2, and PC3 to medial–lateral center of pressure (COPx) displacement, highest and lowest score for CON, SL and AL in PC1, PC2, and PC3, respectively (b,c,d). The gray area indicates the threshold area of 0.71. Positive values in Figure 4(b) are lateral displacement in relation to the gait projection line, placed in the middle of the foot.
The three PCs explained 93.99% of the variance of the COPy waveforms. Only the PC1 was observed to be relevant in some portion of the stance phase between 25% and 92% (Figure 6(a)). The SL group showed an altered position of the COPy compared to the CON (Figure 6(b)), in which the anterior displacement of the COP occurred earlier and longer than those found in the CON.
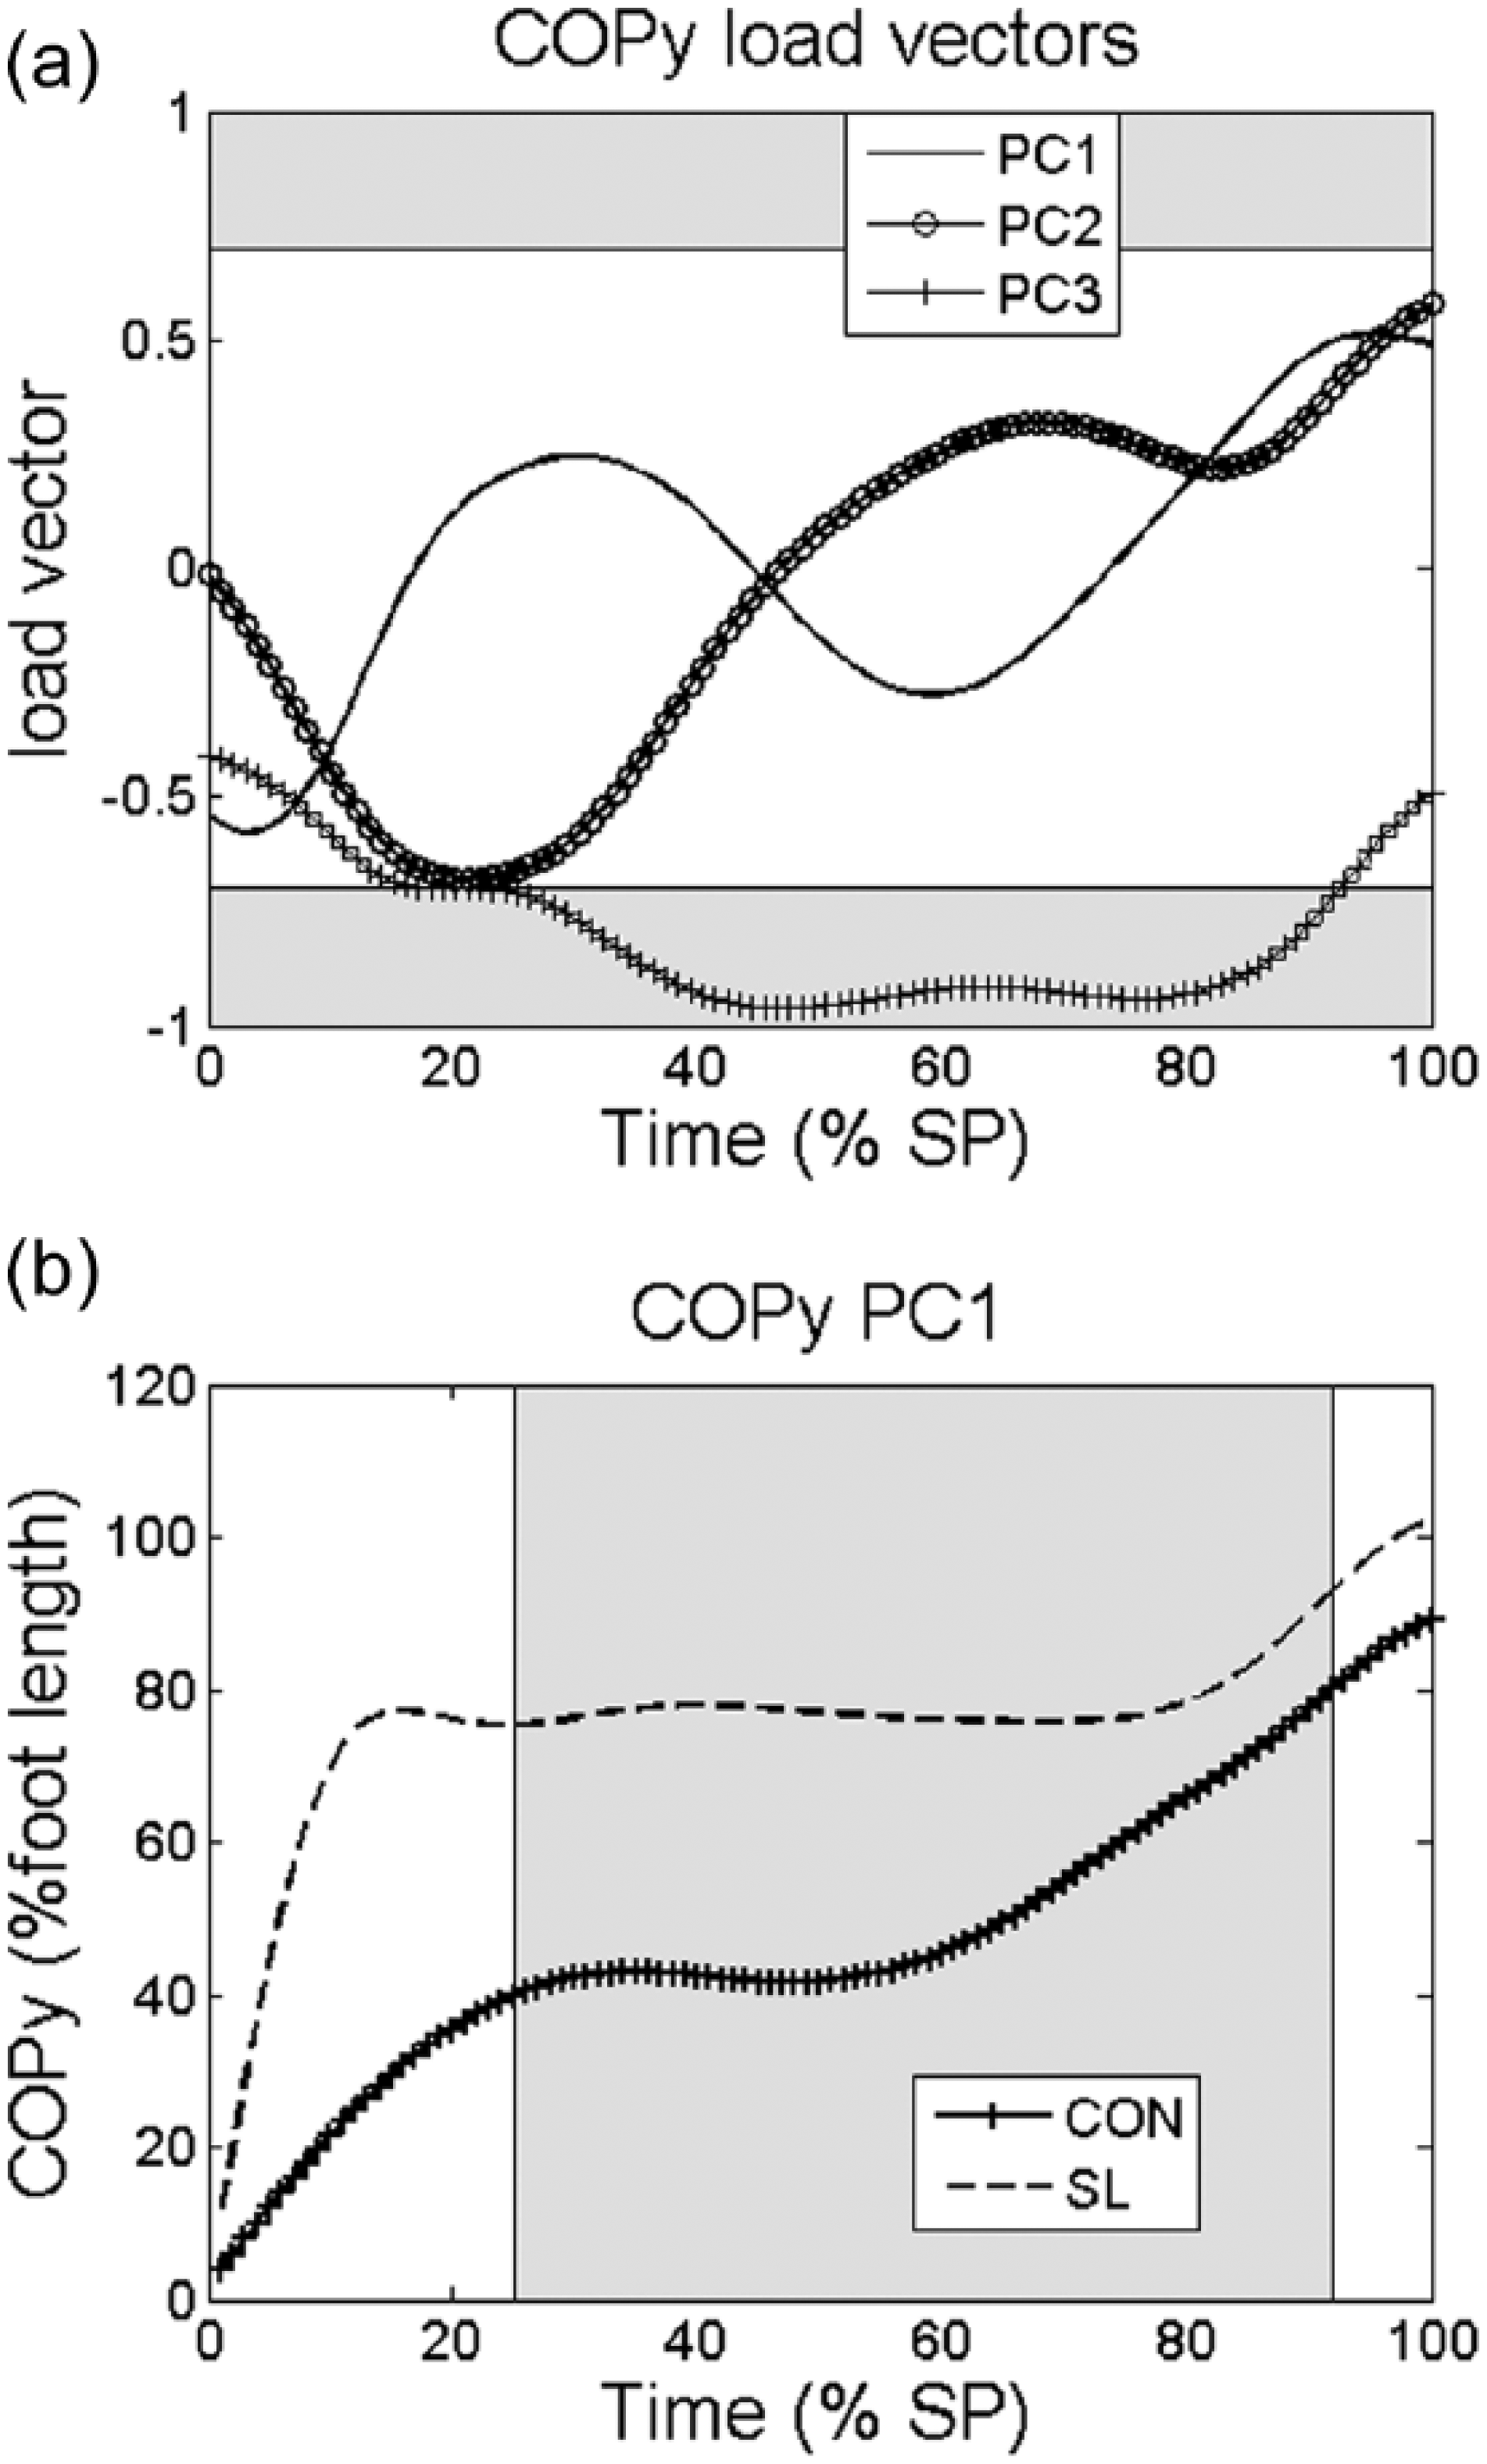
(a) Load vectors of the principal components PC1, PC2, and PC3 to the anterior–posterior center of pressure (COPy) displacement and (b) highest score from one participant of the control (CON) group and lowest score from one participant of the sound limb group (SL).
Discussion
In this study, we compared the GRF and COP parameters between able-bodied participants and the sound and prosthetic limbs from persons with TF amputation using PCA. Our hypothesis was supported as differences in all GRF and COP gait waveforms between groups were determined using PCA. It is interesting to notice that many of the differences observed in this study occurred out of the portions commonly assessed by traditional approaches (e.g. peaks). Previous research suggested that PCA is advantageous as it takes into account the entire gait waveform. 19 The results of this study reinforce the relevance of this advantage to assess gait data from prosthesis users. In addition, the present approach using only three PCs was able to explain between 74.5% and 93.9% of the data variance. It corroborates previous studies and suggests that the PCA is powerful to reduce the number of variables necessary to represent the whole gait waveform.17,19
The first three PCs suggest that the GRFvt curve of the prosthetic limb was different from those observed in the able-bodied participants (Table 2). At the beginning of the single support (PC1), the GRFvt in the prosthetic limb was lower than the CON. A slower load acceptance rate can be clearly observed and, consequently the first peak of the GRFvt happened later in stance. Moreover, along the stance phase, the prosthetic limb waveform presented reduced values compared to the CON (GRFvt PC2). This could be explained since the individuals with TF amputation might be trying to protect his/her residual limb by loading it less and consequently loading the intact limb more. This might be one of the factors contributing to low bone mineral density in the amputated prosthetic limb, as a consequence of unloading the bone. 28 At the end of the stance phase (80%–100%), the smaller values of GRFvt (indicated by PC1) may be related to the anticipated support of the SL on the ground, and also due to the lower capacity of propulsion as a consequence of the lack of the plantar flexor muscles. 29 In the GRFml, the smaller values during late midstance (GRFml PC1, and also evidenced in COPx PC1) were due to the lack of muscular and proprioceptive control in contacting the ground, making the contralateral limb perform the swing phase faster to anticipate its ground contact. In the prosthetic limb, the regions covering the braking and propulsive GRFap peaks were smaller than in the able-bodied participants (Figure 4(b)). This was also found in other studies, and may be explained by the lack of energy absorption and energy storage properties of the prosthetic device.30,31 In relation to the COPy, the pattern is very similar in both groups. These findings were also presented in previous studies which demonstrated the COP waveforms from all the subjects and the behavior from both groups as similar.3,32
The SL showed higher scores during heel contact and single support for GRFvt than the CON. The heel contact starts earlier in the SL due to the lack of control of the prosthetic limb. 30 Furthermore, the higher magnitude of GRFvt in SL compared to CON values, during the single support (40% of the whole stance phase) point to an overload of the SL. It could help to explain the high levels of hip osteoarthritis previously described for the SL. 33 GRFml scores were higher during the beginning of single support, late midstance, and heel rise (PC1 and PC2 in Figure 2(b) and (c)). The lack of control of the prosthetic limbs during the swing phase makes forward progression of the limb more difficult. As a consequence, a hip hiking of the prosthetic limb may occur to lift laterally and progress; consequently the medial–lateral support of SL becomes more lateral. 34 According to Van Ingen Schenau, 35 the magnitude of the knee moment is directly related to the line of action of the GRF and its point of application. If COPx (point of application of the GRF) is shifted laterally, the knee moment is going to increase. This could be related to the overload in the medial compartment of the knee found in the individuals with TF amputation, 36 and with the high levels of knee osteoarthritis. 6 The GRFap scores were higher in the initial contact due to the need of SL in contacting the ground precociously in order to balance the support of AL. The COP displacement in the SL was also different than the CON. The pattern of COPy suggests that the foot is in total contact with the ground just before 20% of the stance phase (Figure 6(a)). These findings are in agreement with previous studies that found that the mean anterior–posterior velocity of the COP in the SL, from the heel to the area of metatarsal heads, was higher but the mean velocity in the forefoot region was smaller than CON. 32 This might have occurred due to the necessity for increasing knee and ankle flexion angles3,37 and because of the need of increasing the stance phase duration to compensate the alterations suffered by the absence of the physiological contralateral limb. The medial–lateral displacement (COPx) was higher in the SL possibly because of the features of the swing phase of the prosthetic limb, which is characterized by the progress with the knee extended, leading to a hip hiking from the SL to move the prosthesis forward. 34
Overall, we observed that the PCA approach used in this study allowed identifying alteration in the GRF and COP waveforms in people with TF amputation. Moreover, as various different sub-phases of the stance phase were indicated by the PCs to be relevant during gait evaluation of people with lower limb amputation, a more complete analysis of the gait behavior while walking was reached. This seems, to the authors, a substantial benefit of PCA compared with the conventional methods which extract specific events from the waveforms. Therefore, as a clinical meaning can be applied for each relevant portion of the PCs sub-phases of the stance phase, this approach might be interesting for either following patients during rehabilitation, or developing new prosthetic models.
There are some limitations in this study such as the gender, which was not homogeneously distributed, and the range of age was high. As our purpose was to compare gait parameters from people with TF amputation, we were more concerned about the etiology of the amputation, being traumatic in most cases, to ensure that no other alterations due to vascular disease could influence the results; and with the time of amputation, to ensure that the participants were well adapted to the prosthesis. The participants used their own shoes during the data collection and this could be considered as a limitation since different shoes provide different gait alterations; however, we believe that it is a proper option as the prosthesis is aligned according to the shoes which the patient wears. Differences in levels of physical function were found between groups. These values suggest that both able-bodied and the participants with TF amputation felt few limitations to perform activities of the daily living involving physical function. Gait speed was not controlled, and it is known that speed is an important factor of influence in gait analysis. We decided to analyze self-selected speed because this control could also alter gait patterns, especially in subjects with TF amputation. We did not adjust the alpha value to multiple comparisons and the chance of Type I error was increased. As previously suggested, this statistical approach was adopted in order to avoid inflating Type II error. 38
Conclusion
Using PCA, statistically significant differences in many portions of the vertical, anterior–posterior and medial–lateral GRF waveforms, and anterior–posterior and medial–lateral COP displacement waveforms between prosthesis users and able-bodied participants were determined. This approach may be an interesting method for evaluation and following treatments of people with lower limb amputation as it assesses the entire waveforms.
Footnotes
Author contribution
All authors contributed equally in the preparation of this manuscript.
Declaration of conflicting interests
The author(s) declared no potential conflicts of interest with respect to the research, authorship, and/or publication of this article.
Funding
The author(s) received no financial support for the research, authorship, and/or publication of this article.