
Abstract
Background:
Studies on the relationship between performance and design of the throwing frame have been limited. Part I provided only a description of the whole body positioning.
Objectives:
The specific objectives were (a) to benchmark feet positioning characteristics (i.e. position, spacing and orientation) and (b) to investigate the relationship between performance and these characteristics for male seated discus throwers in F30s classes.
Study Design:
Descriptive analysis.
Methods:
A total of 48 attempts performed by 12 stationary discus throwers in F33 and F34 classes during seated discus throwing event of 2002 International Paralympic Committee Athletics World Championships were analysed in this study. Feet positioning was characterised by tridimensional data of the front and back feet position as well as spacing and orientation corresponding to the distance between and the angle made by both feet, respectively.
Results:
Only 4 of 30 feet positioning characteristics presented a coefficient correlation superior to 0.5, including the feet spacing on mediolateral and anteroposterior axes in F34 class as well as the back foot position and feet spacing on mediolateral axis in F33 class.
Conclusions:
This study provided key information for a better understanding of the interaction between throwing technique of elite seated throwers and their throwing frame.
Clinical relevance
This study aimed at improving the understanding of the relationship between performance and the design of the throwing frame of seated discus throwers, with a particular emphasis on the importance of feet positioning. This knowledge is particularly important in the current debate around general principles underlying design of throwing frame and classification of athletes with a disability, including those with lower limb amputation.
Keywords
Background
The description of the classification,1 –5 typical throwing technique, 6 throwing frame 7 and the parameters determining the performance of elite stationary discus throwers has been detailed in Part I. It is commonly acknowledged that the interaction between the athletes and their throwing frame has a significant influence on their overall performance.7 –10 The relationship between performance and throwing technique has been described in several studies focusing on able-bodied11 –21 and seated throwers.22 –27 These studies established the link between disability, performance and classification, while providing a better understanding of throwing technique as well as strength and fitness requirements.
However, the relationship between performance and characteristics of throwing frames of seated throwers has received limited attention so far. 7 Part I described the influence of whole body positioning with an emphasis on overall throwing posture (i.e. number of points of contact between the thrower and the frame, body position, throwing orientation, throwing side) and lower limb placement. Unfortunately, the description of the latter included only a qualitative inventory of seating arrangements, points of contact on both feet and type of attachment for both legs and feet. Some work has been conducted by coaches and athletes. For instance, a group of Australian coaches and biomechanists measured the external forces applied on both the feet to support an evidence-based design of an adjustable throwing frame for one discus seated thrower in F34 class. This work was partially presented as a case study. 8 Another study provided preliminary results about the impact of foot position on the performance of seated discus throwers in F34 class during a world-class event. Unfortunately, this work was only presented in an abstract form. 28 Clearly, there is a need for more evidence about the relationship between the performance and the design of the throwing frame used by stationary discus throwers.
An obvious area of interest is the contribution of the throwing frame in shaping feet positioning. As detailed in Part I, feet positioning is critical to determine how ground reaction and other contact external forces and moments are transmitted through the lower limbs to action the trunk during the course of the throw. Therefore, feet positioning could play a key role in initiating the transfer of linear and angular momenta from the lower limbs to trunk all the way to the release of the discus.
The most comprehensive way of establishing the relationship between performance and feet positioning relies on an experimental approach. Unfortunately, the measurements in a laboratory are particularly laborious in the case of seated discus throwers. 29 For instance, a typical kinetic analysis based on inverse dynamics is challenging and time-consuming. A traditional force plate and load cells embedded into foot plates are insufficient to measure all the external forces applied on the athlete because of the range of possible points of interaction with the throwing frame (i.e. feet, knees, buttocks, hips and arm rest). 30 In addition, an experimental study would aim at correlating a given characteristic (e.g. feet positions, point of contact and type of attachment) with parameters of performance (e.g. speed, height of release). This requires multiple yet seamless, timely and safe modifications of the throwing frame to satisfy experimental constraints (e.g. changing foot plates and/or seating height). Unfortunately, such alterations are difficult to implement without an adjustable frame. In addition, there are a number of combinations of characteristics and parameters to analyse. Finally, it is challenging for a local study to gather a group of athletes in F30s classes sufficiently large to warrant meaningful statistical outcomes.
Alternatively, some of these issues could be alleviated by using a phenomenological approach. A cohort of elite seated discus throwers could be observed during a world-class event. The extraction of kinematic, dynamics or kinetic quantitative data sets is possible but limited because of the contextual constraints of the recording.7,31 –33 However, feet positioning characteristics could be described for the largest possible number of athletes gathered in one location at the same time.
The purpose of this work was to improve the understanding of the relationship between performance and design of the throwing frame used by male athletes in F33 and F34 classes during the seated discus event of the 2002 International Paralympic Committee (IPC) Athletics World Championships. The specific objectives were as follows:
To provide benchmark tridimensional (3D) data of the front and back feet positioning as well as spacing and orientation corresponding to the distance between and angle made by both feet, respectively.
To investigate the relationship between performance and feet position, spacing and orientation.
Methods
Participants
A total of 59 attempts performed by 12 stationary discus throwers were considered in this study. Only 48 attempts corresponding to all attempts officially measured were analysed as there were 11 failed attempts. All the athletes competed either in F33 or F34 classes according to the IPC Athletics Classification Rules. Both classes included in this survey belong to the same disability group of F30s; however, the two other classes (i.e. F31 and F32) in this grouping were not included in this study. Three (25%) and nine (75%) athletes in F33 and F34 classes performed 13 (27%) and 35 (73%) attempts, respectively.
Typically, the functional abilities of athletes in F33 class are characterised by moderate to severe problems with lower limbs as well as fair functional strength and moderate control problems in upper limbs. Athletes in F34 class present moderate to severe problems in lower limbs and minimal control problems in upper limbs and trunk.
Interactions with athletes were not included in the research agreement made with the IPC. Consequently, no demographic or anthropometric information were recorded. This study was approved by the research organisation’s Human Research Ethics Committee.
Event
All information were recorded during the F33/34 seated discus throwing event of IPC Athletics World Championships held in 2002 in Lille, France. Athletes in both classes competed together. The official ranking was achieved through an adjustment of the performance taking into account the differences in functional levels. In this study, the raw performances in both classes were considered separately.
Raw performance data
The performance of stationary discus throwers corresponds to the distance between the edge of the plate and the footprint left by the discus on the ground. This distance was measured in metres by the officials using a laser pointer with an accuracy of ±1 mm. All performances presented in this study were extracted from official result sheets provided by the IPC representatives of the organising committee of the competition.
Video recording
Previous publications have already reported in depth some of the practical obstacles inherent to video recording during a world-class event (e.g. number and position of cameras, impact of disturbing factors, no interactions with participants and quality control procedures).32,33 Thus, only the key elements are presented here.
Video footages were initially recorded onto MiniDVs with two video cameras (Digital Handycam DCR-TRV15E; Sony, North Ryde, Australia) set at 25 Hz. One camera was placed on the throwing side of the athlete, while the other was placed directly behind. The field of view of each camera included the athlete’s whole body during the throwing action as well as the full length (2.29 m) and full width (1.68 m) of the plate on the ground. All six attempts of the first six placed athletes and most of the attempts of the athletes ranked between 7th and 12th places were recorded.
A customised calibration frame (2 m length × 1.5 m height × 1 m width) including 43 control points placed on top of the plate was recorded at the beginning and at the end of the event for calibration purposes. 34 The recording of each attempt started when the athlete received the discus and ended shortly after it landed on the ground. However, only the position of the thrower at the instant of release was considered of interest in this study.
Characterisation of feet positioning
The possible contribution of feet positioning to the performance was determined through the following key steps:
Step 1: video digitising. Video recordings of the calibration frame and the attempts were digitised at 50 Hz using Digitizer 5.0.3.0 software (SiliconCOACH Ltd, Dunedin, New Zealand). The 50 Hz sampling frequency was achieved by deinterlacing each video frame.
Step 2: tracking. The Digitizer 5.0.3.0 software was used to track, frame by frame, the centre of the discus, the distal end of the middle finger, the point of contact of the front and back feet as well as the top of the throwing frame set at 75 cm by the rule, the four corners of the plate and the origin of the Global Coordinate System (GCS). The origin O of the GCS was located at the midpoint in front of the throwing plate along the marked arc that is used by the referee to measure the performance. The vertical (VT), mediolateral (ML) and anteroposterior (AP) axes of the GCS pointed positively upwards, towards the right side of the plate and direction of the throw as represented in Figure 1, respectively. The tracking started approximately 10 frames before the estimated release and ended 5 frames or more after, until the implement was no longer within the field of view.
Step 3: synchronisation and reconstruction. The two coordinates of all points tracked with each camera were imported into a customised MATLAB software program (Math Works Inc., Novi, MI, USA). An operator used this software to identify the instant of release corresponding to the first frame showing a separation between the paths of the centre of the discus and the distal end of the middle finger. This instant was used to synchronise both views. Then, the program reconstructed paths in 3D within the GCS. Finally, the tabulated data were exported into a spreadsheet.
Step 4: characterisation of feet positioning. The 15 variables describing the feet positioning corresponding to: The resultant as well as the components along VT, AP and ML axes of the GCS of position of the front foot and back foot. The resultant as well as the components along VT, AP and ML axes of the GCS of the feet spacing corresponding to distance between both feet. The feet orientation corresponding to angle between both feet in transverse, sagittal and frontal planes of the GCS.
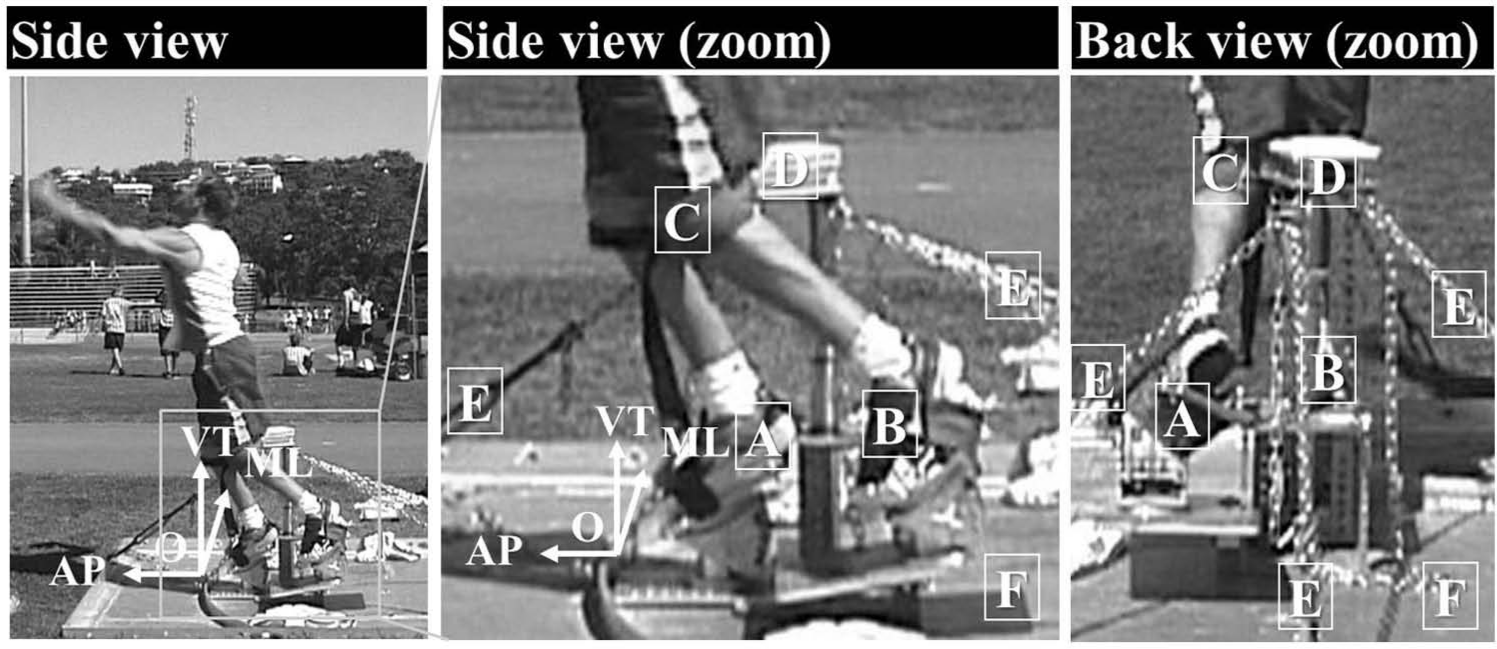
Example of a throwing frame used by an elite stationary discus thrower in F34 class featuring (A) front foot plate and (B) back foot plate, (C) a knee strap, (D) a seating area, points to anchor (E) the frame to (F) the plate and location of the (O) origin of the GCS with VT, ML and AP axes.
Each variable was summarily described by the mean, one standard deviation, the minimum, the maximum and the range.
Step 5: relationship between feet positioning and performance. First, all the variables were ranked in relation to increasing order of performance. Then, the relationship between each variable characterising the feet positioning and the performance in each class was simply described by the intercept and slope of the regression line as well as the coefficient correlation. Like in Part I, further statistical analyses were deemed unfeasible because of the limited numbers of athletes and attempts in each class.
Results
The distance achieved in each official throw ranked by increasing order to obtain an upward progression is presented in Figure 2. The descriptive statistics of the performance in both classes is provided in Table 1. The shortest and the longest performances for all F30s classes were performed by athletes in F34 class. However, the best athlete in F33 performed 5.31 m or 16% less than the best athlete in F34 class.
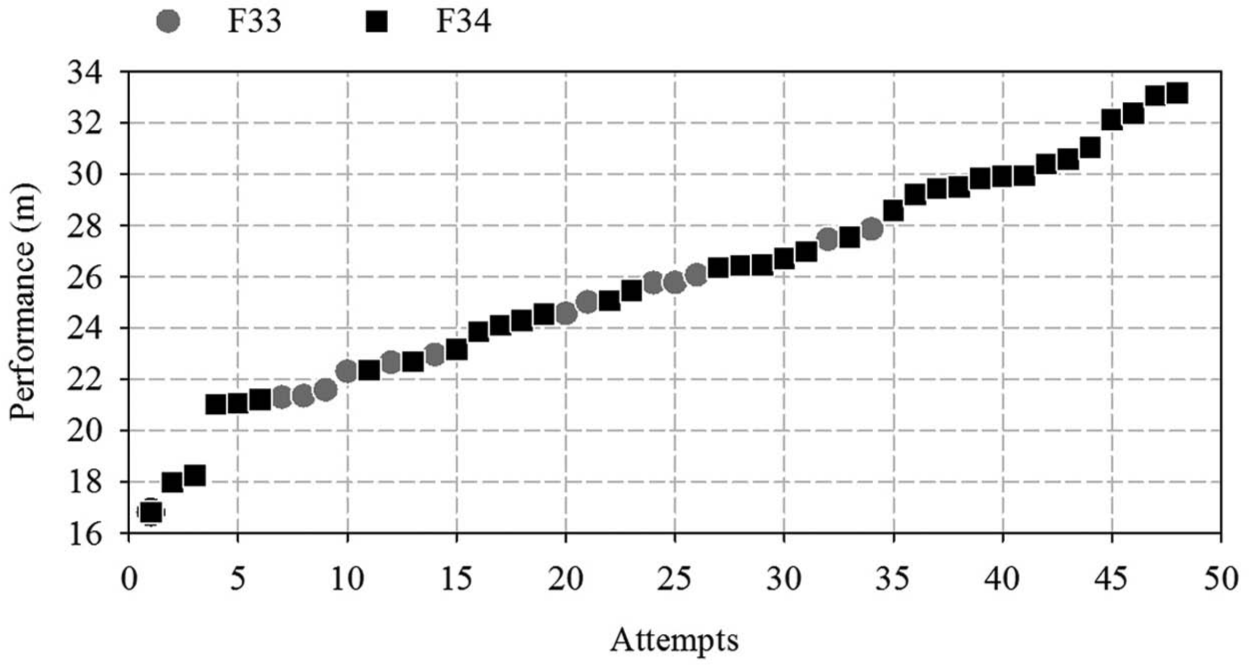
Performances ranked by increasing order for all attempts in F30s classes.
Overview of the descriptive statistics, parameters of regression lines and coefficients of correlation between the performance and each foot positioning variables of elite discus throwers in F30s classes.
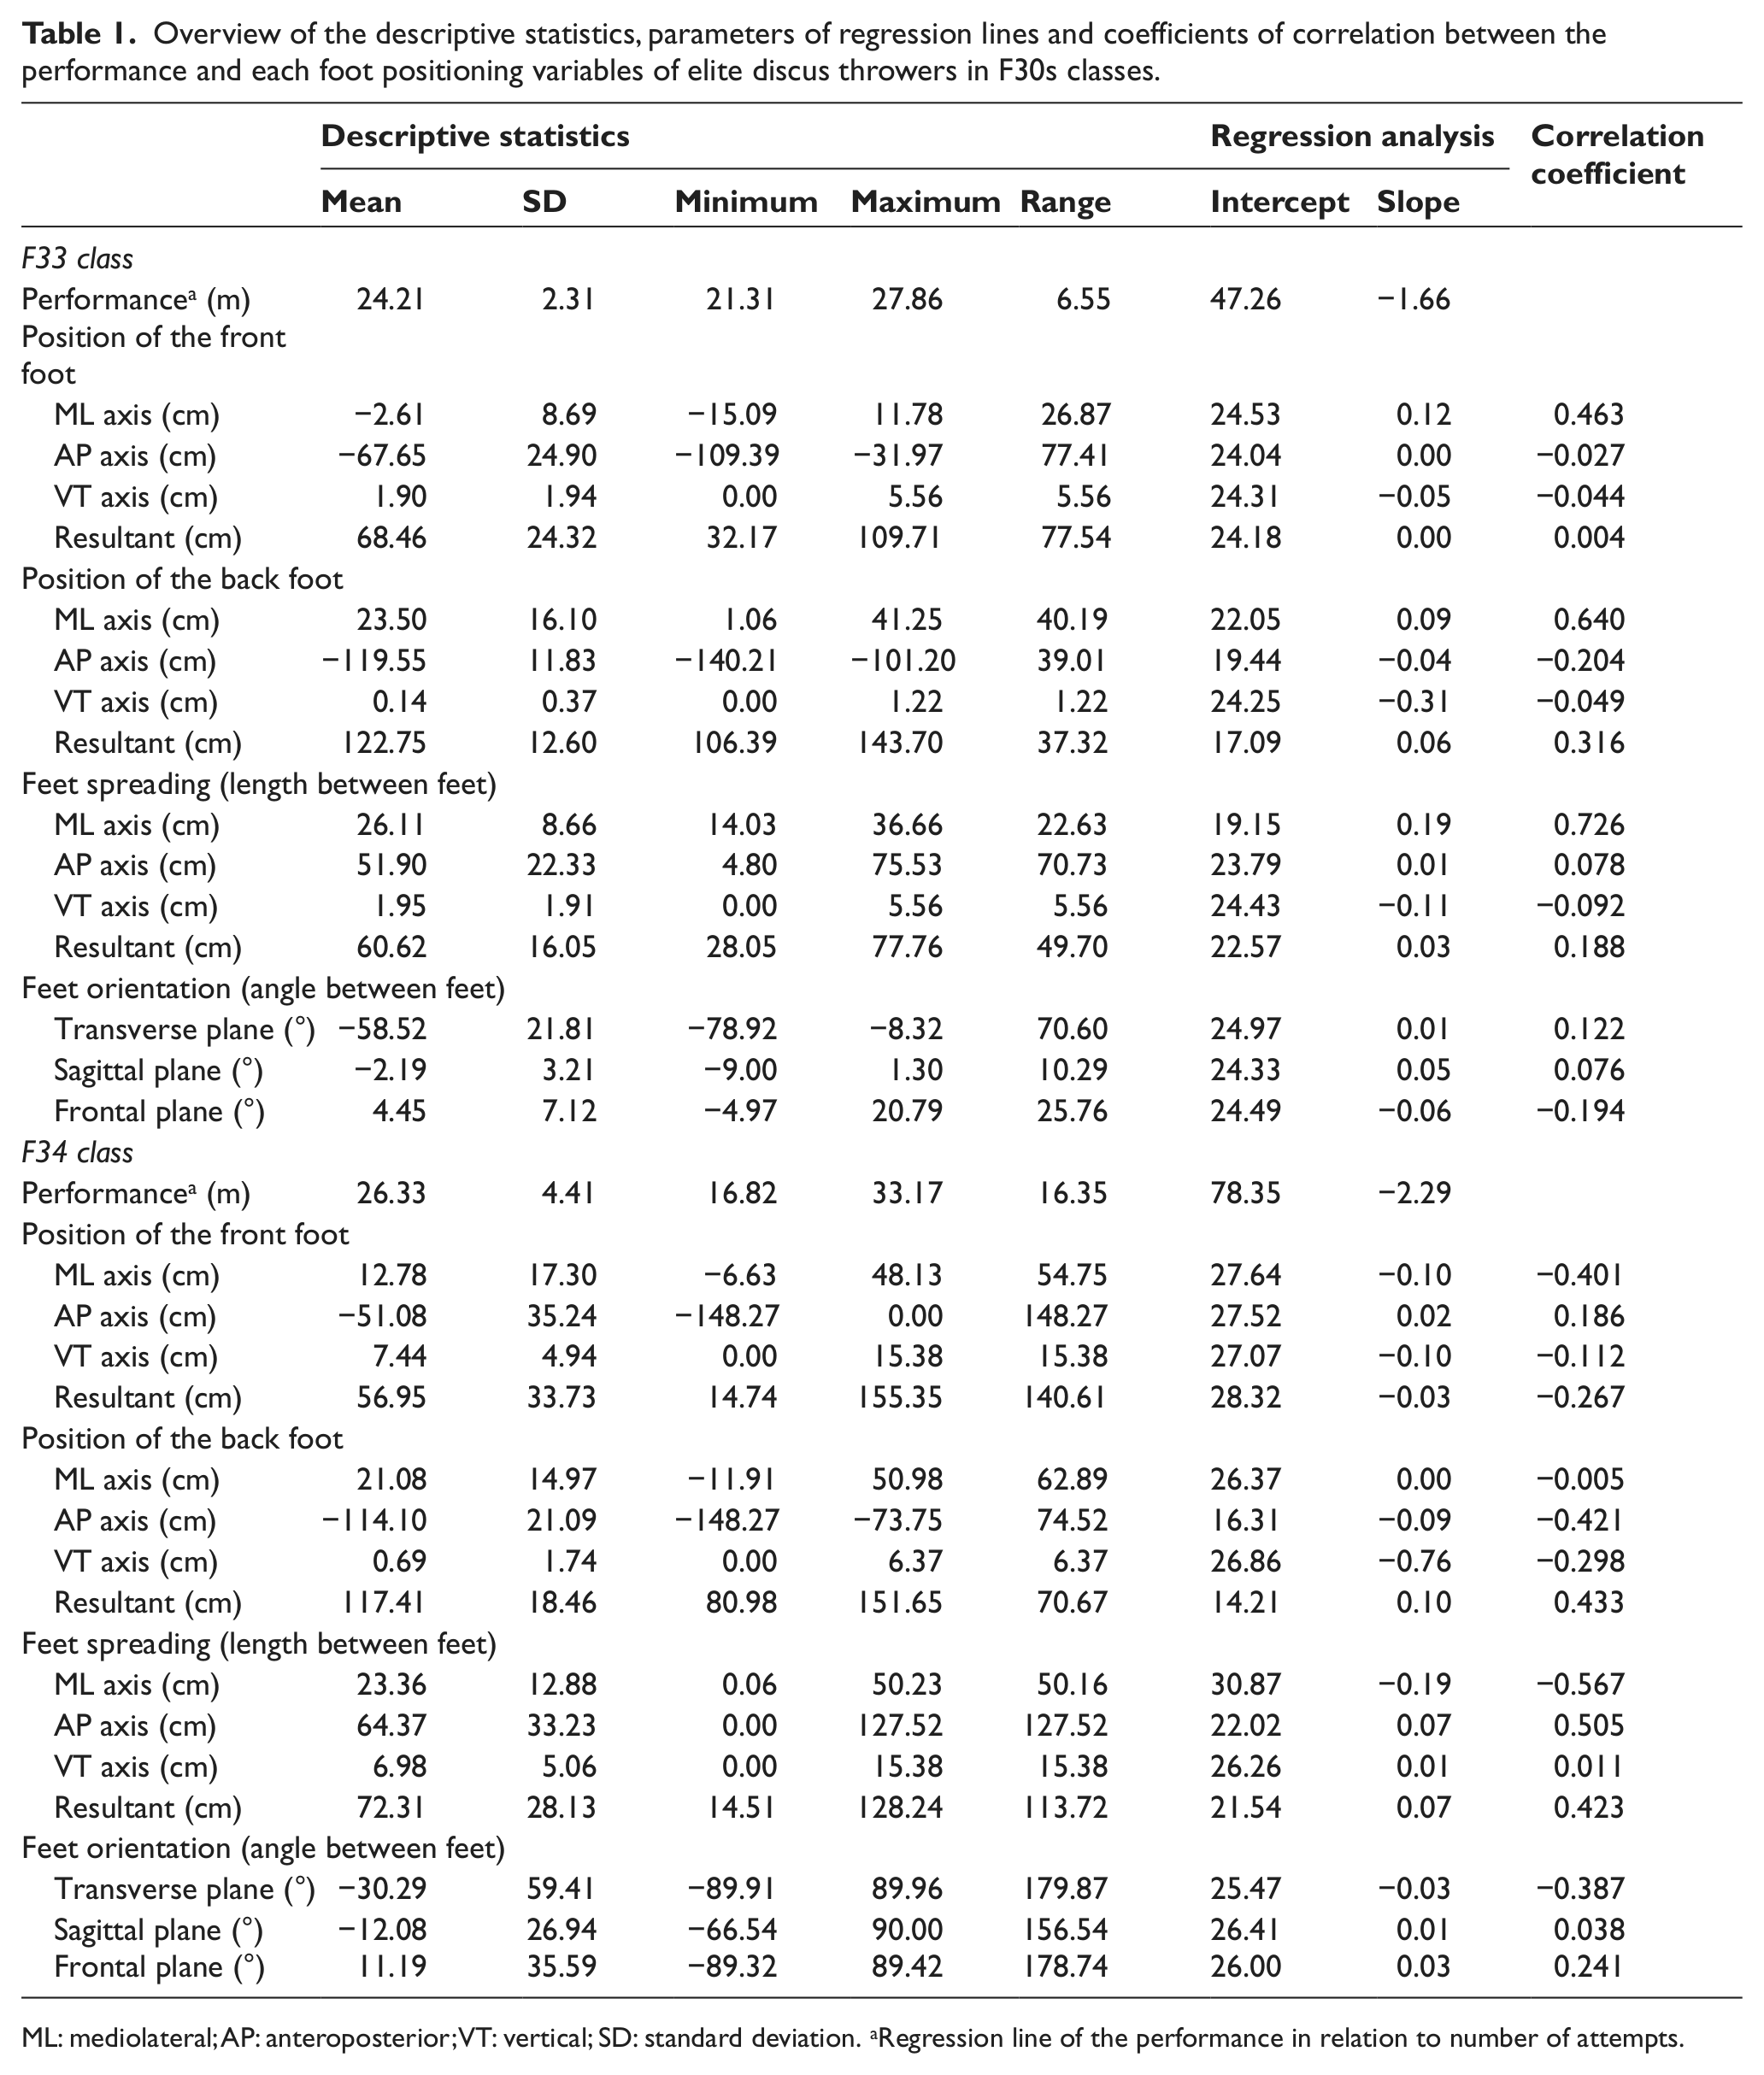
ML: mediolateral; AP: anteroposterior; VT: vertical; SD: standard deviation. aRegression line of the performance in relation to number of attempts.
The rear view of every stationary discus thrower in F30s classes at release is shown in Figure 1 of Part I. An overview of the position of the back and front feet in the transverse plane of the GCS for all throwers in F30s classes is shown in Figure 3. The relationship between the performance and both feet positions, spacing and orientation is presented in Figures 4 to 7, respectively. The descriptive statistics, parameters of regression lines and coefficients of correlation between the performance and each variable are presented in Table 1.
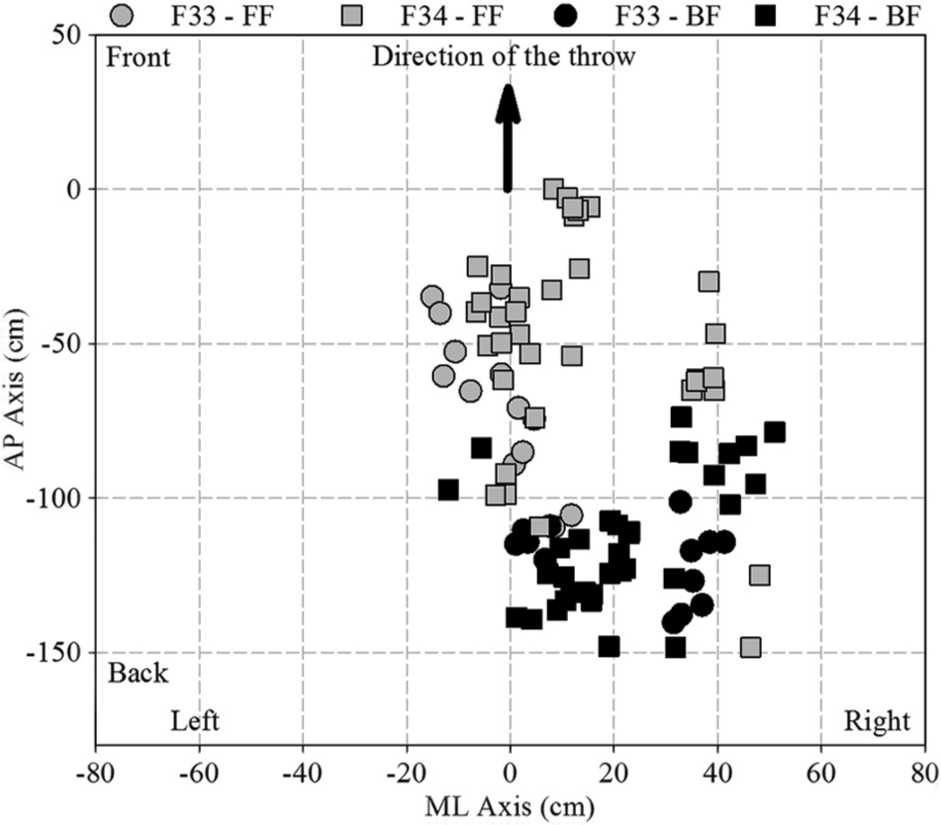
Position of the back (BF) and front (FF) feet in the transverse plane of the Global Coordinate System of stationary discus throwers in F30s classes (AP and ML).
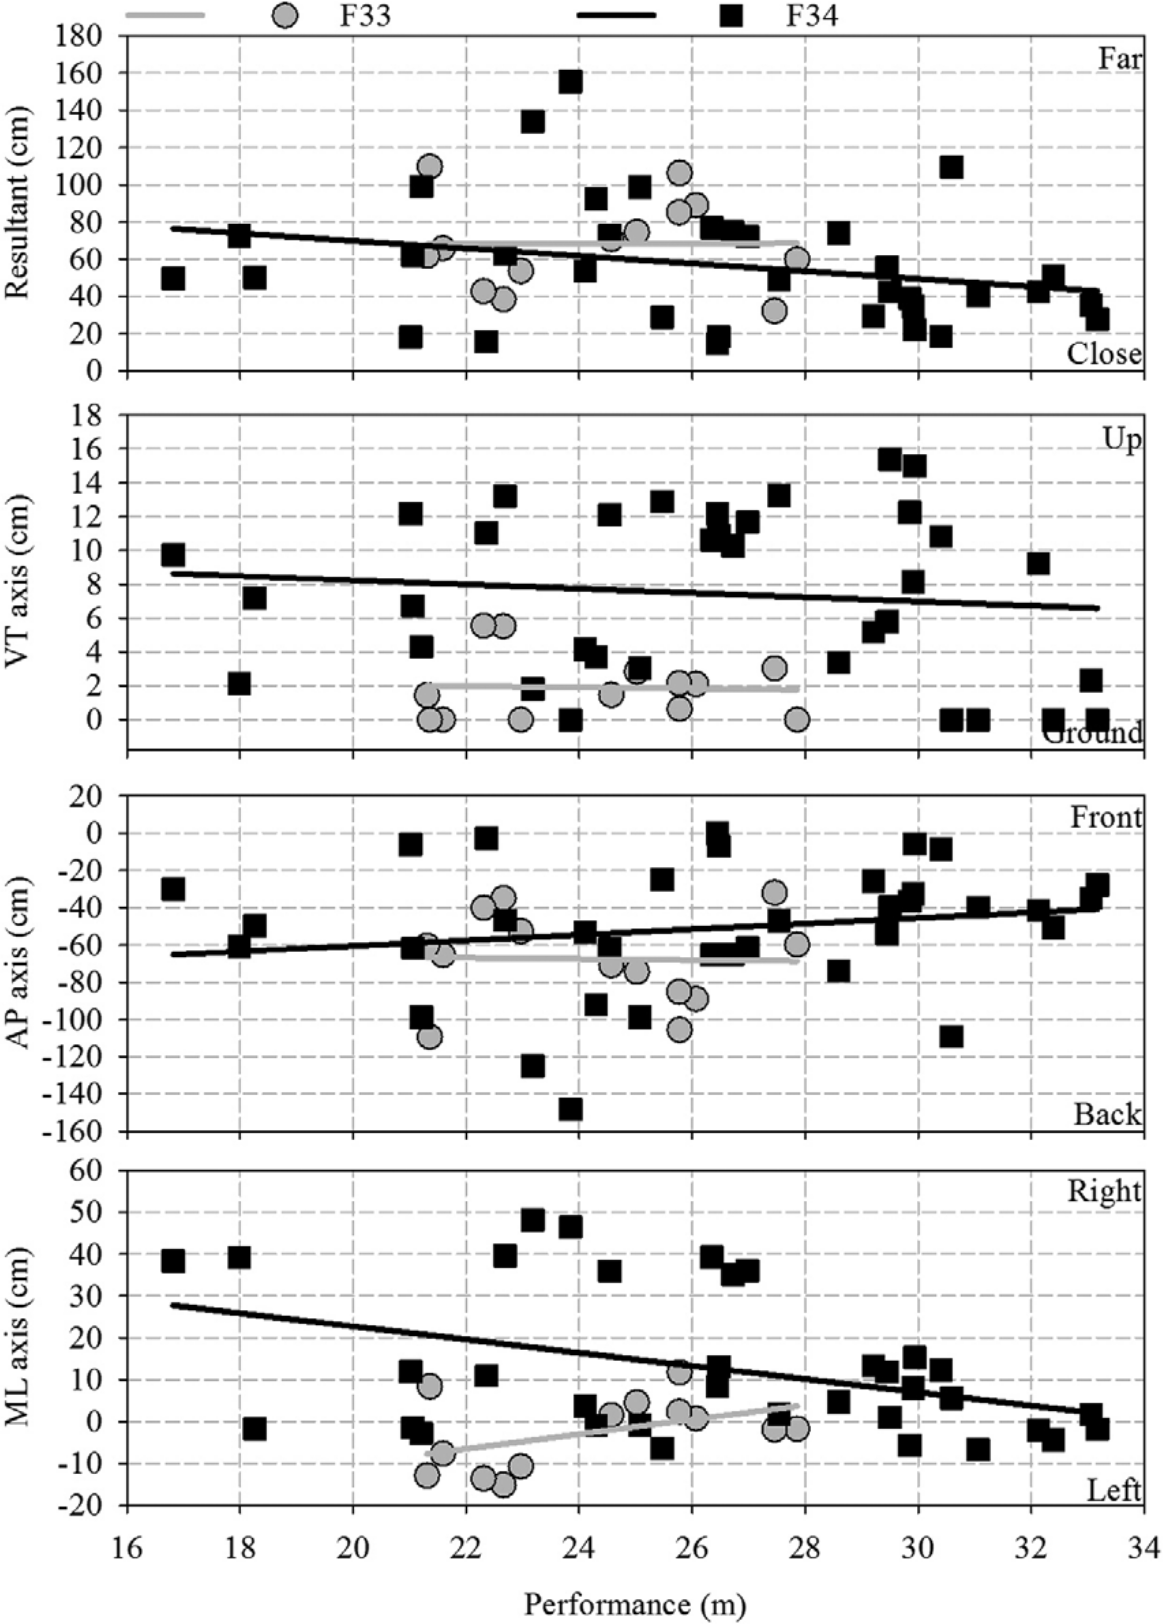
Resultant as well as VT, AP and ML components of the position of the front foot in relation to regression line of the performance of stationary discus throwers in F30s classes.
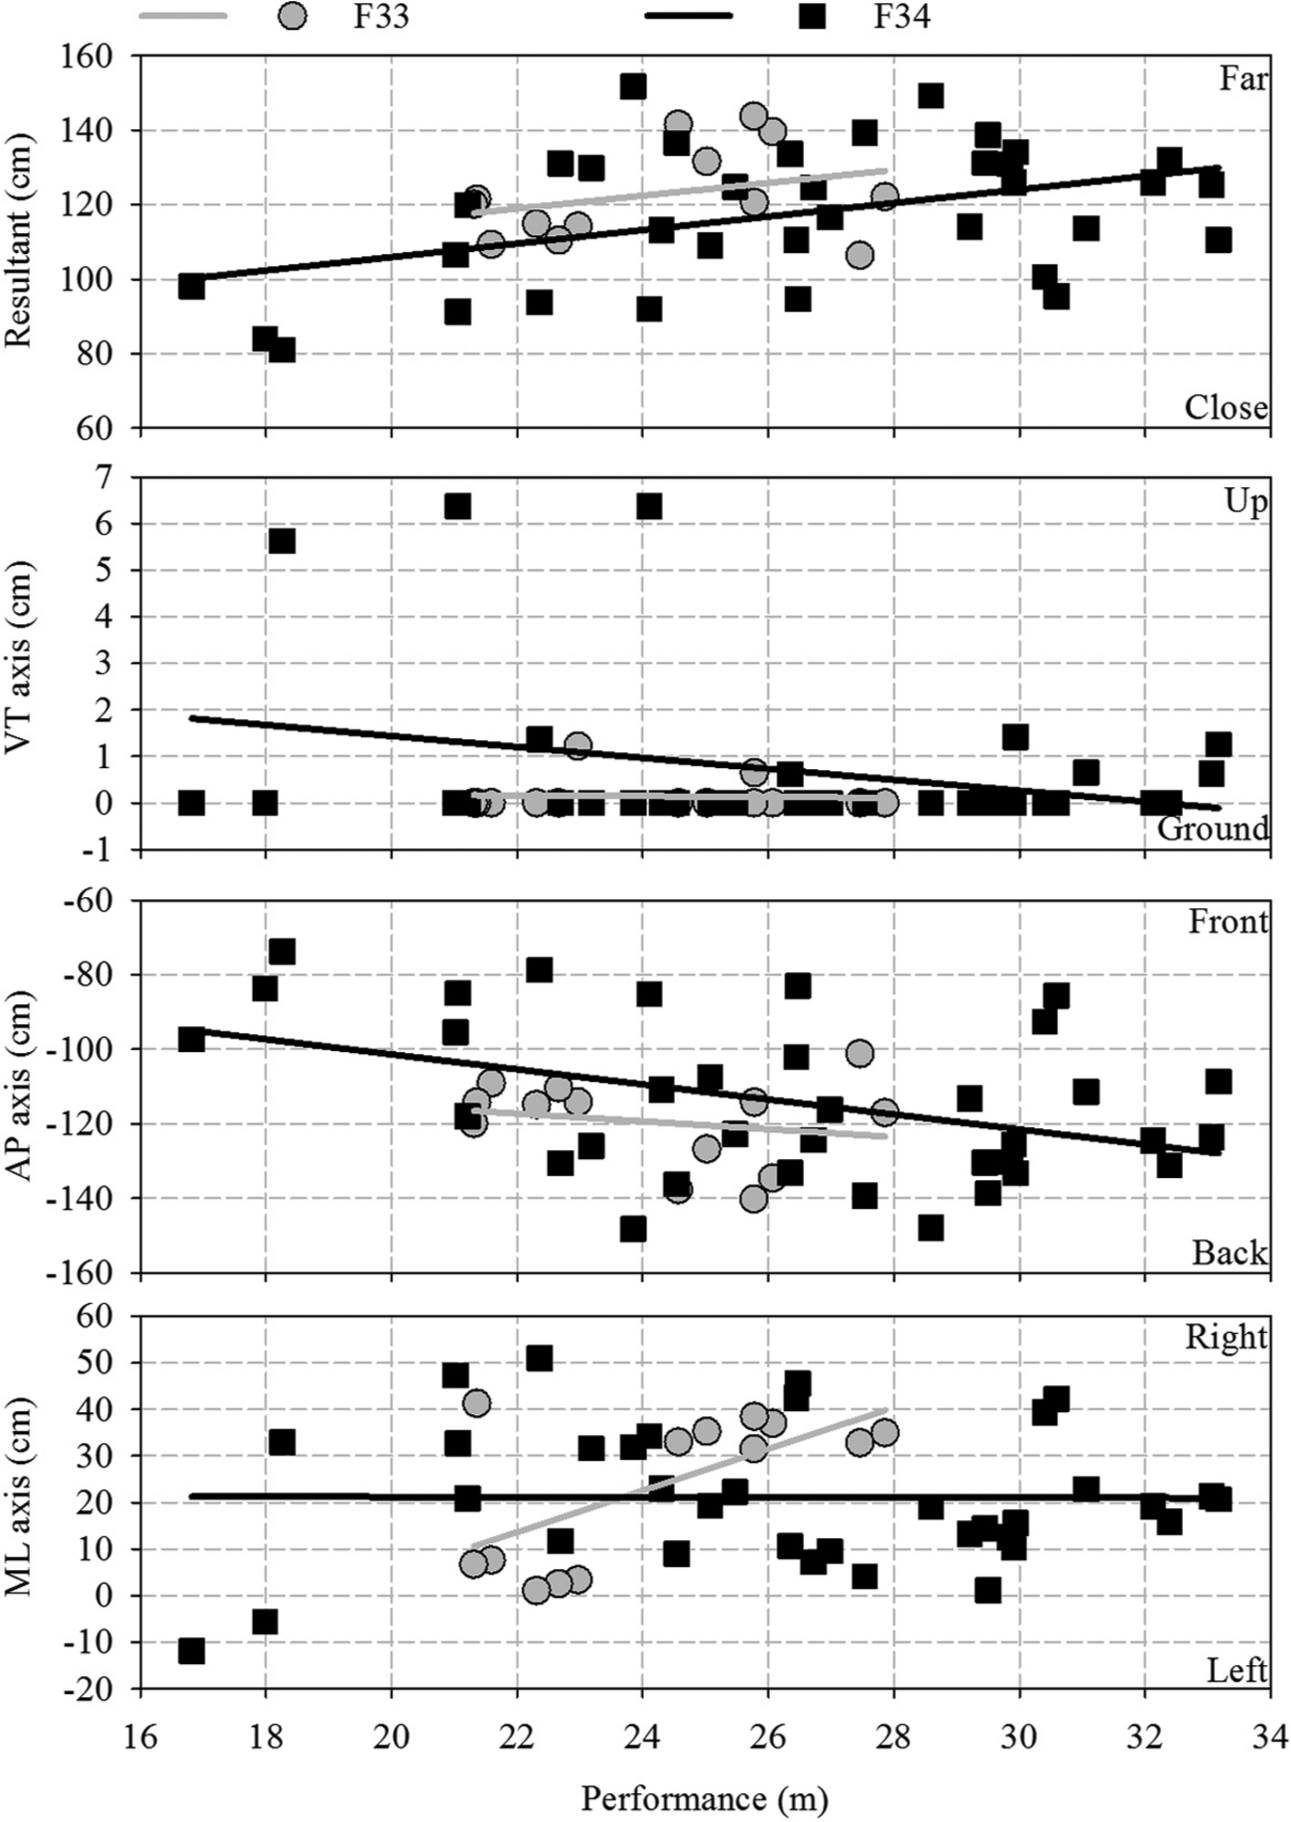
Resultant as well as VT, AP and ML components of the position of the back foot in relation to regression line of the performance of stationary discus throwers in F30s classes.
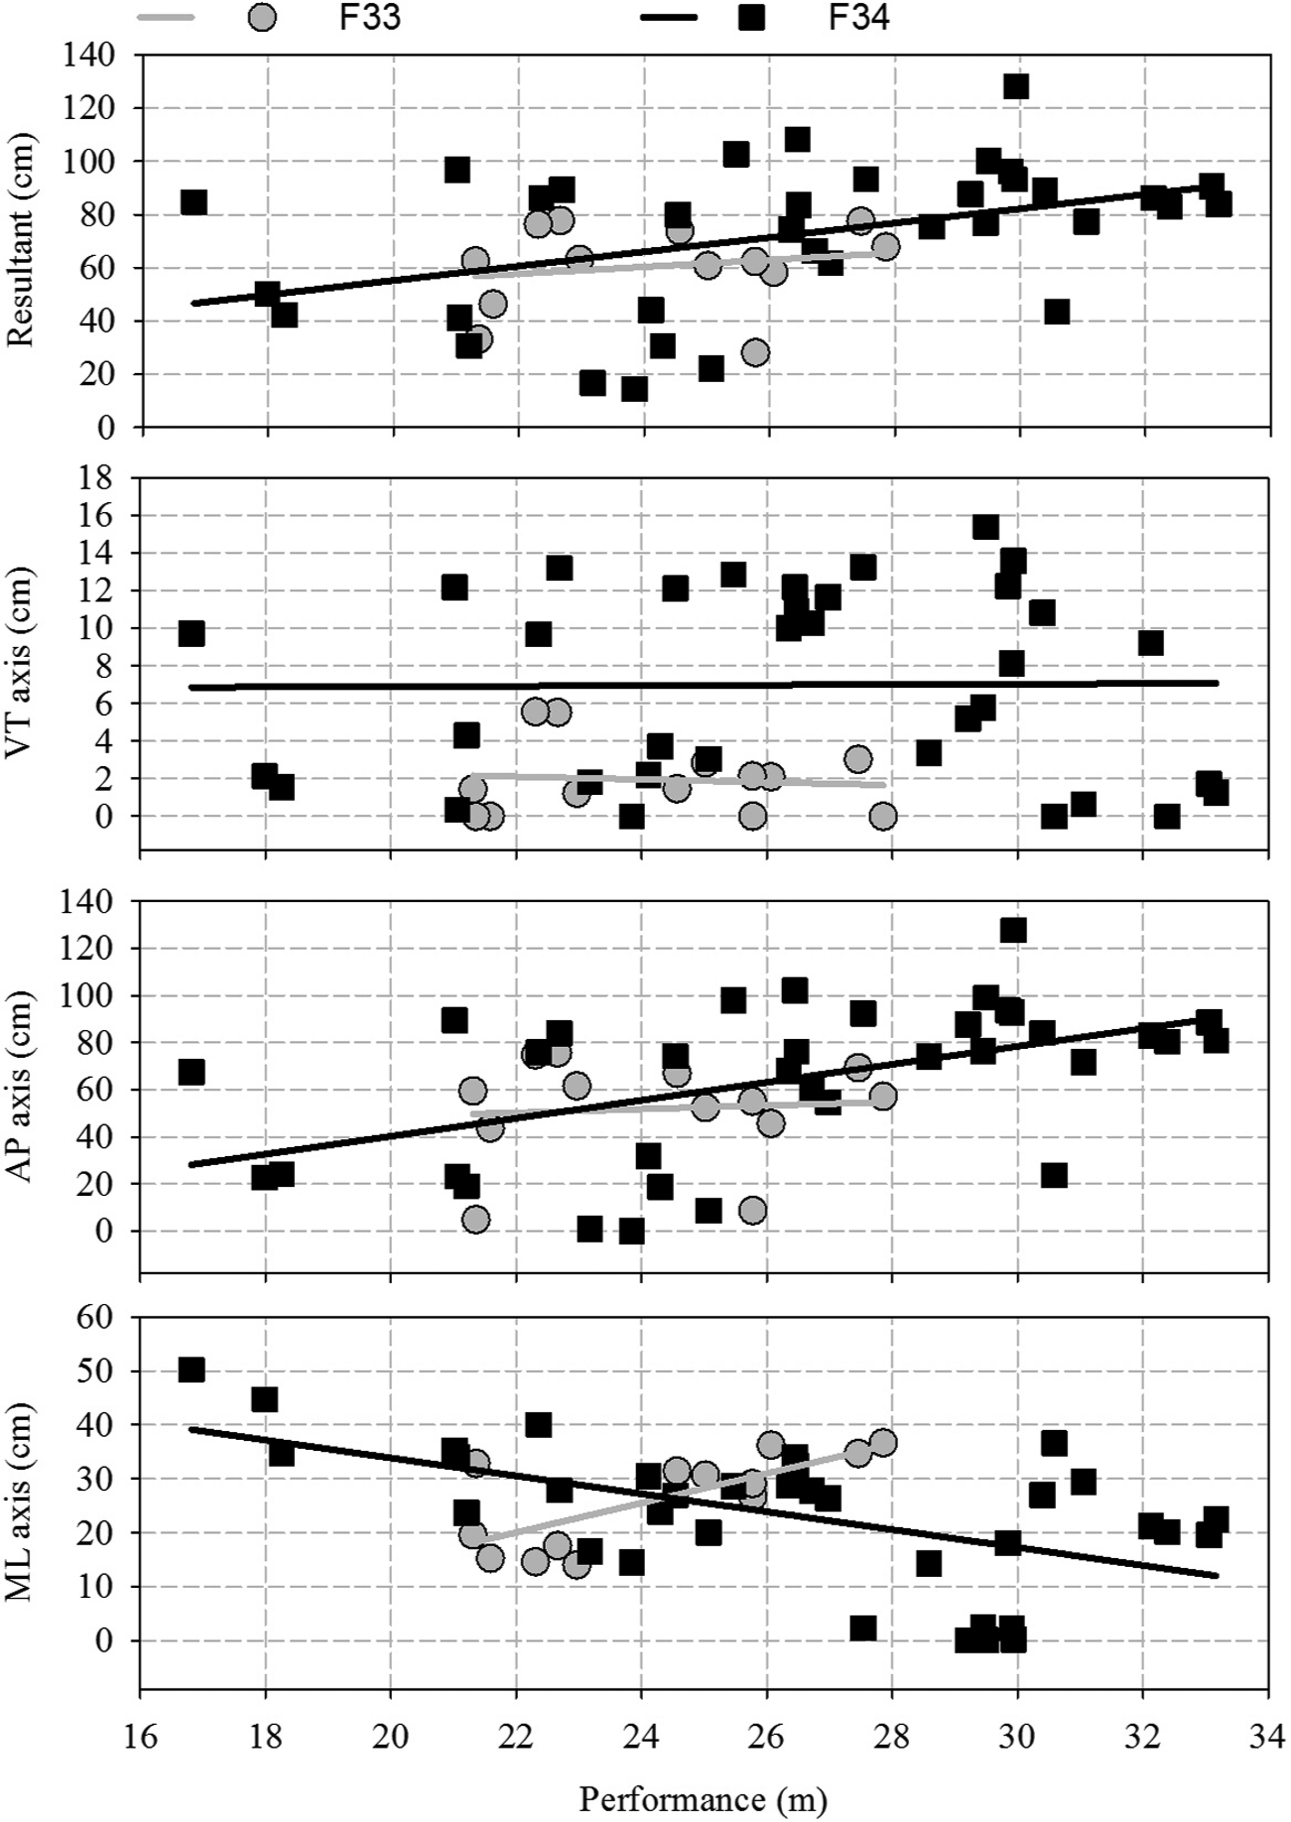
Resultant as well as VT, AP and ML components of the feet spacing in relation to regression line of the performance of stationary discus throwers in F30s classes.
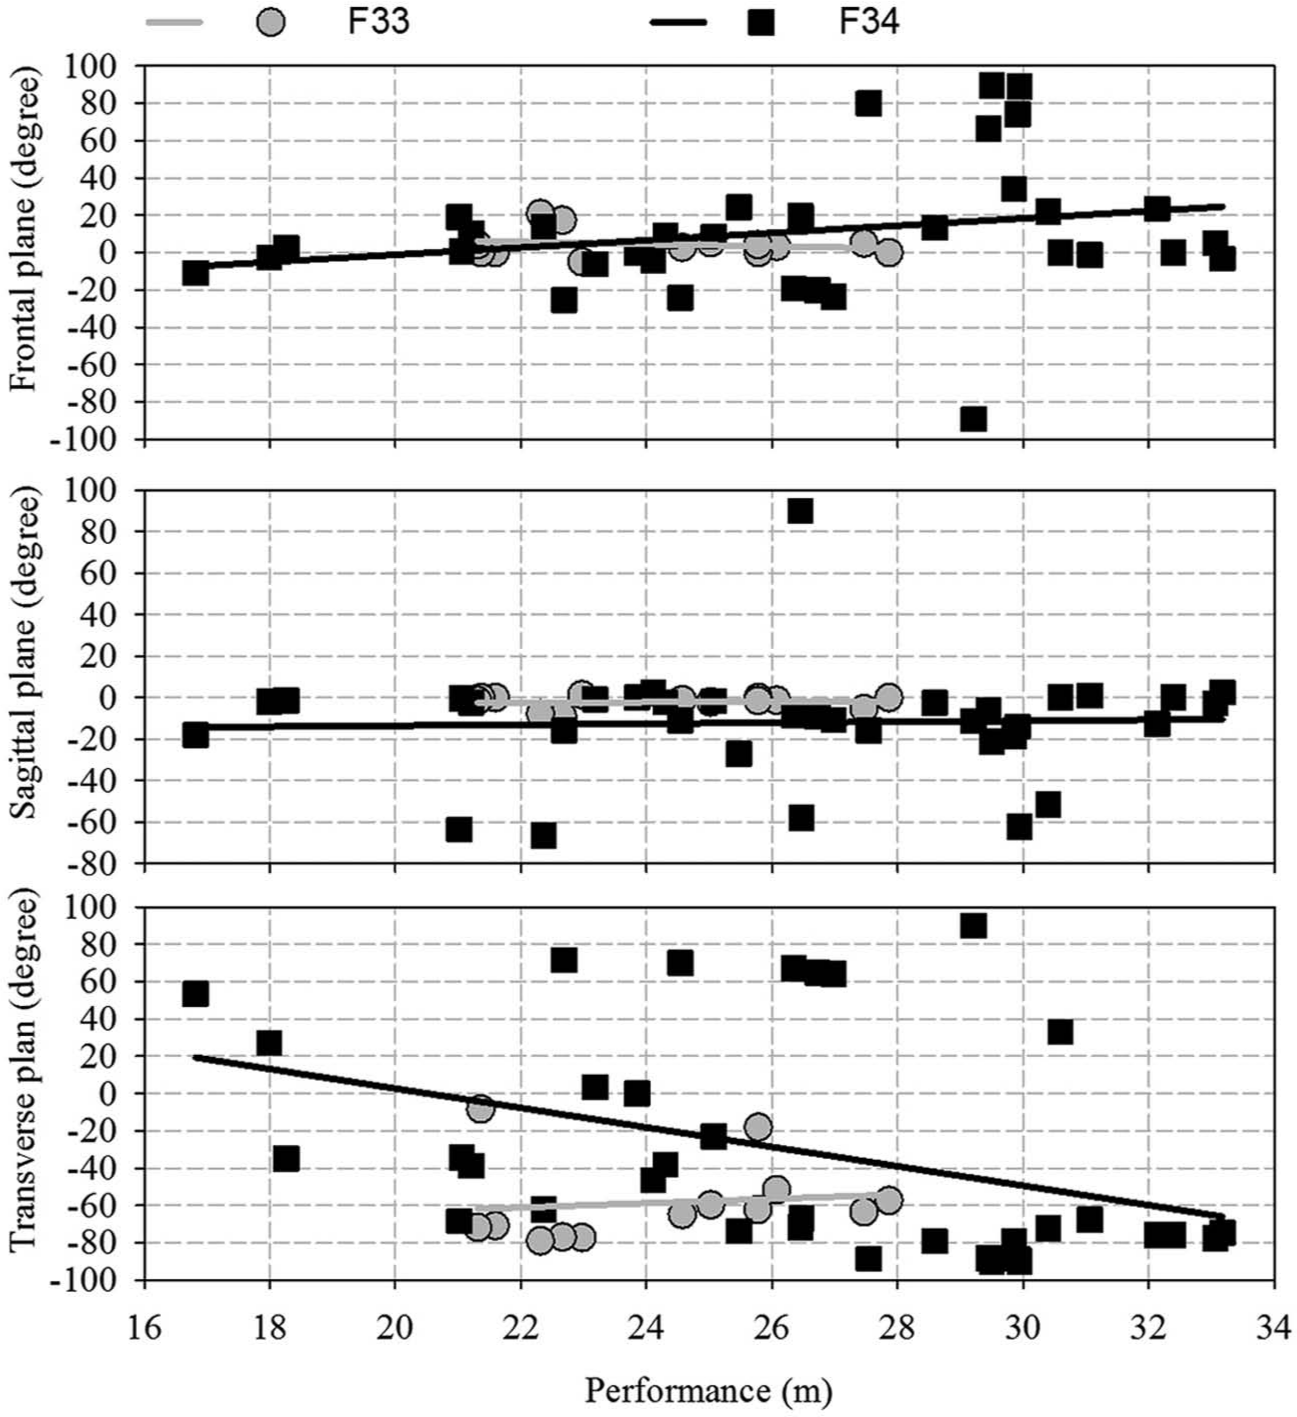
Angle in the sagittal, frontal and transverse planes of both feet in relation to regression line of the performance of stationary discus throwers in F30s classes.
The overall position of the front foot seems to have little effect on the performance for athletes in the F33 class. Nonetheless, the performance seems to increase with the distance of the front foot on the ML axis. The performance tends to increase when the front foot is placed closer to the GCS for athletes in the F34 class. The inverse trend occurred for the back foot. The overall position of the back foot seems to have little effect on the performance for athletes in the F33 class, although the performance seems to increase with the distance of the back foot on the ML axis. The performance tends to increase when the foot is placed farther to the GCS for athletes in the F34 class.
As expected, the trend for the position of both feet is also translated into the feet spacing. Consequently, the performance and the distance between feet seem to increase together, particularly on the AP axis for both classes. However, the performance seems to increase as the foot spacing gets wider and narrower for the athletes in F33 and F34 classes, respectively.
A neutral feet orientation, when both feet are more or less aligned collinearly with one axis of the GCS, seems to affect the performance only minimally for athletes in both classes. However, having both feet aligned with the AP axis seems to increase the performance of athletes in F34 class.
Discussion
One of the most significant contributions of this study was to provide benchmark information to athletes, coaches, classifiers, biomechanists, officials and other participants who develop evidence-based training programs, design of the throwing frames or rule of discus throwing events for athletes in F30s classes.
The range of performance in both F33 and F34 classes was provided, as well as the level of performance to obtain a gold medal in an international event in 2002 corresponding to 27.86 m and 33.17 m, respectively. This study provides quantitative descriptions of actual 3D feet positions, spacing and orientation used in competition. These results confirmed that the so-called base of support of discus throwers could not only be described by feet positioning but also by whole body positioning, as detailed in Part I.
Another contribution of this study was to demonstrate that links between feet positioning and performance were weak, despite that the performance progressing regularly upwards within the range of 16.35 m between the worst and best performances. This weak relationship might be due to the shortcoming of the analysis as detailed further in section about the limitations.
Nonetheless, the representative value of the regression lines was ambivalent. The absolute coefficient of variation for all the 15 variables describing feet positioning was on average 0.93 ± 0.95 m for F33 class and 1.09 ± 0.93 m for F34 class indicating a fairly high data dispersion. Nonetheless, the vast majority of the feet positioning variables for the worst and best performances were close to the regression line. Thus, mainly athletes in the middle range were the ones least represented by the regression lines.
Furthermore, the predictive value of this regression line was limited. Indeed, most of the regression lines presented a small slope indicating a flat line. Nonetheless, some negative and positive regression lines indicated a possible effect of closeness and spacing of front and back feet with the performance, respectively. Interestingly, athletes in F33 and F34 classes presented opposite tendencies for both feet positions on the ML axis evoking possible different stabilisation strategies.
Finally, the weak links between feet positioning and performance were confirmed by low coefficient correlations across variables. Indeed, only 4 of the 30 feet positioning variables presented a coefficient correlation superior to 0.5 including the feet spacing on ML and AP axes in F34 class as well as the back foot position and feet spacing on ML axis in F33 class. Indeed, only the two latter variables had a coefficient correlation superior to 0.6.
By definition, throwing momentum is gained through the summation of the external contact forces. These results indicated that the performances were likely to be only partially determined by reaction forces and moments applied by the ground or the frame on each foot. Consequently, athletes relied significantly on external forces and moments generated at all the other points of contacts with the frame (e.g. knees, thighs, elbows) as revealed by the descriptive analysis of lower limb placements presented in Part I.
Further understanding of the relationship between performance and lower limb placements was restrained by the limitations of this study. Obviously, the dynamic measure of the external forces and moments applied at each point of contact was impossible giving the recording context. Furthermore, the contribution of feet positioning might be better assessed by taking into consideration a number of cofounders and complementary measures that were not accessible in this study, such as the types of impairment, anthropometric characteristics (i.e. height, mass), the kinematic description of the hand at release (e.g. position, velocity, angle) as well as the actual 3D position and orientation of each foot, knee and hip.
This study demonstrated that the performance of stationary discus throwers was determined partially by feet positioning and mainly by all the other points of contact largely influenced by the design of the throwing frame. All combined, this study indicated that whole body positioning and throwing frame are highly athlete dependent. Each athlete seems to choose his own configuration of feet and whole body positioning that might be perceived as the most favourable combination. There is no one-size-fits-all throwing frame. This confirms previous studies looking at the design of the throwing frame used by stationary shot-putters. 7
This study relied on the information collected in 2002 since some rules and the levels of participation and performance have changed. This is a strong limit, and there is a clear need for additional data to be collected. Therefore, the interpretation of these results in the current context must be conducted carefully. Nonetheless, they can contribute to the current debate surrounding the design principles of throwing frames for stationary throwers.9,35,36 A trend for individualisation of the frame has been rejuvenated by training teams in Australia 8 and the United Kingdom 37 over the last few years. Indeed, several fully adjustable frames have been developed and used in recent world-class events (Figure 8). Another trend for standardisation of the frame has also been recurring for several years. In the case, every thrower will use a single frame. In all cases, this study indicated that frame featuring adjustable seating arrangements as well as foot placement and attachments would be sensible.
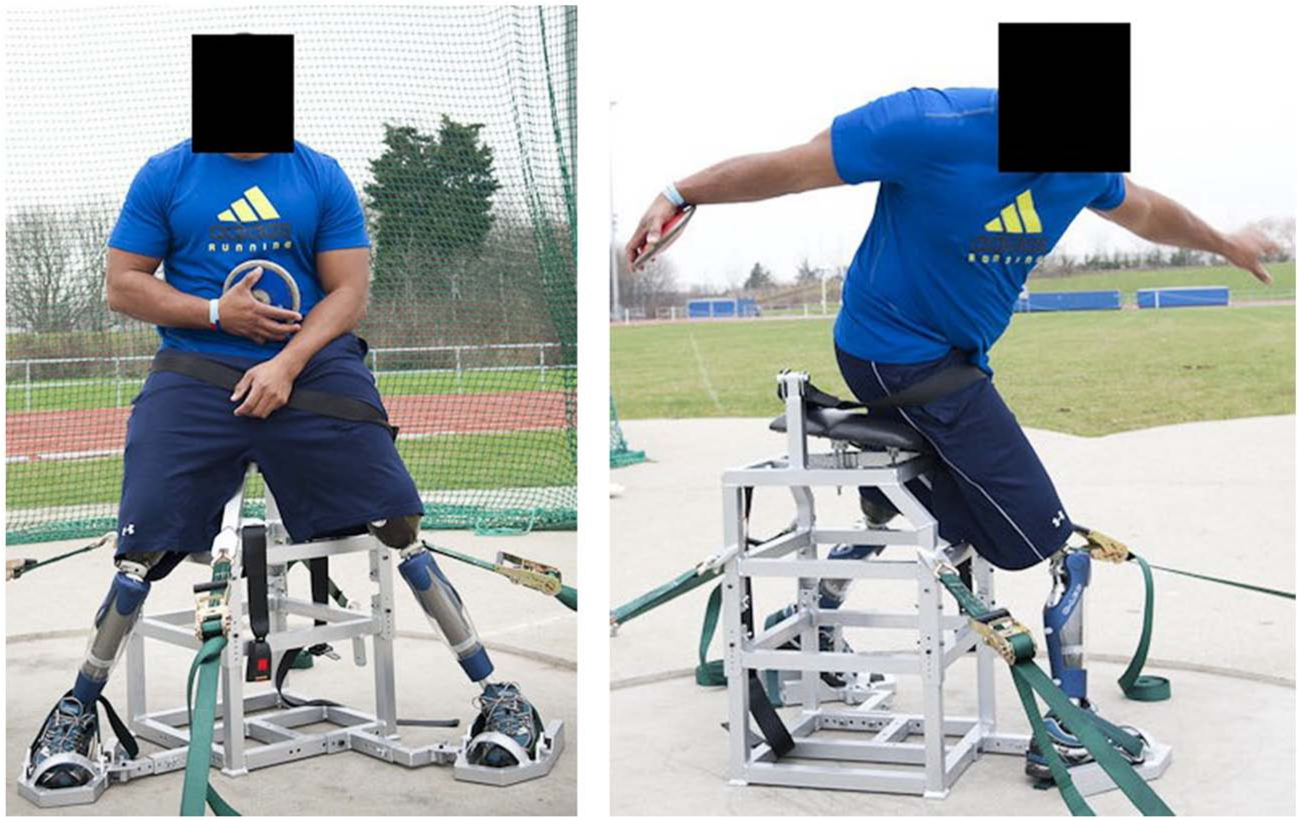
Example of a seated thrower using adjustable throwing frame and advanced prosthetic legs fitting, microprocessor-controlled knee units.
The prospects of future studies are comparable to the ones detailed in Part I. There is a need for the following:
Further longitudinal studies replicating the description of the feet positioning, particularly those focusing on more recent female and male events, wider level of performance and classification as well as other throwing events.
Further cross-sectional studies to be conducted in experimental conditions where further 3D kinematic (e.g. position and orientation of each segment) and dynamics (i.e. contact external forces and moments) could be collected. 30
All combined, these analyses will provide a better understanding of the relationship between performance and design of the throwing frame.
Conclusions
The feet positioning of stationary discus throwers in F30s classes during an actual world-class event was reported for the first time. It is anticipated that the results of this study will provide key information to those facing the challenge of improving the understanding of the interaction between seated throwing technique and throwing frame. Finally, both Parts I and II of this study are stepping stones into the future formulation of consensual principles for the design of the throwing frames of elite seated throwers.
Footnotes
Acknowledgements
The authors wish to acknowledge Dr Yves Vanlandewijck and Dr Walter Thompson for facilitating the access to the result sheets, Scott Goodman for his technical insight and Dr Sarah Curran for editing this manuscript.
Funding
This study was approved and supported by the IPC Sports Science and partially funded by QUT ARC Linkage Project Incentive Scheme (Frossard L, Barker T, Smeathers J, Pearcy M and Goodman S. Biomechanical analysis of elite Australian athletes competing in seated throw events), QUT Strategic Link with Industry (Frossard L, Smeathers J, Barker T and Goodman S. Video analysis of seated athletes during the shot-put event at the 2002 IPC Athletics World Championships) and QUT ARC Linkage Project Incentive Scheme (Frossard L, Pearcy M, Smeathers J, Barker T and Goodman S. Novel design of a universal chair for elite Australian athletes competing in seated throw events).
Conflict of interest
None declared.