
Abstract
Background:
There is a need for better understanding of the dispersion of classification-related variable to develop an evidence-based classification of athletes with a disability participating in stationary throwing events.
Objectives:
The purposes of this study were as follows: (1) to describe tools designed to comprehend and represent the dispersion of the performance between successive classes and (2) to present this dispersion for the elite male and female stationary shot-putters who participated in Beijing 2008 Paralympic Games.
Study Design:
Retrospective study.
Methods:
This study analysed a total of 479 attempts performed by 114 male and female stationary shot-putters in three F30s (F32–F34) and seven F50s (F52–F58) classes during the course of eight events during Beijing 2008 Paralympic Games.
Results:
The average differences of best performance were 1.46 ± 0.46 m for males between F54 and F58 classes as well as 1.06 ± 1.18 m for females between F55 and F58 classes. The results demonstrated a linear relationship between best performance and classification while revealing two male gold medallists in F33 and F52 classes as outliers.
Conclusions:
This study confirms the benefits of the comparative matrices, performance continuum and dispersion plots to comprehend classification-related variables. The study presented here represents a stepping stone into biomechanical analyses of stationary throwers, particularly on the eve of the London 2012 Paralympic Games where new evidences could be gathered.
Clinical relevance
This study aimed at developing evidence-based classification of individuals with a disability participating in adapted physical activities. Baseline information from male and female stationary shot-putters who participated in the Beijing 2008 Paralympic Games is provided.
Background
As described by Vanlandewijck, 1 the classification of athletes with a disability is an organisational structure consisting of ‘ordering of competitors into classes on the basis of their performance potential, based on the relationship between impairment and sport activity’. The classification aims at minimising the impact of disability on athletic performance. 2 Consequently, international classifiers regroup athletes based on the relationship between their functional outcome and determinants of a sport-specific performance in a given event.3–8
The ultimate purpose of the classification is to ensure the fairness of the event by mitigating the effect of impairment. To date, athletes with a disability participating in field events are classified through an empirical process involving examination of medical reports as well as observations off and on the field during training and competition.2–5,7,8
The development of an evidence-based classification is impeded by, at least, two compounding obstacles:
The lack of biomechanical models integrating physiological (i.e. control and intensity of muscle activity), mechanical (i.e. range of movement, velocity, momentum, power and work) and technical (i.e. rules and equipment design) variables capable of extracting a combination of key predictors of a performance. 2 For example, to what extent the seating height sets at 75 cm and a 30% limitation in trunk’s range of movement affect put’s velocity at release and, therefore, the performance of a stationery thrower in the F58 class?
Gathering in single location a number of athletes in each class that is sufficient to warrant statistical analysis is challenging. Opportunities to record solid biomechanics data during international events (e.g. world championships, Paralympic Games) are possible but not always feasible. Consequently, most studies involved small cohorts of athletes in spread out classes.9,10
Alternatively, the classification could be validated through a phenomenological approach involving the analysis of the dispersion of classification-related variables. The degree of scatter of the data within a class, also called intra-dispersion, would establish the classification’s capacity to regroup athletes with similar functional outcome. The dispersion of the data between classes, also called inter-dispersion, would confirm the classification’s capacity to distinguish groups of athletes with different functional outcomes along a progressive continuum. 11 The analysis of both dispersions is informative. However, the scope of the present study focuses solely on the inter-dispersion of the performance of stationary shot-putters.
In principle, analyses of inter-dispersion could come down to basic statistical comparison of groups represented by a mean and standard deviation. This method would be valuable but partially informative in the case of classification of athletes with a disability. Average calculation could be affected only mildly by outliers, particularly those at the tail-end of the data set corresponding to the best athletes. 12
More advanced statistical tests could be used. However, Frossard et al. 13 established that a simpler range analysis can be deemed sufficient. For instance, they described inter-dispersion of classification-related data, such as the performance, through basic calculus and reasonably elaborate representations including the following:
Four-entry matrix comparing worst and best performance across classes;
Plots of performance continuum representing the performances of athletes of a given class in relation to the performances of all the athletes in the group of disability, such as F30s and F50s;
Plot of performance dispersion combining all performance continuum plots.
Initially, this book of data was designed to reach participants in the coaching and classification arenas.11,13,14 Indeed, it can be downloaded free-of-charge from http://eprints.qut.edu.au/18099/1/c18099.pdf. 13 However, the tools have not been yet scrutinised by the scientific community. In addition, this study made available nearly 6 years ago is already slightly outdated. Only information collected during the Assen 2006 International Paralympic Committee (IPC) Athletics World Championships was presented. It is therefore clear that there is a need for a similar study of the inter-dispersion of a classification-related variable based on information collected during a more recent world-class event. More athletes and higher level of performance might be considered.
The ultimate aim of this study is to contribute to the development of an evidence-based classification of athletes participating in the stationary throwing events. The purposes of this study were as follows:
Describe tools designed to comprehend and represent the inter-dispersion of classification-related variables;
Present the inter-dispersion of the performance for the elite male and female stationary shot-putters who participated in Beijing 2008 Paralympic Games.
Methods
Population
Elite stationary shot-putters are divided into two groups of disability (Figures 1 and 2). Each one is made of classes along a continuum of functional outcomes. Typically, athletes with cerebral palsy as well as spinal cord injury and lower limb amputation might be in F30s and F50s classes, respectively. However, athletes with other type of impairments, but similar functional outcomes may be included in some of the subclasses. The study was approved by the research organisation’s Human Research Ethics Committee.
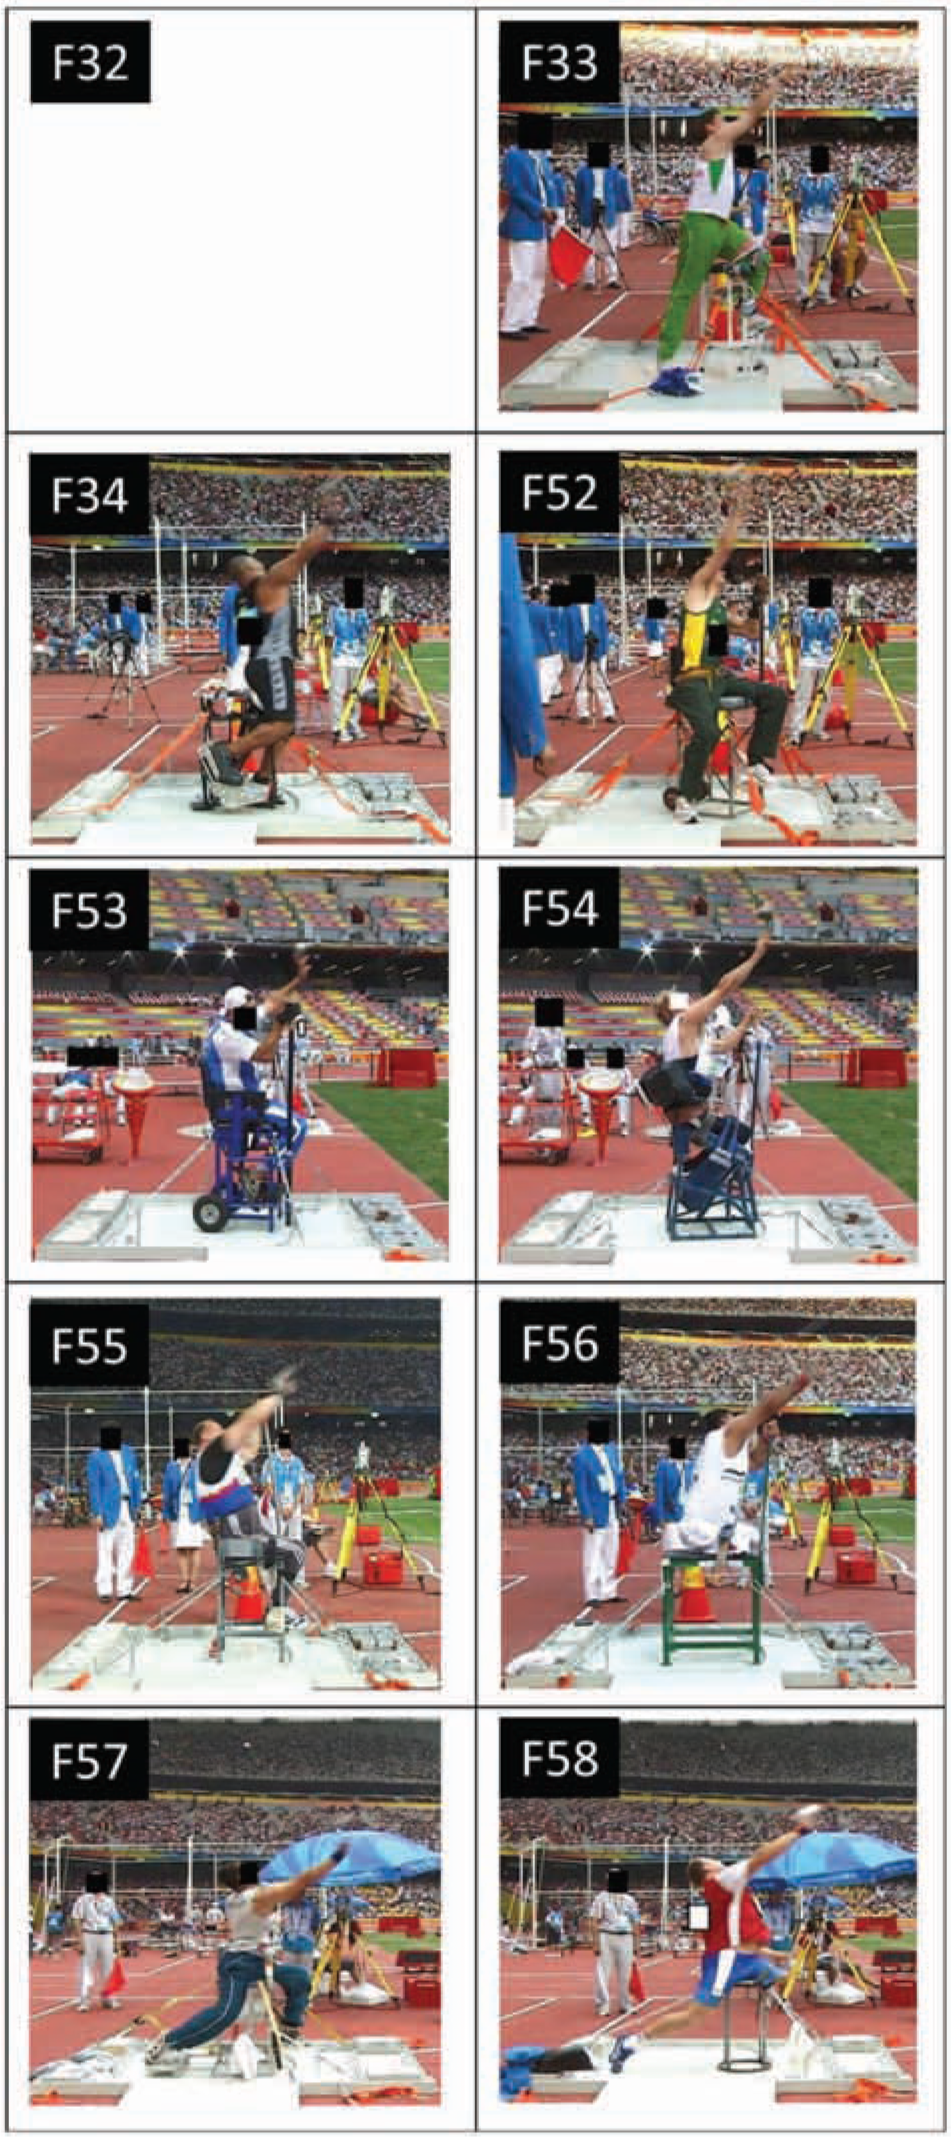
Example of position of male stationary throwers at the instant of release in each class on both groups of disability (i.e. F30s and F50s). Photo of athlete in F32 was not available.
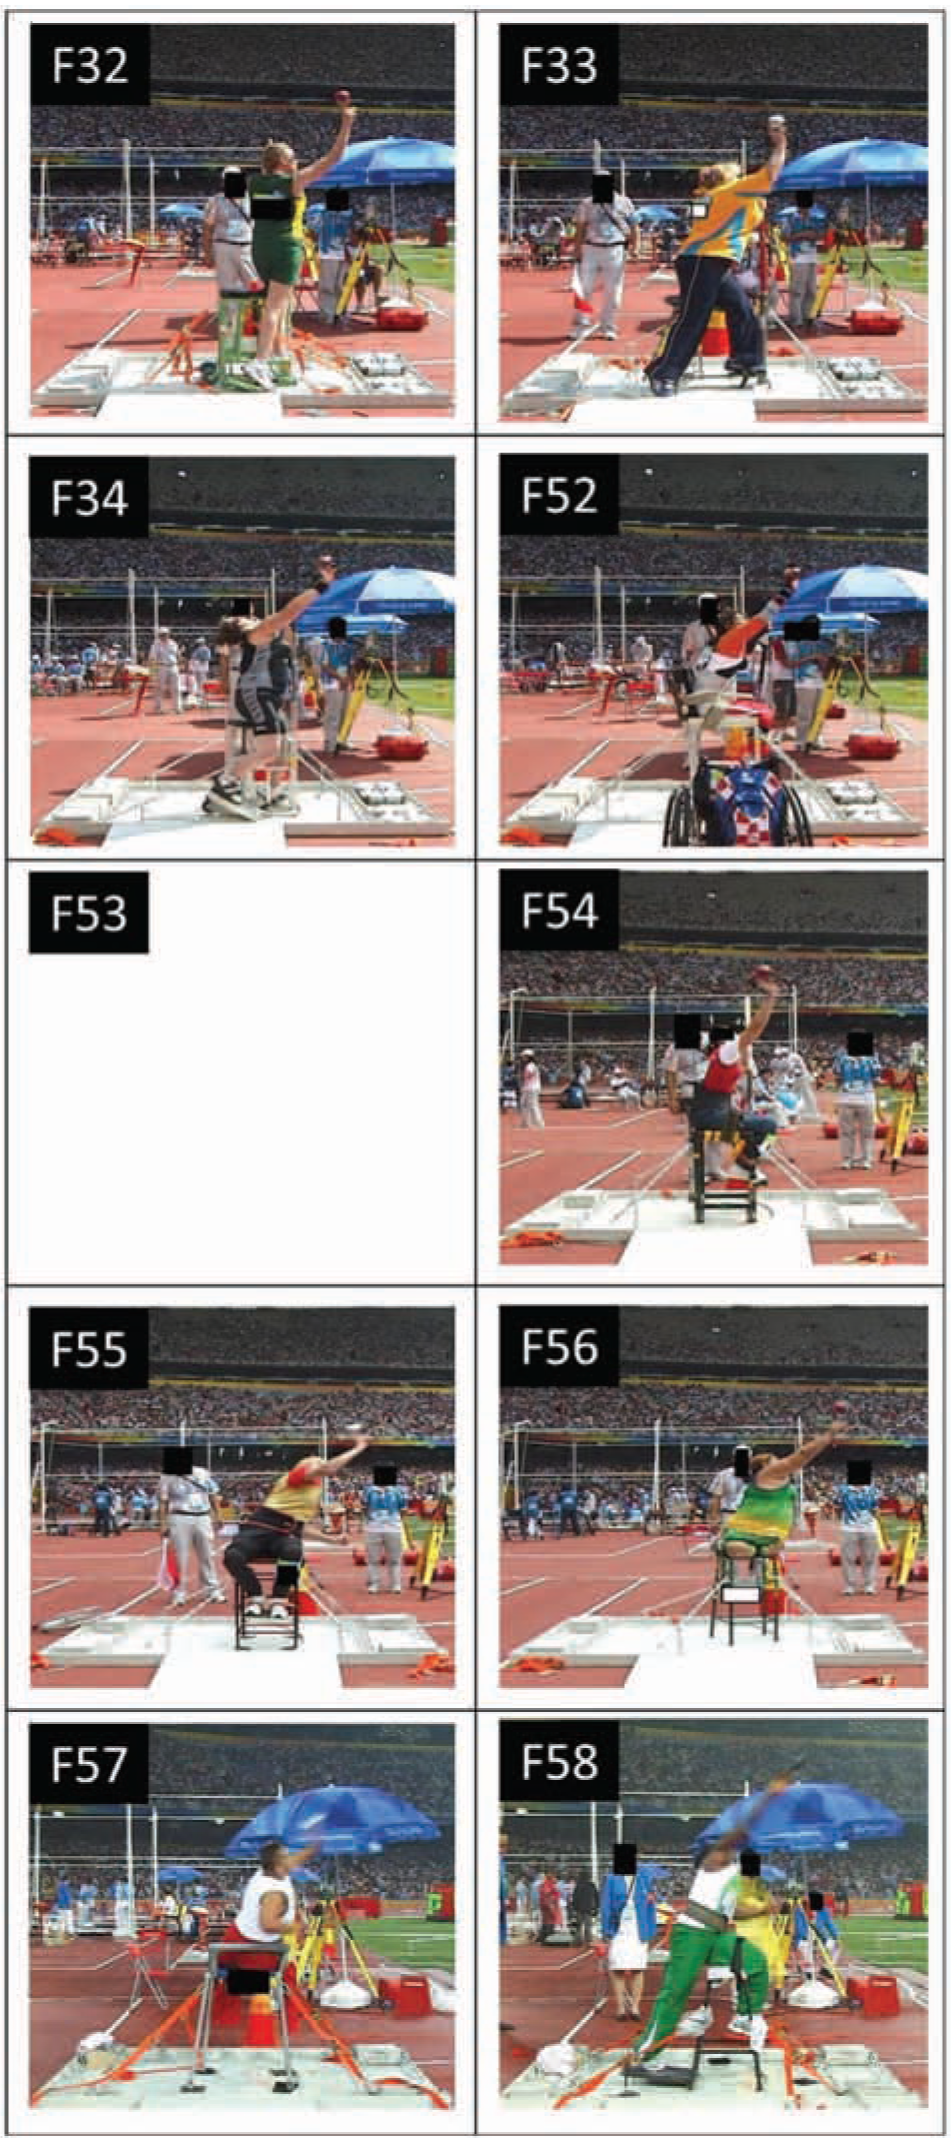
Example of position of female stationary throwers at the instant of release in each class on both groups of disability (i.e. F30s and F50s). No female athlete competed in F53 class.
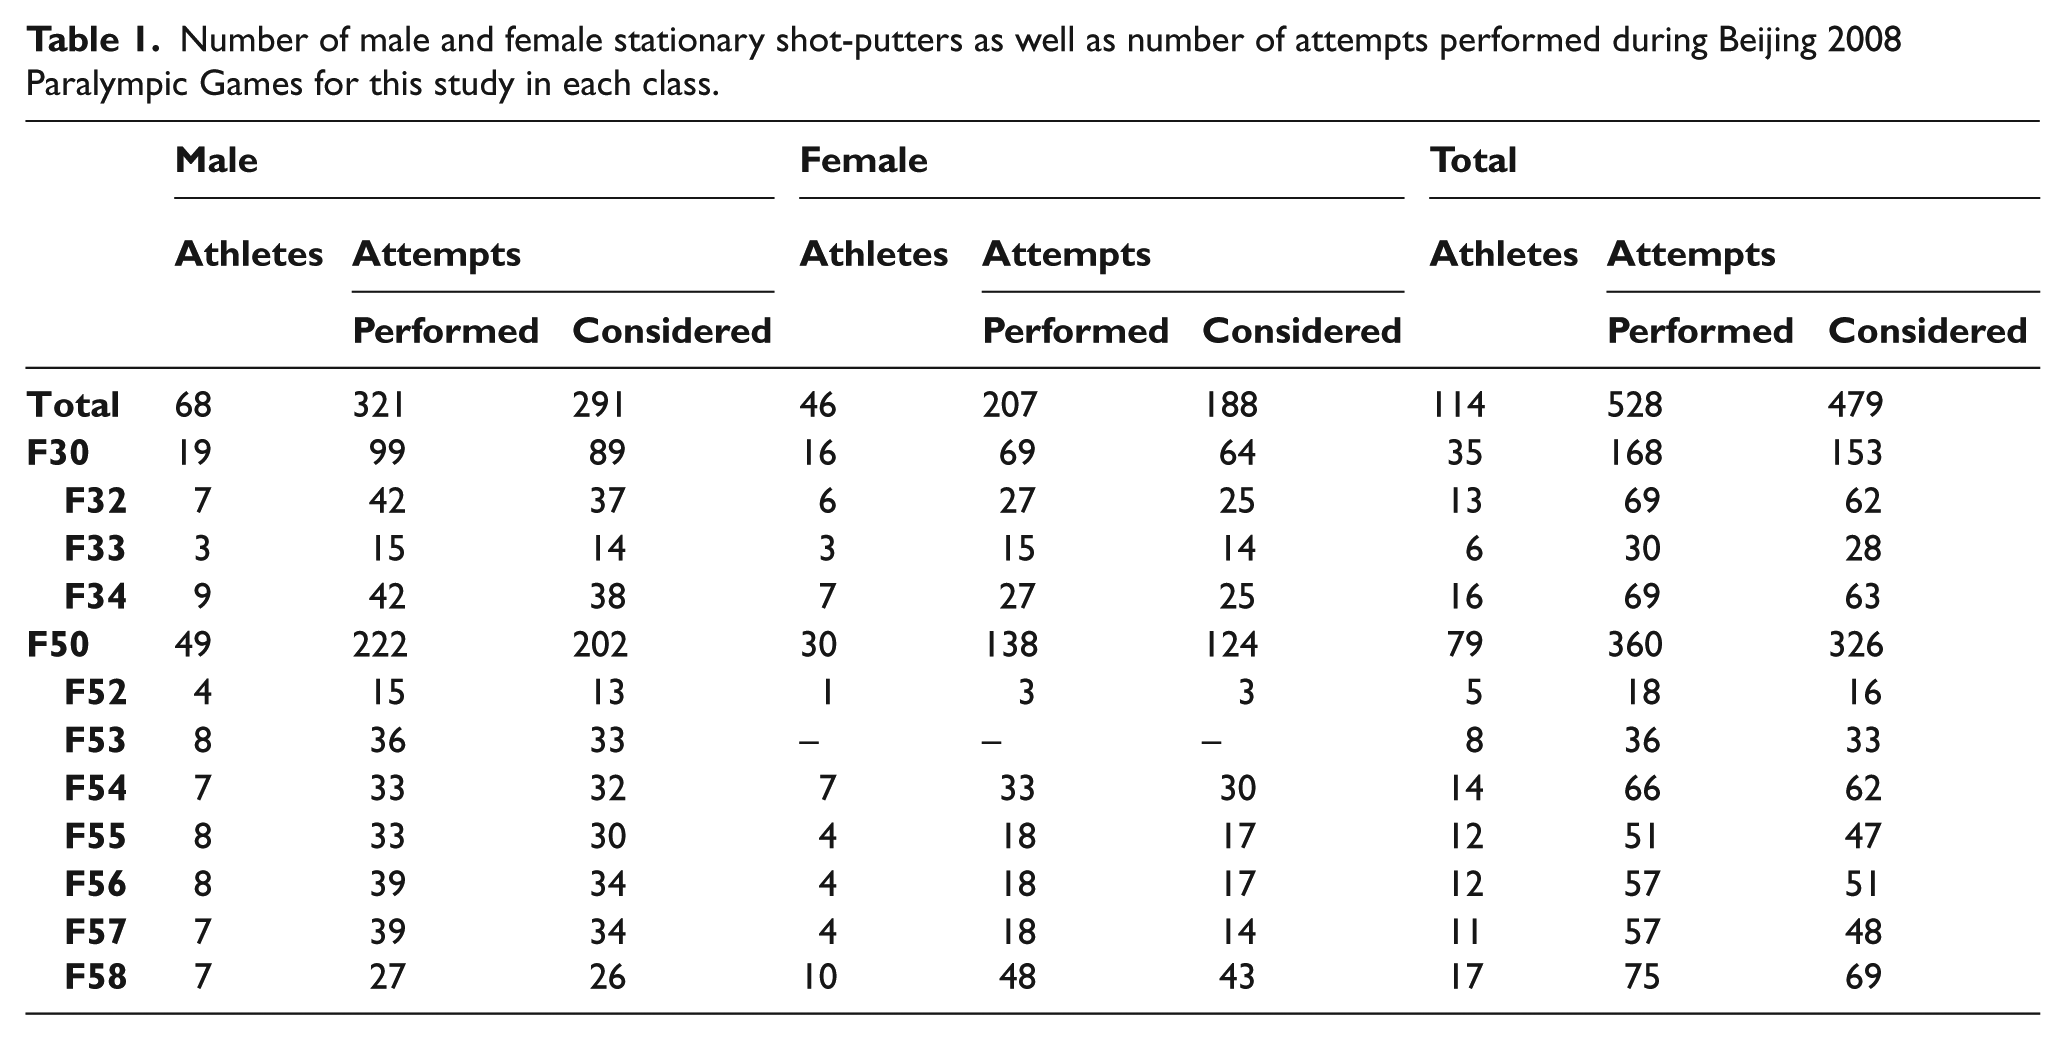
A total of 528 attempts were performed by 114 male and female stationary shot-putters in three F30s (F32–F34) and seven F50s (F52–F58) classes during the course of eight events during the Beijing 2008 Paralympic Games. Only 479 attempts were considered in this study corresponding to all attempts officially measured. 15 The other 59 attempts were failed attempts. No female competed in the F53 class. The breakdown of the number of attempts performed and considered for male and female athletes in each class is provided in Table 1.
Number of male and female stationary shot-putters as well as number of attempts performed during Beijing 2008 Paralympic Games for this study in each class.
Data extraction
Here, the classification-related variable was the performance. It corresponds to the distance measured by the officials between the edge of the plate used to anchor the throwing frame and the footprint left by put on the ground. 15 The performance was chosen because it might be the primary co-founding value in subsequent studies while being accessible with least disruptive measurements.16,17
Indeed, all information presented in this study is extracted from official results sheets provided by (IPC) representatives of the organising committee of the Beijing 2008 Paralympic Games.
Data processing
The inter-dispersion of the performance of male and female was analysed through complementary tools: comparative matrices, performance continuum and dispersion plots.
Comparative matrices
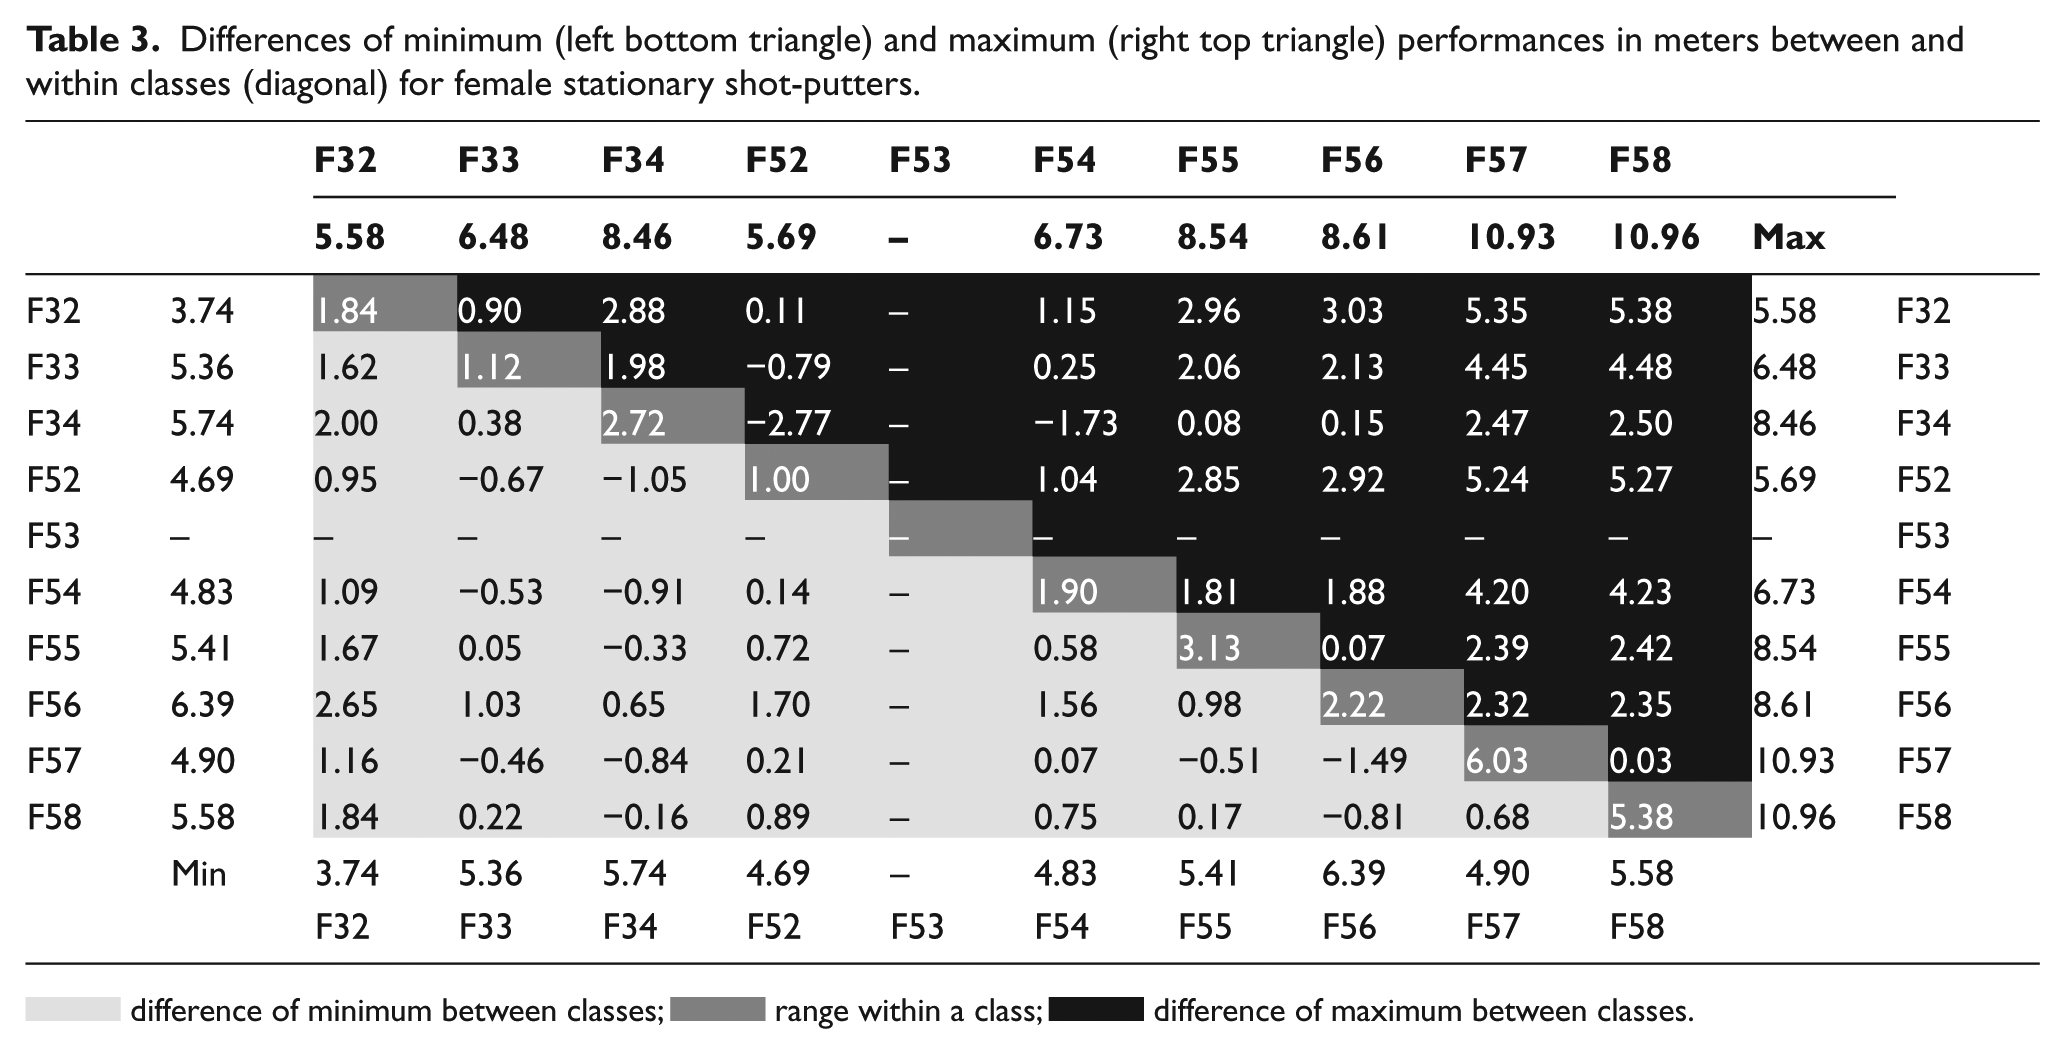
The top and right axes defining the right top triangle of the matrix allow the differences between the best performances across all classes. The left and bottom axes defining the left bottom triangle of the matrix allow the differences between the worst performances across all classes. The latter comparison provides limited information. It was included for completion purposes. The diagonal of the matrix corresponds to the difference between the best and the worst performance for each class. This is the only insight into intra-dispersion.
A negative and a positive value indicate that the performance in the class above is inferior and superior to the class below, respectively. This means that only positive data should be presented in right top triangle of the matrices comparing best performance in an ideal well-rounded classification.
One of the purposes of these matrices is to identify outliers characterised by negative values in right top triangle. According to the strict statistical acceptance of the term, an outlier is an observation that appears to deviate markedly from other data points of the sample in which it occurs. 12 Here, this term refers to the performances of athletes in one class that are higher than the best performance of an athlete in the class above. This situation can be deemed normal and acceptable under a number of circumstances. It can also flag out possible concerns with the classification. Are the performances of the athletes in the first class due to an underestimation of their actual intrinsic abilities (e.g. level of impairment and functional outcome) and/or to better extrinsic qualities (e.g. throwing technique and design of throwing frame)?
Unfortunately, these matrices present information solely related to the best and worst performances in each class. They provide little description and visual representation of the performances in between.
Performance continuum plots
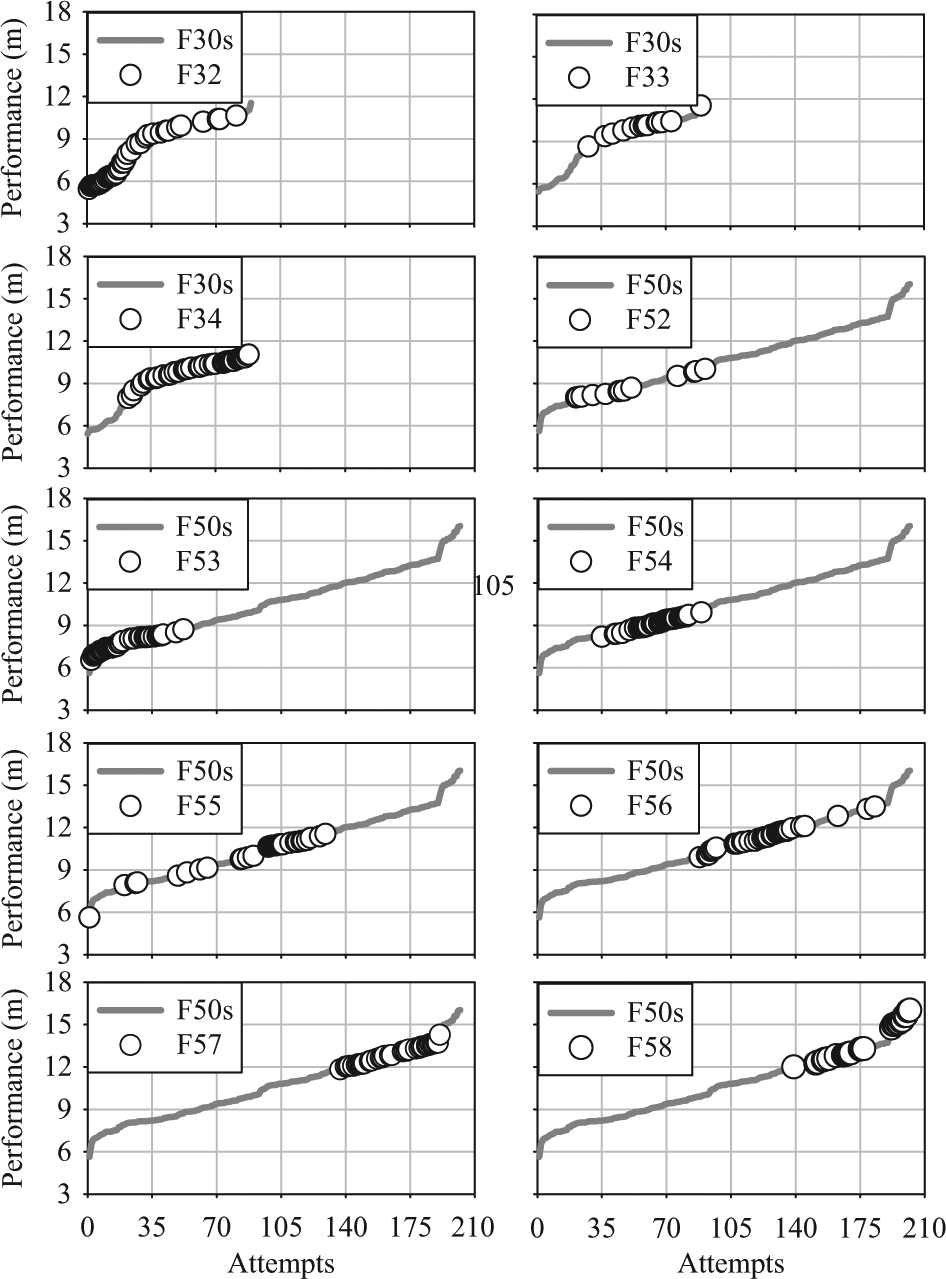
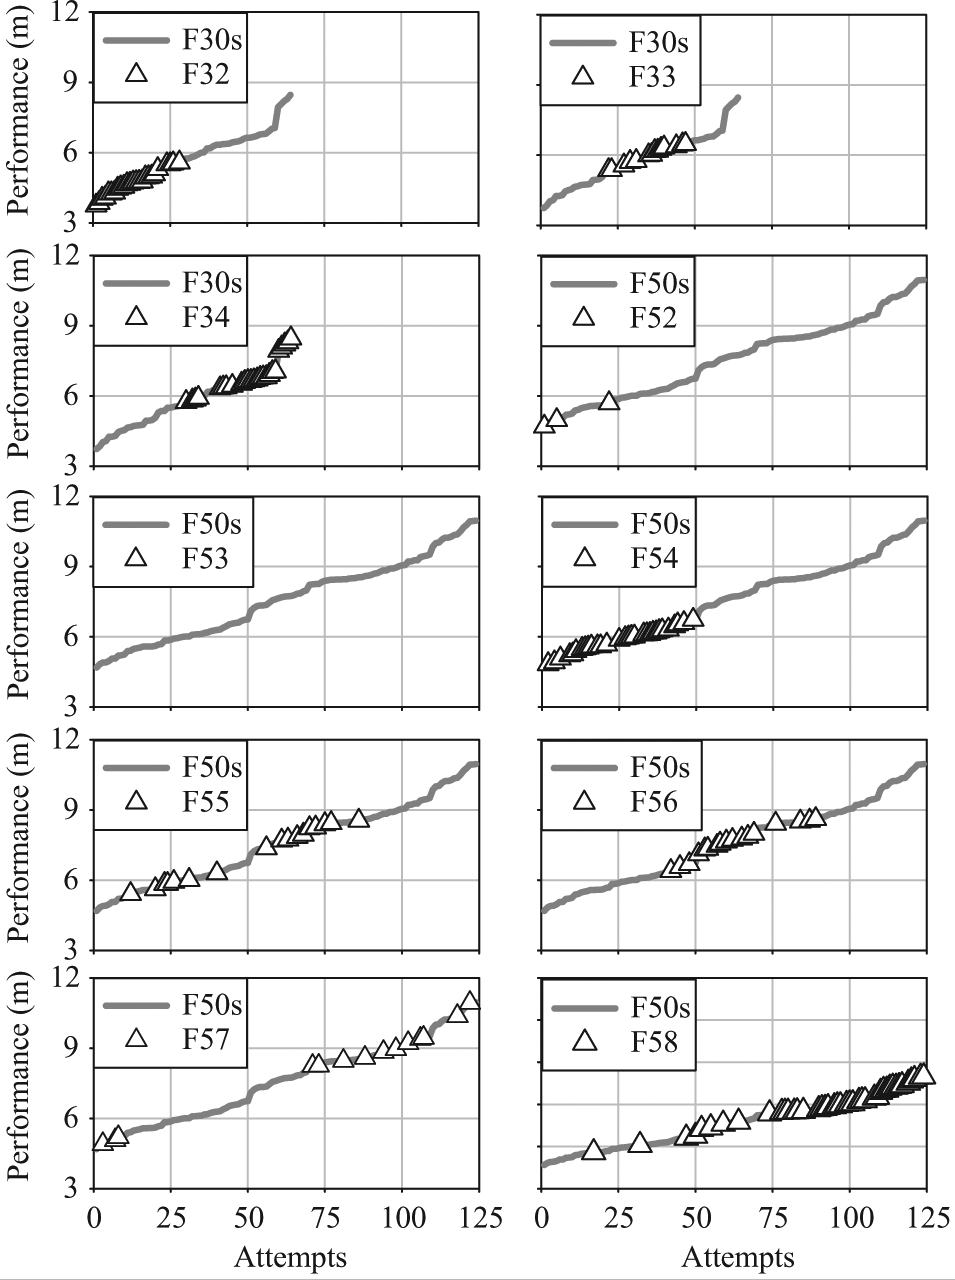
First, all the performances in each group of disability (i.e. F30s and F50s) were sorted in increasing order to facilitate linear representation. This latter was achieved through class-specific plots overlapping the performances in a given class in relation to all performances in the group of disability.
In principle, an ideal classification would be reflected by successive plots showing classes performances that are grouped and sliding upward within the continuum as classification progresses.
These plots provide a visual indication of overall inter-dispersion of one class within the classification continuum but without class-to-class contrasts. Furthermore, synthesising information is tedious due to multiple plots because one plot per class is needed.
Performance dispersion plot
Alternatively, the authors are proposing a performance dispersion plot presenting the performances ranked by increasing order in each class side-by-side accordingly to the classification continuum. In this case, the horizontal axis of the plot is made of block of attempts with a set size equal to the largest number of attempts across all classes. Here again, the ideal classification would be represented by the best performance in each class that is following a steady upward progression within the continuum.
Key information is presented through a single plot synthesising the comparative matrices and all the performance continuum plots. Furthermore, it provides an insight into not only the inter-dispersion but also the intra and between groups of disability dispersions. On the other hand, only a limited number of classification-related variables could be plotted together without compromising the readability.
Results
Comparative matrices
The matrices comparing worst (minimum) and best (maximum) performances between and within classes for male and female athletes are presented in Tables 2 and 3, respectively.
Differences of minimum (left bottom triangle) and maximum (right top triangle) performances in meters between and within classes (diagonal) for male stationary shot-putters.
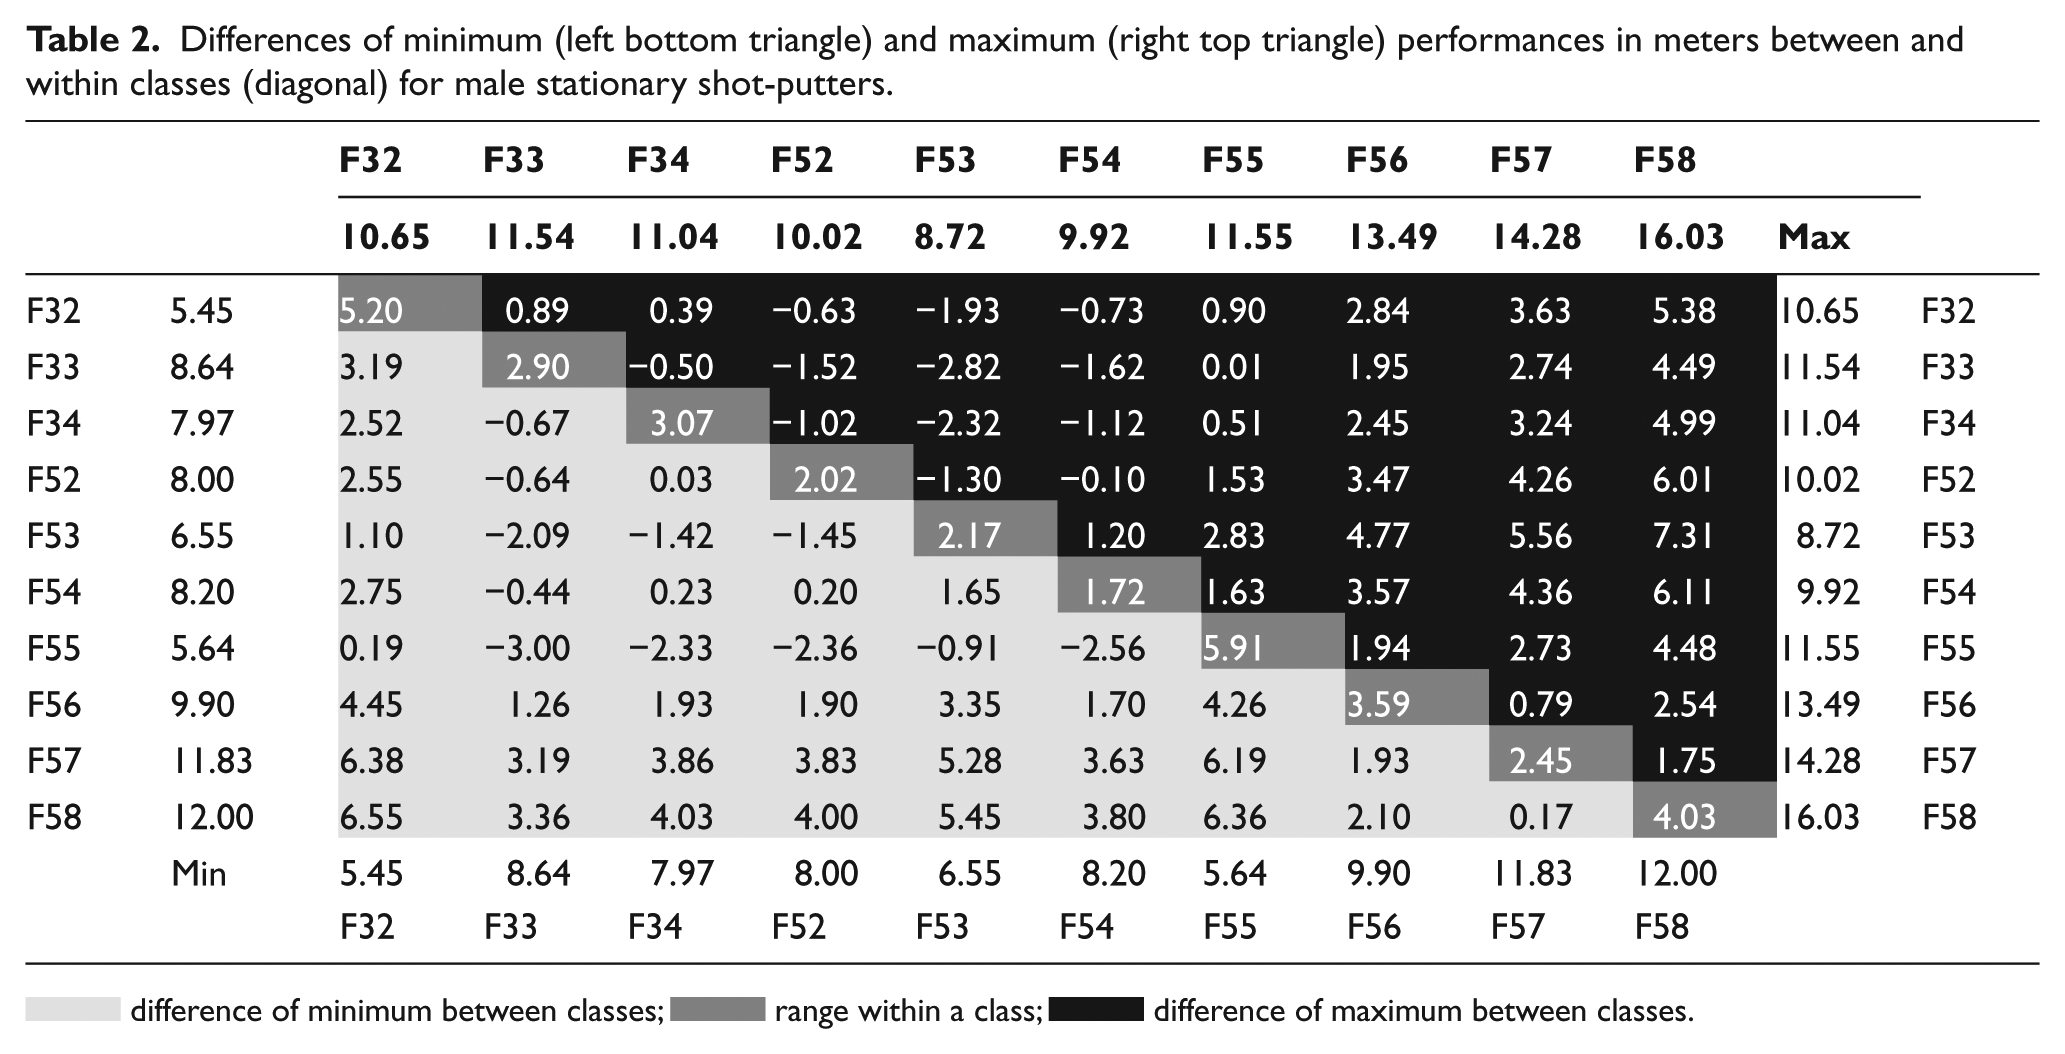
 difference of minimum between classes;
  range within a class;
  difference of maximum between classes.
Differences of minimum (left bottom triangle) and maximum (right top triangle) performances in meters between and within classes (diagonal) for female stationary shot-putters.
 difference of minimum between classes;
  range within a class;
  difference of maximum between classes.
The matrix comparing the male performances revealed two plausible outliers. The gold medallist in the F33 class threw 0.50 m farther than the one in F34 class. The best performance in F52 class was 1.30 m, and 0.10 m better than the ones in F52 and F53 classes, respectively.
No strong outliers were revealed in the comparisons of best female performances. However, the positive difference between the F56 and F55 as well as the F58 and F57 were only 0.07 and 0.03 m, respectively. The negative difference in best performances between the F34 and F52, for male and female athletes alike, must be considered with caution as they belong to two separate groups of disability. The average range of performance for each class was 3.31 ± 1.39 m for the male and 2.82 ± 1.78 m for the female athletes.
Performance continuum
The continuum of the performances of male and female athletes in each class in relation to their group of disability (i.e. F30s and F50s) is presented in Figures 3 and 4. The plot for the female F53 class was included for the sake of graphical continuity, although no data were presented for this class. The average differences of best performances were 1.46 ± 0.46 m between F54 and F58 for the males and 1.06 ± 1.18 m between F55 and F58 for the females.
Continuum of the performances of male stationary shot-putters in each class in relation to their group of disability (i.e. F30s and F50s).
Continuum of the performances of female stationary shot-putters in each class in relation to their group of disability (i.e. F30s and F50s).
Performance dispersion
The overall dispersion of all performances for both male and female athletes in each class is presented in Figure 5. The best performances of female athletes were on average 4.06 ± 1.02 m shorter than the males with an individual difference of 5.07, 5.06, 2.58, 4.33, 3.19, 3.01, 4.88, 3.35 and 5.07 m in F32, F33, F34, F52, F54, F55, F56, F57 and F58 classes, respectively.
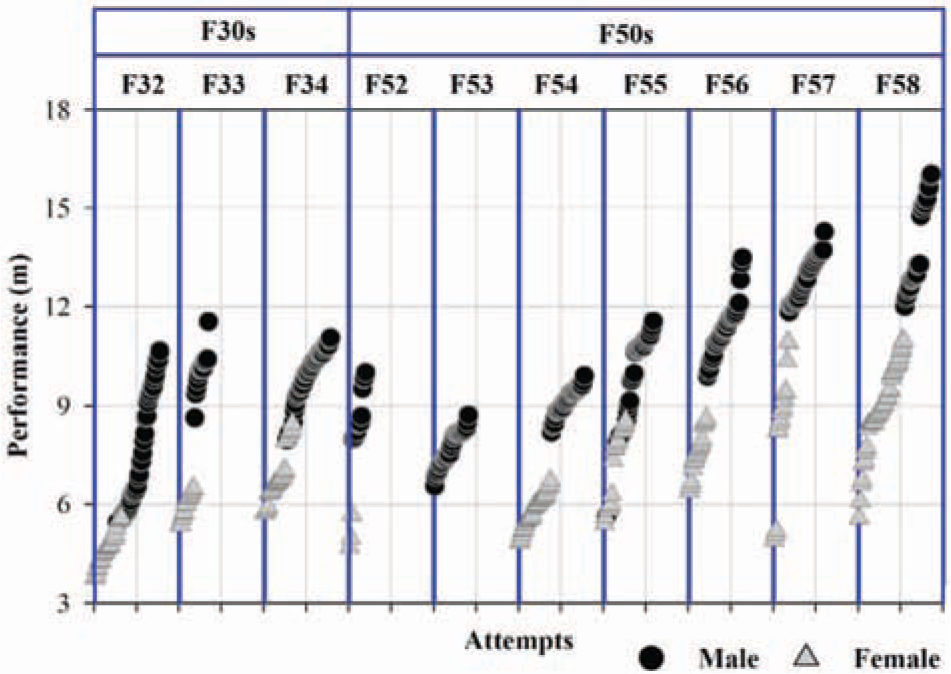
Dispersion of all performances of male and female stationary shot-putters in each class placed side by side.
Discussion
Tools for evidence-based classification
This study confirms the benefits of the comparative matrices, performance continuum and dispersion plots to analyse and to represent classification-related variables. By definition, the three tools are partially redundant since they all emanate from the raw performances. Therefore, they are valuable together or individually to report inter-dispersion and, to a certain extent, intra-dispersion of classification-related variables. These tools present various levels of breadth, length and readability. This study highlights the specificity of each one. The comparative matrices are particularly helpful to spot outliers. The performance dispersion plot is a single graph providing a clear overview of the distribution of the performance within and between classes.
Inter-dispersion of performance
The performance was considered as the initial classification-related variable of choice because it is potentially the primary co-founders of other variables. In other words, a linear relationship between performance and other variables,14,18 such as feet positions, 19 features of the throwing frames 18 or parameters of the put’s trajectory at release, 20 would de facto mean a linear relationship between these variables and the classification.
The results demonstrate that this assumption is valid for the best performances of female stationary shot-putters participating in the Beijing 2008 Paralympic Games. However, this assumption must be considered more carefully for the male athletes giving the occurrence of two outliers.
This study provides limited ground to validate this assumption within each class. Indeed, the apparent linearity of the performances within all classes is mainly due to the preliminary ranking of all performances going from the worst to the best.
Some elements validating the classification
This study reveals only two male outliers in the F33 and F52 classes. Further observations of the functional ability, technical skills and design of the frame of these athletes might be needed. Nonetheless, the differences of distance thrown appear within a range plausibly due to athletic attributes. Therefore, these outliers could be considered as anecdotal. Consequently, the performance dispersion of the stationary shot-putters participating in the Beijing 2008 Paralympic Games seems to be conformed to the expected outcomes of the classification.
Limitations and future studies
This analysis discarded the failed attempts. One could argue that they might also reflect the level of performance, functional outcome and, eventually, the classification. The intra-dispersion was summarily presented through the raw and average range of performances in each and across classes, respectively. Further analysis was deemed outside the scope of this study.
The comparison of performance between genders was also kept a minimum. Additional comparative matrices and statistical analyses comparing differences of performances within each class and, eventually, each group of disability would also be needed.
The tools presented here will facilitate a number of subsequent longitudinal studies. Some could focus on the inter-dispersion of other classification-related variables associated with the following:
Throwing techniques, such as the range of movement of the trunk and the throwing upper limb as well as the parameters of put’s trajectory at release (i.e. position, speed and angle)9,18,20–29
Design of the throwing frame, such as the feet positions, the seating arrangement and the usage of the pole18,30
Furthermore, the possibilities for cross-sectional studies of inter-dispersion of classification-related variables are endless, particularly for those focusing on complementary statistical analyses and simulation of new possible classifications. 31 Both longitudinal and cross-sectional studies will be essential to further develop a classification based on evidence.
Conclusion
This study presented some tools capable of providing an overview of the inter-dispersion of classification-related variables. This was the first attempt to describe the inter-dispersion of the performance of male and female athletes participating in the stationary shot-put events during the Beijing 2008 Paralympic Games. Some key information was made available to all participants of stationary throwing events facing the challenge to develop an evidence-based classification.
This study is a stepping stone to biomechanical analyses of stationary throwers, particularly on the eve of the London 2012 Paralympic Games where new evidences could be gathered.
Footnotes
Acknowledgements
The author wishes to acknowledge Dr Yves Vanlandewijck and Dr Walter Thompson for facilitating access to the results sheets and Alison O’Riordan and Scott Goodman for their technical insight.
Funding
This research received no specific grant from any funding agency in the public, commercial, or not-for-profit sectors.