
Abstract
Background:
Nowadays, a transfemoral amputation prosthesis can be fitted to the skeleton using an osseointegrated implant, that is, without a socket. Treated patients have reported improvements in quality of life.
Objectives:
To investigate differences in prosthetic costs and service of osseointegrated prostheses compared to socket-suspended prostheses.
Study Design:
Retrospective cost analysis and survey.
Methods:
Costs and noted visits during in mean ~10 years were taken from one prosthetic workshop and included 50 patients with unilateral transfemoral amputation (36 socket-suspended prostheses, 20 osseointegrated prostheses, 6 patients used both kinds of prostheses). A survey comprised 71 patients (69% males; mean age = 52.3 year; cause: 66% trauma, 23% tumour, 11% other).
Results:
Statistically significant fewer workshop visits were shown with osseointegrated prostheses compared to socket-suspended prostheses (cost analysis: 3.1 vs. 7.2 visits/year, survey: 3.4 vs. 9.2 visits/year). The mean total annual cost of new prostheses, services, repairs and adjustments was 14% lower for osseointegrated prostheses than socket-suspended prostheses (€3149 and €3672 respectively, p = 0.632). A subgroup analysis of recent produced prostheses revealed cost of material to account for 92.5% for osseointegrated prostheses and 70% for socket-suspended prostheses.
Conclusion:
Despite significantly fewer visits for prosthetic service the annual mean costs for osseointegrated prostheses were comparable with socket-suspended prostheses. This study suggests it is due to more advanced prosthetic components being used with osseointegrated prostheses.
Clinical relevance
Patients with osseointegrated transfemoral prostheses require fewer visits for prosthetic service than patients with socket-suspended prostheses. The total prosthetic cost does not seem to differ between the two kinds of prostheses. However, more sophisticated prosthetic knees were more frequently used with osseointegrated prostheses, which could explain the lack of differences.
Keywords
Background
The common way to suspend an external prosthesis is by using a socket fitted to the residual limb. 1 A number of problems related to the prosthesis and especially to the socket have been reported and such problems have also been shown to negatively influence daily living and quality of life among patients.2–6 Due to residual limb volume changes, poor suspension, pain, sores and/or discomfort, adjustments of the socket or the production of a new socket are regularly required.7–9 The production of a new socket or a new prosthesis has been reported to be needed about every 1–3 years.3–5,7–10 The total cost of the artificial limb also involves the number of visits that have to be made to a prosthetic workshop. Pezzin et al. 4 reported a mean of 9 ± 11 such visits a year among a large group of patients (n = 935) with different levels of amputations.
Using the surgical insertion of an implant into the residual skeleton, an artificial limb can today be attached via a transcutaneous connection, without any prosthetic socket.11–13 Osseointegration of Prosthesis for Rehabilitation of Amputees (OPRA) system developed in Swedish uses an implant made of pure titanium and the treatment is based on the method of osseointegration, which was first described in dental care.14,15 For amputees, the OPRA treatment requires two surgery sessions, about 6 months apart, followed by a period of rehabilitation.11,16,17 The artificial limb itself used after osseointegration treatment (OI-prosthesis) requires some specific components, which are not used for conventional socket-suspended prostheses (S-prosthesis), such as an attachment device to connect the prosthesis to the implant16,17 (Figure 1).
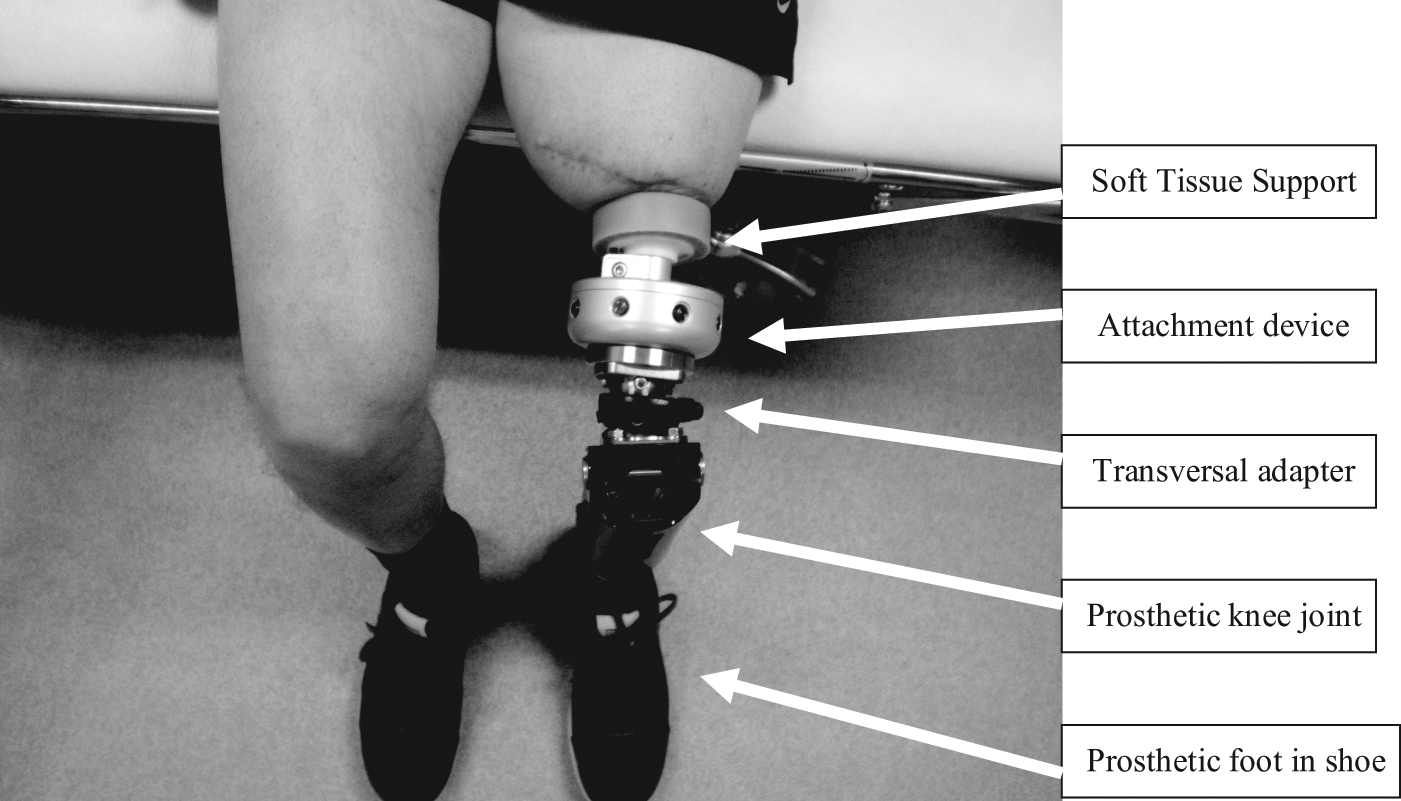
Patient sitting with an OI-prosthesis. Closest to the residual limb, there is a soft tissue support in silicone. Between the soft tissue support and the prosthetic knee unit is the attachment device which includes a fail-safe function.
The osseointegration treatment in Sweden is centralised to one single location in Sweden, the Centre of Orthopaedic Osseointegration (COO) at the Sahlgrenska University Hospital, Gothenburg. The COO has so far the largest experience in the world regarding osseointegrated prostheses (OI-prostheses) with a total number of about 150 patients treated between 1990 and 2009. The majority of those patients have a unilateral transfemoral amputation (TFA) due to trauma or tumour. 16 The group of patients seeking this treatment distinguishes themselves in some important ways from other patients with amputations. First, many have especially difficult conditions of the residual limb (i.e. extreme short residual limb and/or poor soft tissues) and have experienced severe problems using a prosthetic socket, in some cases, to the extent that prosthetic use is not an option. Second, the majority of patients live far from our location, in other parts of Sweden or in another European country, and have a long distance to travel for the treatment.
The published benefits of this novel type of prosthetic attachment include increased prosthetic use and enhanced quality of life,18,19 improved hip range of motion and sitting comfort, 20 improved hip and pelvic motion during gait 21 and a high functional level. 22 The costs of the OI-treatment could briefly be described to include preoperative examinations, surgeries, implant and surgical equipment, hospitalisation, prosthetic rehabilitation and costs dealing with eventually complications. As yet there is no study reporting on the costs for any treatment regarding bone-anchored amputation prostheses. Moreover, there is no study that has investigated whether there are any differences with regard to the frequency of service required at a prosthetic workshop for patients supplied with bone-anchored prostheses and whether the cost of the prosthetic device itself differs.
The aim of this study was to describe and investigate differences regarding prosthetic costs and prosthetic service for patients provided with unilateral transfemoral OI-prostheses as compared to conventional S-prostheses.
Methods
To obtain a sufficient number of patients, this retrospective study is based on two different methods with two somewhat different populations; (1) a prosthetic cost analysis including a small group of patients who had received all prosthetic service at a single workshop and for whom we were able to control all prosthetic costs during a reasonable number of years and (2) a mailed self-report survey including a larger cohort of patients. Both include adults (over 20 years) with a unilateral TFA for at least 1.5 years, who have been fitted with S-prostheses and/or OI-prostheses. The patient population is illustrated in Figure 2 and described in detail under each subheading.
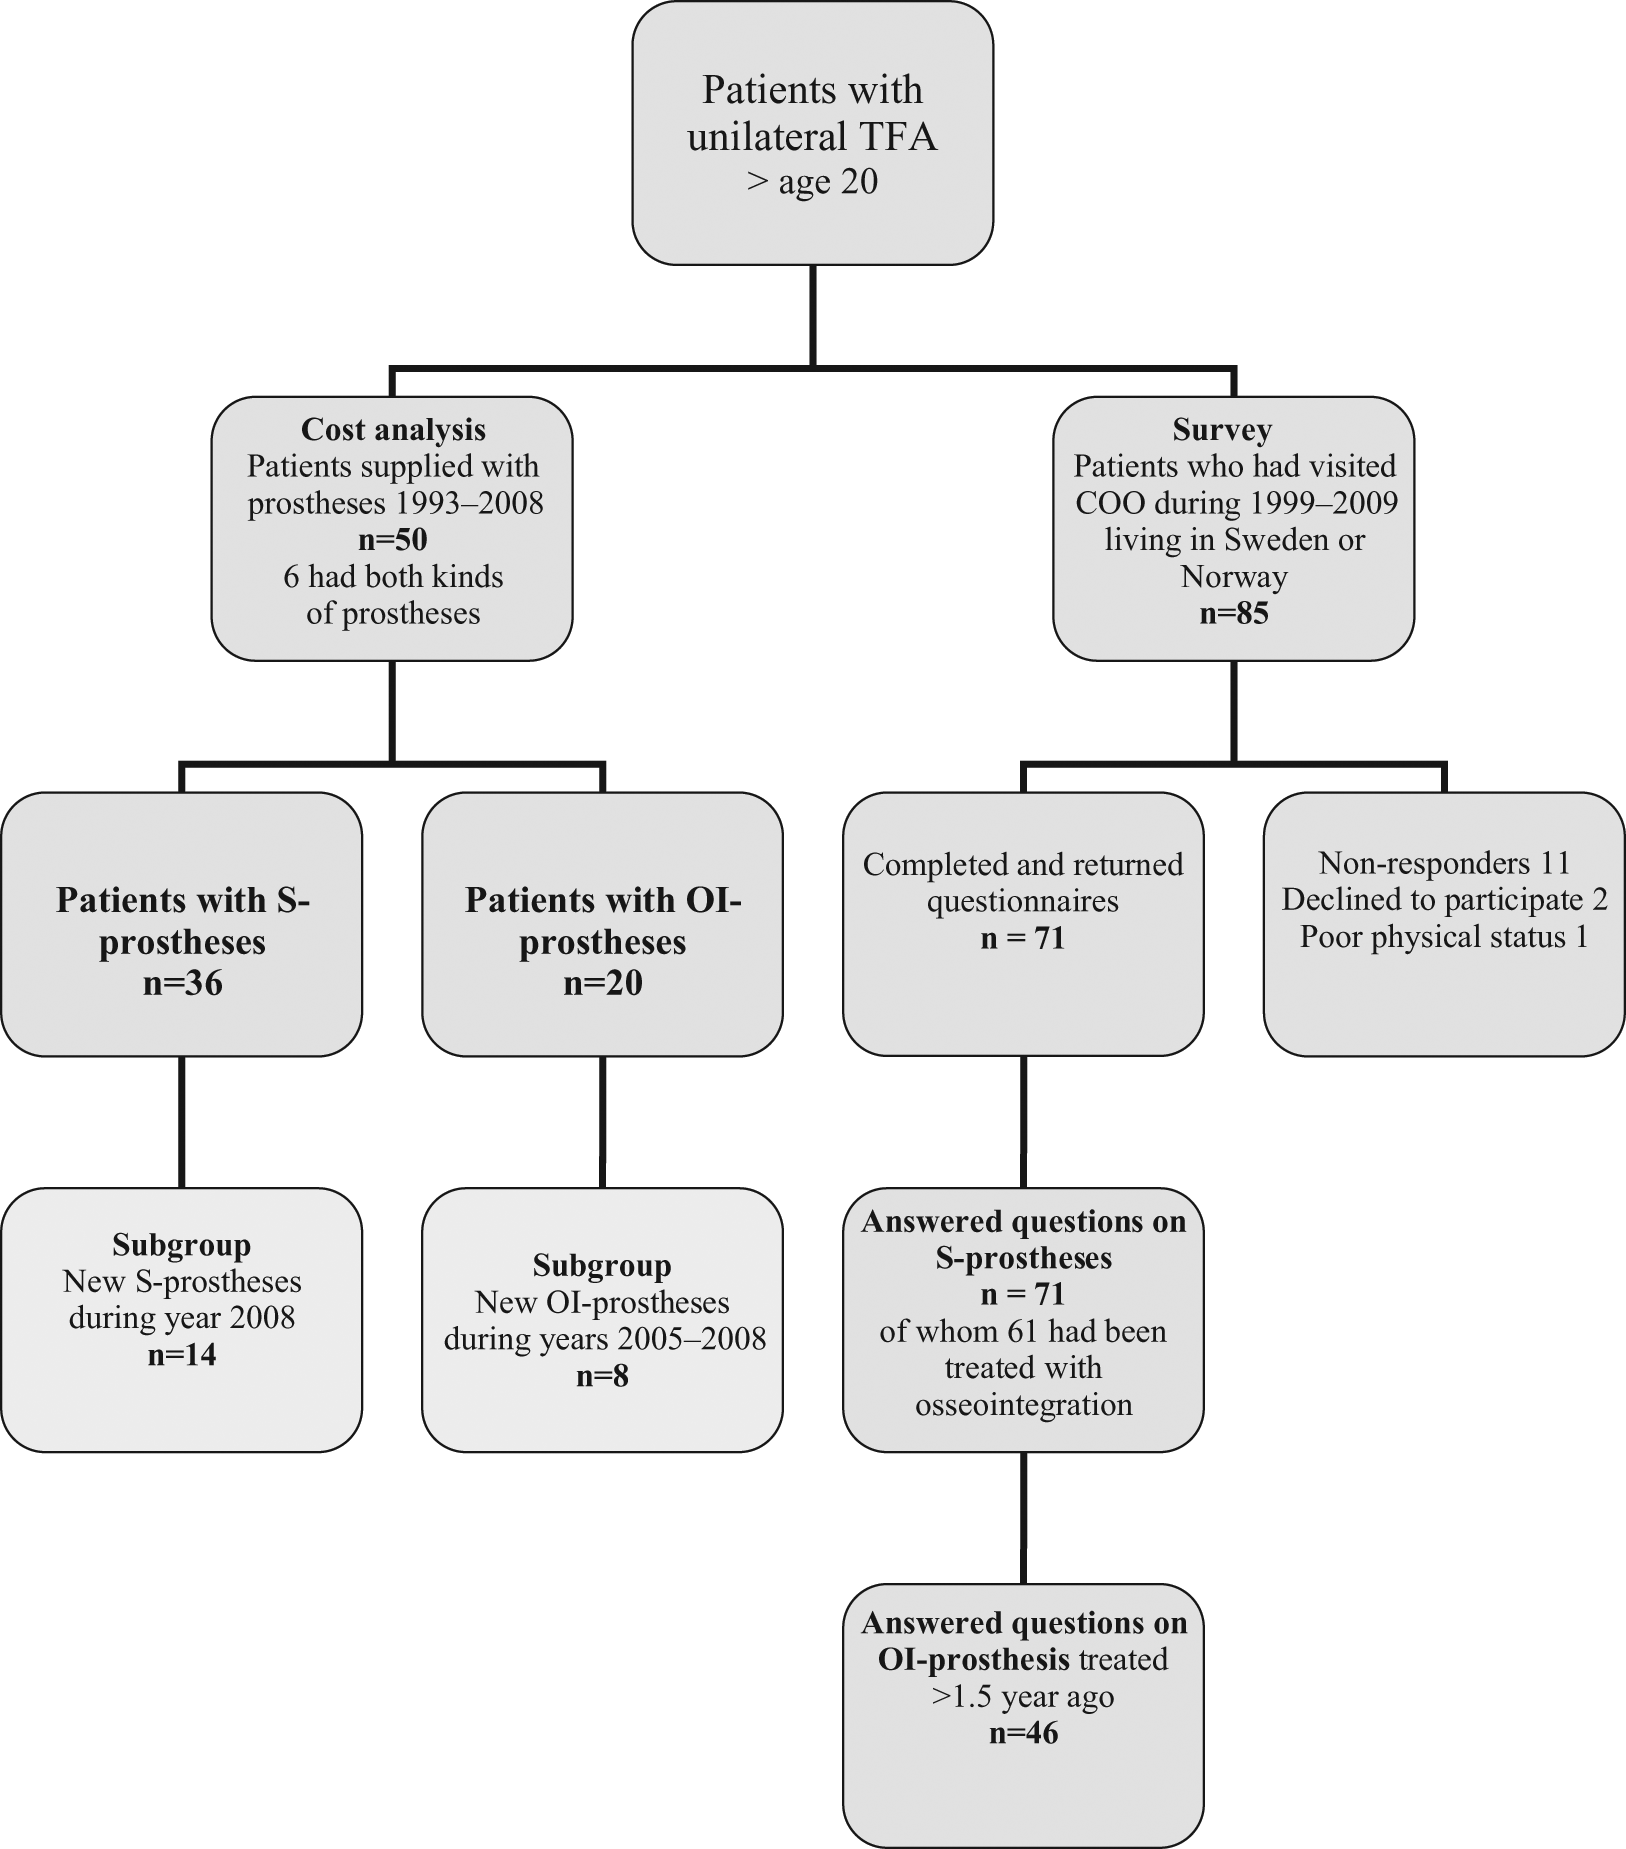
Flow of participants in the prosthetic cost analysis and the survey. All patients in the cost analysis had received all prosthetic services at one single prosthetic workshop.
Prosthetic cost analysis
The prosthetic cost analysis was limited to the health-care costs (direct costs) presented as the annual-average cost. 23 The comparisons of prosthetic resources were made between S- and OI-prostheses. For both, the prosthesis was defined as the external artificial limb which the patient don and doff. It includes all components from the socket or attachment device at the proximal end to the prosthetic foot at the distal end. All costs were taken from one single prosthetic workshop (Department of Prosthetics and Orthotics at Sahlgrenska University Hospital, Gothenburg, Sweden). This is the only workshop with more experience of patients with OI-prostheses. To be included, patients with S-prostheses should have received all their prosthetic service during the time period exclusively at this workshop. The same applied to patients with OI-prostheses after they had received the treatment. The exclusion criterion for both groups was amputation due to diabetes and/or arthrosclerosis. The analysis involved all prosthetic costs and the number of visits for 50 patients fitted with S-prostheses and/or OI-prostheses during the period 1993–2008 (Figure 2). Information about all resource consumption was collected individually and multiplied by a unit cost for each item or service. The costs included all salaries at the workshop, investments in equipment and buildings and consumer goods of all kinds. The estimated annual cost was calculated and included the cost of new prostheses, services, repairs, adjustments and maintenance. All costs are given in Euros (€) at price level in year 2009 (1€ = 10.30 SEK).
To be able to further compare the two study groups, the price level for the prosthetic knee units was noted. The price level was ranked from 1 to 3, with 1 representing the lowest price level (< €2400) and 3 the highest (> €7300). If, during the study period, a patient had been fitted with units that belonged to different price levels, the most expensive knee unit was chosen. In two subgroups (n =14 S-prostheses, n = 8 OI-prostheses, Figure 2), the cost to produce a totally new prosthesis was analysed in more detail. The cost of a new S-prosthesis included making a cast, trying a test socket, manufacturing the prosthesis, trying it on and completing it with a cosmetic cover. A new OI-prosthesis included manufacturing the prosthesis, trying it on and completing it with a cosmetic cover. For each new prosthesis, the number of working hours was registered. Furthermore, the total cost per hour was calculated and subdivided into the cost of material and the cost of labour.
Survey
The aim of the survey was to reach a larger group of patients and to assess their experiences regarding visits to prosthetic workshops. To obtain the appropriate group of patients, that is, those with extra difficulty using S-prostheses, only patients who had visited the COO were included. A self-report questionnaire, constructed for the study, was sent to the cohort of patients visiting the COO between year 1999–2009 and who were citizens of Sweden or Norway. Patients who were not able to read and understand Swedish were excluded. A visit to the COO can be for the purpose of follow-up after osseointegration treatment or for preoperative evaluation. As a result, the study population in the survey includes patients treated with OI-prostheses and patients who have been assessed but yet not treated and those with a decision not to be treated. Demographic information was taken from the records at the hospital. The questionnaire focused on the patient’s need for prosthetic service since the amputation and was divided into two parts; the first relating to the time period, in years, when the patients used S-prostheses and the second to the period, in years, using OI-prostheses. The length of each period was registered. With regard to S-prostheses, the patient was asked to recall and estimate the total number of sockets he/she had been provided with since the amputation. Based on these estimates the mean number of sockets reported per patient and year were calculated. Moreover, for both S- and OI-prostheses, the patient was asked to estimate the number of annual visits he/she had made to an orthopaedic workshop and the relative distribution of the reasons for the visits divided into those related to (a) the socket and/or suspension (including visits related to the attachment device for OI-prostheses), (b) the prosthetic components (e.g. foot or knee component), (c) the cosmetic cover or (d) other reasons. All were asked to answer the first part of the questionnaire (questions on S-prostheses), and those who had passed 1.5 years since the osseointegration treatment were also asked to answer the second part including questions on OI-prostheses. A package including study information, informed consent, the questionnaire and a response envelope was distributed to all the 85 patients who fulfilled the inclusion criteria. A reminder was sent 2 weeks later to those who did not answer the first time. A total of 71 patients (83%) answered the questionnaire and the majority lived in Sweden (74% Swedish and 26% Norwegian citizens). Among the 14 not taking part, 2 were treated with osseointegration and 12 were not. All 71 answered questions on S-prostheses and a subgroup of 46 patients (65%) also responded to questions on OI-prostheses (Figure 2). Among the 71 patients, another 15 had been treated with osseointegration but had yet not passed 1.5 years since the treatment.
Finally, to validate the self-reported and estimated number of visits to a workshop with those noted in the cost analysis, the figures were compared for the 22 patients who were actually included in both parts of the study.
The study was approved by the Research Ethics Committee at the University of Gothenburg. All patients included in the survey gave their written informed consent to participate.
Statistics
Descriptive data are presented as the mean ± standard deviation (SD), median (Md), minimum and maximum. For analyses of differences regarding costs, the independent samples t-test was used. For analyses of differences regarding the number of visits to the workshop, nonparametric statistics was used. A value of p <0.05 was regarded as statistically significant. The Statistical Package for the Social Sciences (SPSS) version 18.0 was used for statistical calculations.
Results
Prosthetic cost analysis
Among the 50 patients (36 S-prostheses, 20 OI-prostheses) 6 were included in both groups as they had been fitted with both kinds of prosthesis during the study period (Figure 2). Demographic descriptions as well as the mean number of annual visits recorded at the prosthetic workshop and the mean annual prosthetic cost are presented in Table 1. Patients with S-prostheses had visited the workshop significantly more often than patients with OI-prostheses (mean 7.2 vs. 3.1 annual visits, p < 0.0001). The mean total annual cost of new prostheses, services, repairs and adjustments to OI-prostheses was 14% lower than for S-prostheses (S-prostheses €3672, OI-prostheses €3149, p = 0.632). The distribution of price levels for prosthetic knee units is shown in Figure 3. The intermediate price level was the most common in both groups. Patients with OI-prostheses had been supplied with the more expensive knee units to a larger degree (25%) when compared with the group of patients with S-prostheses (8%).
Patient demographics and results from the prosthetic cost analysis for patients provided with prostheses suspended with S-prostheses and OI-prostheses.
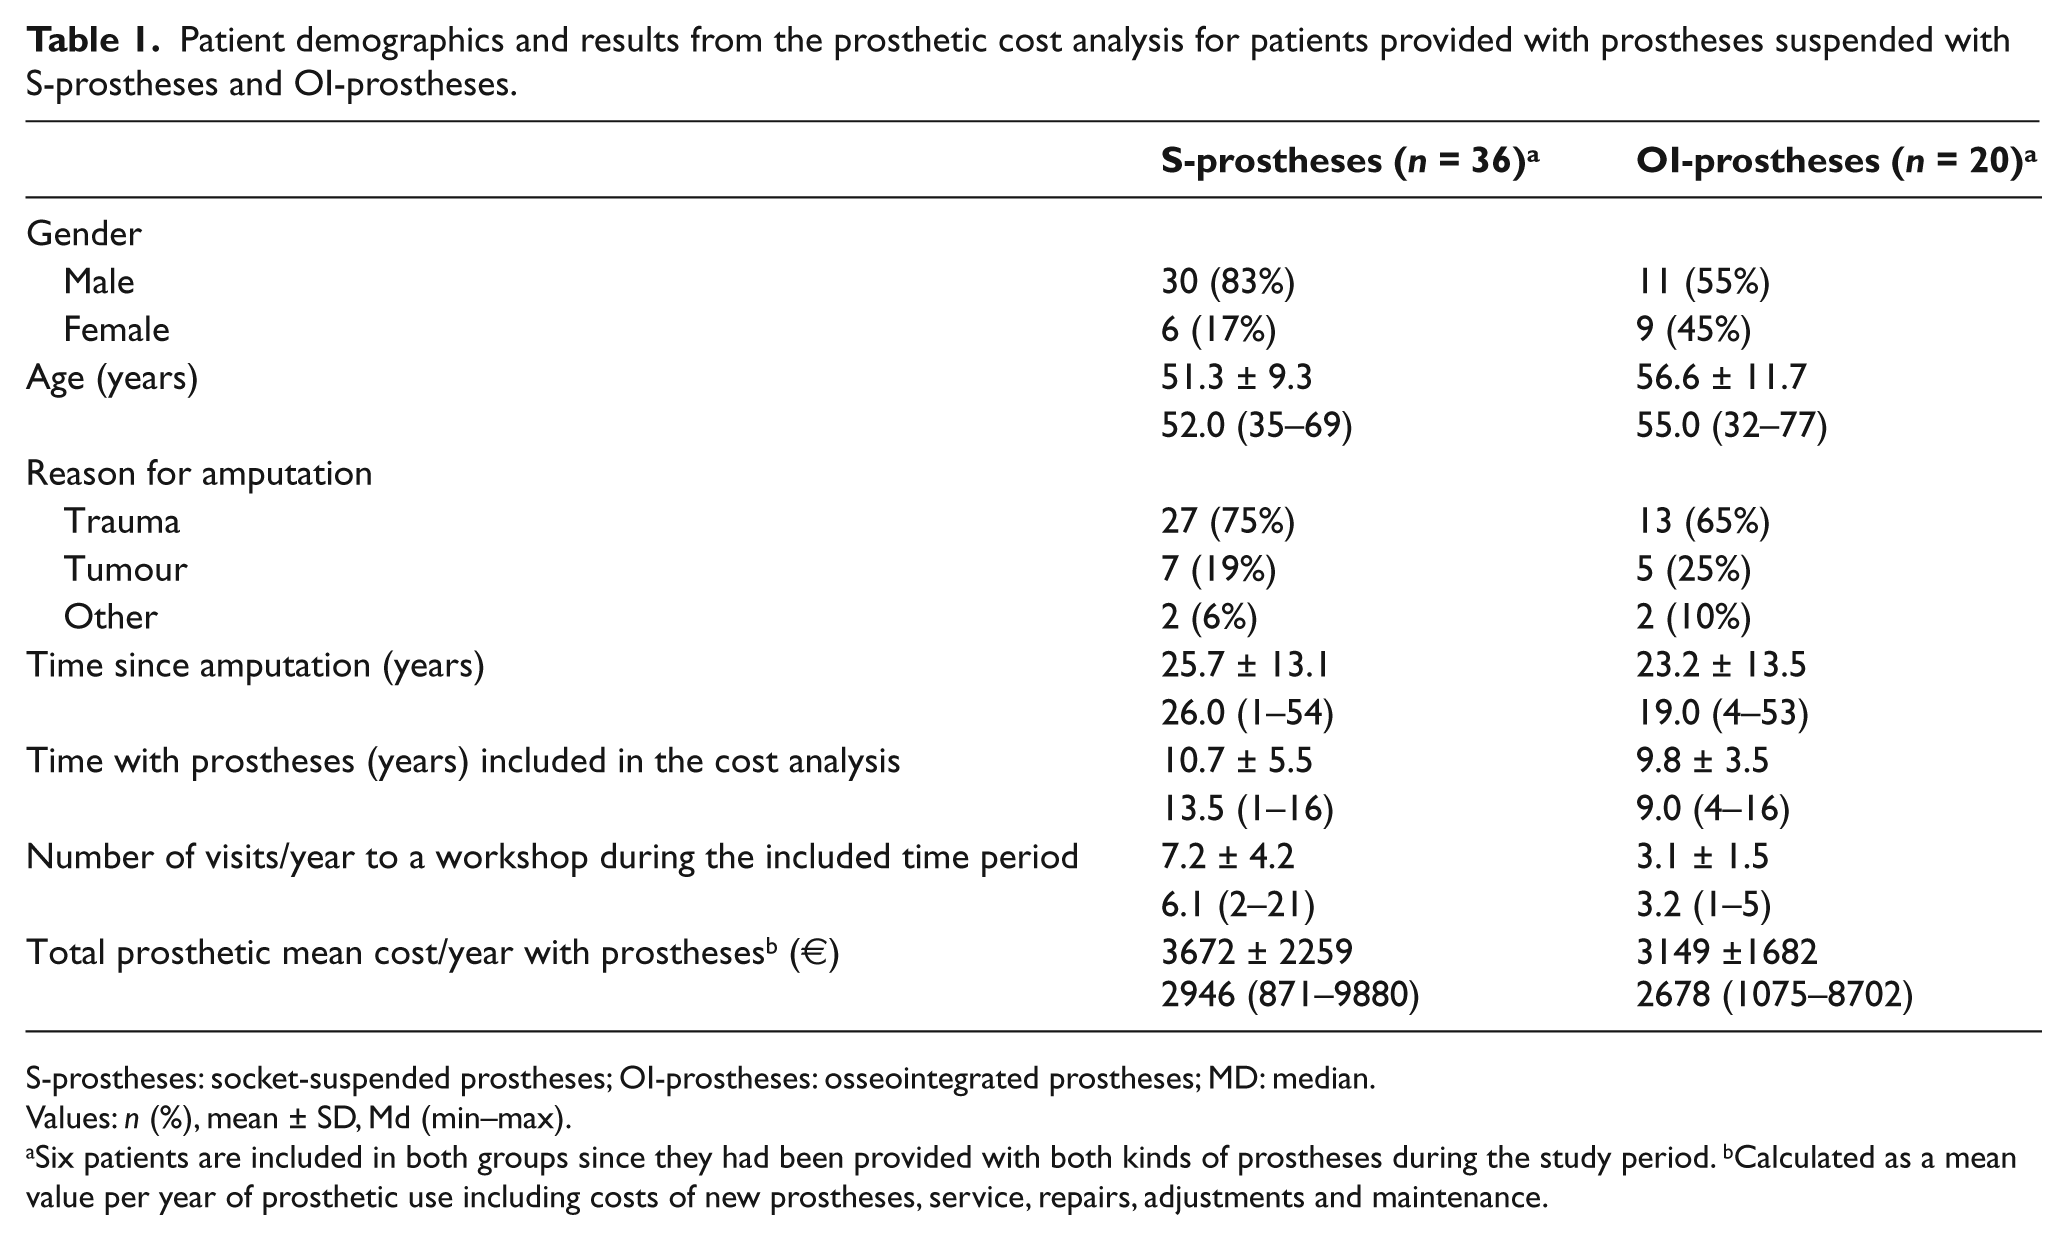
S-prostheses: socket-suspended prostheses; OI-prostheses: osseointegrated prostheses; MD: median.
Values: n (%), mean ± SD, Md (min–max).
Six patients are included in both groups since they had been provided with both kinds of prostheses during the study period. bCalculated as a mean value per year of prosthetic use including costs of new prostheses, service, repairs, adjustments and maintenance.
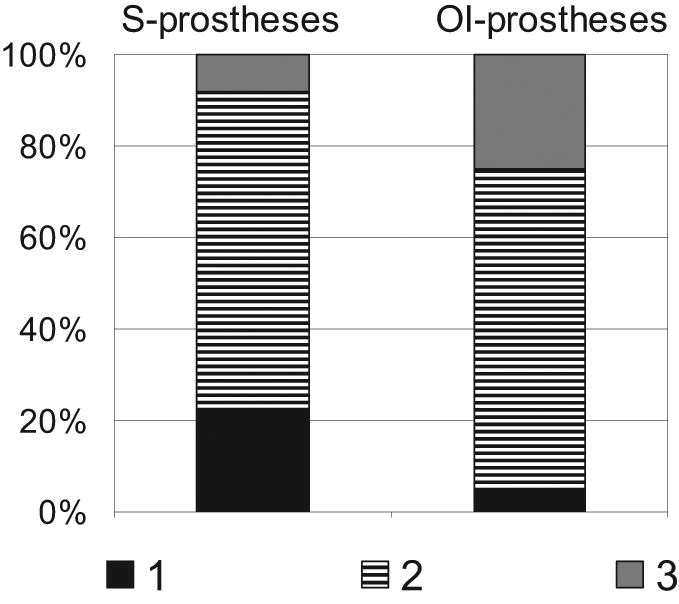
Distribution of price levels of prosthetic knee units for S-prostheses (n = 36) and OI-prostheses (n = 20).
Costs of new prostheses in the two subgroups
The average cost to manufacture new prostheses in the subgroups (Figure 2) was €4890 ± €1758 (1991–6805) for a S-prosthesis and €9370 ± €6441 (3859–21,778) for an OI-prosthesis. According to the cost analysis 70% was the cost for material and 30% the cost for labour for S-prostheses. The share of those costs in the OI-prostheses subgroup was 93% and 7%, respectively. The mean number of working hours was 26.3 ± 12.0 (9.6–52.0) for S-prostheses and 12.3 ± 7.8 (3.6–27.8) for OI-prostheses. Based on these figures, the mean cost per hour was €51 for S-prostheses and €54 for OI-prostheses.
Survey
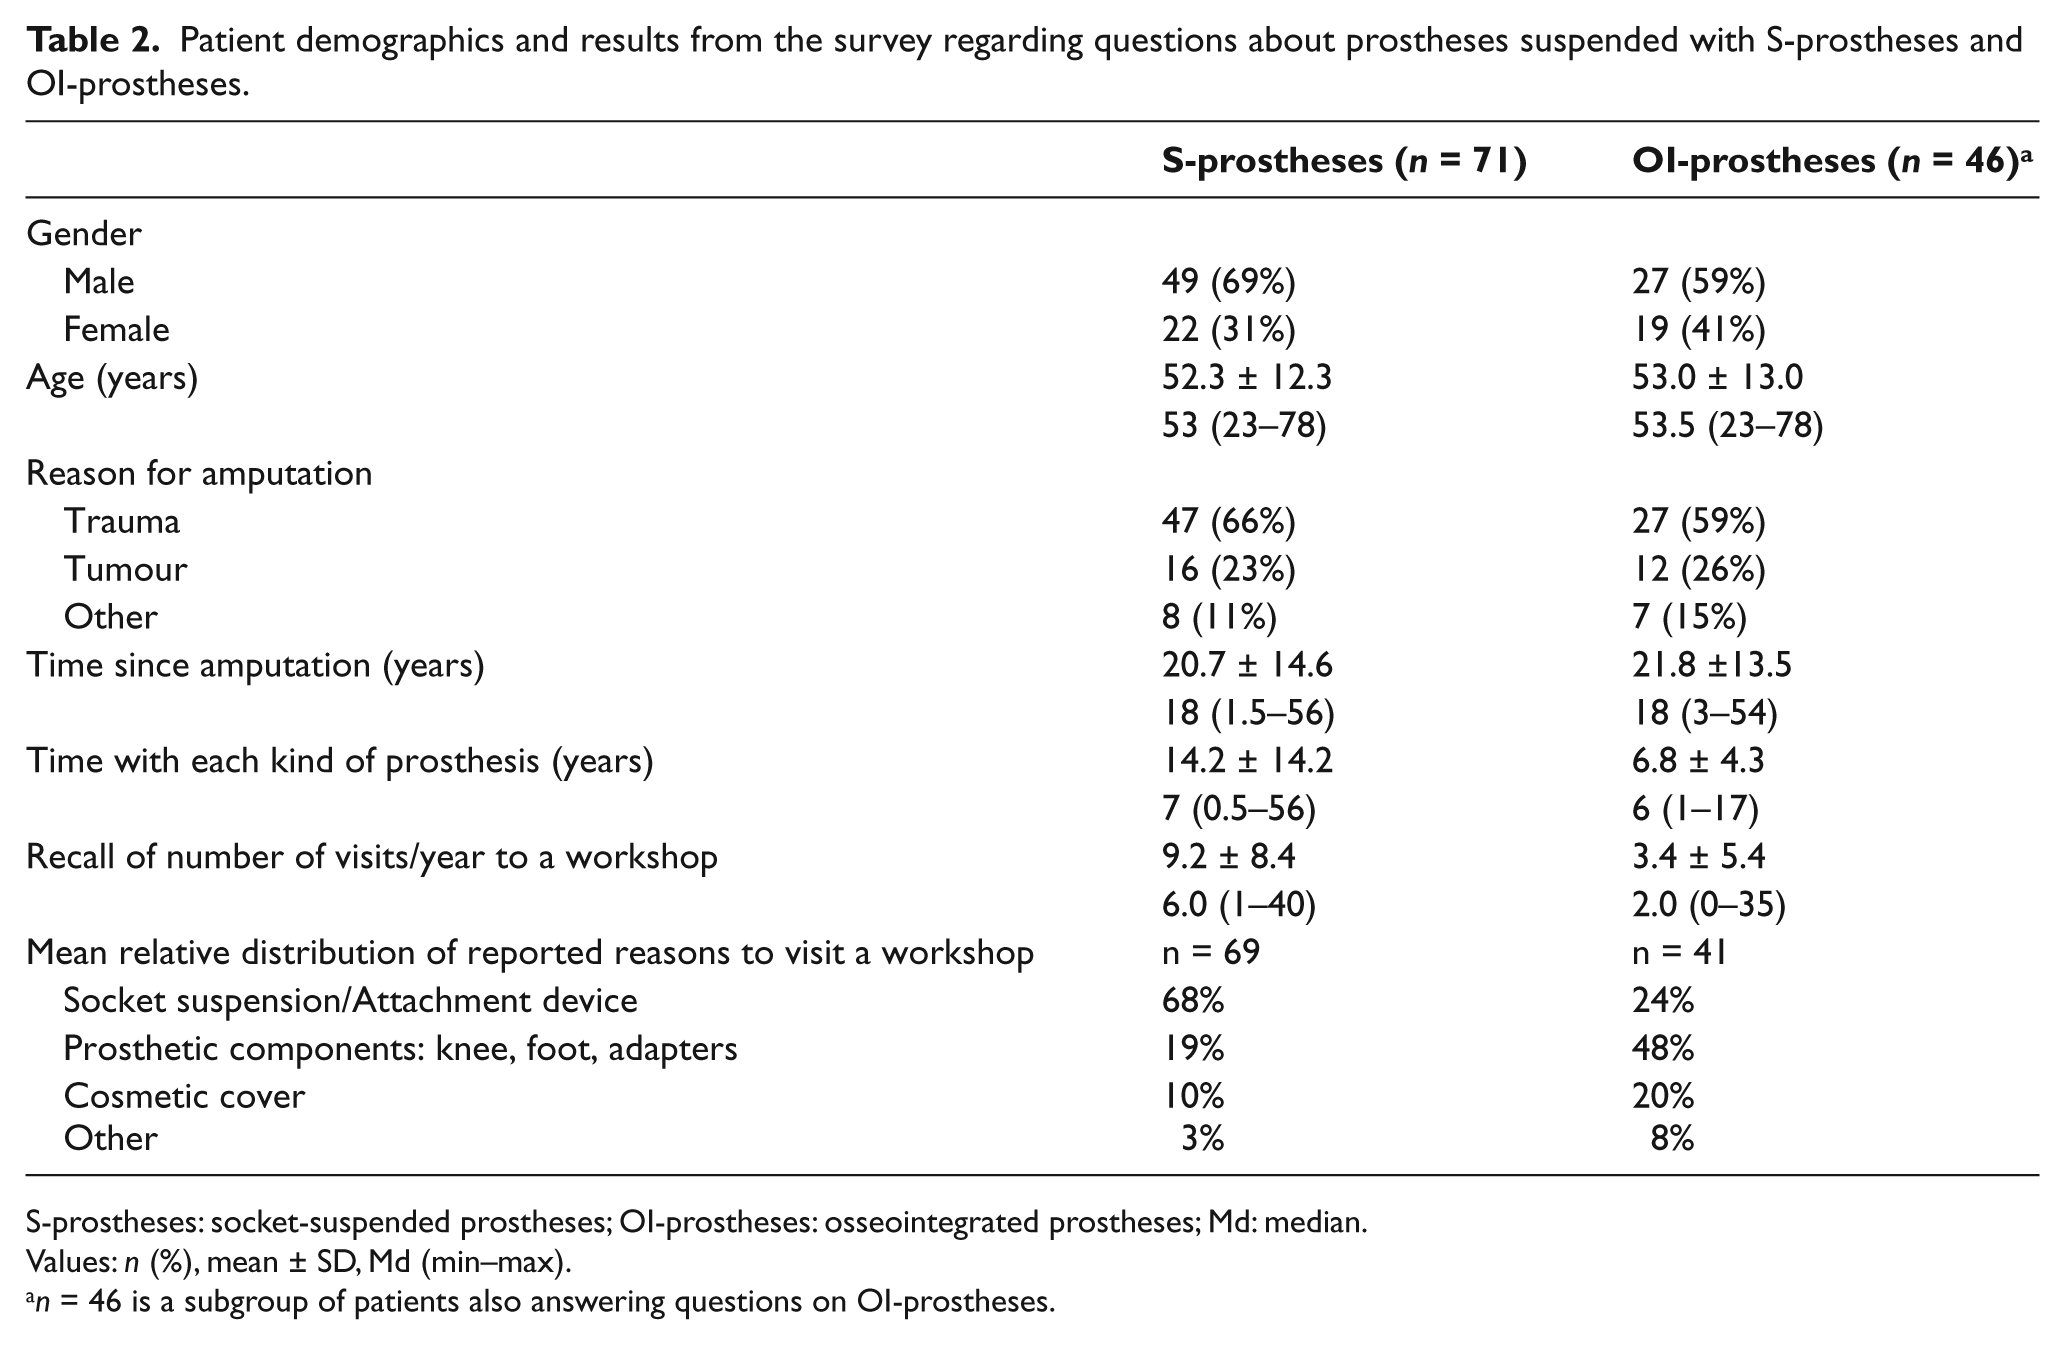
Demographic descriptions of patients and results from the survey are given in Table 2. The S-prostheses had been used for a mean of 14.2 years and each patient estimated that they had been provided with a mean of 15.1 ± 20.6 prosthetic sockets (Md = 8, 1–125). The mean number of sockets per patient and year of prosthetic use was 2.1 ± 2.6 (Md = 1.1, 0.23–15). The estimated mean number of annual visits to an orthopaedic workshop was significantly more frequent with S-prostheses than with OI-prostheses (mean 9.2 vs. 3.4 visits, p = 0.001, Table 1). The mean relative distribution of the reasons for visits indicate that with S-prostheses, the main cause was related to problems with the socket and/or suspension, while patients with OI-prostheses reported issues related to prosthetic components (e.g. knee and foot) as the main reason to visit a workshop (Table 2).
Patient demographics and results from the survey regarding questions about prostheses suspended with S-prostheses and OI-prostheses.
S-prostheses: socket-suspended prostheses; OI-prostheses: osseointegrated prostheses; Md: median.
Values: n (%), mean ± SD, Md (min–max).
n = 46 is a subgroup of patients also answering questions on OI-prostheses.
There was no statistically significant difference between the answers in the survey and the noted number of visits to the workshop among those included in both parts of the study (mean estimated visits 3.9 ± 4.1, mean noted visits 4.1 ± 2.8 (p = 0.783)).
Discussion
Within the health-care sector, studies involving cost analyses are increasingly demanded. 24 Publications on individuals with lower limb amputations rarely include any description of the cost of the artificial limb. 25 Among those reporting any costs, there is a great variety in terms of groups of patients, study design and data reported.7,8,10,26–31
This is the first study that attempts to describe and investigate differences in prosthetic costs and service for patients with a TFA fitted with OI-prostheses compared to S-prostheses. The main result was that patients with OI-prostheses have to make significantly fewer visits to a prosthetic workshop. The self-reported estimation in the survey and those noted in the cost analysis showed the same trend and indicated a reduction of at least 50% in the number of visits. In spite of fewer visits and less working hours to produce a new prosthesis, the annual mean cost of provision, maintenance and adjustments to OI-prostheses was not more than 14% lower than for S-prostheses. This study suggests the lack of significant difference is due to more expensive prosthetic knee components having been used with OI-prostheses. This, in turn, is believed to be due to the stable anchorage provided with OI-prostheses increasing the ability for the patient to benefit from more advanced prosthetic knee components.
The study has several limitations. Some are related to the retrospective design that had to be used and others to the limited number of patients with long-term experience with OI-prostheses and the fact that most patients live far from our location. Treatment with bone-anchored prostheses is still only performed at a few locations around the world.12,13,16 The COO and the Department of Prosthetics and Orthotics, Sahlgrenska University Hospital, Gothenburg, Sweden has so far treated the largest number of patients. Thus, the current prosthetic cost description could hardly be performed anywhere else. Ideally, prosthetic costs for all patients would have been registered prospectively. In reality, such information was not accessible. In most cases, we have no information regarding the preoperative history or costs for S-prostheses. Postoperatively, all patients start their prosthetic rehabilitation at our workshop. However, at a later stage, most receive some service at a workshop closer to their homes, and we have limited control of all postoperative prosthetic costs.
Another limitation is associated with the problem to obtain comparable groups. In the cost analysis, only patients who had received all their prosthetic service at our workshop were included and the group of patients with S-prostheses could not be perfectly matched to the OI-group (Table 1). To identify an appropriate group of patients in the survey (i.e. those who could be supposed to be suitable for osseointegration treatment due to problems using S-prostheses), only patients who had visited the COO were included. The results may thus not reflect the average patient with TFA due to trauma or tumour but a patient with extra difficulty to be adequately supplied with a socket. A recent study reported on 47 young patients with unilateral TFA in the United Kingdom and showed that the patients needed an average of 1.1 ± 1.15 new prostheses, 3.14 ± 3.51 new sockets, 2.06 ± 1.82 major repairs and 20.49 ± 19.30 minor repairs during a 10-year period. 9 Patients seeking treatment at the COO could hypothetically be thought to be among those requiring the largest number of sockets and repairs. The response rate in the survey was high and the sample constitutes a substantial percentage of those treated with OI-prostheses. Moreover, the majority had extensive prosthetic experience (Table 2). Even though the number of noted visits in the cost analysis and those reported in the survey were in line with each other the results of the survey should be considered with caution due to recall bias since patients might have overestimated or underestimated their answers.
Every individual using an artificial limb will make recurring visits to a prosthetic workshop for the rest of his or her life.3,5,32 Our results for S-prostheses (Tables 1 and 2) indicate a larger number of visits than previously reported by Dillingham et al. 3 among patients with amputation due to trauma (mean 3.9 annual visits), but are in line with the mean of 9 annual visits reported by Pezzin et al. 4 However, none of these studies separated the results for patients with TFA. In general, it is difficult to compare our results with the published literature. First, patients treated with OI-prostheses represent a group of patients with extra difficulties. Second, comparing the cost of prosthetic service is complicated due to different health-care systems in different parts of the world and the lack of official data of prosthetic costs for specific groups of patients. The health-care systems in Sweden and Norway are similar in many ways, with no expenses for prostheses being charged to the patient. Health care in Sweden is handled by the national health insurance and financed through taxes. This publicly financed system is expected to provide high-quality health care without considering the individual’s ability to pay for the service. In health-care markets, the prices may not reflect opportunity costs. 33 In Sweden, as in most parts of the world, prosthetic workshops are generally private clinics. However, the current cost analysis is based on the costs at a non-profit workshop managed by a Swedish county. This should be borne in mind when interpreting the results.
The main difference between S-prostheses and OI-prostheses is the lack of a prosthetic socket in the second group. Unfortunately, the economic system at the prosthetic facility is unable to separately account for the cost of the socket itself and thus the description is based on the average prosthetic costs including material, service, repairs and adjustments. The mean annual prosthetic costs (€3672 and €3149, Table 1) shown in this study are in line with those previously reported for 10 patients with TFA due to tumour (US$4225 (in year 1998) ≈ €3900 (in year 2009)). 28 Our costs are though considerably lower than those reported more recently for 31 patients with TFA due to trauma (US$ 18,722 (in year 2002) ≈ €17,600 (in year 2009)). 7 The wide individual range of prosthetic costs shown in Table 1 is in line with previous published findings,8,28 and the choice of prosthetic knee unit could be supposed to account for a substantial part of this variation. During the last decade, more sophisticated and therefore more expensive prosthetic components have become more common. To further illustrate the distribution of costs of more recent produced prostheses, we looked in more detail at the cost of 14 newly made S-prostheses produced in year 2008. To obtain a reasonable number of recent new OI-prostheses, we had to include those made during year 2005–2008 (Figure 2). The results revealed that, even though the number of working hours was about twice as high, the average cost of a new S-prosthesis was almost half compared with that of a new OI-prosthesis (€4890 and €9373, respectively).
Among patients using OI-prostheses, a number of socket-related problems have been resolved or reduced.13,18–20 It could therefore be expected that the differences in costs between the two kinds of prosthesis would be larger. There are several reasons that could explain the lack of a significant difference. First, some specific components are included in the price of OI-prostheses. 16 The most expensive is the attachment device (Figure 1), which is used to connect the prostheses to the implant. It includes a fail-safe mechanism to prevent the implant from excessive rotational loads. The price level of the attachment device is comparable to the lowest price level of knee units (Figure 3). All costs related to maintenance, repairs or exchange of the attachment device were included. Second, the fact that patients included in the cost analysis belonged to different catchment areas might explain higher costs for OI-prostheses since the willingness to pay for the more expensive components (e.g. microprocessor knee units) differs between areas. Finally, from our experience, many patients with OI-prostheses can benefit from the more sophisticated prosthetic components. The use of more sophisticated prosthetic components with OI-prostheses is supported in several ways in this study; (a) the larger number of higher price level knee units (Figure 3), (b) the higher cost of material and the lower cost of labour in the production of a new prosthesis and (c) the distribution of reasons for visits to the workshop reported in Table 2.
This study was limited to prosthetic costs and service. The total cost of the treatment to be supplied with an OI-prosthesis includes obviously a number of other important costs, such as the cost of the implant, surgeries, hospitalisation, medical check-ups and the possible costs of dealing with complications. A true cost-effectiveness analysis of the entire osseointegration treatment is in progress, and the current study will be useful in the coming analyses. Hypothetically, OI-prostheses could result in economic benefits to the society in terms of lower production loss due to more prosthetic use and better function, 18 although a more expensive treatment. Theoretically, our results could also be generalised to other treatment solutions for bone anchorage of artificial limbs. We encourage future studies describing the overall cost and consequences (utilities) for patients with amputations and, with regard to bone-anchored prostheses, these studies should in the future include the cost and consequences of the complete treatment.
Conclusion
This study shows that patients with OI-prostheses make significantly fewer visits per year to a prosthetic workshop compared with a similar group using S-prostheses. Despite the differences in visits for prosthetic service between the groups the overall prosthetic costs for OI-prostheses were comparable with those for S-prostheses. We suggest this is due to more sophisticated components that can be used with OI-prostheses. Such advanced prosthetic components are most likely important factors for the improved prosthetic function reported by patients with OI-prostheses.
Footnotes
Conflict of interest
The authors have no conflict of interest.
Funding
This work was financial supported by an ALF grant from ALF/LUA Västra Götalands regionen, Sweden and the Promobilia Foundation, Sweden.