
Abstract
Background: Knowledge of transtibial residual limb force and moment loading during gait can be clinically useful. The research question was whether a transducer attached between the socket and pylon can be used to detect differences in loading patterns created by prosthetic feet of different design and different walking activities in real-world environments outside the gait lab.
Objectives: To develop methods for obtaining, processing, analyzing and interpreting transducer measurements and examining their clinical usefulness.
Study Design: Case series design.
Methods: A convenience sample of four K3-K4 transtibial amputees and a wireless tri-axial transducer mounted distal to the socket. Activities included self-selected comfortable speed walking, and ascending and descending ramps and steps. Measurements taken about three orthogonal axes were processed to produce plots of normalized resultant force versus normalized resultant moment. Within-subject differences in peak resultant forces and moments were tested.
Results: Loading patterns between feet and subjects and among the activities were distinctly different. Optimal loading of peak resultant forces tentatively might occur around 25% and 69% to73% of stance during self-selected comfortable walking. Ascending and descending ramps is useful for examining heel and forefoot response.
Conclusions: Force-moment plots obtained from transducer data may assist clinical decision making.
A pylon-mounted transducer distal to the socket reveals the moments and forces transmitted to the residual limb and can be used to evaluate the loading patterns on the residual limb associated with different foot designs and different everyday activities outside the gait lab.
Background
A large number of prosthetic feet featuring different designs are available to prosthetists but there is little information on how the feet load the residual limbs of amputees for different types of walking activities such as self-selected comfortable speed level walking (SSCS), going up and down ramps and ascending and descending steps. Experiments conducted in traditional gait laboratories using motion capture, forceplates and inverse dynamics can only estimate but not directly measure the forces and moments transmitted to the residual limb. Forceplates embedded in the floor of a gait laboratory are limited to the study of activities occurring on level surfaces in a setting that is not typical of the environments in which amputees walk. The research question examined was whether a tri-axial transducer mounted rigidly between the pylon and the socket can detect differences in the force and moment loading patterns on the residual limbs of transtibial amputees when prosthetic feet of different design are used in different walking activities. A major advantage of the transducer is that it can be used outside of the laboratory to measure gait phenomena in a variety of real-world environments that would be very difficult to duplicate in a laboratory, and it can be used to examine the effects of many kinds of activities. This knowledge could help clinicians prescribe feet or diagnose patient complaints related to foot performance. It could also give clinicians insight into the role played by foot design in the generation of pressures on the residual limb during stance, which can traumatize residual limb tissues as well as provide the means for perceptions of prosthesis performance and control.
A study published in 1987 used strain gauges glued to the pylons of transtibial prostheses and found that the force directed along the pylon had a high correlation with pressures at multiple locations within the socket during the entire stance phase of gait, and the sagittal plane moment had a high correlation with pressure at the patella tendon bar during push-off. 1 Tri-axial transducers mounted on the pylon distal to the socket or residual limb have been used to measure the forces and moments that are transmitted to the osseo-integration implants of transfemoral amputees.2-11 The reference frame for the measurements consists of three orthogonal axes fixed to the transducer that move with it and the socket during gait (Figure 1a).

1a. Transducer, axes, and back pack; 1b. data collection during SSCS walking;1c. down ramp data collection; 1d. up steps data collection.
Methods
Participants
Four unilateral transtibial amputee convenience subjects were recruited from local clinics and professional contacts. Inclusion criteria included being able to function at a K3 or K4 level, ability to undertake walking without a loss of balance or an unsteady gait which might imply a proneness to falling, ability to undertake all activities safely, and good socket fit. New amputees, preparatory prostheses and residual limb pain, open sores or infections were grounds for exclusion. All subjects read and signed a Letter of Informed Consent describing the protocol that had been approved by the IRBs of the University of Nevada, Las Vegas and the US Army Medical Research and Materiel Command.
Aparatus
The same basic make and model of transducer used in the previous osseo-integration studies2-11 (JR3 Model 45E15A4 1000N125; Woodlands, CA) featuring digital output, with reported error +0.25% of measured range, was machined by the manufacturer with four threaded bolt holes on each face in the standard pattern for prosthetic components. This made it possible to insert the transducer between the pylon and the socket using standard female or male adaptors (Figure 1a). Mass of the transducer was 794 g, diameter 11.4 cm, thickness 3.8 cm, and the distance between Allen screws with the female adaptors was 5.4 cm. Additional electronics necessary for data capture were carried in a backpack worn by the subject and included a JR3 sensor interface board, a PC104/Plus single board computer (WindSystems model PPM-GX-ST), Windows embedded XP (Microsoft), battery packs and a power module (14.8 V 4400 mAh), and a wireless network adaptor (range 46 m indoors and 92 m outdoors). Total mass of the backpack was 2.27 kg. Data were collected at 100 Hz, the highest stable rate for the transducer. Laboratory tests first were carried out which established that the magnitude of the resultant force measured by the transducer [FR = (Fx2 + Fy2 + Fz2) ½] was within approximately 2% of the magnitude of the resultant ground reaction force measured by a force plate (Kistler 9281C; Amherst, NY).
Protocol
The subjects supplied their own sockets, which were spare sockets in three cases and an everyday socket in the fourth. A goal of the study was to have each subject wear at least one energy storing and return foot (ESAR) so that an examination of the loading patterns that occur could be undertaken. Each subject was asked if they could provide at least one ESAR foot with which they had prior experience (Table 1). S1 provided a Renegade and Trustep (Freedom Innovations, Irvine, CA; and College Park Industries, Fraser, MI); S3 provided a Flex-Foot (Ossur Americas, Foothill Ranch, CA); and S4 provided a PerfectStride and BioStride (BioQuest, Bakersfield, CA). Three new SACH feet of identical design (Ohio Willow Wood, Mt. Sterling, OH) were obtained to compare to the energy storing feet for S2, S3 and S4, and an inexpensive Carbon Copy 2 energy storing foot (Ohio Willow Wood, Mt. Sterling, OH) was obtained for S2 who was unable to provide a spare ESAR foot. S4 reported having prior experience with a SACH foot, and requested a firm heel plug. Altogether nine feet representing a range of designs were included in the study. This facilitated examination of whether transducer measurements could detect differences between types of feet.
Subject characteristics.
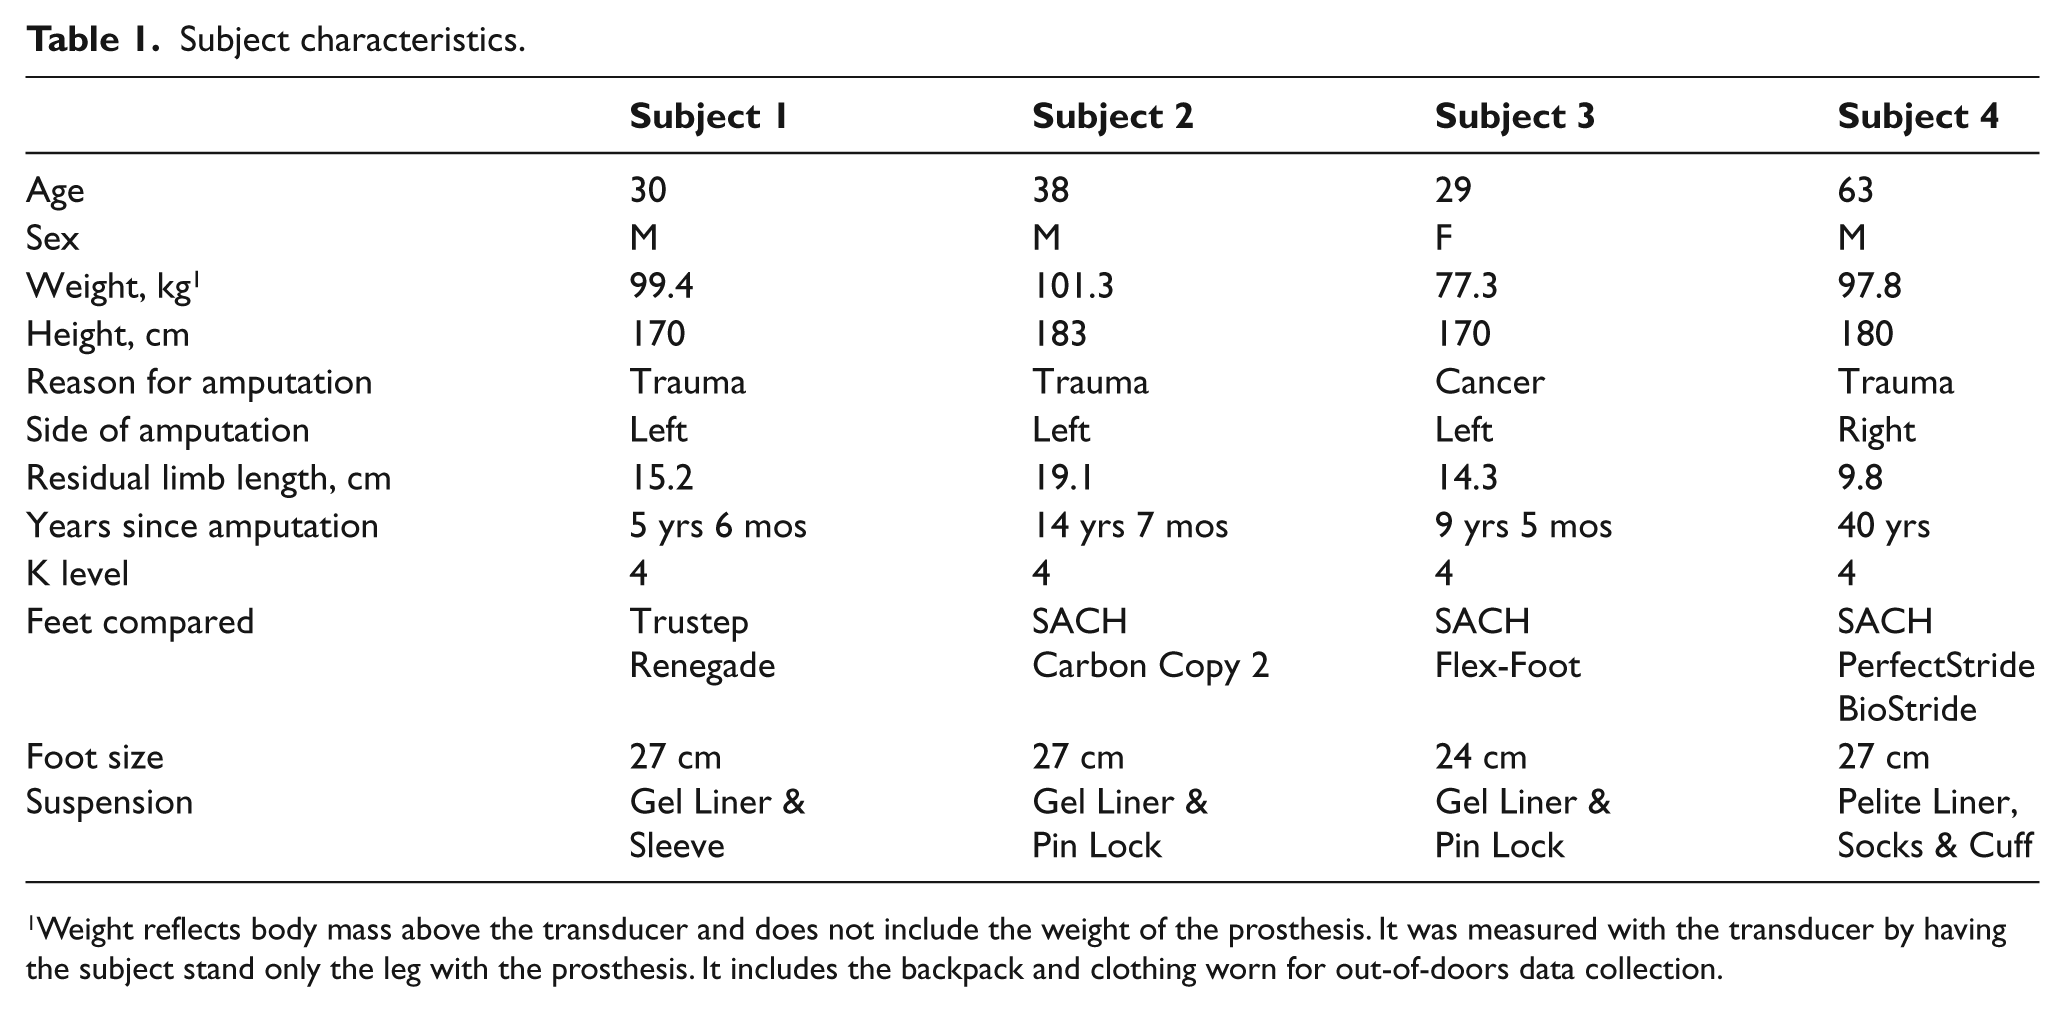
Weight reflects body mass above the transducer and does not include the weight of the prosthesis. It was measured with the transducer by having the subject stand only the leg with the prosthesis. It includes the backpack and clothing worn for out-of-doors data collection.
The SACH and Carbon Copy 2 are very similar in design except for the construction of the internal keel; the Carbon Copy 2 features a carbon composite design. Historically the SACH has been widely used until the development of ESAR feet, but tends to be prescribed more for low K levels or prosthesis designs limited by budgets. It is regarded by prosthetists and amputees to lack the dynamic response that ESAR feet provide during gait. The Carbon Copy 2 is also recommended for low K levels. The Trustep features rigid forefoot components separated by elastomeric pads that store and release energy. It is prescribed for higher K levels. The Renegade features forward and rearward facing convex carbon fiber plates and a carbon fiber keel, and also is prescribed for higher K levels. The Flex-Foot consists of a one-piece carbon fiber J-shaped shaft and forefoot that is attached to a full-length keel, and is prescribed and used at higher K levels. The PerfectStride foot utilizes a titanium calf shank and coiled ankle, and is used at higher K levels. The BioStride employs a convexly curved multilayer carbon graphite composite calf shank, and is used at higher K levels. All feet except the SACH have guidelines to match stiffness to the weight of amputees. Due to the time constraints of the subjects, adaptation periods of only 15 to 30 minutes could be allowed for the SACH feet for S2 and S3, or for the Carbon Copy 2 foot for S2.
Each subject’s original pylon was replaced with a pylon shortened to allow the transducer to be attached. The original alignments were replicated by a certified prosthetist and modified as necessary to produce an alignment acceptable to the subject. Each subject’s weight above the transducer was measured at the start of data collection using the transducer mounted in the pylon with the prosthesis donned. Subjects were asked to balance on the prosthetic side with only minimal lateral support (Table 1). Weight included the back pack and any clothing the subject might have been wearing for out-of-doors data collection. This measured weight was used to normalize the transducer data. Tasks for the subjects included walking on a level surface out-of-doors at a self-selected comfortable speed (SCCS level walking), walking up and down a long wheelchair ramp having a 7.5% slope, and walking up and down a flight of 38 steps (Figures 1b, c, and d). Subjects were allowed to use the handrail on the steps to ensure safety. Measurements were taken for all activities using one foot, then the feet were changed, the prosthesis re-aligned, and the activities were repeated. For each activity, subjects were asked to take approximately 15 consecutive steps while data were recorded. Data for each subject were collected during a single session lasting approximately two hours.
Data computing
The data from the transducer were recorded as forces directed toward the residual limb and moments as they would be experienced by the residual limb. The orientation of the axes for the transducer was a vertically pointing Z axis (Fz+ upward and parallel to the pylon), an anterior-pointing X axis (Fx+ forward and perpendicular to the pylon) and a Y axis that pointed to the left (Fy+ to the left and perpendicular to the pylon); positive moment My was counter-clockwise as viewed from the left (My+ producing a couple created by heel loading and My- producing a couple created by forefoot loading), positive moment Mx+ was counter-clockwise as viewed from the front, and positive moment Mz+ was counter-clockwise as viewed from above. The moment about any of the axes is equal to the resultant force in the plane perpendicular to the axis times the perpendicular distance from the centre of the transducer to the line of action of the resultant force in that plane. The length of the moment arm can be computed by dividing the moment by the resultant force in the respective plane that is perpendicular to the axis of the moment vector.
A graphic user interface (GUI) was developed for use with a laptop that allowed the analyst to select any 10 of the steps from the walking trial of approximately 15 or more consecutive steps. In this way, steps that did not appear representative of steady-state conditions could be eliminated (e.g. gait initiation and termination steps, and turns made on the landing of the stairs). The beginning and ending frames of stance phase for the 10 steps were identified visually and their index numbers entered into the GUI. The GUI normalized the stream of transducer data in the time domain for each of the 10 selected steps by breaking each step into 50 successive time intervals of equal duration based on the indices of the beginning and ending frames for the step. The GUI computed the means of the transducer measurements falling into each of the 50 intervals. The output from the GUI consisted of six 50 X 10 matrices in EXCEL-ready format, each matrix containing the mean values of the six transducer variables. Each matrix arrayed the 50 normalized time intervals as rows versus the 10 steps as columns, with each cell containing the mean value of the transducer measurements that occurred within the normalized time interval.
Force Fz was used to identify the beginning and ending times of each stance phase, and the same indices in the stream of data for the Fz variable were used by the GUI to establish the beginning and ending times for the other five forces and moments measured by the transducer so that loading events occurring simultaneously would be synchronized for analysis. Forces were divided by the body weight in N above the prosthesis as measured by the transducer at the beginning of data collection, and moments were divided by the above-prosthesis body mass in kg. Normalized force and moment resultants were computed as FR = (Fx2 + Fy2 + Fz2) ½ (1) and MR = (Mx2 + My2 + Mz2) ½ (2) where all forces were normalized.
Data analysis
Plots of normalized resultant force versus normalized resultant moment were prepared and examined. The plots indicated the relationship between force and moment during stance for a given subject and foot, and were examined to detect whether differences in loading occurred between feet. EXCEL and SPSS were used to conduct statistical comparisons of the peak normalized resultant forces and moments for each pair of feet used by each subject since peak magnitudes were assumed to produce the maximum loading on the residual limb. Comparisons were based on the 10 steps processed with the GUI. Data for each foot were tested for normality using the Shapiro-Wilk test with p<0.05. When results indicated that the distributions of peak values for both feet of a pair had a p>0.95 probability of being normal, a two-tailed t-test for two independent samples with unequal variance was used with p<0.05 to test for significance. If either distribution did not meet the normality requirement, a non-parametric Mann-Whitney U-test with p<0.05 was used.
Results
The curves of normalized resultant force for SSCS walking exhibited two humps similar to a resultant ground reaction force. The normalized resultant moment curves exhibited a small hump around heel loading followed by a very large hump during forefoot loading. Magnitudes of the mean normalized peak resultants plus and minus one standard deviation are shown in Figure 2, and the data are presented in Table 2. Earlier research had shown a high correlation between the maximum pressures on the residual limb and Fz and My. 1 Analysis of the transducer data revealed that Fz and My strongly dominated the force and moment resultants. Force Fz parallel to the pylon had a magnitude that was approximately 98% of the resultant for many of the feet and subjects, indicating that the Fz force comprised nearly the entire resultant. For S3 with the Flex-Foot the standard deviation of the step-to-sep normalized resultant force was lowest, comprising less than 5% of its magnitude as the forefoot was loaded. For S4 and the Biostride the standard deviation was highest, 10%.

Normalized means ±1 standard deviation for self-selected comfortable speed (SSCS) level walking.
Maximum normalized mean resultant forces and moments for self-selected comfortable speed (SSCS) level walking. Foot exhibiting significantly greater resultant is indicated by an asterisk (*). Feet exhibiting non-normal distributions (Shapiro-Wilk test, p> .95) are underlined and were compared using the non-parametric two-tailed Mann-Whitney U-test with p<0.05. Feet exhibiting normal distributions were compared using the independent sample two-tailed t-test with unequal variance and p<0.05.
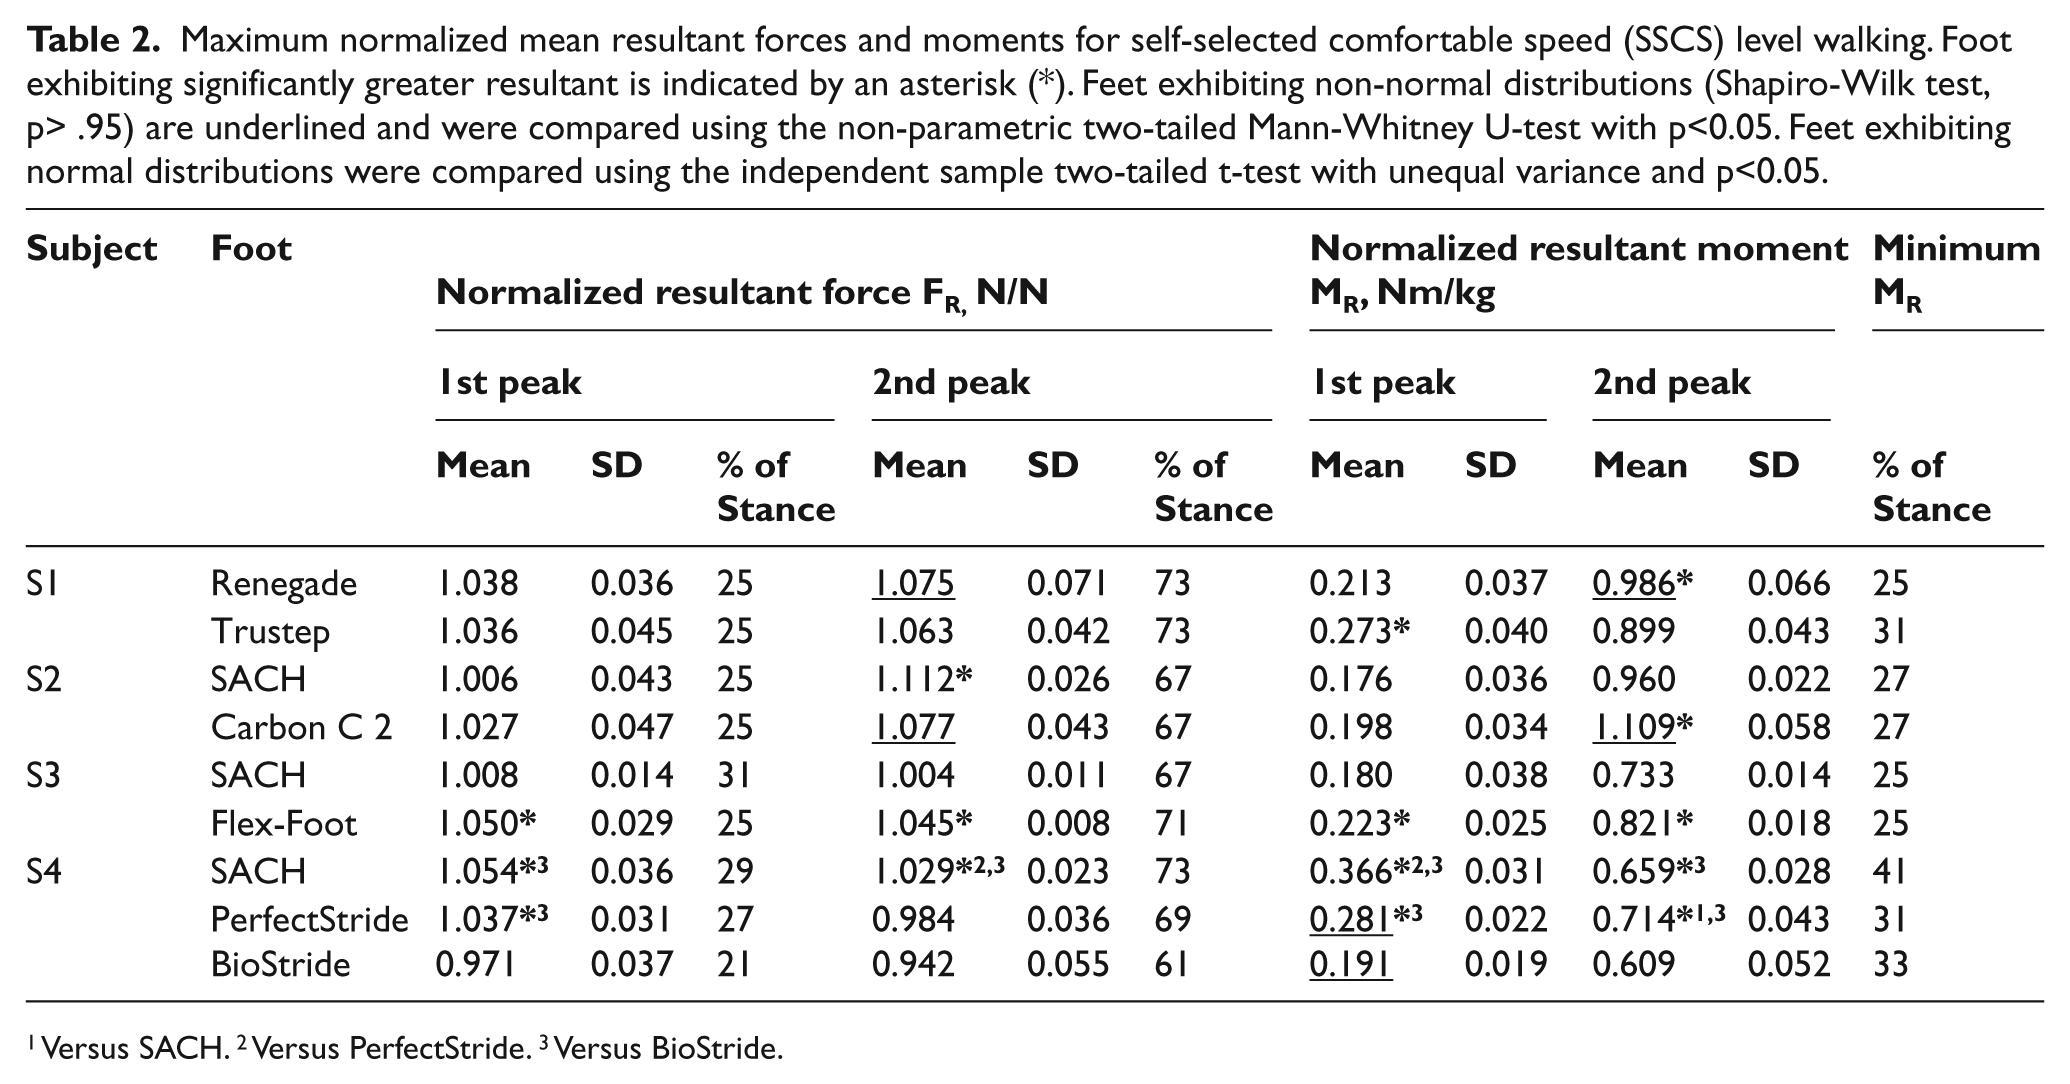
Versus SACH. 2 Versus PerfectStride. 3 Versus BioStride.
The minimum of the normalized resultant moment occurred in-between the large and small humps and indicated the time at which the line of action of the resultant force passed near to the centre of the transducer. In the sagittal plane it was close to the instant in time when the My+ moment changed to a My- moment and pressures created by the force couple would have reversed from having a potential influence on the popliteal and distal tibia regions of the residual limb to the patellar tendon and gastrocnemius regions. The minimum moment indicated the per cent of stance when loading would shift from the heel portion of the prosthetic foot posterior to the transducer to the forefoot keel anterior to the transducer. The magnitude of the sagittal plane moment, My, was often 98% of the magnitude of the resultant or higher, indicating that it comprised nearly the entire resultant, especially during forefoot loading. The standard deviation of the normalized resultant moment was often around 6% of its magnitude, but for S4 with the BioStride was highest at 23%.
The Shapiro-Wilks test revealed that 30 of the 36 distributions of resultant force and resultant moment had a p>0.95 of coming from normal distributions and a t-test could be used to compare means of the peaks. The non-parametric Mann-Whitney U-test was used for comparisons involving the other six distributions. Significant differences found for the peak normalized resultant forces and moments along with the per cent of stance when the peak force and minimum moment occurred are shown in Table 2 for SSCS level walking. All pairs of feet exhibited significantly different mean values for at least one of the four resultant peaks. Values of the peaks varied between subjects and feet. For SSCS level walking S2’s SACH foot generated the highest peak resultant force of any of the subjects during the 2nd peak and S4’s BioStride foot generated the lowest peak resultant force during the 2nd peak. S4, who requested a firm heel plug in his SACH foot, exhibited a relatively high 1st peak resultant force and a relatively low 2nd peak resultant force with the SACH compared to the other subjects. With respect to 2nd peak resultant moments for SSCS level walking, S2’s Carbon Copy 2 foot generated the highest peak and S4’s BioStride the lowest.
Plots of normalized force resultant versus normalized moment resultant for SSCS level walking are shown in Figure 3. Plots for walking up and down ramps and up and down steps are presented in Figures 4 and 5 and depict how loadings are affected by activity. There were distinctly different patterns for each foot, subject and activity. The curves for SSCS level walking and walking up and down ramps are triangular in shape, and to interpret them one follows them from their beginning point on the left. Interpretation of the plots involves examining the magnitudes and times of occurrence of the peak normalized forces and moments, when the minimum moment occurs relative to the 1st peak resultant force, the concavity and shape of the curve connecting the peaks of the resultant force, the slope of lines that connect the origin to any point on the curve, and the general appearance of the curves. Each marker represents two per cent of the stance phase, and the distance between the markers indicates how rapidly the forces and moments are changing – the closer the spacing along an axis, the smaller the magnitude of change during a two per cent time interval. The left end of the base of the triangle is the starting point with the base of the triangle indicating the loading that begins at heel contact. The curve leads up to the 1st peak of the resultant force, when the curve changes to a more vertical direction to indicate loading response between the 1st and 2nd peaks of the resultant force. The normalized resultant force typically decreases between its 1st and 2nd peak, which produces a convex curve. During this interval the normalized resultant moment increases as the forefoot is loaded and the ground reaction force moves toward the toe. The top of the triangle represents response after the 2nd peak of the normalized resultant force as both it and the normalized resultant moment decrease following push-off. The top portion of the curve ends on the left with toe-off. If the resultant force reaches its 1st peak before its moment arm changes from pointing toward the heel to pointing toward the toe, the minimum moment will occur subsequent to the peak force indicating probable completion of peak force loading on the heel. A complete loop will appear and the curve will cross itself. If the minimum moment occurs simultaneous with the 1st force peak, the loop will be completed and cross but appear flattened and pointed. This may indicate peak loading closer to the vertical axis of the transducer and on the portion of the foot under the pylon. If the 1st force peak occurs subsequent to the minimum moment, the curve will not cross itself and the loop will not be complete. This indicates that 1st peak loading is occurring with a moment arm directed anterior to the vertical axis of the transducer and could imply that the peak is occurring on or close to the beginning of the forefoot. The slope of a line connecting the origin of the plot to any point on a curve gives a relative measure of the length of the moment arm of the resultant force, Normalized MR/ Normalized FR (3). The greater the slope, the greater the length of the moment arm.
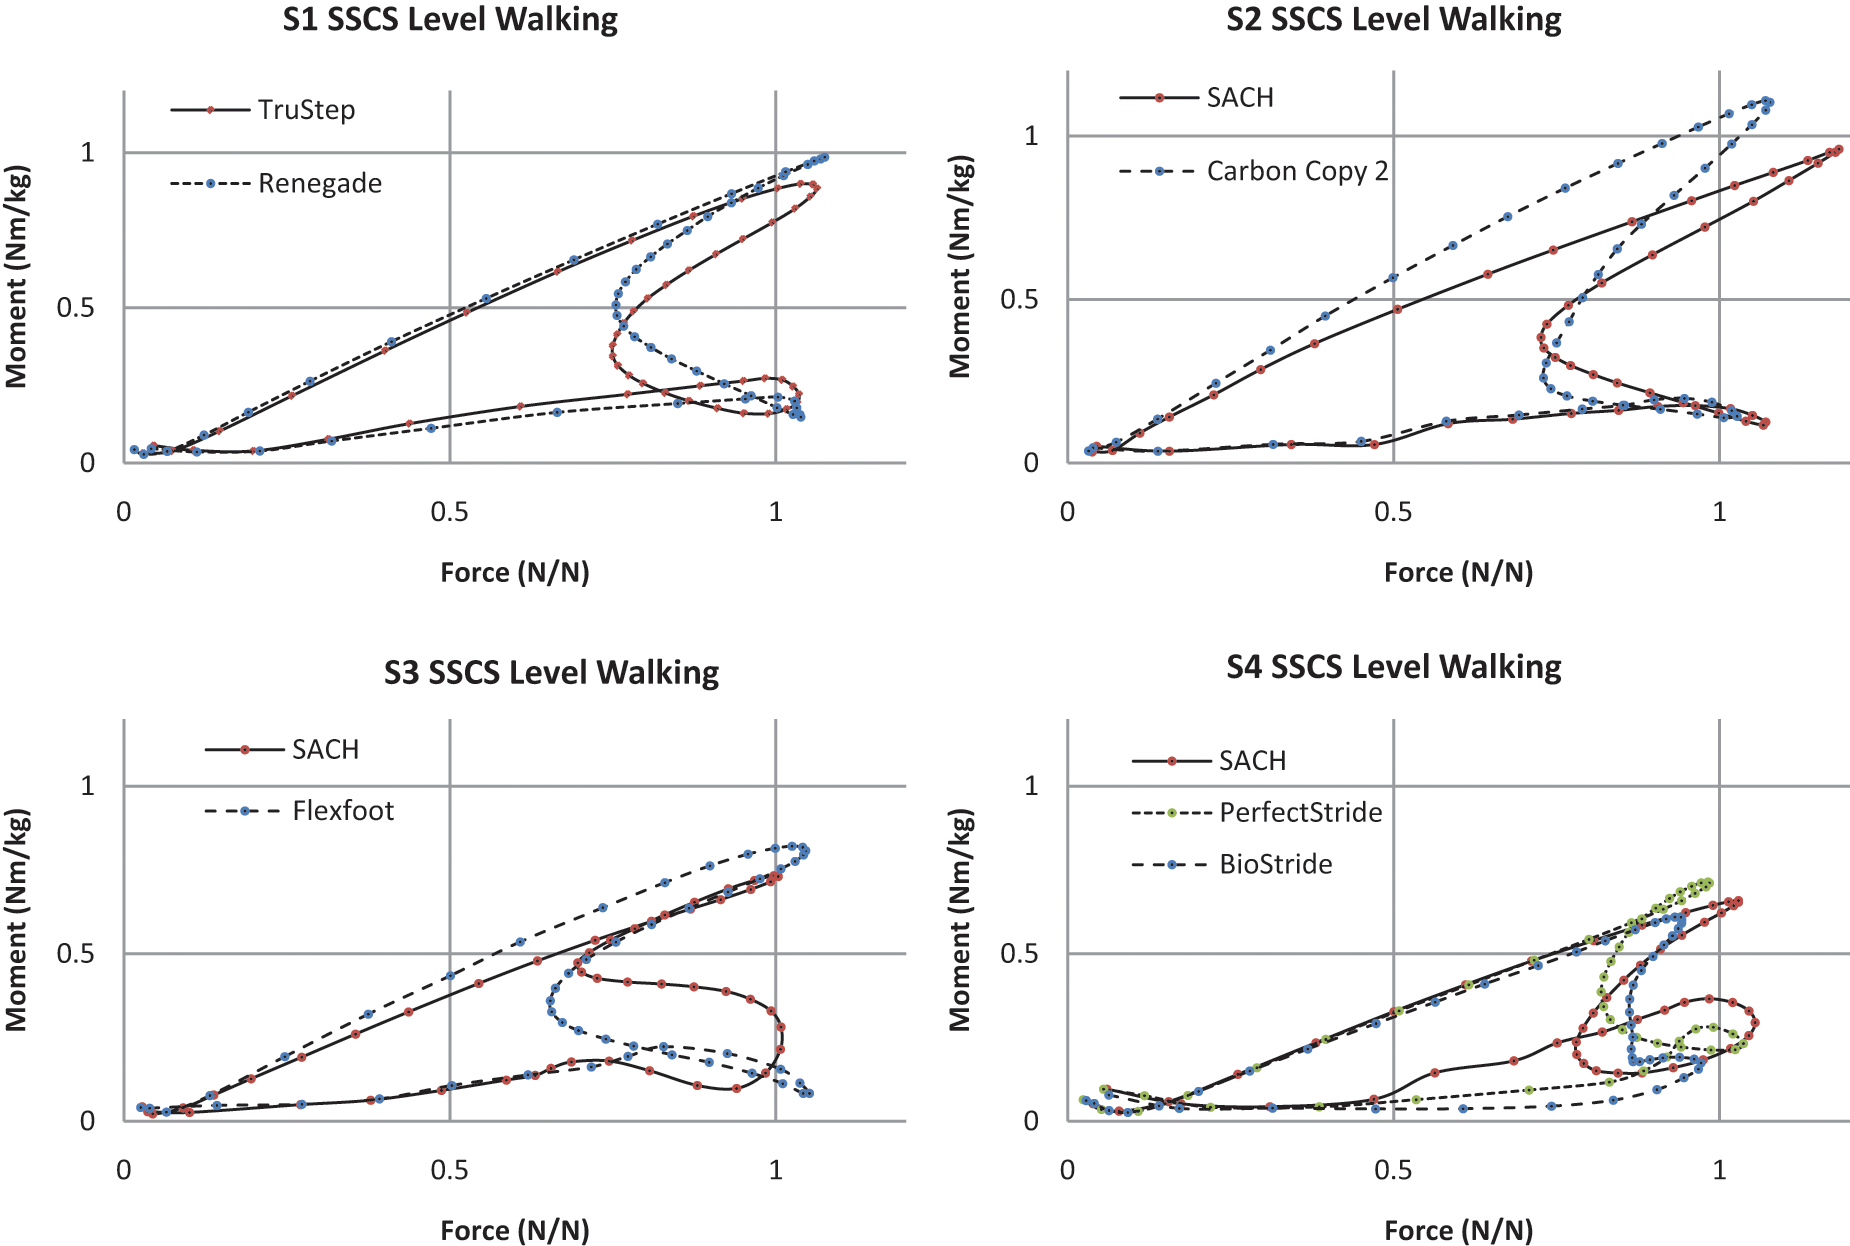
Normalized mean resultant force versus normalized mean resultant moment for self-selected comfortable speed (SSCS) level walking.
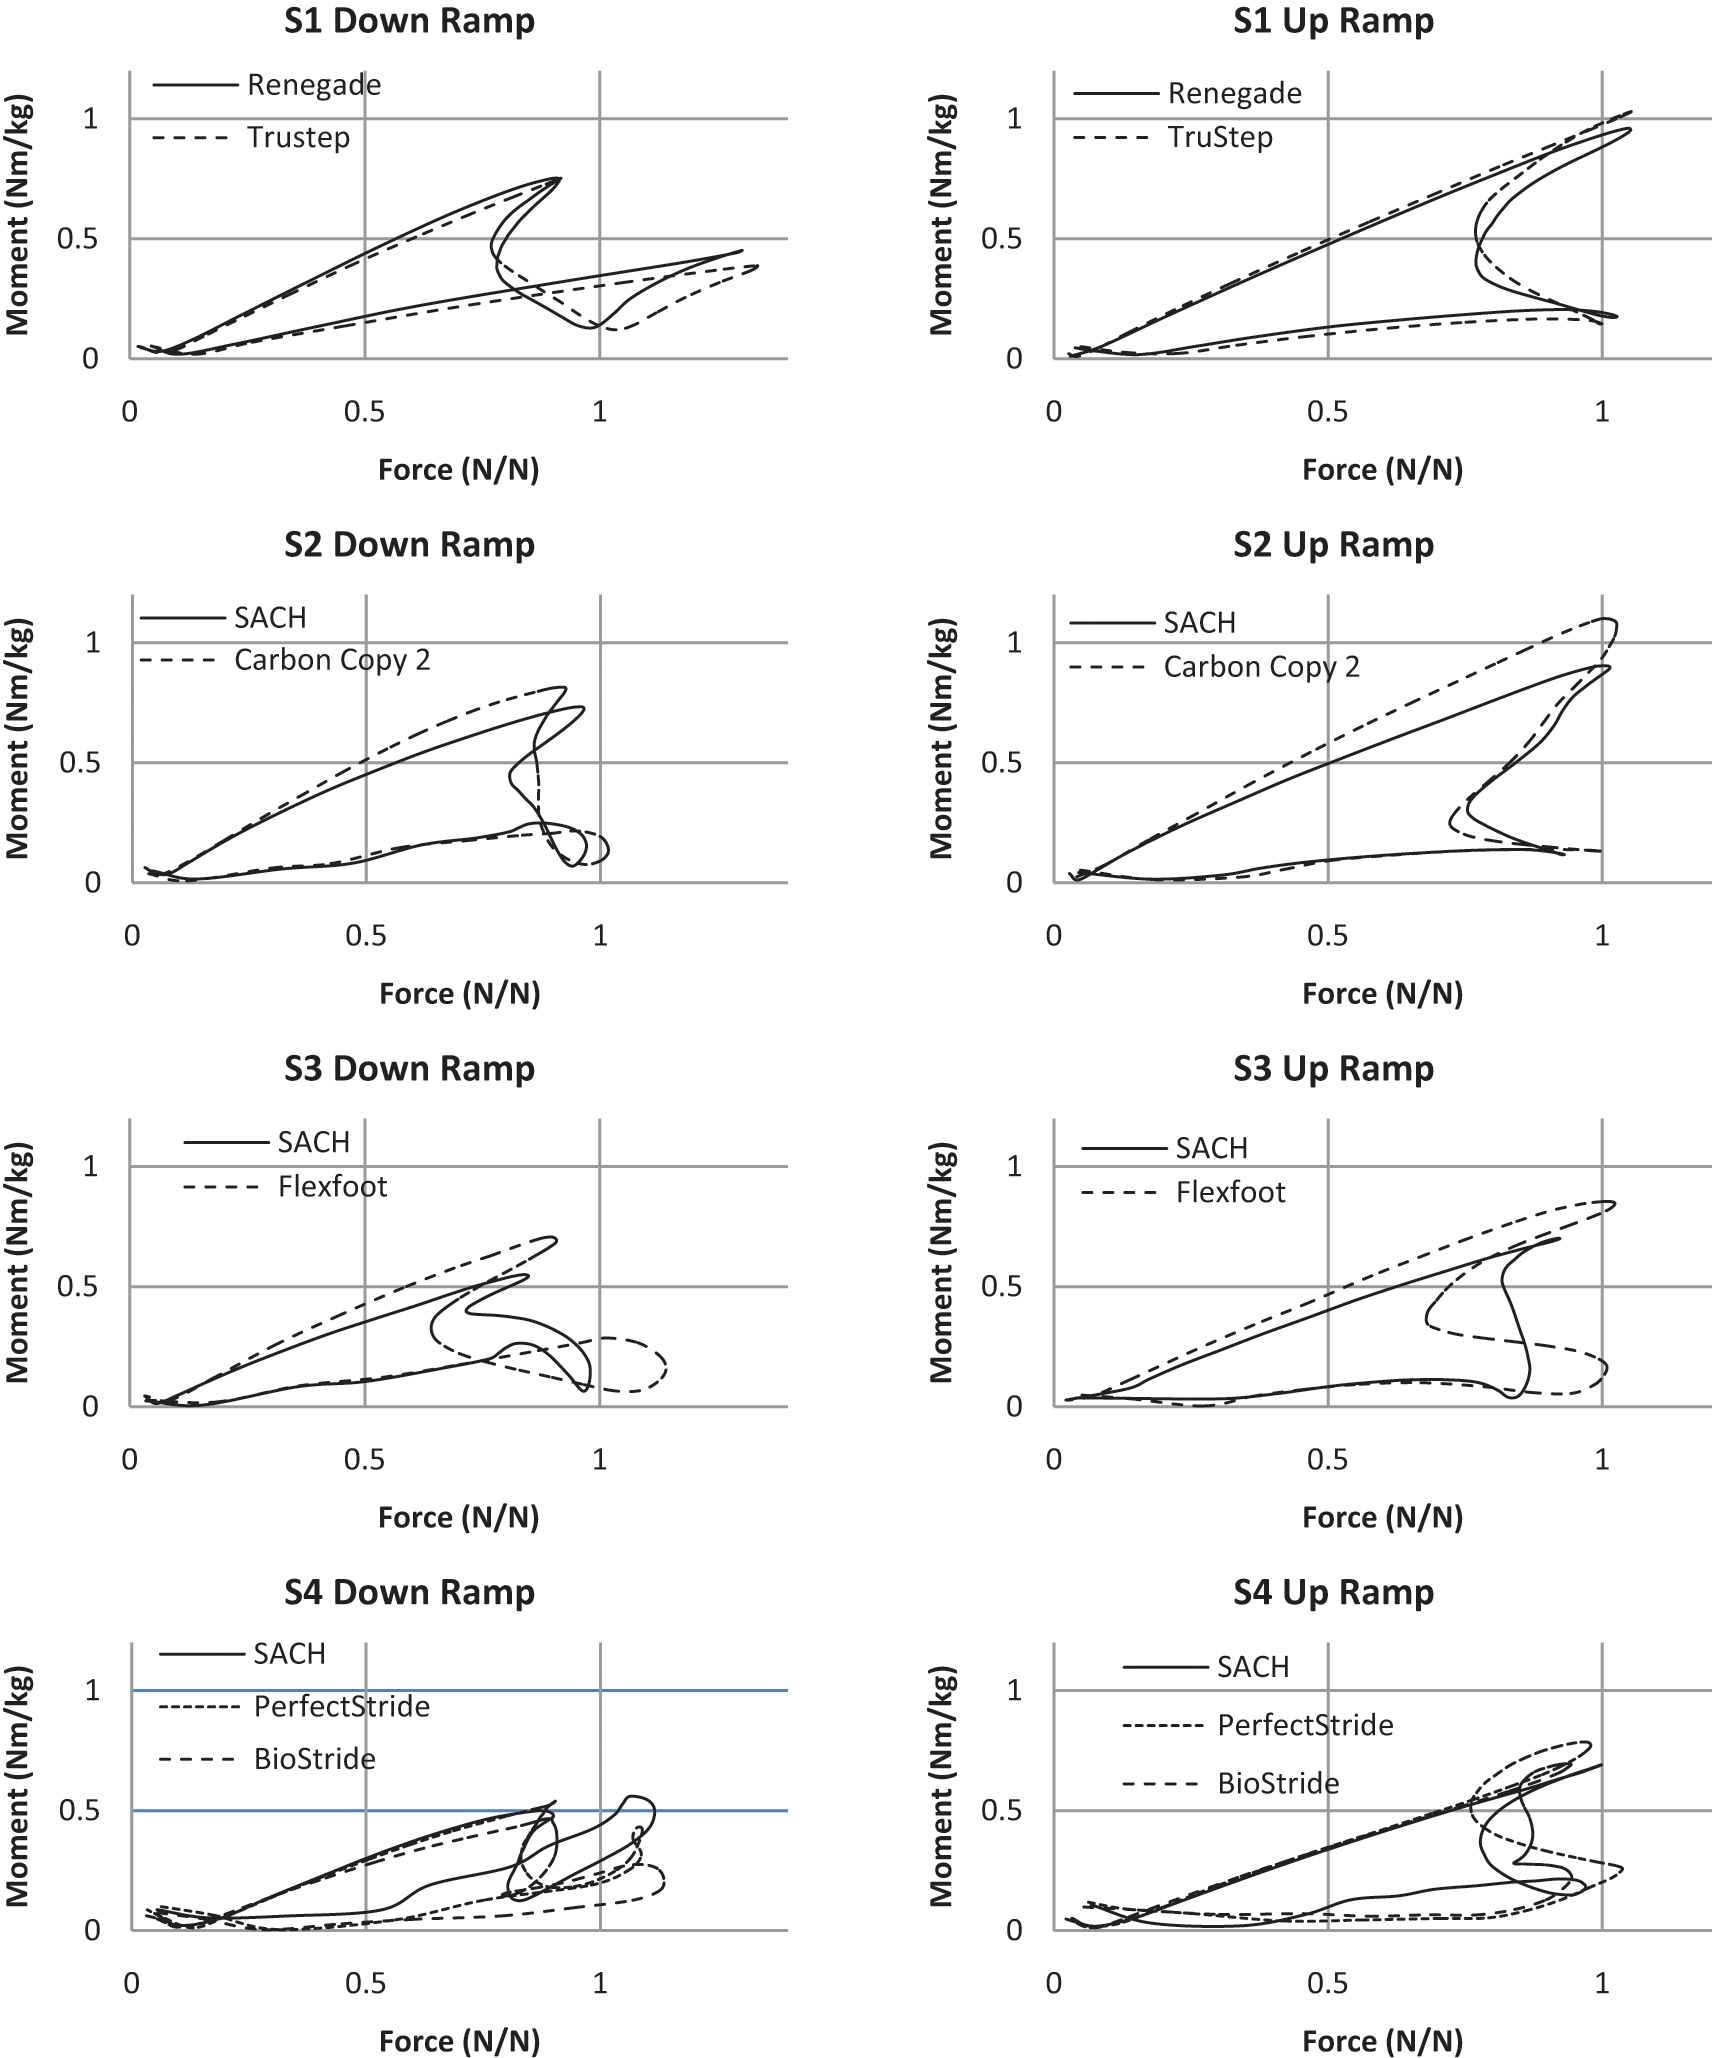
Walking up and down a ramp.
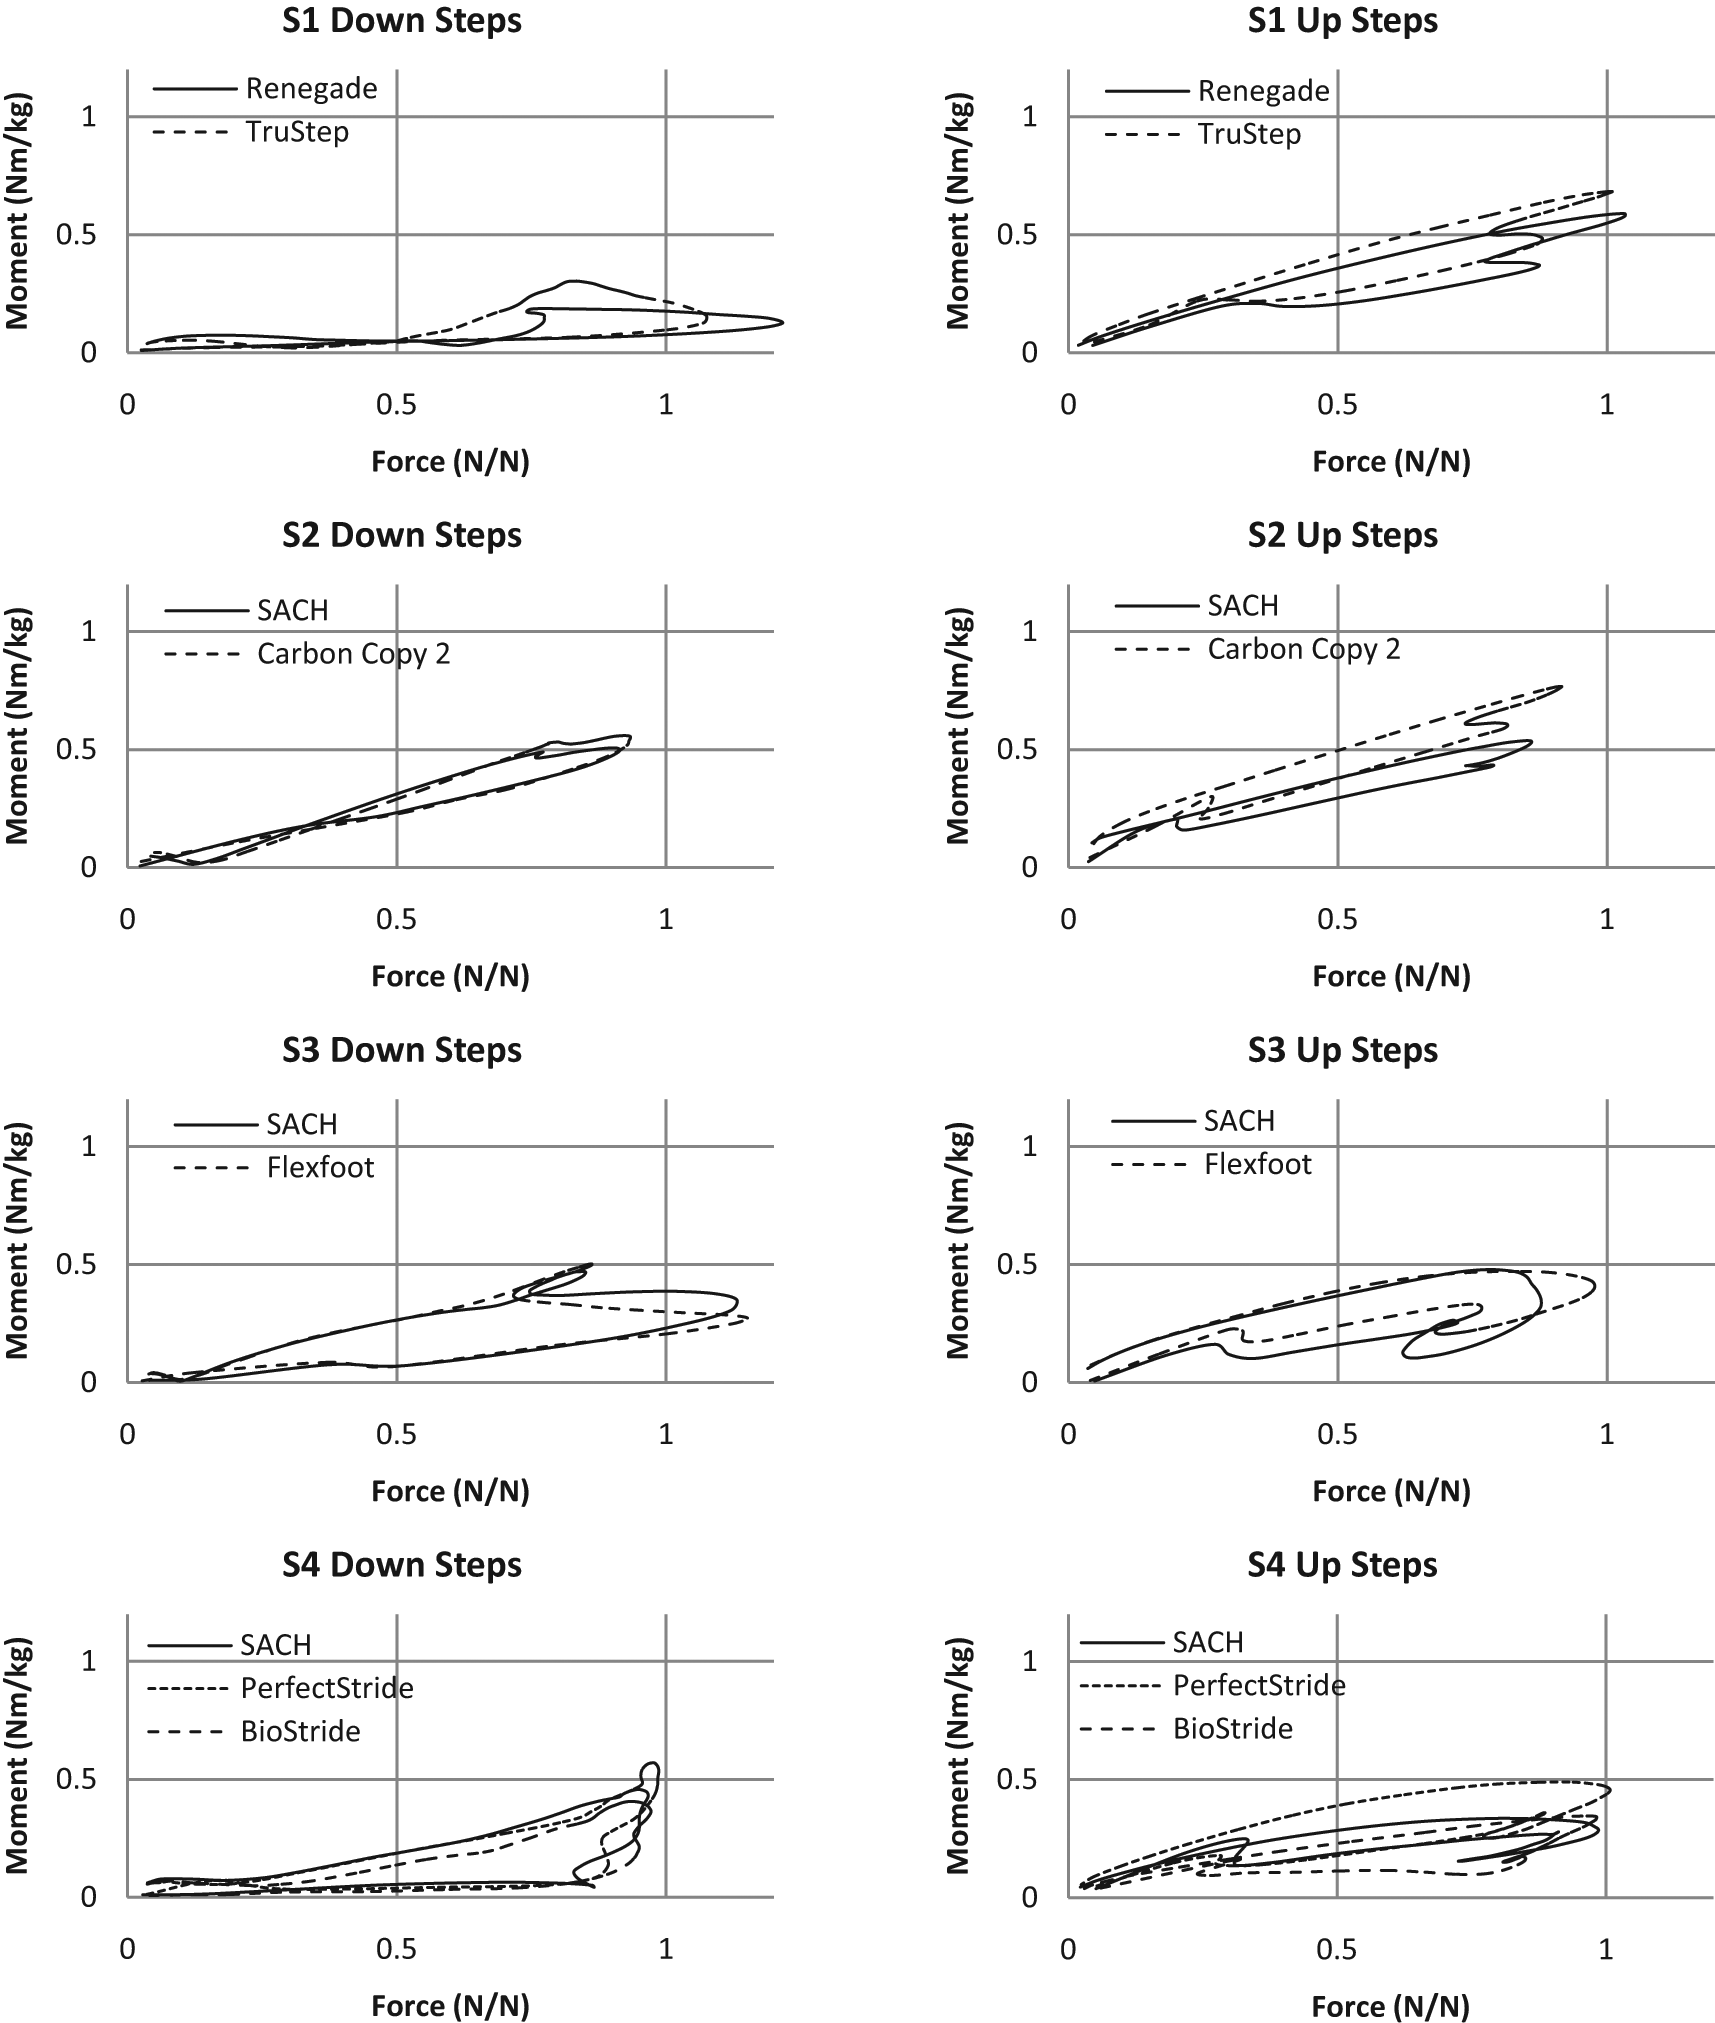
Walking up and down steps.
No pattern that consistently distinguished between the SACH feet and the ESAR feet was apparent. Though differences appeared, they varied by subject. S1’s curves for the Renegade and Trustep appeared similar and both exhibited 1st peak forces that occurred prior to the minimum moment. There were no significant differences between the feet with respect to the magnitudes of the 1st and 2nd peak forces, but the Trustep produced a significantly greater 1st peak moment whereas the Renegade produced a significantly greater 2nd peak moment. For S2 the SACH produced a significantly greater 2nd peak resultant force, but the Carbon Copy 2 produced a significantly greater 2nd peak moment. The 1st force peak and the minimum moment occurred simultaneously for both feet. For S3 the Flex-Foot produced significantly greater peak force and moment resultants than the SACH for all four variables, but for S4 the SACH produced significantly greater peak forces and moments than the PerfectStride and BioStride. For S3 the 1st peak of force occurred at 31% of stance but the minimum moment occurred earlier at 25% of stance, suggesting that the moment arm was directed anterior to the transducer. In contrast, the 1st peak of force for S4 occurred at 25% of stance and appeared to have a relatively long moment arm directed posterior toward the heel; the minimum moment occurred late at 41% of stance. The firm heel plug requested by S4 for his SACH foot may have caused the high 1st peak force and delayed the occurrence of the minimum moment. The 1st force peaks of S4’s SACH and PerfectStride feet were significantly greater than the BioStride’s, and the 2nd force peak of the SACH foot was significantly greater than both the PerfectStride’s and BioStride’s. However, the 2nd moment peak was significantly greater for the PerfectStride than for either the SACH or BioStride.
Compared to SSCS level walking, walking down a ramp (Figure 4) tended to accentuate heel loading patterns and the loading effects resulting from foot design around the 1st force peak. It produced low 2nd peak resultant forces and moments for all subjects and all feet. It produced high 1st peak resultant forces for S1’s Renegade and Trustep feet and S3’s Flex-Foot. Comparison of S3’s SACH and Flex-Foot curves between the peaks revealed major differences in the smoothness of the transition of the force and moment relationships. S3’s SACH foot again exhibited an incomplete loop indicating the occurrence of minimum moment prior to the 1st peak of force, whereas with the Flex-Foot the minimum moment occurred subsequent to the 1st peak. S4 exhibited high 1st peak moments and complex transition curves between the peaks. Minimum moments were not evident for the PerfectStride and BioStride feet around the 1st force peaks, but occurred very early, suggesting that the moment arm was directed anterior toward the toe throughout nearly all of stance. The effects of the coil spring design of the PerfectStride appeared to be evident as the 1st peak resultant force was approached; the curve exhibited a concave curl and was coincident with the curve for the decrease in the resultant force after peaking.
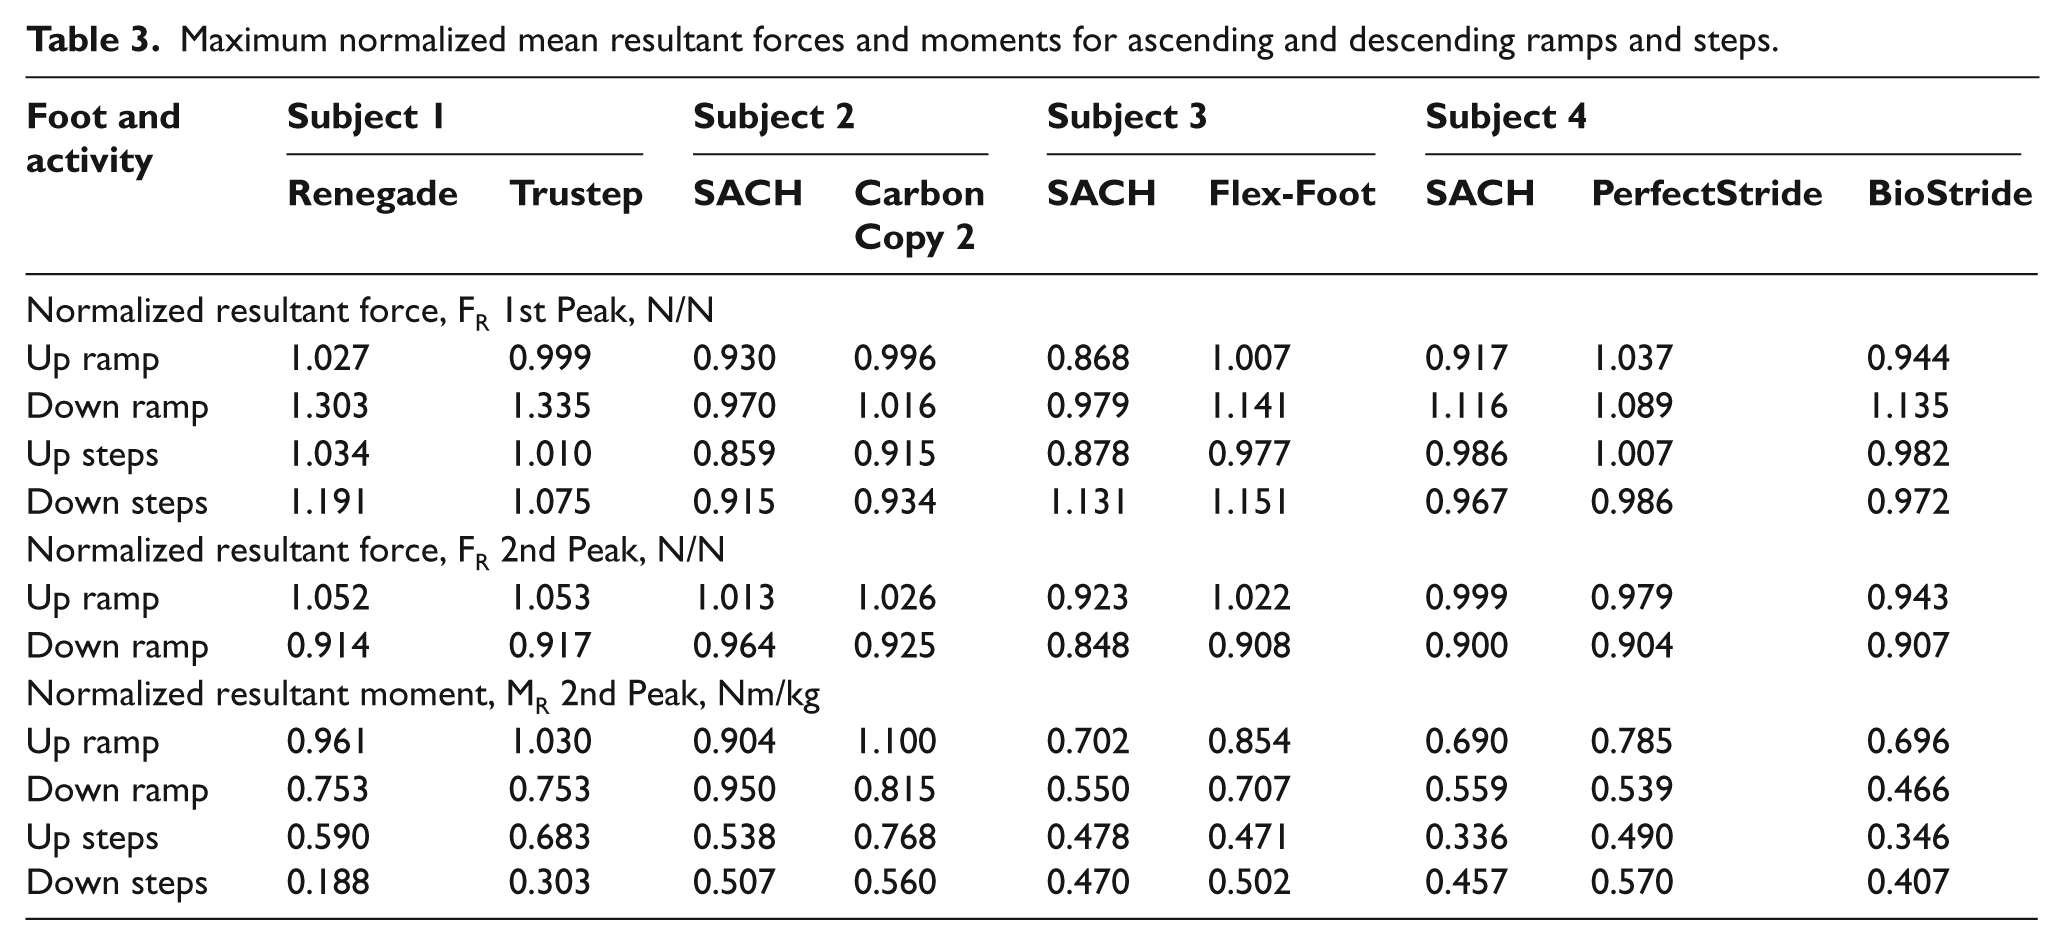
Maximum normalized mean resultant forces and moments for ascending and descending ramps and steps.
Walking up a ramp tended to accentuate the effects of foot design on the 2nd peak resultant forces and moments (Figure 4). Except for S4’s SACH foot, the curves exhibited little or no complete looping around the 1st peak force, which implied that the peak force never occurred prior to the minimum moment but later when the moment arm was directed anterior towards the toe. Curves appeared similar to SSCS walking for S1 for both the Renegade and Trustep feet, for S2 for the Carbon Copy 2 foot, for S3 for the Flex-Foot, and for S4 for the SACH, PerfectStride and BioStride feet. The 1st and 2nd peak resultant force was noticeably lower for S2’s SACH foot and S3’s SACH foot than for SSCS level walking. S4’s BioStride had a complex curve with similarities to SSCS level walking and walking down a ramp.
Going down steps (Figure 5) was notable for the absence of two distinct resultant force peaks separated by a trough, though a small ‘fin’ representing a 2nd peak usually was evident. This activity produced relatively high peak resultant forces but small peak resultant moments. The greatest resultant moments were roughly 25% of those for SSCS level walking for S1, 50% for S2, and 67% for S3 and S4. Within subjects, patterns appeared similar for the two or three feet tested, suggesting that walking down steps does not evoke noticeable differences in loading between feet of different design.
Going up steps (Figure 5) also did not produce two distinct resultant force peaks separated by a trough, but frequently either a ‘fin’ or a distorted ‘snout’ was observed. Compared to going down steps there was less within- subject similarity in the patterns among feet. Peak resultant forces were lower than for SSCS level walking for all subjects. For S1 and S3 peak resultant forces were lower going down steps than up steps. Peak resultant moments tended to be similar going both up and down steps for for S2’s SACH foot, S3’s SACH and Flex-Foot, and S4’s PerfectStride foot.
Discussion
The transducer measures the interaction between the unique gait habits of the individual amputee and the design characteristics of a particular foot. Self-selected comfortable speed level walking appears to create clear differences between feet whereas stairs do not, and ramps tend to exaggerate performance of either the heel or toe. The plots in Figure 3 indicate that feet of different design can produce similar loading patterns as exemplified by S1’s use of the Renegade and Trustep, while feet of identical design can produce different patterns as exemplified by the SACH feet used by S2 and S3. Feet of similar design can produce different loading patterns for a given individual as exemplified by S2’s SACH and Carbon Copy 2 feet, and feet of different design can produce dissimilar loading patterns for a given individual as exemplified by S3’s Flex-Foot and SACH feet and S4’s SACH, PerfectStride and BioStride feet. Larger samples of subjects would be necessary to make any scientific generalizations about the loading patterns of feet featuring specific designs, and should include amputees who function at the K2 and K3 levels. It also would be desirable to obtain data on amputee perceptions and preferences and relate these to loading patterns. Clinically relevant intervening variables that might influence perceptions include sensitivity of the residual limb to pressure, energy requirements, and preferred knee joint flexion range of motion during stance. Additional research also should be conducted to refine the methods used to obtain above-prosthesis weight for normalization of the data.
Based on only four subjects, generalizations are speculative. The data suggest that when making decisions in the clinic, heel loading patterns can be considered separately from forefoot loading patterns. This also was recommended by a previous study which proposed a classification system for ESAR feet that separates the energy storage and return characteristics of the heel from the forefoot. 12 The transducer does not measure energy storage and return; this can be determined only by mechanical testing. However, the 1st peak of the resultant force appeared to be associated with heel loading and because of this the 1st peak should occur no later in stance than the time at which the moment is a minimum, before the moment arm changes from a posterior to an anterior direction. This was the case for all subjects except S3 using the SACH, which the data suggest may have developed foot-flat prematurely due to a heel design which absorbs high amounts of energy but returns only a low amount of energy. 12 S4 may have been able to counter the tendency toward a premature foot-flat by incorporating a firm heel plug in his SACH foot. S2 may have been able to develop a compensatory gait that minimized the tendency toward early foot-flat; he complained that walking with the SACH required an amount of effort that he would not want to expend for long, and he did not perceive much difference between the SACH and the Carbon Copy 2. A 1st peak that occurs close to 25% of stance was the mode for the feet in the study and tentatively could be a used as an objective for clinical practice. As the length of a moment arm directed posterior toward the heel increases, the potential for utilizing the spring characteristics of ESAR heel design may increase. It also may be desirable to avoid 1st peaks of high magnitude since these are associated with weight acceptance and the initial loading of the residual limb. The optimum timing and magnitude of the 1st peak will depend on the gait characteristics of individual patients, however.
The 2nd peak of resultant force occurs on the forefoot and is associated with forward progression. A large magnitude 2nd peak may be desirable for propulsion, but the timing of the peak and the length of the moment arm may be important considerations. With the ESAR feet for which the subjects had prior experience, the 2nd peak occurred between 69% and 73% of stance. It tended to occur earlier for the feet the subjects had little experience with. For S1’s Renegade, S2’s Carbon Copy, S3’s Flex-Foot and S4’s Perfectstride, the slopes of the lines connecting the origin of Figure 3 with the 2nd peak of resultant force were greater than the slopes of the lines for the comparison feet, indicating a longer moment arm. Combining the longer moment arm with the later occurrence of the 2nd peak suggests that the 2nd peak may have occurred when the ground reaction force was further out toward the toe. This might imply increased potential for utilizing the spring characteristics of ESAR forefeet. The optimum timing and magnitude of the 2nd peak also will depend on the gait characteristics of individual patients.
The role of the shape of the loading curve between the two resultant force peaks requires further study. For the feet which the subjects commented favourably on, which were the Renegade, Flex-Foot and PerfectStride, the curves between the force peaks appear symmetric and exhibit a force minimum at a point during stance when the moment is approximately half its 2nd peak maximum value.
The data indicated that the normalized resultant force was greater than 0.50 about 85% of the time that the amputee was on the prosthetic foot; thus normalized loading greater than 0.50 may be of most interest to the analysis of foot performance and gait. Linearity of the force-moment relationship can be detected with the plots. Wherever a curve in Figure 3 exhibits a nearly straight sloped (non-vertical and non-horizontal) line of the form MR = k X FR (4) which appears to intersect the origin of the plot, the normalized resultant moment can be expressed as a constant times the normalized resultant force over the length of the line. The constant k is proportional to the length of the moment arm in metres times the conversion factor that relates Newtons of force to mass at the earth’s surface in kg, 9.807 N/kg. If the slopes of a series of lines connecting the origin to points on a curve change very little, the length of the moment arm changes very little. The plots indicate that linear relationships and nearly constant moment arm lengths appeared to exist when the normalized resultant force was less than approximately 0.70 to 0.50 during initial heel loading and less than approximately 1.00 during terminal forefoot unloading. Moment tended to increase non-linearly with force between the 1st and 2nd force peaks, but decreased nearly linearly as resultant force decreased following the 2nd peak. Since the slopes of the lines connecting the origin to the 2nd peak were approximately the greatest slopes for each of the curves, the moment arms during the 2nd peak were approximately the longest that occurred during forefoot loading. During loading and unloading of the forefoot, moment never appeared to increase either before or after the magnitude attained by it during the 2nd peak of the normalized resultant force. This may be related to the passive ankle designs of the feet examined – the maximum normalized resultant moment that resulted from forefoot loading was closely coupled to the maximum normalized resultant force that could be generated.
Knee joint range of motion may influence where the line of action of the resultant ground reaction force passes through the forefoot at the time when the 2nd peak of the resultant force is generated. Since stiffness of the forefoot and the resulting moment will vary with the location of the point of contact relative to the toe, knowledge of acceptable knee range of motion could help identify which foot designs match amputee gait characteristics.
Use of force-moment plots to interpret loading patterns requires that moment magnitudes are known accurately. The measurement of moments using a transducer mounted on the pylon offers advantages over the use of a forceplate and motion capture to estimate moments by means of inverse dynamics. When inverse dynamics is used to examine prosthetic feet in a traditional laboratory setting, a required assumption is that the foot has a constant centre of rotation and can be represented by a rigid lever arm. For many prosthetic feet it is not clear where the centre of rotation is located, and it may vary during gait. 13 Also, the flexible nature of the keel of prosthetic feet violates the assumption of a rigid lever arm. In addition, the magnitudes of the normalized force and moment resultants obtained from the transducer do not depend on the frame of reference; they are the same in both a global frame and a frame attached to a socket. A prosthesis moves during gait, and the frame of reference for a transducer is fixed to the prosthesis. Compared to the use of a global frame of reference which is fixed to the floor of a gait lab, determining the position and orientation of a resultant with respect to the prosthesis and residual limb by means of a transducer involves fewer assumptions and computations and less opportunity for error to creep into calculations.
Another benefit of the transducer is that the subject does not have to repeat walking trials until a minimum number of successful contacts with a forceplate have been obtained. Data collection is more rapid, requires fewer steps, and can take place outside of the laboratory setting. Sequences of steps can be examined. In a gait lab, if a subject becomes aware of the need to contact a force plate, and strives to accomplish this on each trial, the result could be variances in loading that are larger than those which typically occur during everyday walking, and significant differences in loading between feet of different design may disappear. The transducer data exhibited relatively small variances about mean values, as shown in Figure 2 and Table 2. If in vivo variances are smaller than those obtained in a gait lab, use of a transducer could lead to detecting a greater number of significant differences than measurements taken in a gait lab using a forceplate and inverse dynamics. Also, use of a transducer would make it relatively easy to design an experiment to determine whether each amputee trends toward a possibly unique force-moment pattern as adaptation time increases for a foot. This could be useful for establishing minimum adaptation periods for both patient management and scientific research.
A number of laboratory gait studies have compared feet of different design in vivo using forceplates, motion capture and inverse dynamics, tilting treadmills or oxygen uptake measurement systems. Many of these earlier studies have been summarized in the literature.14-16 A finding of in vivo studies using traditional gait lab methods is that few significant differences can be detected between ESAR and SACH feet even though the amputees state preferences for ESAR feet. However, a lack of statistical significance with respect to kinetic variables obtained using either forceplates and motion capture or transducers may not be an indication of a lack of perceived difference by an amputee. It is possible that use of lower levels of confidence (e.g. p values <0.50) might better match amputees’ preferences if their residual limbs are very sensitive to pressure. 17
Studies of transtibial amputees using transducer data and in vivo data collection methodology similar to this study are lacking. This makes it difficult to examine results within the context of other studies. Studies have examined pressures on the transtibial residual limb that occur on slopes and steps, but inferences about the forces and moments occurring at the base of the socket cannot be made from these.18-19 One study computed gait symmetry for stair ambulation and concluded that no benefit results from ESAR feet because the individual does not roll over the forefoot 20 ; our results using transducer measurements indicated that stairs do not appear to produce noticeably different peak forces and moments when feet are compared.
Conclusion
The transducer opens new opportunities for clinical research on the outcomes associated with different prosthetic components, subject characteristics and activities. Transducer measurements are able to detect differences in loading patterns between feet, activities and subjects, and clinically relevant information can be obtained from plots of normalized force versus normalized moment. The instrumentation is inexpensive and can be set up quickly and easily to capture data in environments outside a gait lab or in a clinic. Data collection is rapid, and the GUI makes it possible to process the data quickly and efficiently. The downside is that the transducer provides no information about the contra-lateral limb, joint kinetics and kinematics, energy costs, or the amounts of energy stored and released by ESAR feet. Future studies using transducers should incorporate subjective data on amputee perceptions and preferences.
Footnotes
Acknowledgements
Assistance in the recruiting of subjects was provided by Hanger Orthopedic Group Inc. and BioQuest Prosthetics.
This research was supported by the US Army Medical Research and Materiel Command [grant number W81XWH-07-2-0084].
The authors declare that there is no conflict of interest.