
Abstract
Background: There is a relation between Hounsfield units obtained from computed tomography (CT) scans and bone density. The density of the bones can be used to establish its mechanical properties and therefore to assess the bone mechanical condition using CT images.
Objectives: To identify the effect of the transfemoral amputation and the use of external lower limb prosthesis in the bone properties, by comparing Young’s modulus.
Study Design: Young’s modulus comparison.
Methods: Comparison of bone density between the healthy femur and the amputated bone of 20 unilateral transfemoral amputees was done by generating three histograms of the Hounsfield units at different parts of the femur. The histograms were created based on images obtained by CT and the Hounsfield units were translated to Young’s modulus to establish the comparison.
Results: The results show a significant difference (p-value <0.05) between the mean value of Young’s modulus of healthy and amputated bone.
Conclusions: There is clearly a direct association between the use of external prosthesis and the bone demineralization due the stress shielding phenomenon. The Young’s modulus comparison using information from CT images can be a suitable tool to analyze the bone demineralization due to the use of exoprosthesis.
Clinical relevance
The Young’s modulus comparison using information from CT images can be a suitable tool to analyze the bone demineralization due to the use of exoprosthesis.
Background
Lower limb amputation is a severe psychological and physical event. A prosthetic solution can be provided but it should respond to patient-specific geometrical and biomechanical requirements.
The use of a prosthetic device not only increases the autonomy of the amputees but can also improve their quality of life. However, the use of prosthesis modifies the force flow in the stump, which can be reflected mainly in changes over biological composition of the hard tissues, the behaviour of the skin and subcutaneous tissues.
Computed tomography (CT) is a diagnostic tool in which images are generated by X-rays. Those images generate a gray scale according to the level of intensity received by the receptor of the CT scanner. Every tissue has a different absorption level of radiation, which is reflected in the damping of the X-rays passing through it. This phenomenon is quantified by the tomograph and is then converted to Hounsfield units (HU) which are ranged from −1,024 to 3,071, 0 being the value for water. 1 The level of damping is a direct function of the material density, 2 the HU values can therefore be used to map density distribution in specific zones.3,4
Mechanical properties of the bones are related to their structure, composition and mineralization, and each one of them is linked to bone density.5-8 Matrix mineralization and porosity of the cortical bone determines its density and also have a direct relation with the elastic modulus (Young’s modulus).8,9 This is also true for the trabecular bone.10,11 There are some references available where a mathematical relation between density and mechanical properties in the bone are established.5,12,13
Currently, the use of computational simulations based on the finite element method (FEM) to establish the stress-strain state over biological tissues is a common practice. The accuracy of the results obtained by these simulations is directly related to the ability of the researcher to reproduce precisely the geometries, the boundary conditions and the mechanical properties of the simulated phenomenon. For biomechanical models, specifically those where soft and/or hard tissues are involved; one of the most important input for the FEM, is the constitutive equation used to represent the tissues. The use of CT as a tool to obtain accurate values of density and then relate them with mechanical properties of the bone is common for numerical models.12-17
Mechanical stresses over the bone stimulate the action of the osteoblast and can generate an increase of local bone density (ossification), 18 which is directly related to bone stiffness.19-21 The ability of the bone to modify its shape and inner structure in response to a change in its load state is known as functional adaptation by remodelling, also known as Wolff`s Law. 22 The exact mechanism that regulates the bone remodelling is the object of study,23-25 but it is believed that under a mechanical load, the deformation in the bone matrix produces an interstitial fluid flow in the lacuno-canicular system that induces shear stress on the osteocytic process membrane, which regulates the formation of new bone tissue (by the osteoblasts) and the bone reabsorption (by osteoclasts).
The use of a prosthetic device modifies the stress distribution in tissues that are around and linked with the prosthesis. Usually the stiffness of the prosthesis is greater than that of the original tissue, therefore the prosthesis takes most of the part in the mechanical stimulus and reduces its presence over the bone tissue. This produces a particular case of bone remodelling known as stress shielding.
The stress shielding phenomenon has been studied as an effect of the use of endoprostheses.13,26-28 While for exoprostheses, the studies have been focused on establishing the stress-strain state in the socket-stump system, mainly for transtibial amputees,28-39 however, there are no references related to stress shielding as a consequence of exoprostheses use.
Mechanical behaviour for materials can be described by many parameters; one of them is the Young’s modulus which relates linearly the stresses and strains generated inside the material under external forces. Therefore, Young’s modulus can be useful to assess the variation of mechanical properties in bone tissues.
This study aims to identify the effect of the transfemoral amputation and the use of external lower limb prosthesis over Young’s modulus of the bone. Taking into account that the variation of this parameter is more visible in its maximum value, a comparison between the maximum value of amputated lower limb against maximum value of the healthy lower limb for the same subject were done.
Method
Twenty patients with a unilateral transfemoral amputation were selected. Table 1 shows their general characteristics. All of them were relatively active in their daily life, and did not have any additional physical, vascular, neurological or psychological condition that could alter or modify the results of this study. The patients used a non-distal end support socket, a solid ankle cushioned heel (SACH) foot, and mechanical monocentric knee prosthesis. They did not use a liner or a sock. According to the ethics committee of the National University of Colombia proper informed consent was provided by the patients, before the procedure took place.
Characteristics of the patients.
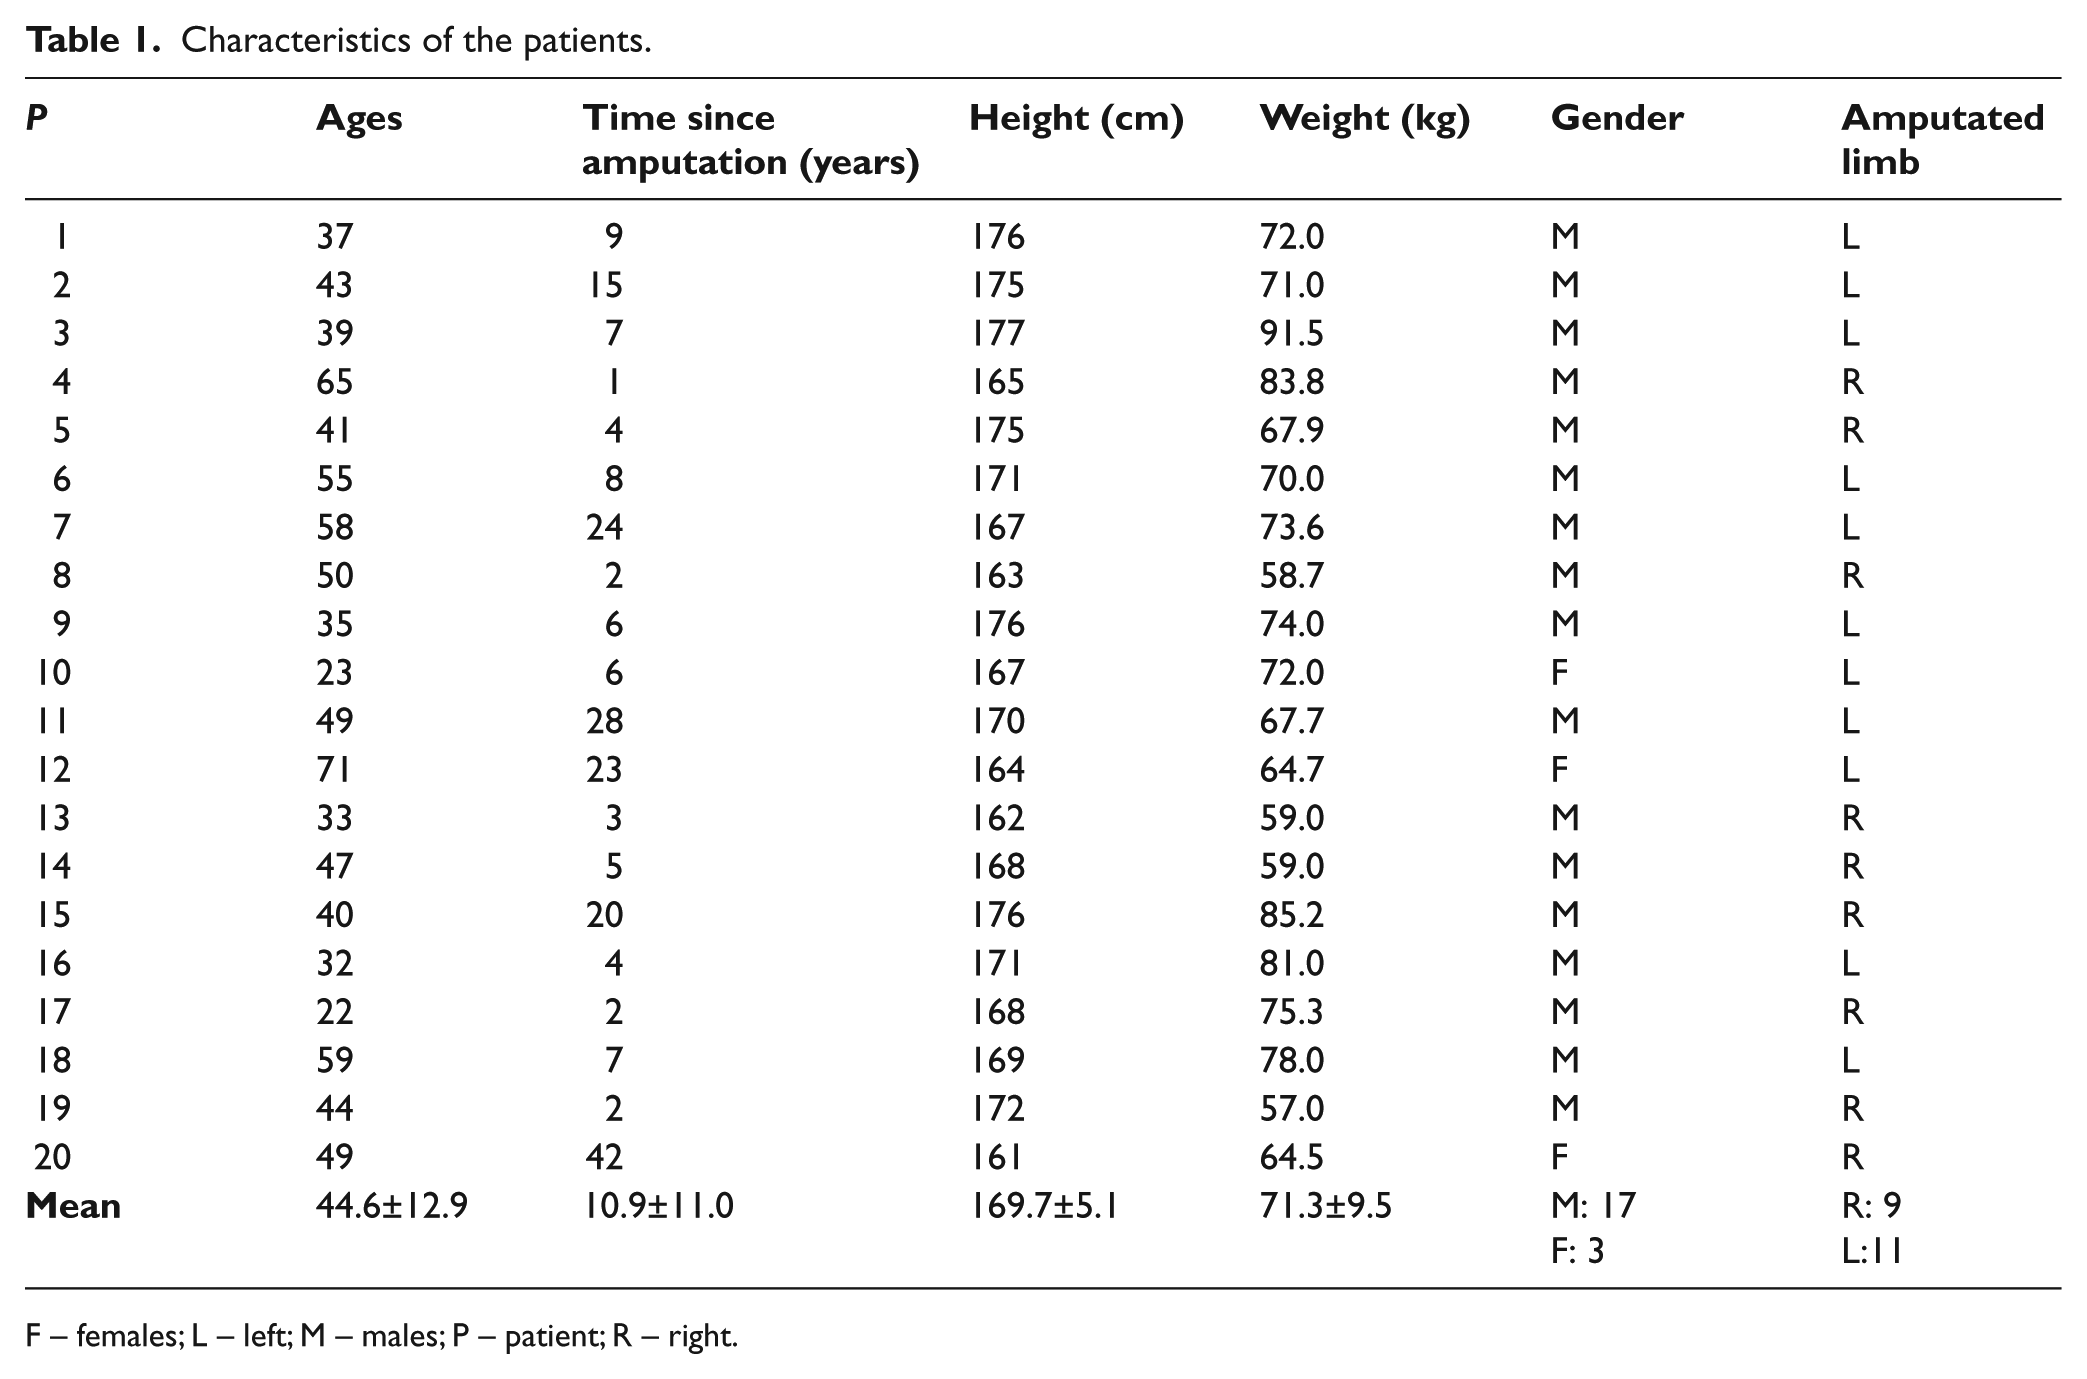
F – females; L – left; M – males; P – patient; R – right.
Computed tomography
The parameters used for the scan were: SIEMENS/Emotion6 Scanner, 112mAs, 130 KV, 512x512 pxlmatrix, pixel size 0.758 mm, gantry tilt 0.00 and slice increment 1 mm. They were the same for all patients.
During the CT scan, the patients were in a laying supine position over the tomograph table, and were not wearing their prosthetic socket or any additional element like socks or liners around their residual limbs.
Processing of images
To make possible the comparison between healthy and amputated femurs, three different zones were selected:
ZONE I: neck of the femoral head;
ZONE II: metaphysis, just below the minor trocánter;
ZONE III: the proximal quarter part of the diaphysis.
These regions can be seen in Figure 1a. They were selected because they are typical zones where a cortical bone is thicker, which allows a clear differentiation between bone and other tissues.
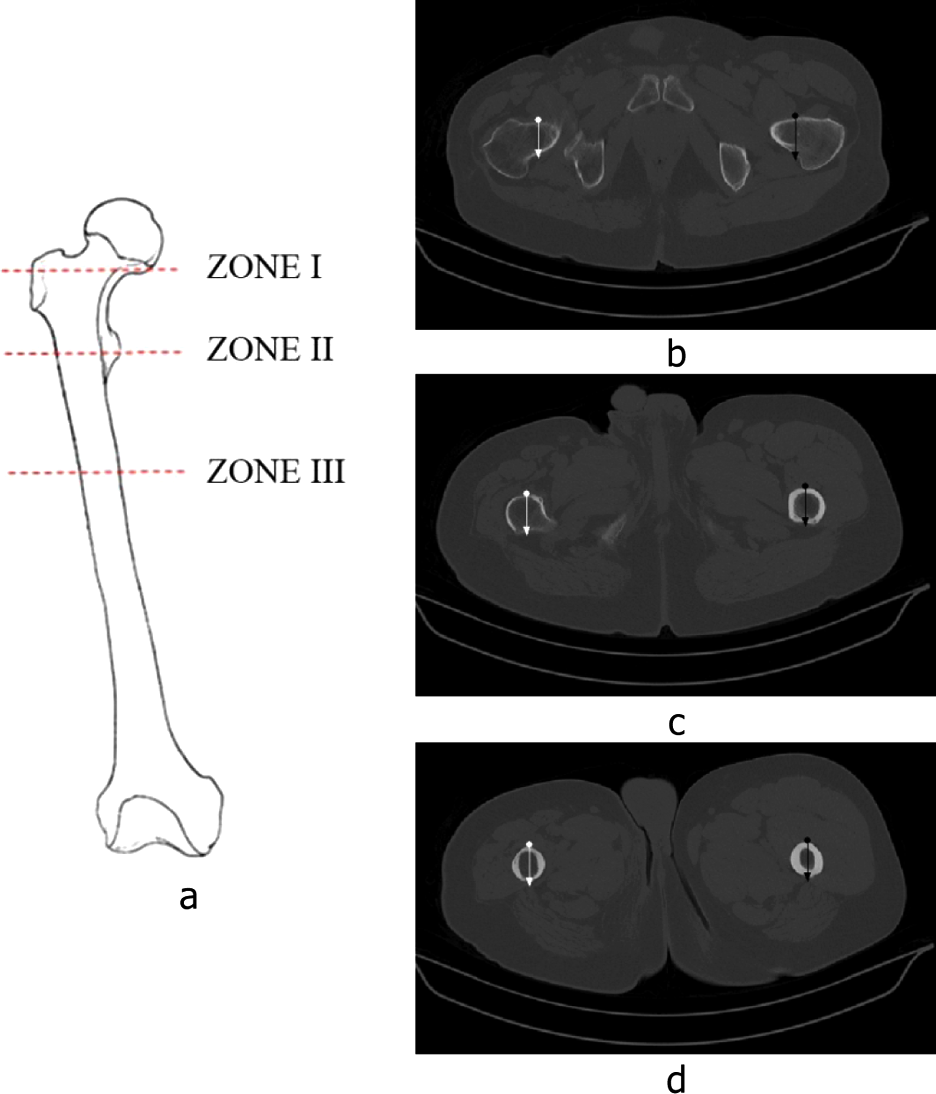
(a) Zones selected for histograms; (b) Slice of Zone I; (c) Slice of Zone II; (d) Slice of Zone III.
Using the mathematical software Matlab 7, a homemade algorithm was developed in order to process the CT images; based on the intensity levels of the pixels a HU value is given to each pixel included over any trajectory defined by a specified vector.
Considering that the relationship between HU and the bone mineral density is linear, the HU data were subsequently converted to an equivalent mineral density ρEQM established by Yosibasha and colleagues 40 using Equation 1. Also, Young’s modulus (E) was reported as a function of ash density ρash; this can be seen in Equations 2 and 3. 41
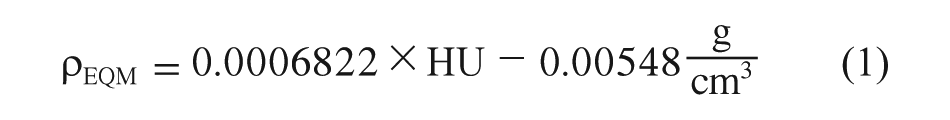
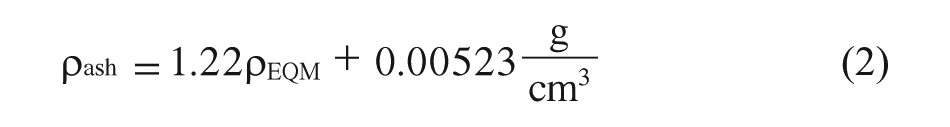
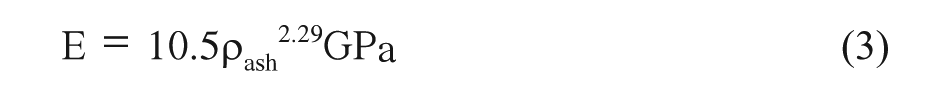
As it is presented by Keller, 41 Equation 3 is valid for both types of bone, cortical and trabecular, and for ρash range between 0.092–1.221 g/cm3, therefore it is possible to use it in this study.
For each specific zone a trajectory vector was generated from anterior to posterior sides of the stump as shown in Figure 1b. Using the coordinates and directions described by the vector, a total of three comparative HU histograms were developed for every patient (Figure 2), one for each zone. Those HU histograms were then translated to Young’s modulus histograms (Figure 3) using Equations 1–3.
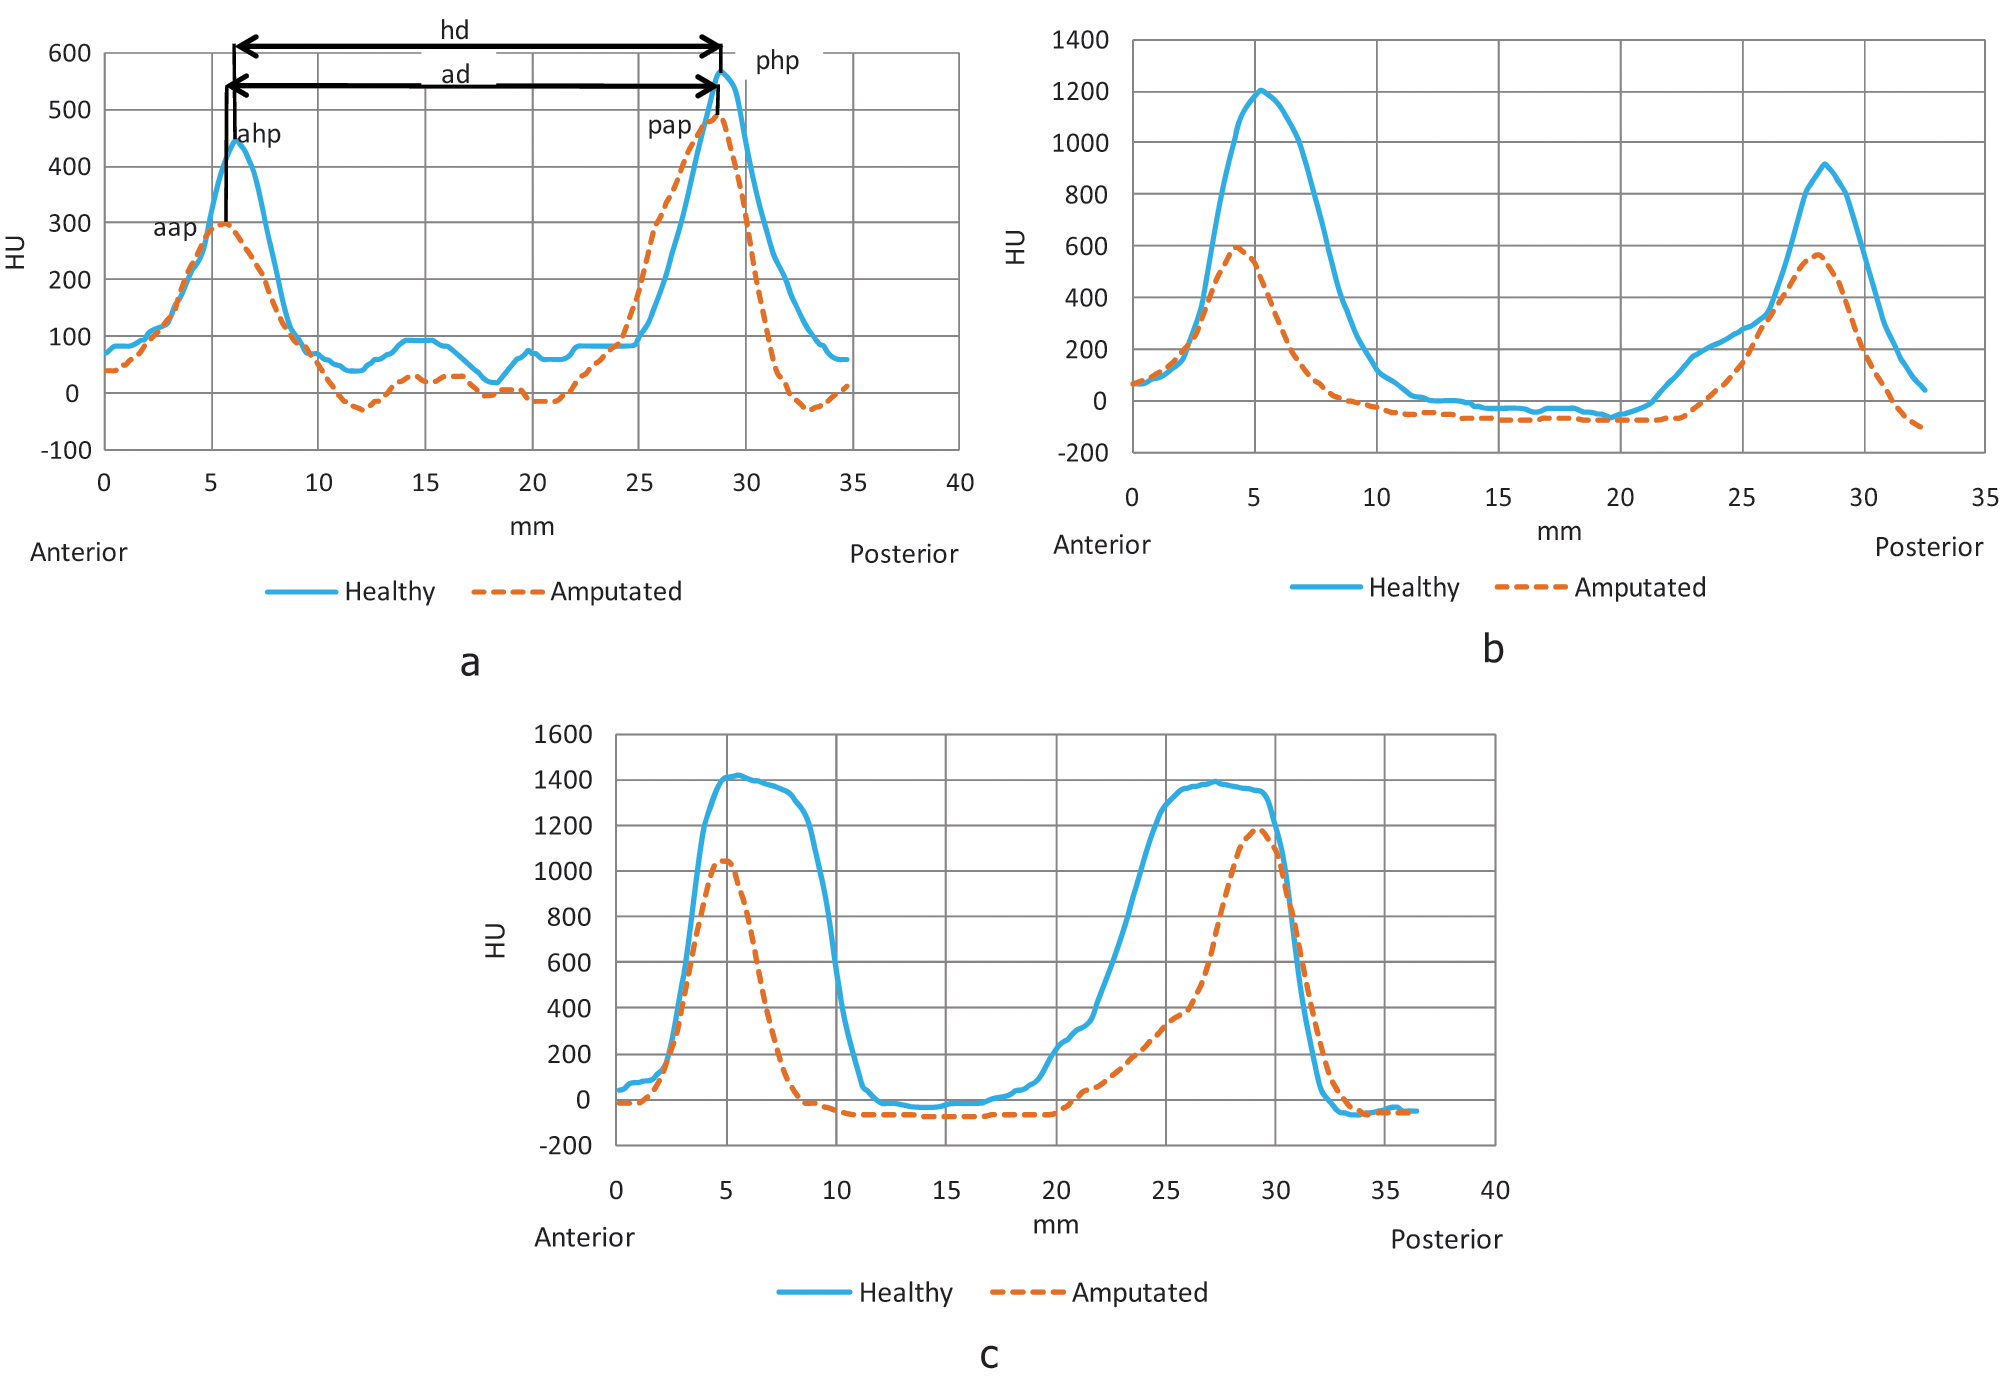
Sample of HU histograms. (a) Zone I; (b) Zone II; (c) Zone III.
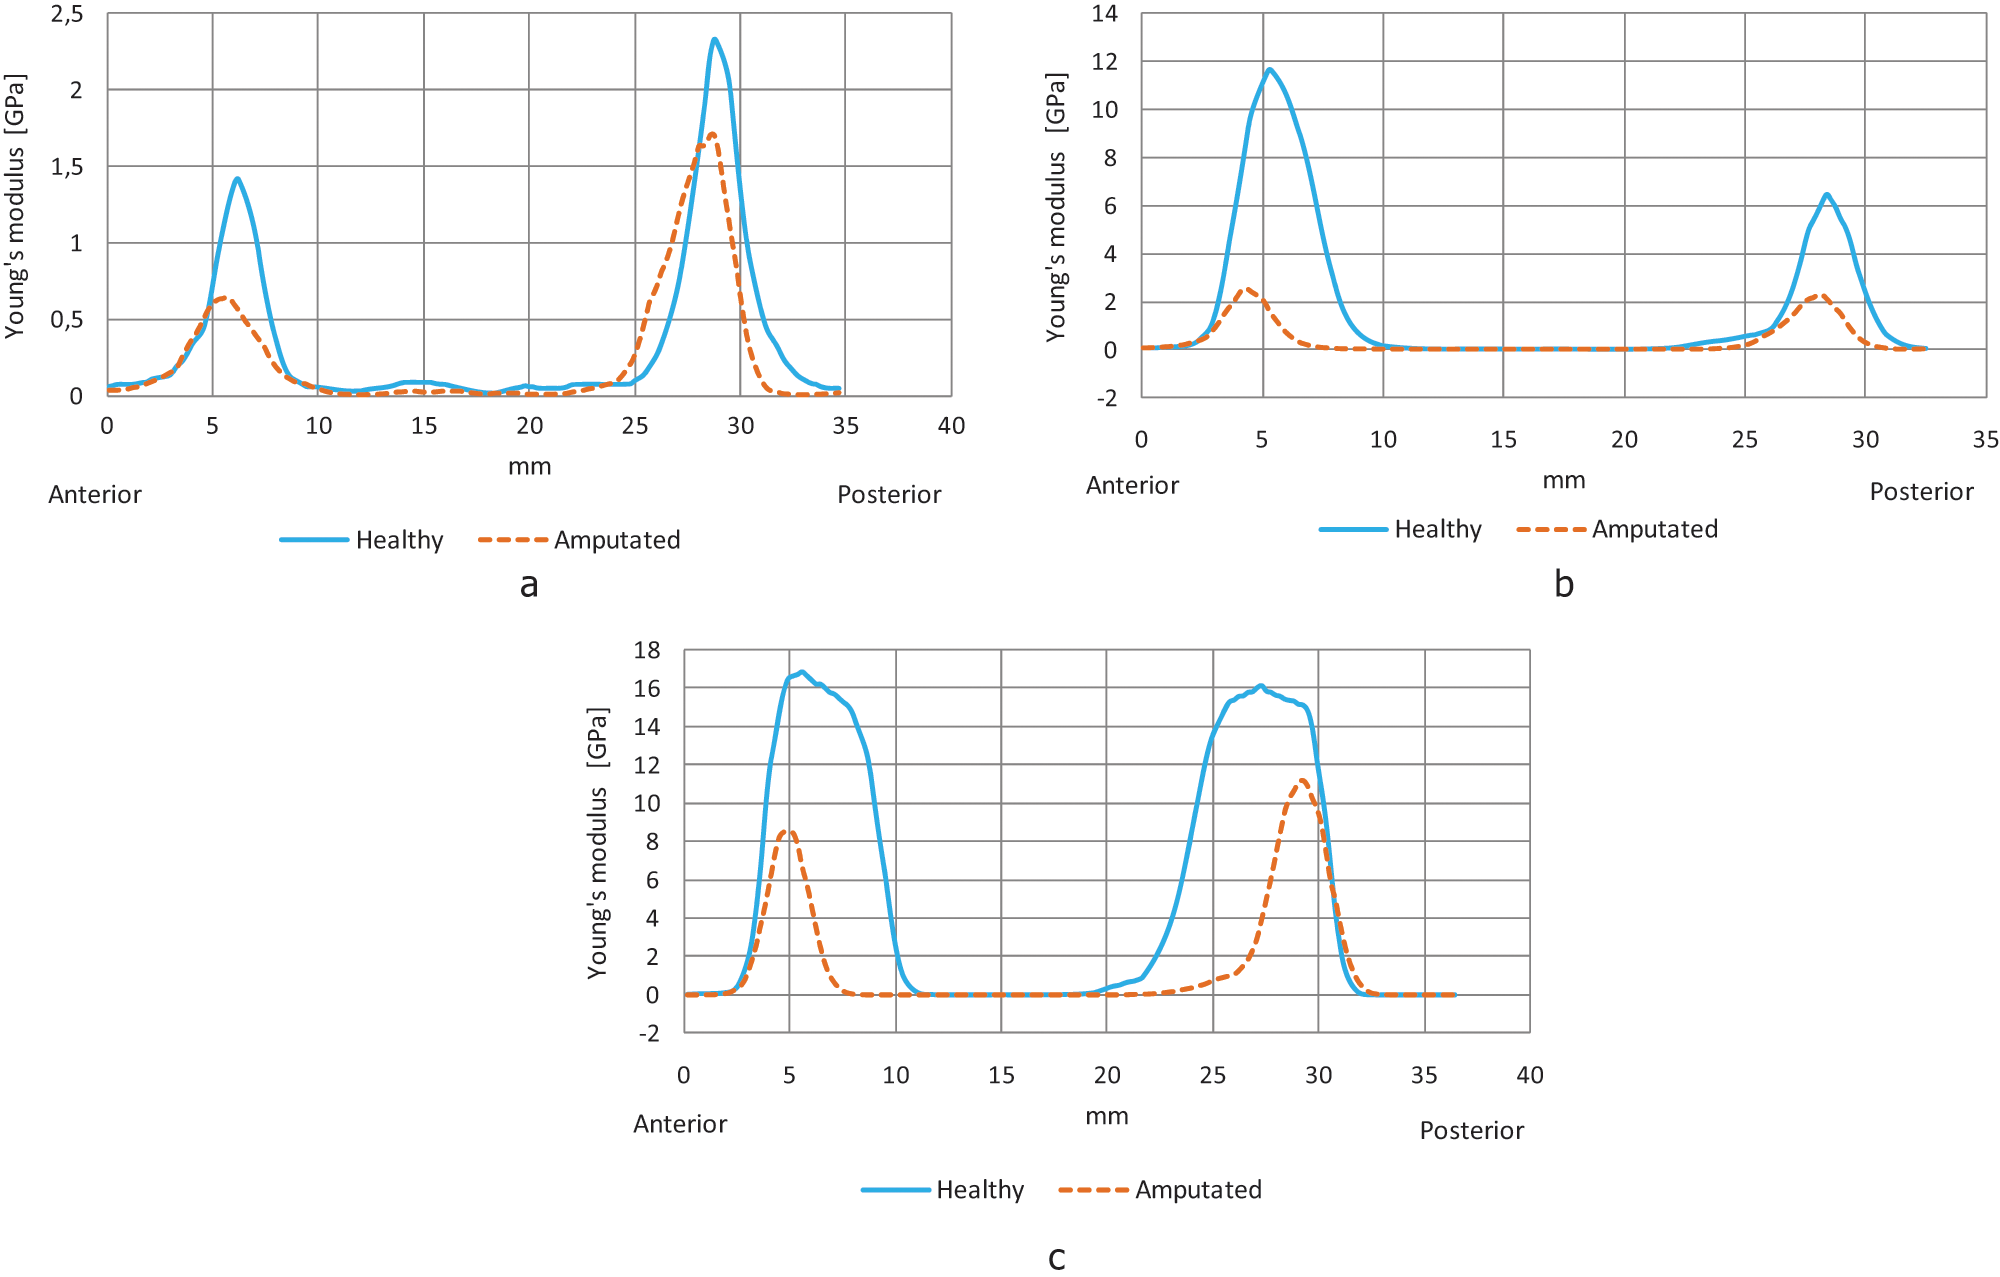
Sample of Young’s modulus histograms. (a) Zone I; (b) Zone II; (c) Zone III.
Results
In Figure 2, the three histograms obtained from the tomographies can be seen. In those histograms, the blue curve represents the variation of the HU in the healthy femur, and the dotted orange curve represents the HU variation in the amputated femur. In these histograms the horizontal axis represents the distance in millimetres (mm) from the beginning to the end of the vector generated, and the vertical axis represents the HU values.
In Table 2, the HU mean peak values for anterior side and posterior side are summarized and the distance between peaks is shown, these values are compared zone by zone. For P20 there is no information relative to zone 3 because the stump was very short and it did not reach the proximal quarter part of the diaphysis. The mean was made excluding P17’s HU values because they distort the results, since he has a metallic endoprosthesis into his femur.
Mean HU values for each zone in healthy and amputated femurs.
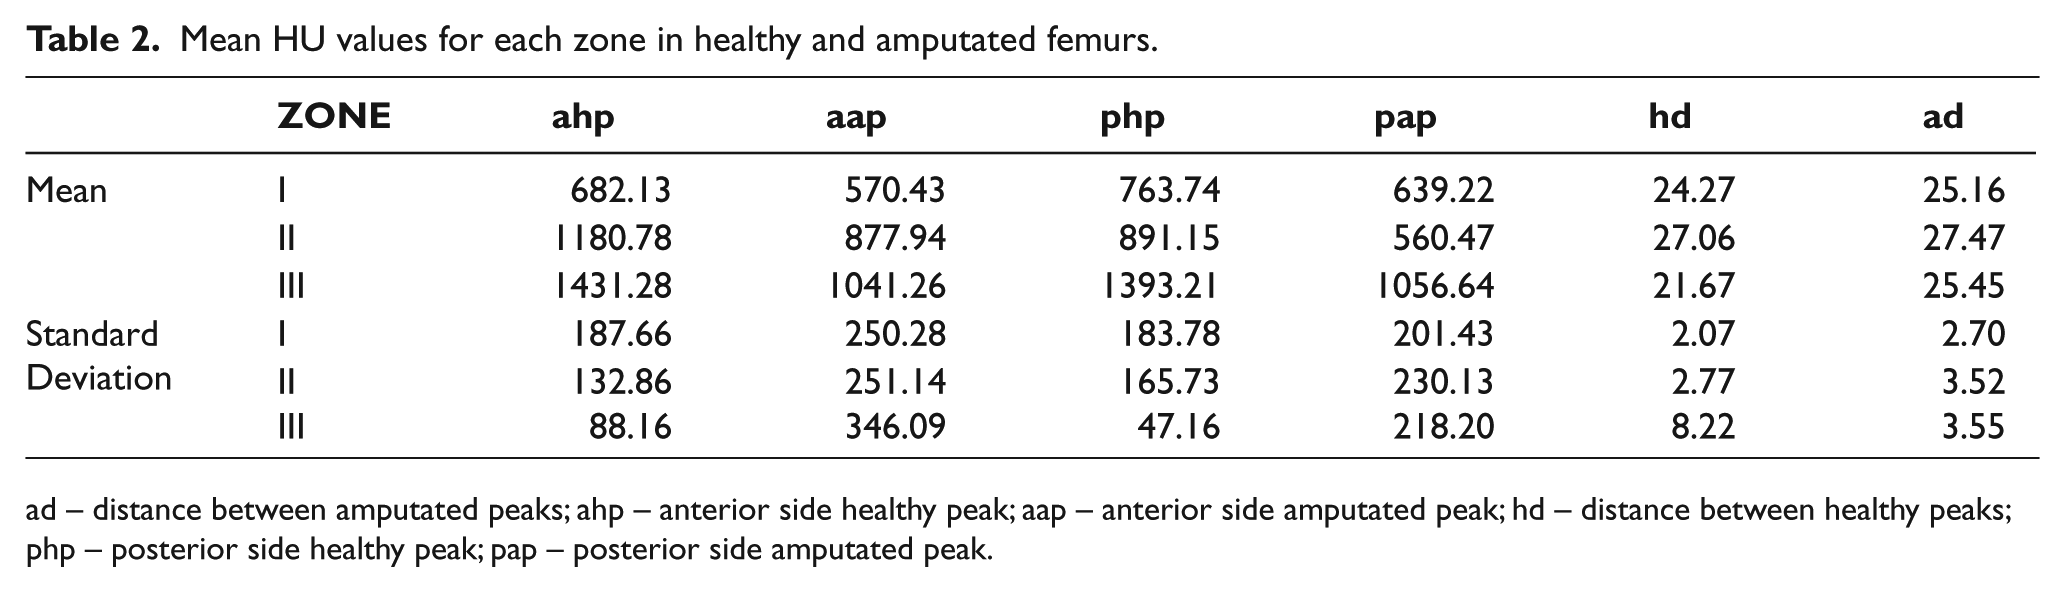
ad – distance between amputated peaks; ahp – anterior side healthy peak; aap – anterior side amputated peak; hd – distance between healthy peaks; php – posterior side healthy peak; pap – posterior side amputated peak.
In Figure 3, a sample of the three histograms for Young’s modulus can be seen. In those histograms, the blue curve represents the variation of the Young’s modulus in the healthy femur, and the dotted orange curve represents the Young’s modulus variation in the amputated femur. The histogram for the healthy femur is above the histogram for the amputated femur, this form is similar for all patients, except for P17 and P20.
The curves of Young’s modulus obtained for all patients have a similar form. Twenty histograms with the complete information of Zone I, II and III were made (not presented), their maximum values, mean and standard deviation (SD) are presented in Table 3. The mean of Young’s modulus related to the healthy femur for Zone III is 1.6 and 3.8 times the mean that of Young’s modulus corresponding to Zone I and Zone II respectively.
Maximum Young’s modulus values for each zone in healthy and amputated femurs.
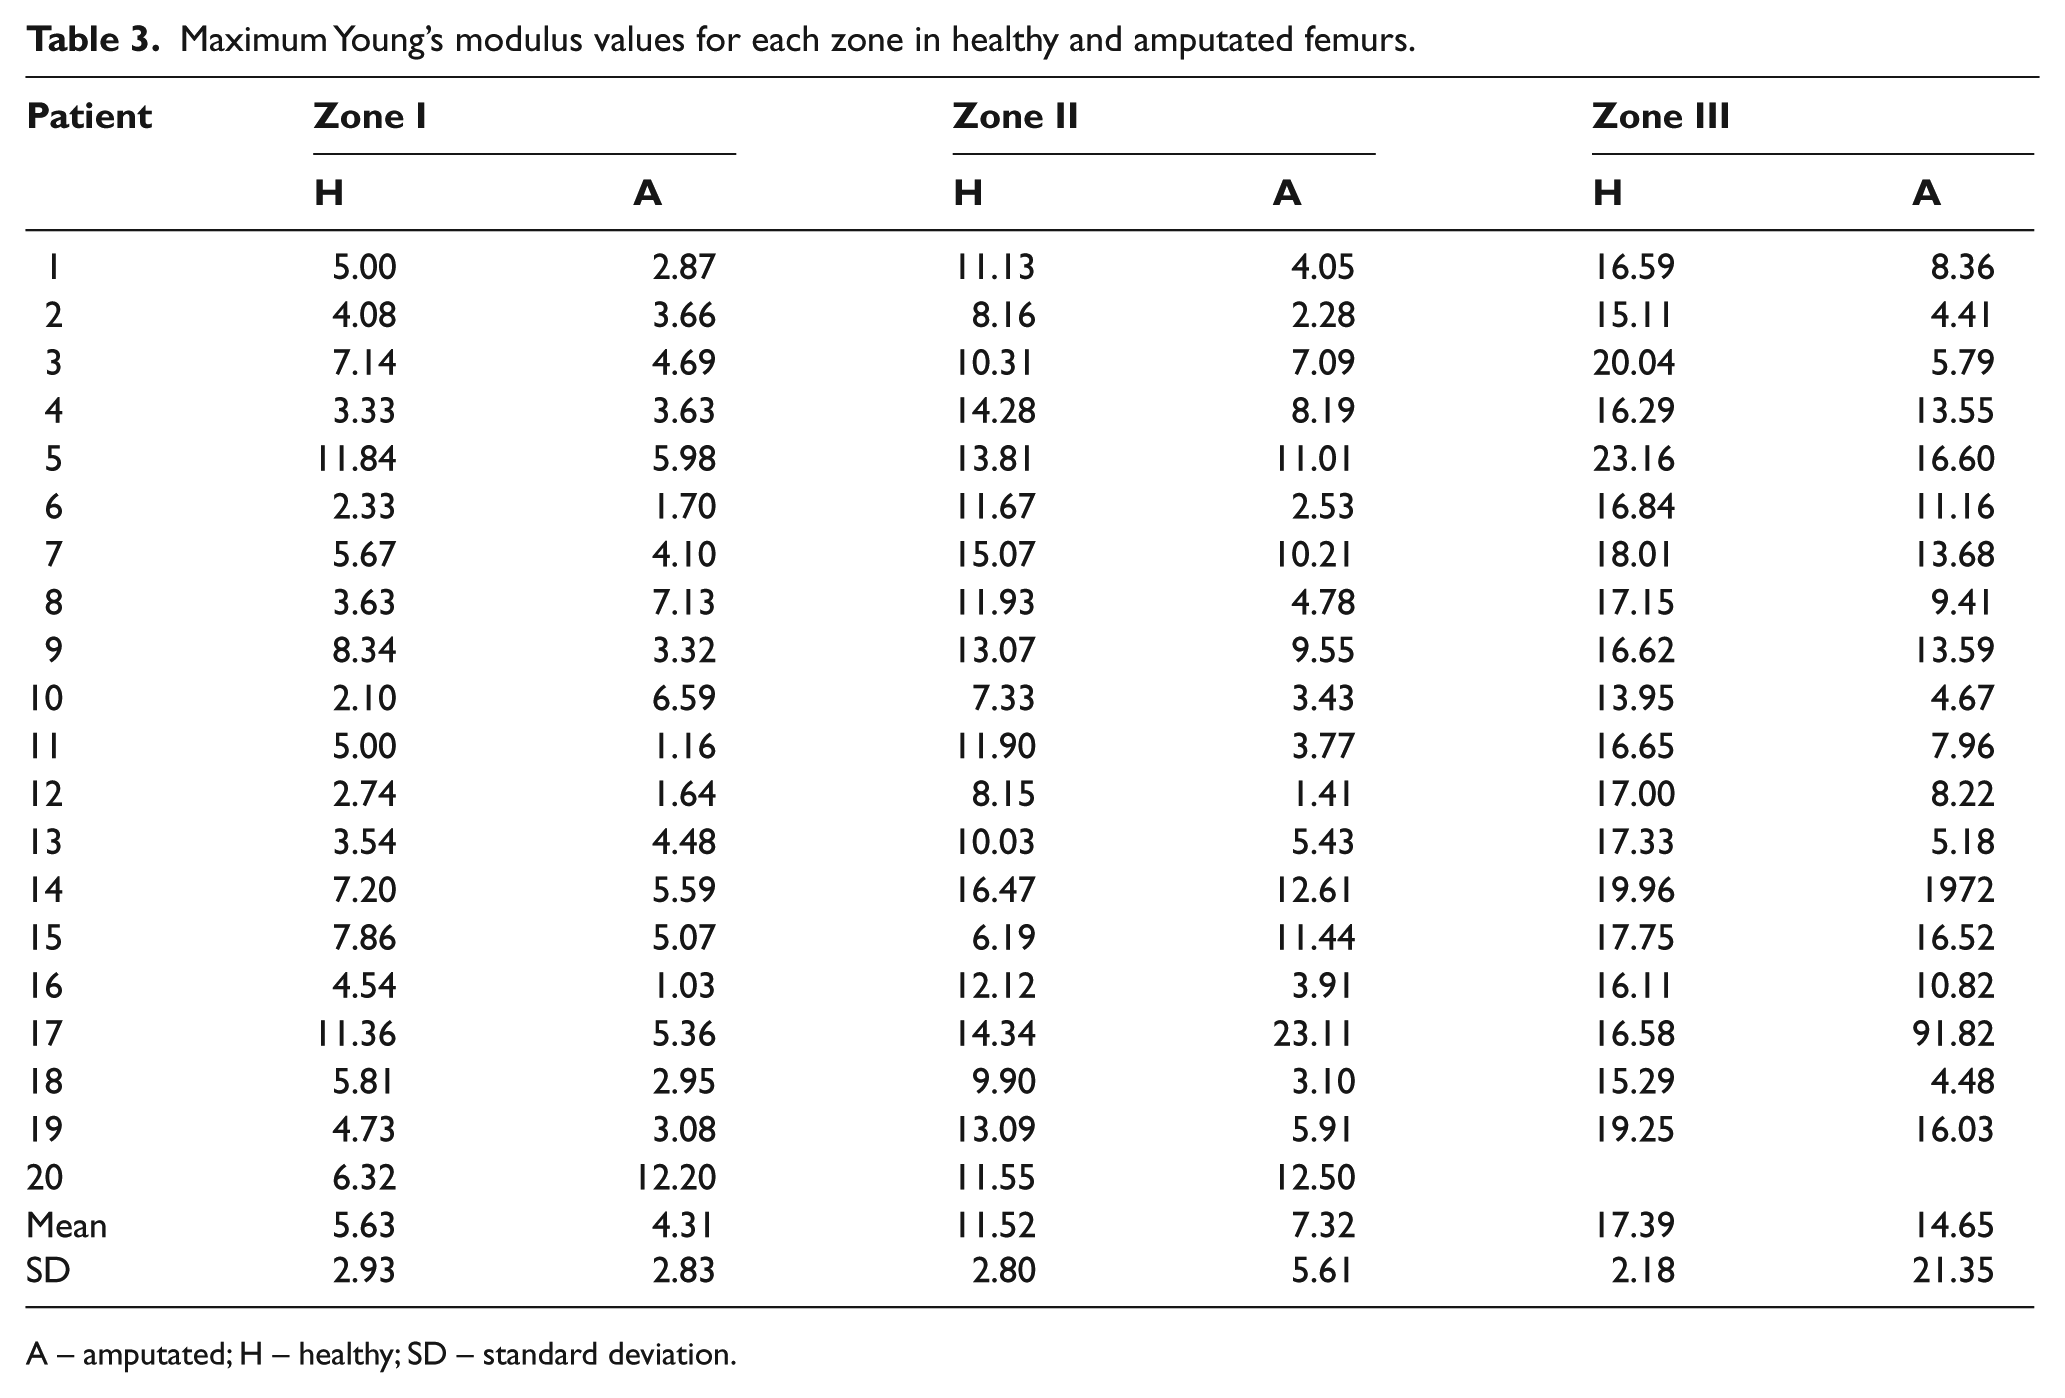
A – amputated; H – healthy; SD – standard deviation.
Discussion
The homemade algorithm that was developed and used clearly detects the presence of cortical and trabecular bone in the vector trajectory, the double peak curves depict low bone mineral density for the trabecular bone and high bone mineral density for the cortical bone.
Not only the peak values of the HU, but also the Young’s modulus for the healthy and amputated femurs are allocated according to the actual configuration of the bone, where the diaphysis has the highest values and the neck the lowest.
In some cases, the obtained values are not so consistent, specifically the results for the P17 which show in Zones II and III a higher bone mineral density value for the amputated bone, than that of the healthy bone. This result can be due to the interference created by a fixing plate joined to the amputated femur. For P20 there are traces of an epiphyseal injury, which calcified the bone and distorted the results in the histograms.
Finally, in Zone I there are five patients (P4, P8, P10, P13 and P20) which present higher Young’s modulus values for the amputated femur than that of the healthy bone. These variations may be due to congenital pathologies or pathological gait 42 caused by the variation in the alignment of the femur relative to the hip, the resulting increase in the stresses of the neck and of the femoral head. Associated pathologies can be limitations of the hip extension due to an iliotibial contraction, exaggerated adduction of the hip, pseudo-adduction of the hip or adductor muscles acting as substitutes of the hip flexors. 26
The analysis in the statistical software Minitab 15 determines that the mean value of the Young’s modulus taken from the sample has a significant difference (p-value <0.05) between the healthy and the amputated bone. The variance analysis between Young’s modulus peak values shows that the mean values obtained are 11,257 GPa for the healthy femur and 7,040 GPa for the amputated femur. The analysis of variance was made excluding P17’s Young’s modulus values because they distort the results.
Visualization of femur thickness on the tomography images can be affected by patient position over the tomograph table, therefore the healthy femur transversal slice may be in a different plane compared to the amputated one and, for this reason, vector distances in histograms are not the same for femurs in neither of the zones. Some histograms subsequently show that the curves are displaced: healthy relative to amputated curves.
A future study can be complemented relating the amputation time for every one of the individuals with the HU obtained for each zone and the demineralization associated with these, furthermore, to identify and associate specific individual pathologies with the distribution of stresses and to relate these to bone demineralization.
Conclusions
The highest HU and Young’s modulus values are associated with the diaphysis zone (Zone III), while the lowest values are for the neck of the femoral head (Zone I), which are coherent with the distribution of the bone mineral density.
The differences in bone mineral density found between the healthy and the amputated femur in the three regions demonstrate that the use of an external prosthesis can generate the stress shielding phenomenon in the amputated femur. Specifically in transfemoral amputees, the use of prosthesis diminishes the mechanical stimulus over the femur and a bone demineralization appears.
In healthy bodies, the loads are transferred through the skeletal system whereas in an amputee using an exoprosthesis, the loads are transferred first from the socket to the stump through the contact interface area and then from the soft tissues of the stump to the bone, causing a completely different load state in the residual femur.
To avoid stress shielding, the load sate in the amputated femur must be similar to the one in the healthy limb, therefore further research is required to assess the best mechanism of the load transfer between the exoprosthesis and the stump in order to replicate the normal load state on the bone.
Footnotes
Acknowledgements
The authors want to express their gratitude for the collaboration and involvement of the National University of Colombia, Neurologic Institute of Antioquia and Orthopraxis and the patients who participated
Funding
This research received no specific grant from any funding agency. Partial funds were provided by National University of Colombia, research calling 2009, mode 2, codes 20201008161 and 20201008165
Conflict of interest
None.