
Abstract
Background and Aim: It is difficult to measure foam model shapes using contact digitizers because the stylus contact tends to get stuck in the soft foam. The aim of this paper is to describe a technique to overcome this challenge and to assess its effect on digitizer error.
Technique: A controlled laboratory study was conducted. Thirty trans-tibial socket models were measured using a custom mechanical digitizer. Models were coated with a thin layer of resin, and then the resin thickness measured and subtracted from the digitizer data. Error introduced to the measurement from presence of the resin was determined.
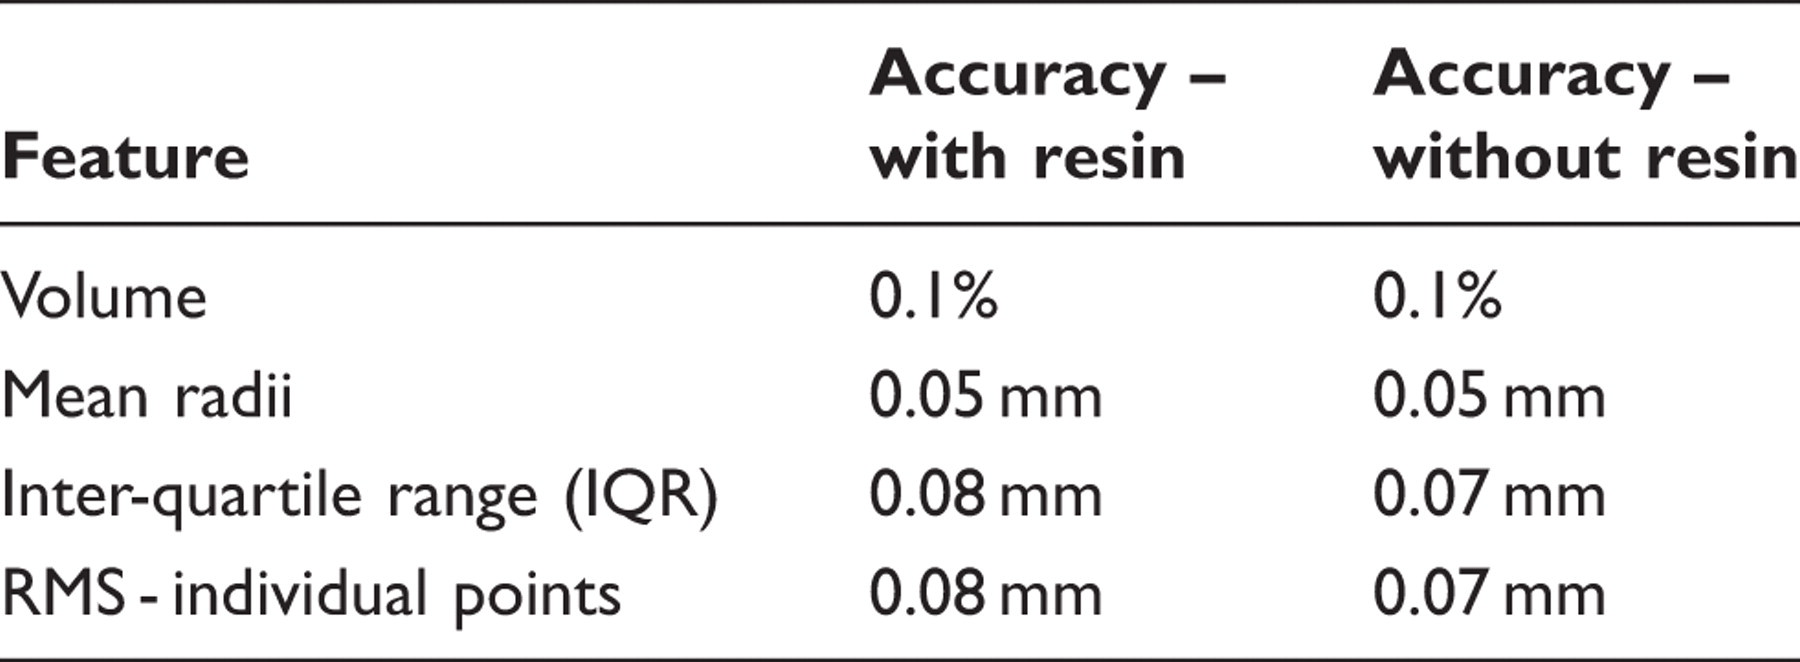
Results and Discussion: The technique did not introduce meaningful error to the digitizer data beyond that already present from other sources in the instrument. The total instrument error for the contact digitizer used was 0.1% for model volume and 0.05 mm for mean radii. The root-mean-square error for individual measurement points was 0.08 mm. While resin coating introduced error to the digitizer measurements, the effect on volume, mean radii and interquartile range accuracies was minimal.
Accurate model measurements can assist clinical service providers in the identification of problems and the repair of carving equipment. This facilitates the delivery of high quality sockets to practitioners and patients.
Background and Aim
Measuring the shapes of models carved using computer manufacturing equipment is relevant to researchers and service providers. Model measurements may help provide quantitative verification of carver quality, and may also help identify any equipment problems and appropriate corrections. Higher quality sockets may then be delivered to patients.
Measurement of foam model shapes using contact digitizers is difficult because the stylus contact tends to get stuck in the soft foam. This sticking distorts measurement. The purpose of this paper is to describe a technique to overcome this challenge. Models were coated with a thin layer of resin, and the thickness of the resin was then measured and subtracted from the digitizer data. In this technical note, the technique is described and its effect on digitizer error assessed.
Technique
Measurements were taken with a custom digitizer (Figure 1) described in detail previously.
1
The model was rotated using a motor in the base while the stylus position was measured using a rotational variable differential transformer (RVDT) at the top of the arm and a linear displacement transducer (LDT) within the linear slide rail. To prevent the stylus arm from getting stuck in the soft, porous model foam surfaces and distorting digitizer measurements, models were coated with acrylic sealing resin (Orthocryl, Otto Bock) before digitization. The 30 trans-tibial models tested here, 10 models for each of three electronic files shapes, were from a study that assessed centrally fabricated models.
2
Once hardened, the resin filled the small holes in the foam and created a thin layer on the foam surface, preventing the stylus arm from depressing into the foam. Acetone was added to the resin so as to reduce viscosity and thus facilitate achievement of a consistent resin thickness over the entire model surface. A mixture by mass of 2.5% hardener in resin was made, and the mixture combined with 10% acetone by volume. A custom jig was constructed to dip the models quickly and consistently, then hold them vertically in a fume hood to dry with the proximal ends of the models upwards. A rapid, consistent dipping procedure was important to achieve consistent resin thickness.
Contact digitizer. The model was rotated using a motor in the base while stylus arm position was measured with an RVDT at the top of the arm and an LDT within the linear slide rail. The gearbox offset the motor axis so that the stylus arm was not excessively angulated during operation.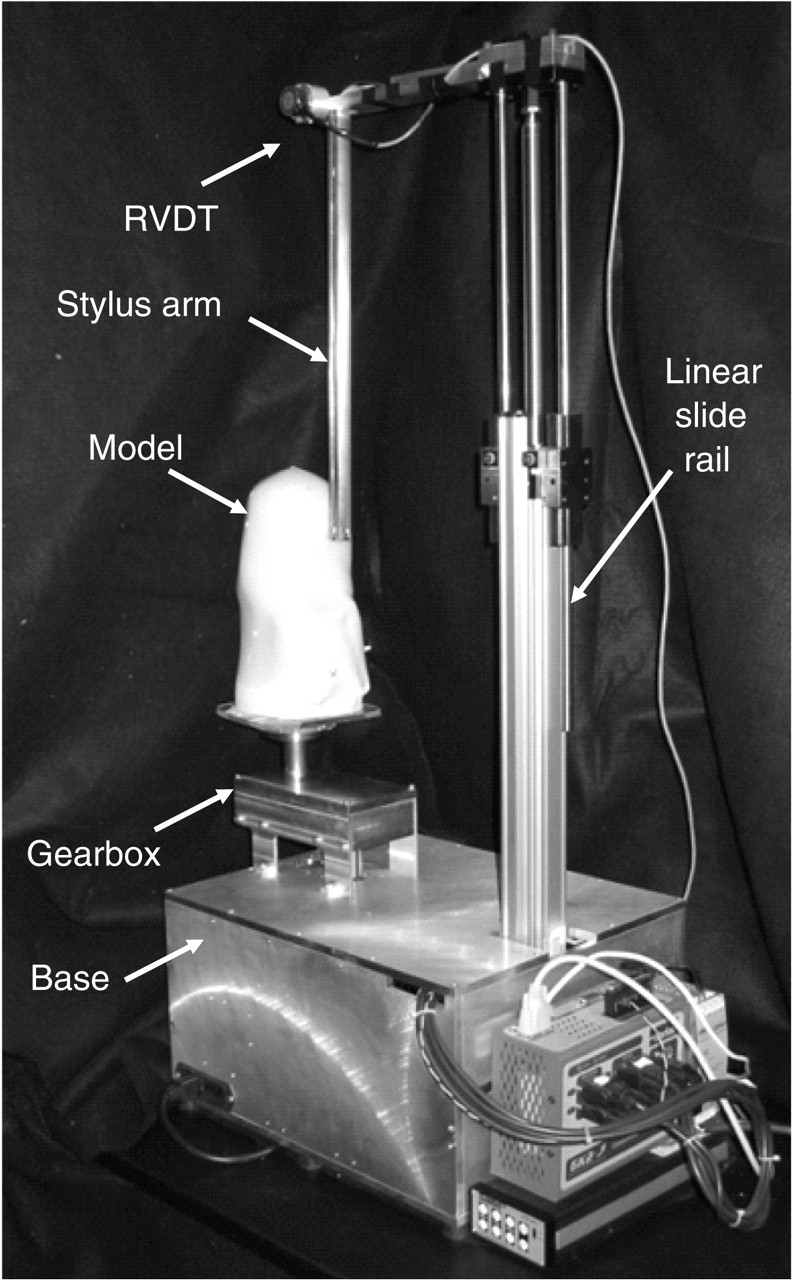
We assessed resin thickness variability. Using a sharp blade, 10 mm x 10 mm samples were cut from the anterior, posterior, medial and lateral sides of each model for the length available on each side. Results showed resin thickness to increase by a meaningful amount (∼0.1 mm) from proximal to distal ends. Results from two exemplary models showed that sampling at 50 mm intervals along the long axis of the model produced comparable results to sampling at 10 mm intervals, thus 50 mm was used for all tests reported below. The least squares linear fit equation for resin thickness versus z-axis position for each model was applied to the shape data measured with the digitizer, so that resin thickness as a function of length was subtracted from the measurements.
Chemical interaction between the resin coating and the polyurethane was considered. The resin was a solution of acrylic polymers in methyl methacrylate. The softener was methyl methacrylate 60–100%; N,N-bis-(2-hydroxypropyl)-p-toluidine 0.1–1.0%; and ethylene-di(S-thioacetate) 0.1–1.0%. The hardener was dibenzoyl peroxide (30–60%) with dicyclohexyl phthalate (30–60%). To assess if the resin mixture degraded the surface, positive models were dipped partway into the resin container (resin dyed green). The interfaces between the coated and uncoated portions of sectioned samples were viewed using a microscope.
Nonlinearity and repeatability testing was conducted. The shape measurement instrument was calibrated using a solid test object with six sections of different external radii: 25, 35, 45, 55, 65 and 75 mm. The mean result of four cross-sections measured within each section was used as the calibration point for each of the six sections. Nonlinearity was calculated as the maximum deviation of the calibration points from the linear curve fit (in mm). It was also expressed as a percentage by dividing by the full-scale output, the 75 mm radius.
Repeatability testing was conducted by measuring an exemplary model (the most complex of the three shapes) 10 times. In between each test, the model was removed and then reattached to the digitizer base. All 10 models of this shape were aligned with the electronic file shape within the same optimization routine 3 so that the same model lengths were compared. The volumes and mean radial errors were determined.
We also evaluated the sensitivity of our analysis calculations to the error in the algorithm used to align measured model shapes with the electronic file shapes. 3 Both translational and angular misalignments were introduced to the analysis for the 10 models made from the same electronic shape file, with magnitudes of misalignment based on our previously-determined errors within the algorithm. 3 Translational error was applied in all three directions (x-y-z), and rotational error was also applied in all three directions (x-y-z).
Results and Discussion
Analysis under the microscope of cross-sections cut from resin-coated models showed no visible deterioration of the foam due to the resin (Figure 2); the surface of the foam with the coating was in a plane parallel to the uncoated surface, well within the roughness of the surface.
Resin coating. Sample taken from a test model showing coated and uncoated regions.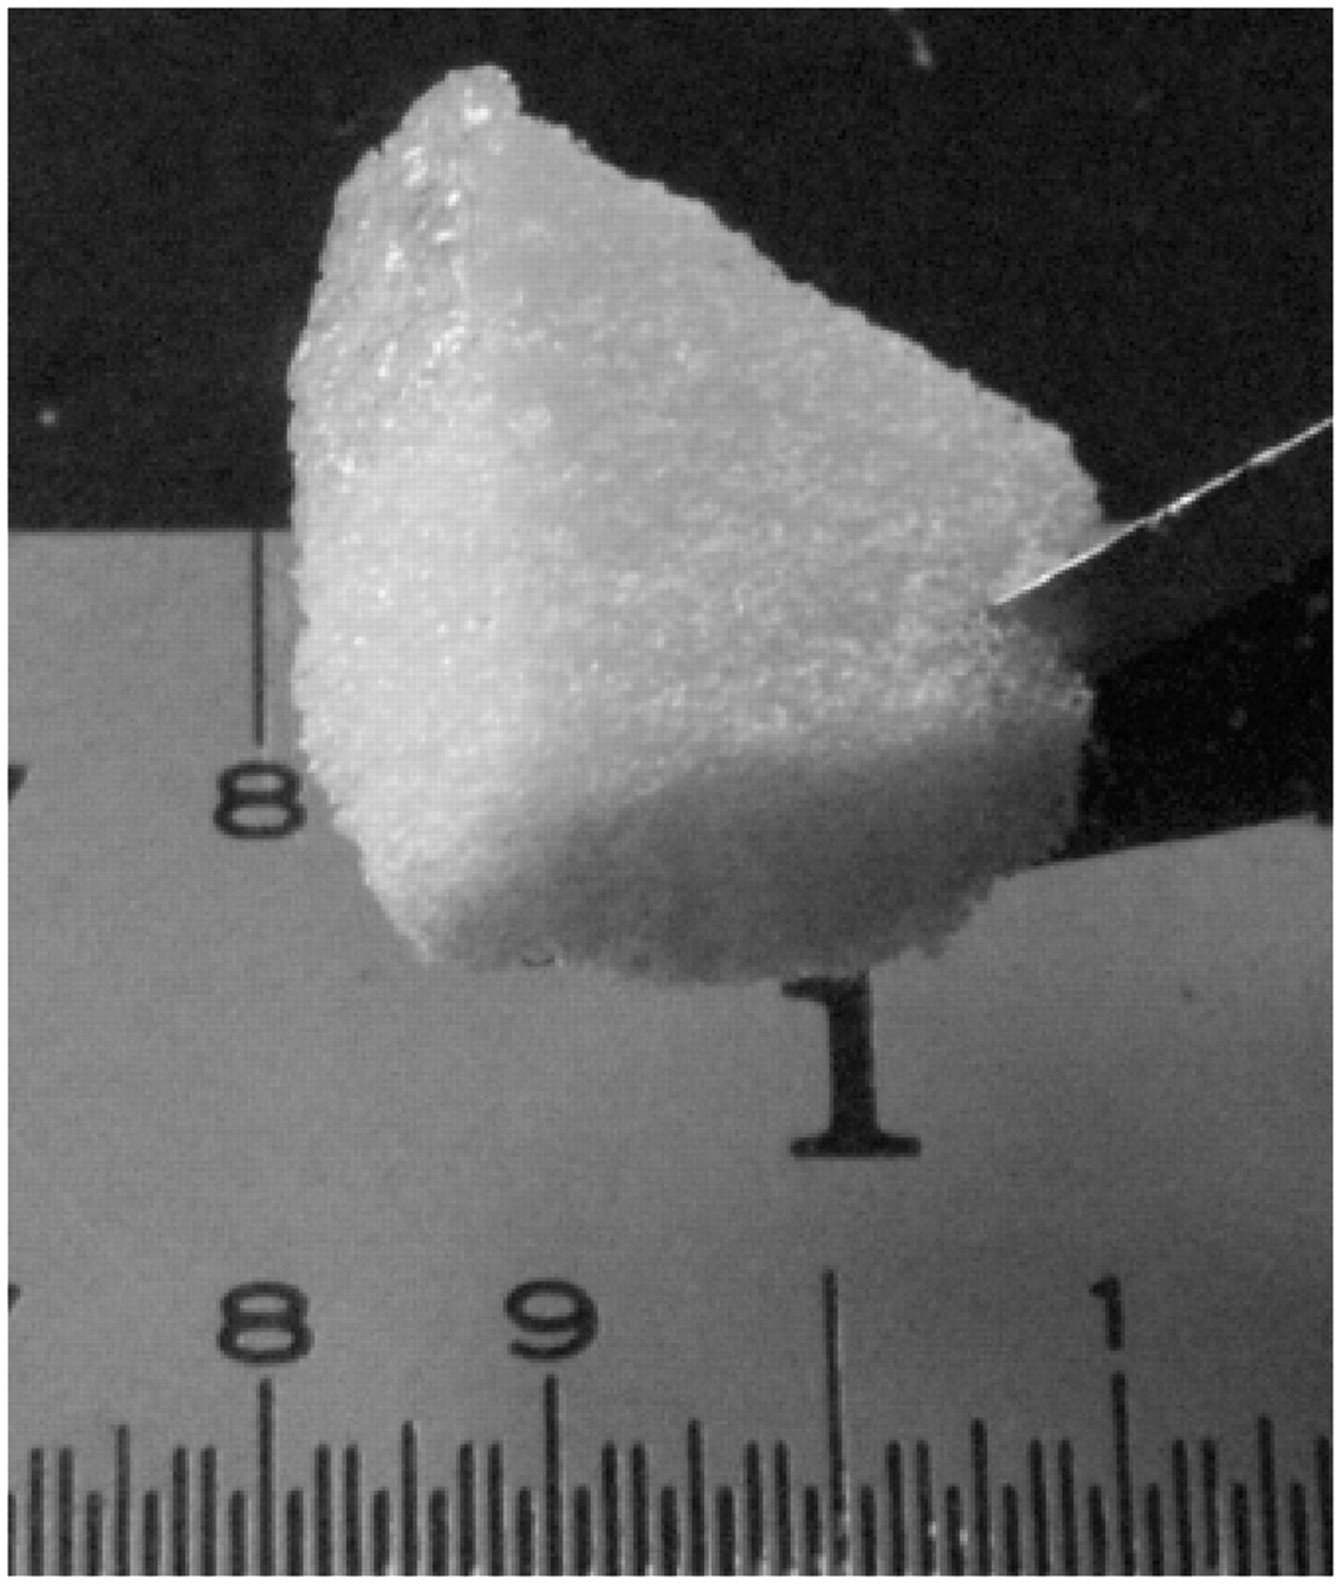
Resin thickness was greater at the distal end than at the proximal end for all 30 models. The average proximal end thickness was 0.29 (SD = 0.08) mm while the distal end thickness averaged 0.45 (SD = 0.09) mm. The root-mean-square (RMS) error in the least-squares linear fits to resin thickness versus distance along the model longitudinal axis ranged from 0.02 mm to 0.10 mm for the 30 models and averaged 0.04 (SD = 0.02) mm. The standard deviation was comparable to the RMS error. The low RMS error and standard deviation indicate that we characterized resin thickness well.
To assess the influence of resin thickness on the analysis of interest, model surfaces were constructed with the RMS error for each model added to all points on that model’s surface. All 10 models for the most complex of the three shapes were used.
Results showed that introducing the additional resin thickness to each model (equal to the RMS error of the least-squares fit to resin thickness versus distance along the model longitudinal axis), produced a mean volume difference of 1.9 (SD = 1.8) mL, a mean percent volume difference of 0.15(SD = 0.14)%, and a mean radii difference of 0.05 (SD = 0.05) mm. Thus the presence of the resin error could have introduced a small but measurable effect.
Calibration results demonstrated linear performance, with a correlation statistic relating the instrument measurement to the stylus arm angle, R 2, of 1.0. Sensitivity averaged 23.57 (SD = 0.02) V/rad. Nonlinearity, which was the maximum deviation of the calibration points from the linear least-squares-fit, when converted to radial distance, was 0.04 (SD = 0.10) mm, which was 0.06% of the full-scale output.
Repeatability testing on the exemplary model showed a mean volume of 1229.1 (SD = 1.5) mL. The percent difference in volume compared with the electronic file shape averaged 0.0(SD = 0.1)%. The mean radial error was −0.05 (SD = 0.04) mm.
With the model intentionally misaligned relative to the electronic file shape, the absolute error in volume difference averaged 0.7 (SD = 0.6) mL for the four configurations for each of the 10 models. The absolute error in percent volume difference averaged 0.05(SD = 0.05)%, and in absolute radii difference it averaged 0.02 (SD = 0.02) mm. Absolute errors in volume differences are reported here rather than the average of signed errors so that results from different models did not combine to reduce the mean error.
Accuracies of the measures of interest.
Key Points
A resin coating technique was developed to allow foam models to be digitized. When the coating thickness was subtracted from the model shape, the error in the digitizer measurement was very small. Model volume, mean radii, and interquartile range were measured accurately using the developed technique.
Footnotes
Funding
This research was based on work supported by the National Institutes of Health (NIH), National Institute of Bioimaging and Biomedical Engineering grant NIH EB-07329.