
Abstract
Background: Three-dimensional motion analysis has been used since the beginning of the 1980s to evaluate many aspects of physical function of transtibial amputees. Despite its common use for clinical research, there is large variability in methods of capturing three-dimensional data, description of these methods, reporting of joint kinematics and interpretation of research findings.
Objectives: The aim of the following review is to critically examine the specific methodologies used by researchers when collecting three-dimensional kinematic data on transtibial amputees and to provide an overview of the methods used.
Study design: Systematic review.
Methods: A systematic review of the literature between January 1984 and June 2009 was conducted. A total of 68 papers were identified for review based on the following criteria: experimental research design, collection of three-dimensional kinematic data of lower-extremity joints, and inclusion of transtibial amputees as experimental subjects.
Results: A number of methodological shortcomings were identified in the papers reviewed.
Conclusions: The authors recommend that future studies more appropriately address the product name and number of prosthetic components used; how the position of reflective markers on the prosthesis is defined; presentation of data from both sound and affected sides; and definition of the neutral position of the ankle when reporting kinematic data. Where possible, the authors recommend use of a control group.
This paper has identified numerous sources of discrepancy and potential error in kinematic data collected on trans-tibial amputees. Clinicians and researchers should make themselves aware of these issues when collecting and interpreting gait data.
Introduction
Three-dimensional motion analysis has been used to evaluate the physical function of transtibial amputees since the early 1980s. Joint kinematics data from motion analysis is often used in combination with temporospatial and kinetic variables to describe human motion. A number of studies have investigated the kinematics of transtibial amputees performing a range of different activities, including ambulating on different surfaces 1,2 at different velocities 3,4 and performing non-gait related activities. 5 Although this expansion in research focus is encouraging, if the evidence of research in this area is to direct clinical decision making, it is important to assess the methods systematically and present the results uniformly in a comparable manner.
The aim of this review was to critically examine the methods and techniques used by researchers in collecting and reporting three-dimensional kinematic data related to transtibial amputees. We further aimed to review specific independent and dependant variables that have been investigated in studies of transtibial amputees and to propose recommendations relevant to future research in this area.
Methods
Literature search
A literature search was conducted in June 2009 of the Medline, Cinahl and Cochrane databases. The search used a broad-based strategy incorporating the following terms: kinematic, biomechanics, amputee, prosthesis and foot. The Medical Subject Heading (MeSH) term ‘artificial limb’ was used during the Medline search. The search was limited to English language publications within the period spanning January 1984 to June 2009. Review articles were excluded from the analysis; however, reference lists in review articles were searched to identify publications that may have been missed in the initial database searches. Papers were included in the analysis if they utilized an experimental research design, collected three-dimensional kinematic data and included transtibial amputees as experimental subjects.
Analysis
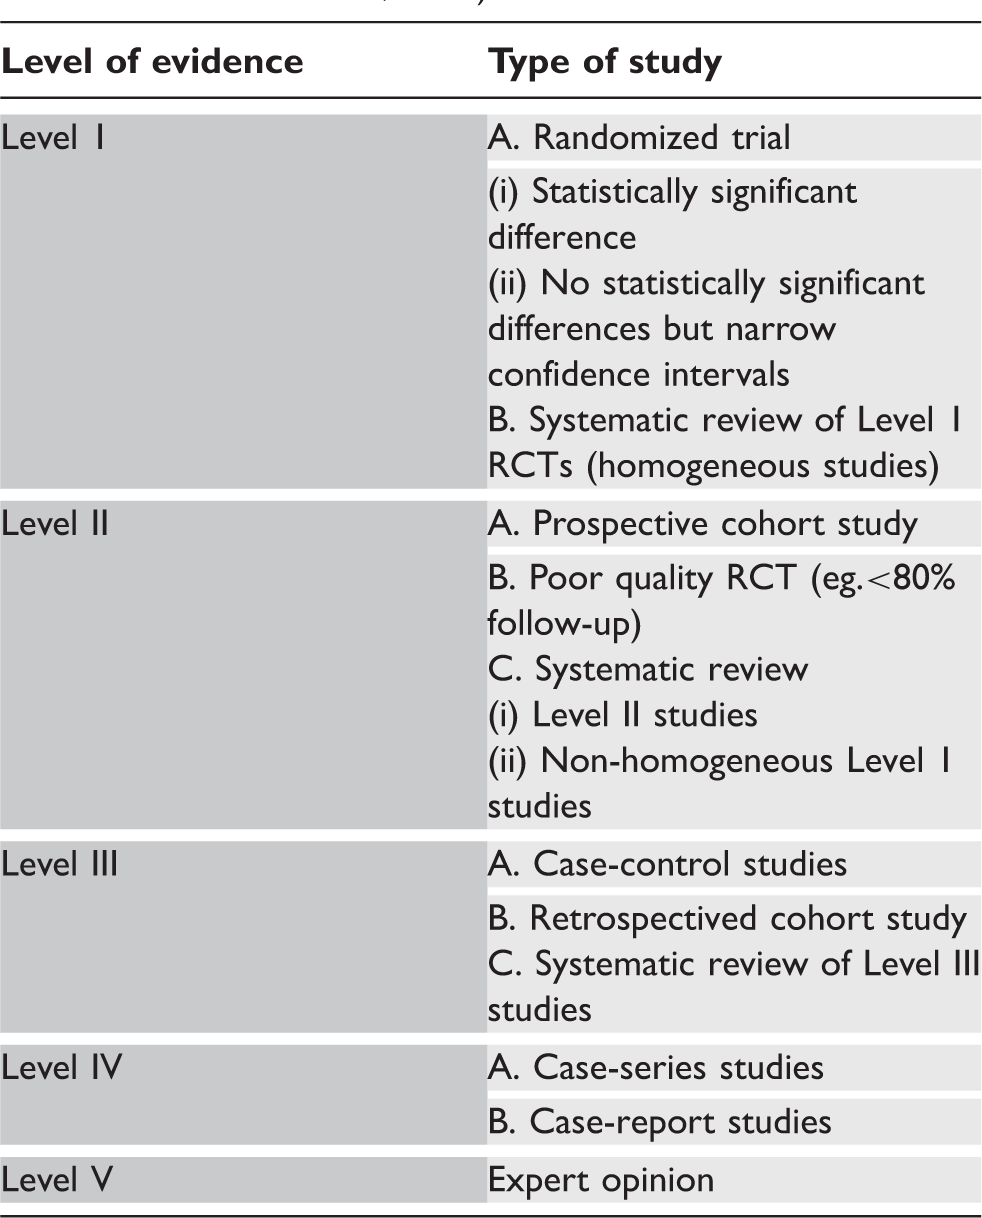
Descriptions of levels of evidence (modified from Bhandari and Giannoudis, 2006).
Additional analysis of the papers focused on three main factors: (1) the methods of data capture utilized by the researchers, which included motion capture system, frequency of data capture, marker placement protocol and biomechanical model utilized, (2) independent variables, such as the activity conducted and variables controlled by researchers, (3) dependent variables the researchers were interested in evaluating and/or reporting.
Results
Level of evidence
Summary of papers included in the analysis. Variables listed include: quality scores1 (minimum = 0, maximum = 16; 0 indicating no criterion are fulfilled and 16 indicating all criterion fulfilled), level of evidence based on study design2 (for further description refer to Table 1), sample size (TT amputees only), mean age of study participants, number of male participants (NA = not available), number of female participants, primary intervention in the study, activity conducted during study (SSWS = Self Selected Walking Speed; CWS = Controlled Walking Speed), number of trials used in analysis, type of foot/feet utilized (in the absence of specific model/manufacturer information: SACH = Solid Ankle Cushion Heel, SA = Single-Axis, MA = Multi-Axis, DER = Dynamic Energy Response, ESAR = Energy Storing and Response, CC(2) = Carbon Copy), and stated position of the marker by the author (“not stated” refers to papers in which no specific reference is given to the prosthesis in the body of the article, ie. Helen Hayes, anatomical landmarks, predetermined positions, etc; “estimated matching contralateral” refers to papers where the authors estimate position of markers for the prosthesis from the intact limb), number of markers used, type of markers, biomechanical model defined by author (as detailed as possible, ie. if author stated markerconfiguration such as Helen Hayes this is stated, when given reference is stated).
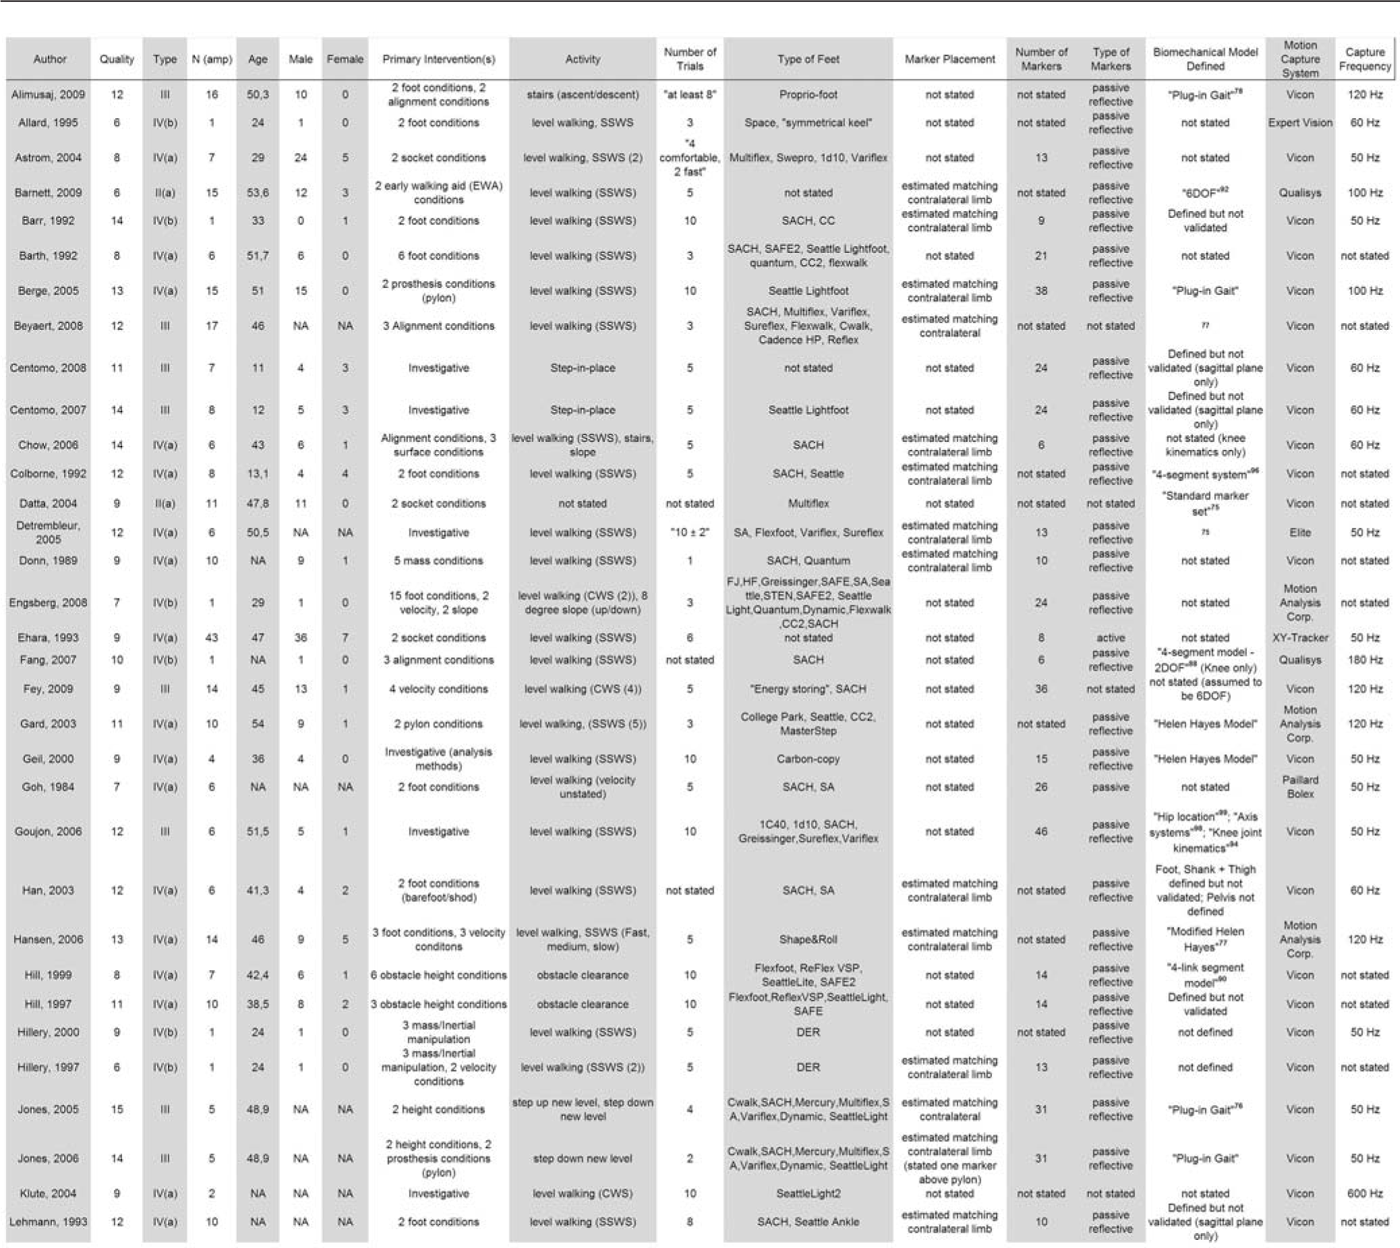
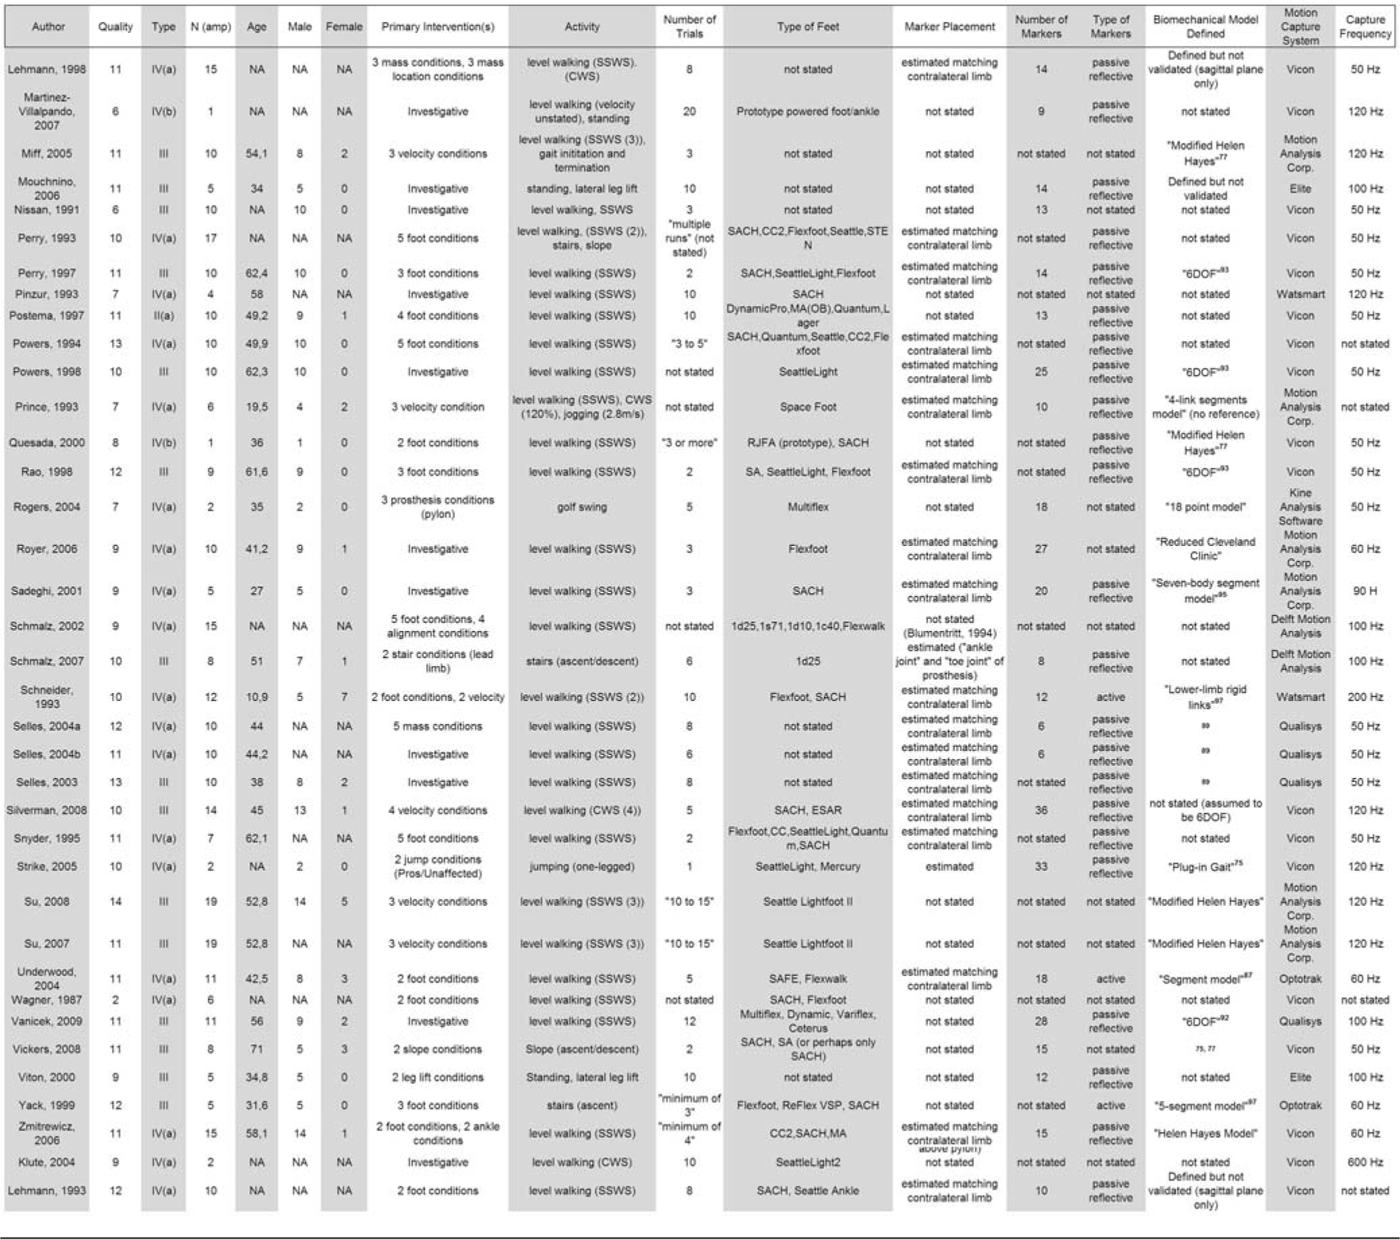
The methodological quality of the papers 7 (maximum possible 16) showed considerable variability (mean 10.1; SD 2.5; range 2–15).
The Spearman’s correlation analysis showed a weak positive relationship between increasing year of publication and higher level of evidence 6 (rs = .360, p = .002) and a weak but not significant positive correlation was found between increasing year of publication and increasing research quality 7 (rs = .236, p = .051). The first analysis seems to suggest that investigators are opting to conduct research that ranks higher in the level-of-evidence hierarchy (for instance, by including a control group), although the second analysis shows that the overall improvement in quality as defined by Law et al. (1998) has not seen the same longitudinal improvement.
Methods of data capture
A review of data capture techniques used in studies involving transtibial amputee kinematics revealed a great deal of variation in the specific methods used. Each of the points is addressed below, including the motion capture system used, frequency of data capture, marker placement protocol, biomechanical model utilized by researchers and activity conducted by the subject. Each point is discussed individually; the results of this review are presented first, followed by the potential influence of these results on biomechanics research in transtibial prosthetics.
A large assortment of motion analysis systems were used in the investigations (Table 2), with the vast majority being validated and commercially available systems 17–20 such as Vicon (Vicon Motion Systems Inc., USA), MAC (Motion Analysis Corporation Inc., USA) and Qualisys (Qualisys AB, Sweden). In the past, capacity and processing limitations of the available systems meant that a limited number of markers could be placed and the processing time took several minutes 17 depending on the system utilized. In a comparison study of different systems, Ehara et al. 17 applied five markers (active or passive, depending on the system) to one side of the body and collected three seconds of data at 50–60 Hz. The processing time for the systems ranged from 10 seconds to 28 minutes, with the fastest system utilizing an active marker setup, although many passive systems were very close (15–47 seconds). Frequency of data capture in the reviewed studies ranged from 50 Hz (23 papers) to 600 Hz (1 paper 21 ) (mean 85, SD 78). Given that a large majority of papers required subjects to walk on level surfaces at self-selected velocities, which normally produces a frequency content under 10 Hz, 22 a frequency of 50 Hz is considered sufficient to ensure that the data accurately portrays the signal in the time domain without missing peak values. 23 The one paper which involved jumping 24 utilized a frequency capture of 120 Hz, which is likely to be sufficient given the accelerations required in this activity. The capture frequency of the system during data collection was not stated in 13 papers.
Three-dimensional motion analysis requires passive or active markers to be placed on the individual and the prosthesis to establish the location of joint centres and define limb segments and their orientation. The outcome of three-dimensional motion analysis is highly dependent on the placement of these markers, which is one of the major sources of error in kinematic data. 25–27 Of particular methodological interest in the papers included in this review is the method of marker placement on the prosthetic limb. Of the 68 studies reviewed, 33 stated that the markers were positioned on the prosthesis by estimating the location of landmarks from the intact limb, 9,12,24,28 – 56 and 35 studies did not state how the positions of the markers were determined 1 – 5,8,10,11,13 – 16,21,48,57 – 77 (Table 2). None of the studies specified use a technique involving measurement of the intact limb, although some of the biomechanical models used do require that measurements be inputted into the system. It must be recognized, however, that these models have been developed and validated on intact limbs and therefore may not accurately represent the motion of a prosthesis. For example, the Helen Hayes model requires that anthropometric measurements of the ankle (mediolateral distance) be inputted into the system. This position is then used to determine the position of the ankle joint. The constraints of the intact ankle are therefore transferred to the prosthetic ankle, and these constraints may not be appropriate. It could be argued that certain models require contralateral limb measurements, and therefore the authors’ statement of these measurements would depend on the model used. 78 – 81 Nevertheless, this was not the case for all these articles, with some choosing to state the methodology for marker position selection and others choosing not to specify this aspect of their methods. As these marker placement protocols were conceived and validated largely on healthy, intact individuals, the measurement step may be seen as unnecessary for someone with an intact limb. However, given the potential incongruence between the motion of the prosthetic foot/ankle and the anatomically based models used to describe its motion, 82 it is all the more critical to be extra diligent in reporting methods.
The relative effect of marker position on kinematic data is well documented, and more thorough investigations are available. 25,26,83 In an effort to quantify the effect of marker misplacement on a healthy subject, Della Croce et al. 83 showed that an inter-examiner marker variation of ≈10 mm translated into an error of 3.3 degrees for ankle dorsiflexion. Similarly, Schwartz et al. 84 showed a maximum error of 4 degrees for plantar/dorsiflexion at toe-off, and cited marker misplacement due to inter-examiner variation as one of the leading causes of this systematic error. Inter-examiner variation is a close analogy to the inherent error when two labs attempt to compare their results. Comparing the data of Schwartz et al. 84 for dorsiflexion at toe-off to the data compiled in this review shows a potential mean error for prosthetic ankle dorsiflexion of 27% (range 18–34%) depending on the prosthetic foot being considered. Although it is evident that this error is solely due to marker misplacement, Schwartz et al. 84 clearly demonstrated that its contribution to overall error was significant, and increased depending on which instant in the gait cycle a researcher was interested in. Given that markers can be used to determine the axis of rotation of major joints, one must consider the validity of placing the ankle axis marker on a prosthetic foot in a position estimated from the sound limb. Differences in the design of a prosthetic foot mean that you cannot assume its motion is the same as that of the intact side, or that different prosthetic feet will exhibit the same rotational qualities. 85 Therefore, it is of utmost importance that researchers develop a protocol for positioning markers on prostheses and ensure that rotational axes are calculated appropriately in the subsequent three-dimensional model, thereby ensuring the validity of the results. Future studies investigating the potential of models which incorporate the use of a functional joint centre (FJC) may present a possible solution to this problem.
Level walking at a self-selected velocity was the most common activity investigated (47 papers) in kinematic studies of transtibial amputees (Table 2). However, attempts were made by some investigators to include other activities. Examples include ascending and descending slopes, 2,10,31 ambulating on a single step37, 86 or stairs, 1,31,49,76 clearing obstacles, 64,65 stepping in place, 5,58 lateral leg-lifts, 66,75 jumping, 24 golfing 70 and walking at a variety of velocities. 3,4,10,12,36,42,45,50,53,59,60,72 The authors consider this to be a particularly positive step, given that very few activities an individual undertakes during the course of a day occur on stable ground and at a constant velocity. 87 It has previously been demonstrated that amputees perform worse on dynamic tasks that require additional active control, such as maintenance of balance. 88 As such, investigation of tasks that deviate from straight/level walking will help ensure that research results can be generalized to naturalistic settings.
Independent variables
Numerous authors chose to use the prosthetic foot as an independent variable in their research (24 papers) and to investigate the relative effects of switching the type of foot (Table 2). Other independent variables investigated included the mass and the distribution of mass of the prosthesis (5 papers), the alignment of prosthetic components (5 papers), gait velocity (10 papers), other prosthetic components excluding feet (7 papers), and walking surface, which included slopes, stairs and obstacles (5 papers). There were 19 papers classified as investigative papers in which there was no independent variable or manipulation made by the investigator.
The foot most often investigated was the SACH foot (n = 34). This was followed by the Seattle Foot (n = 21) and the Flexfoot (n = 17). Other feet used in three or more studies were the CarbonCopy (n = 9), Single-Axis and Multi-Axis (n = 8), Dynamic (n = 7), Variflex, SAFE and Quantum (n = 6), Reflex VSP, Cwalk and DER (n = 4); Sureflex and Mercury (n = 3). Five papers investigated prototype feet and 11 papers did not state which feet they used.
It should be noted that there is a degree of ambiguity related to the specific foot models used in amputee studies, as numerous authors use generic terms to describe the type of prosthetic foot under investigation. For example, numerous authors refer to use of a ‘SACH foot’ and/or a ‘Flexfoot’ in their papers. The term SACH foot refers to any kind of foot with a characteristic solid ankle and cushion heel. Numerous manufacturers produce a foot model that fulfils these criteria and it is likely that each model has different mechanical properties, including different keel lengths and densities of material at heel and forefoot. In the early stages of development the Flexfoot was a specific model of prosthetic foot with a characteristic carbon-fibre leaf-spring design. Today the Flexfoot is no longer commercially available, but the term is often used to describe a family of feet commercially available from the company Össur. Given these differences, it is difficult to be confident of the design and mechanical properties of the feet mentioned in research papers.
Within this literature there appears to be an increasing interest in the SACH foot. In total, 34 of the reviewed papers investigated SACH feet, 20 of which were published between the years 2000–2009, with five published in 2006. Given that the SACH foot has received the most attention in transtibial amputee research, one could assume that this is the most commonly prescribed foot. While this was possibly the case in the past, recent literature related to the clinical provision of prosthetic feet indicates that clinicians, even in the absence of strong scientific evidence of improved physical function as measured by various outcome variables, 89,90 prefer to prescribe more advanced prosthetic foot-ankle components. 89,91 Without knowing the true frequency at which specific models of feet are prescribed, it is difficult to assess whether research resources are responding to a clinical need, historical precedence or a push by individual manufacturers. For instance, the reasons for using the SACH foot as a comparison in studies has a number of justifications, including historical precedence, international prevalence and simplicity of design. However, these factors alone do not sufficiently assure its appropriateness as a control variable.
Several authors chose to investigate the mass and mass distribution of the prosthesis as an independent variable. 12,13,34,40,51,52 These studies show a large variation in the amount and location of mass added to the prosthesis. Mass added to prostheses ranged from 50 g 34 to 2 kg 51 . Lehman et al. 40 altered both the mass and the position of the mass in an attempt to vary the weight of the prosthesis but maintain a constant centre of mass, and found that a proximal position of the centre of mass resulted in greater metabolic efficiency. In two case studies, 12,13 Hillery et al. 12 arrived at contradictory results, suggesting in one paper that mass perturbations had an effect on hip and knee kinematics and in a second paper that mass perturbations produced inconclusive results. 13 A possible source of this discrepancy was the small sample size and reliance on descriptive statistics to draw conclusions. Selles et al. 51 reported that mass perturbations caused changes in joint torques of the lower extremity, but amputees were able to compensate sufficiently to prevent observable changes in kinematics. Donn et al. 34 demonstrated that a more proximal centre of mass resulted in greater swing phase symmetry, while Selles et al. 52 showed that this resulted in decreased muscular cost. It is important to note that the methods utilized in the above investigations focused on sagittal plane outcomes, and therefore the effects of mass perturbation on outcomes in the remaining two orthogonal planes (coronal and transverse) were largely overlooked.
Dependent variables
The majority of papers reviewed included analyses of motion from both the sound and affected sides. Studies typically presented data for the feet and knees only. Hip joint kinematics was investigated in 21 studies, while just five papers reported kinematics associated with the upper body. 16,62,64,66,70
A total of 14 papers collected kinematic data only as a means of further calculating variables that included kinetics, such as joint power and work, and did not report the kinematic results at all. 8,40,48,53,55,61,65,76 Others used them to define temporospatial parameters, 59,68 joint moments, 36,47 zero moment point 14 and symmetry. 34
In papers that reported kinematic data, all but three reported sagittal plane motion. 60,66,70 Coronal plane motion was reported in 13 studies 4,16,28,30,32,35,37,48,55,64,66,72,74 and three papers 16,70,72 reported motion in the transverse plane. The distribution of planar motion reporting may be largely explained by the biomechanical models used in the reviewed papers (Table 2). Some models are only capable of describing sagittal plane motion, 92 – 95 while others are capable of describing motion in three orthogonal planes. 57 ,78-81, 96 – 104
There were 22 papers that did not specify which model they used to describe the kinematics. This is of major concern, given the documented consequences of model selection on gait analysis, 105 particularly in amputee biomechanics. 106
Of note are differences that can be observed in the manner in which kinematic results related to the prosthetic foot were presented. Many articles investigating prosthetic feet state only the dorsiflexion angles 2,24,39,42,44,54,73 while others choose to state both plantarflexion and dorsiflexion. 1,35,69,71 Some articles list only the absolute range of motion (ROM) for specific feet. 1,4,5,9,39,69,72,74 This may be due to the types of activities chosen and may not necessarily be a limitation. Yet in studies that present absolute ranges, it is difficult to determine the relative proportion of the range that can be attributed to dorsiflexion and plantarflexion separately. On the other hand, in studies that present only dorsiflexion range, it is not stated whether this range is calculated from a neutral position of the prosthetic foot (foot at a 90-degree angle to the tibia), or is defined as the total range of dorsiflexion motion from the maximum plantarflexion angle attained during loading response (not necessarily foot flat) to the instant when the maximum dorsiflexion angle is reached. This would likely produce higher values of dorsiflexion than when calculated from a position determined with zero degrees (neutral) as the position of the unloaded prosthetic limb, and plantarflexion/dorsiflexion determined in relation to this neutral position.
It is also important to note the difficulty in determining a normal ROM for prosthetic feet, as many factors contribute to this other than the foot itself. These would include subject mass and velocity as well as differences in motion capture methods across different laboratories, including marker placement 83,84 and the biomechanical models 105 used to calculate joint centres and motion of limb segments. Without the inclusion of this information it becomes very difficult to establish ‘normal’ patterns of movement for prosthetic components.
An alternate method of analysing kinematic data related to the prosthetic foot was presented by Barth et al., 57 who chose to present the prosthetic foot motion as a percentage of the motion recorded from the intact side. Given that the author of this paper does not report the ROM of the intact limb, it is impossible to determine the true ROM of the prosthetic side, and subsequently not possible to make comparisons to other studies. Goujon et al. 57 chose to analyse the prosthetic foot by comparing hindfoot motion to forefoot motion in the sagittal plane. In this study a multi-segment model was used to determine the relative motion of the hindfoot to the forefoot. The use of multi-segment models to describe the motion of an intact foot is becoming increasingly used as the capacity of systems improves, 107,108 although this is the first attempt to do so on a prosthetic foot. As neither an intact foot nor a prosthetic foot moves as a rigid segment, 82 efforts to use more accurate models to describe the kinematics offer the possibility of more valid results.
Several authors chose to present only graphical data related to prosthetic foot kinematics. Low resolution of these graphs makes it particularly difficult to accurately determine true values. 5,32,64
Given the differences in reporting of kinematic data, it is essential that efforts be made to develop a protocol that researchers can use when reporting the results of kinematic analysis. This will allow for comparisons across studies and for meta-analyses to be performed. When reporting sagittal-plane prosthetic foot kinematics, the authors recommend being clear what contribution of the total ROM is due to plantarflexion and dorsiflexion individually. A possible solution to this when reporting ROM in the text of an article may be to report plantarflexion and dorsiflexion values calculated from a neutral position, defined as the position of the prosthetic foot when no load is applied. Given that modern prosthetic feet are designed to function in multiple planes of motion, and that amputees have been demonstrated to be sensitive to alignment changes in the frontal plane, 109 it is also of interest to report non-sagittal plane kinematics where this addresses the aims of the study. This means that researchers must be attentive to the biomechanical models used in their analysis so that information is not lost due to shortcomings in the models’ ability to describe motion in the desired planes. 105 Application of these biomechanical models in inverse dynamic calculations of amputee gait is seen as a major limitation. 106
Discussion and conclusion
The biomechanics of transtibial amputees has received a great deal of attention in the literature. While numerous variables have been addressed, the relative effects of different prosthetic feet have received the most attention. The highest level of evidence identified was Level II(a) 28,69,110 (poorly designed randomized trials, n = 3). These three papers proposed to be randomized control trials and claimed to be Level I(a) evidence; however, when reviewed by the authors, numerous methodological shortcoming were noted and they were categorized Level II(a).
Given that methods used for data capture and presentation of results were so different across studies, it would be impossible to combine the results into a meta-analysis.
A number of methodological problems or limitations were repeatedly identified in the
studies reviewed. As such, the authors recommend the following practices to those
intending to conduct research on transtibial amputees in the future: Clearly state the model product name and number of the prosthetic
components used. Clearly state how the location of reflective markers on the prosthesis
was determined. The axis of rotation for plantarflexon/dorsiflexion should be
investigated for different types of prosthetic feet, as this is another
source of systematic variation specific only to amputee gait. When reporting kinematic and kinetic data, be very clear whether the data
presented is from the sound or the affected side. If reporting ankle kinematics, report both foot dorsiflexion and
plantarflexion from a zero point, defined as the position of the foot
relative to the shank when the foot is unloaded. When necessary to meet the objectives of the study, use a control
group.
Of the 68 articles reviewed, over half (n = 40, 59%) were submitted since 2001. This increase in submissions is a positive step, suggesting that the area is receiving more attention and resources. It also highlights the importance of developing common protocols for data capture and reporting within this expanding research area.
With the use of motion analysis systems in clinical research likely to continue, the authors hope that the results of this review can be applied to improve the quality of future research. Only with higher quality research can we appropriately direct clinical decision making and positively affect the lives of those wearing a prosthesis.
Footnotes
Acknowledgements
The authors would like to acknowledge the contributions made during the preparation of this article by Kerstin Hagberg, RPT, PhD and Professor Björn Rydevik, MD, PhD.
Funding
This research received no specific grant from any funding agency in the public, commercial or not-for-profit sectors.
Conflict of interest
The authors report no conflict of interest, and the authors alone are responsible for the content and writing of the paper.