
Abstract
Since whole-slide imaging has been commercially available for over 2 decades, digital pathology has become a constantly expanding aspect of the pathology profession that will continue to significantly impact how pathologists conduct their craft. While some aspects, such as whole-slide imaging for archiving, consulting, and teaching, have gained broader acceptance, other facets such as quantitative tissue image analysis and artificial intelligence–based assessments are still met with some reservations. While most vendors in this space have focused on diagnostic applications, that is, viewing one or few slides at a time, some are developing solutions tailored more specifically to the various aspects of veterinary pathology including updated diagnostic, discovery, and research applications. This has especially advanced the use of digital pathology in toxicologic pathology and drug development, for primary reads as well as peer reviews. It is crucial that pathologists gain a deeper understanding of digital pathology and tissue image analysis technology and their applications in order to fully use these tools in a way that enhances and improves the pathologist’s assessment as well as work environment. This review focuses on an updated introduction to the basics of digital pathology and image analysis and introduces emerging topics around artificial intelligence and machine learning.
Keywords
Digital pathology, as defined by the Digital Pathology Association, is a subdiscipline of pathology focusing on generating, managing, and interpreting pathology information from digitized glass slides. 3 Its era first started with the introduction of digital camera attachments to microscopes in the early 1990s, which enabled pathologists to take and share static digital images of histology slides. 103 Commercial whole-slide scanners were introduced to the market in 1999, 97 which enabled the digitization of entire glass slides (so-called whole-slide imaging) and aided in transferring the microscope’s functionalities onto the computer screen.
Today, a wide spectrum of imaging devices for digital pathology is available for purchase, ranging from microscope smartphone mounts, over low-cost software solutions allowing the manual use of light microscope as a surrogate scanner, to stand-alone high-throughput whole-slide scanners cleared by the Food and Drug Administration (FDA) as class II medical devices. 22,47 Pathologists also use a variety of other tools to share digital images, for example, through web conferencing, personal messaging systems and social media platforms, as well as through private and academic educational platforms that host whole-slide images. 49,71 Digital tissue image analysis powered by cutting edge artificial intelligence (AI)–based technology may require interinstitutional, interdisciplinary, and sometimes international collaborations. Academic and industry research, including drug discovery, development, and safety assessment are using and benefitting from digital pathology applications.
An important milestone in digital pathology, anchoring it firmly in both veterinary and human medicine, was the adoption of digital pathology for primary diagnosis. Interestingly, this occurred on different timelines in each respective discipline. Facilitated by a lower regulatory burden, large veterinary diagnostic companies (ie, IDEXX, Antech) adopted a fully digital workflow for their anatomic pathology services in 2014. 108 In contrast, it was not until 2017 that the FDA cleared the first such digital pathology system for primary diagnostic reads of human specimens, with wide adoption still lacking. 47
Based on the steady increase of digital pathology–related educational events (ie, conferences, workshops, webinars), interest in adoption of this technology continues. Despite these developments, there remains some apprehension toward the broader adoption of these tools, especially with recent advancements of AI-based applications and how they may impact the pathology profession as a whole.
This review is tailored to the veterinary pathology audience and provides an updated introduction to digital pathology. It explains the basic concepts of digitization, digitalization, and digital transformation. Quantitative image analysis is discussed in more detail, including the role pathologists play, especially with regard to quality control (QC). AI and machine learning are introduced in the context of advanced and novel applications. Lastly, considerations are shared around workstation ergonomics, transitioning from glass to digital reads, and computational pathology. Because the basic technology of whole-slide scanning is extensively reviewed elsewhere, it is recaptured here in less detail. The interested reader is advised to consult other relevant references. 44,51,97,130,134
Digitization, Digitalization, and Digital Transformation
Before diving into technical aspects of whole-slide scanning and viewing digitized slides on computer screens, it is helpful to consider digital pathology as an application of the process of digital transformation. This process entails 3 main parts: digitization, digitalization, and the transformation itself.
During digitization, information that was previously only available in an analog format is converted into a digital configuration. 39 Examples include scanning handwritten or printed text, scanning analog photographs, and converting analog sound recording (eg, from cassettes) into mp3 format. In pathology, digitization refers to the process of making a digital copy of a glass slide, for example, through using whole-slide scanning technology.
Digitalization has a broader meaning and refers to integrating and leveraging of digital technologies in everyday life and business. 16 Common examples of digitalization include shifting most of the written communication between individuals to digital means such as email and text messaging, using digital formats such as mp3 for sound recordings, utilizing digital cameras for image capture, and so on. In pathology, an example of digitalization is leveraging a digital pathology system for primary diagnosis in a diagnostic laboratory.
Lastly, digital transformation refers to the effect digitalization has on an organization implementing it or on the people using it. Often this results in a significant change of a business model. General examples include changing the traditional brick and mortar stores to online shopping, replacing newspaper advertising with digital advertising, and exchanging classical editor-generated media content with social media, which gives the users the ability to generate content themselves. In veterinary pathology, digital transformation has taken place at diagnostic companies that have established a digital pathology workflow for their entire enterprise. Pathologists employed by these companies can perform their job duties without a microscope, completely digitally at a computer. This enables company-wide remote working, digital reporting, and record keeping, and facilitates rapid consulting and reduced turnaround times. Similarly, the field of toxicologic pathology is evaluating feasibility and implementations of fully digital workflows for primary reads and peer reviews. 18,19
Whole-Slide Scanning
A key component of digital pathology is the digitization of glass slides into whole-slide scans. The components of the scanner parallel the ones of a microscope and include a light source, slide stage, objective lenses, and a high-resolution digital camera. The image is usually acquired along the x/y-plane of the slide as a series of lines or tiles (Fig. 1), which are then digitally stitched together to create whole-slide images. 4 These tiles or lines are stored at different resolutions to generate several images of the same slide which are coupled together as an image pyramid (Fig. 2) to facilitate partial loading of the resulting large file. This prevents image lag when zooming in and out while reviewing the whole-slide images on a monitor. 59,134 This is different from so-called “z-stacking,” where several scans are generated along the z-axis of a slide to allow for digital fine focus. 4 Detailed reviews of whole-slide scanning technology have been published elsewhere. 44,51,97,130,134
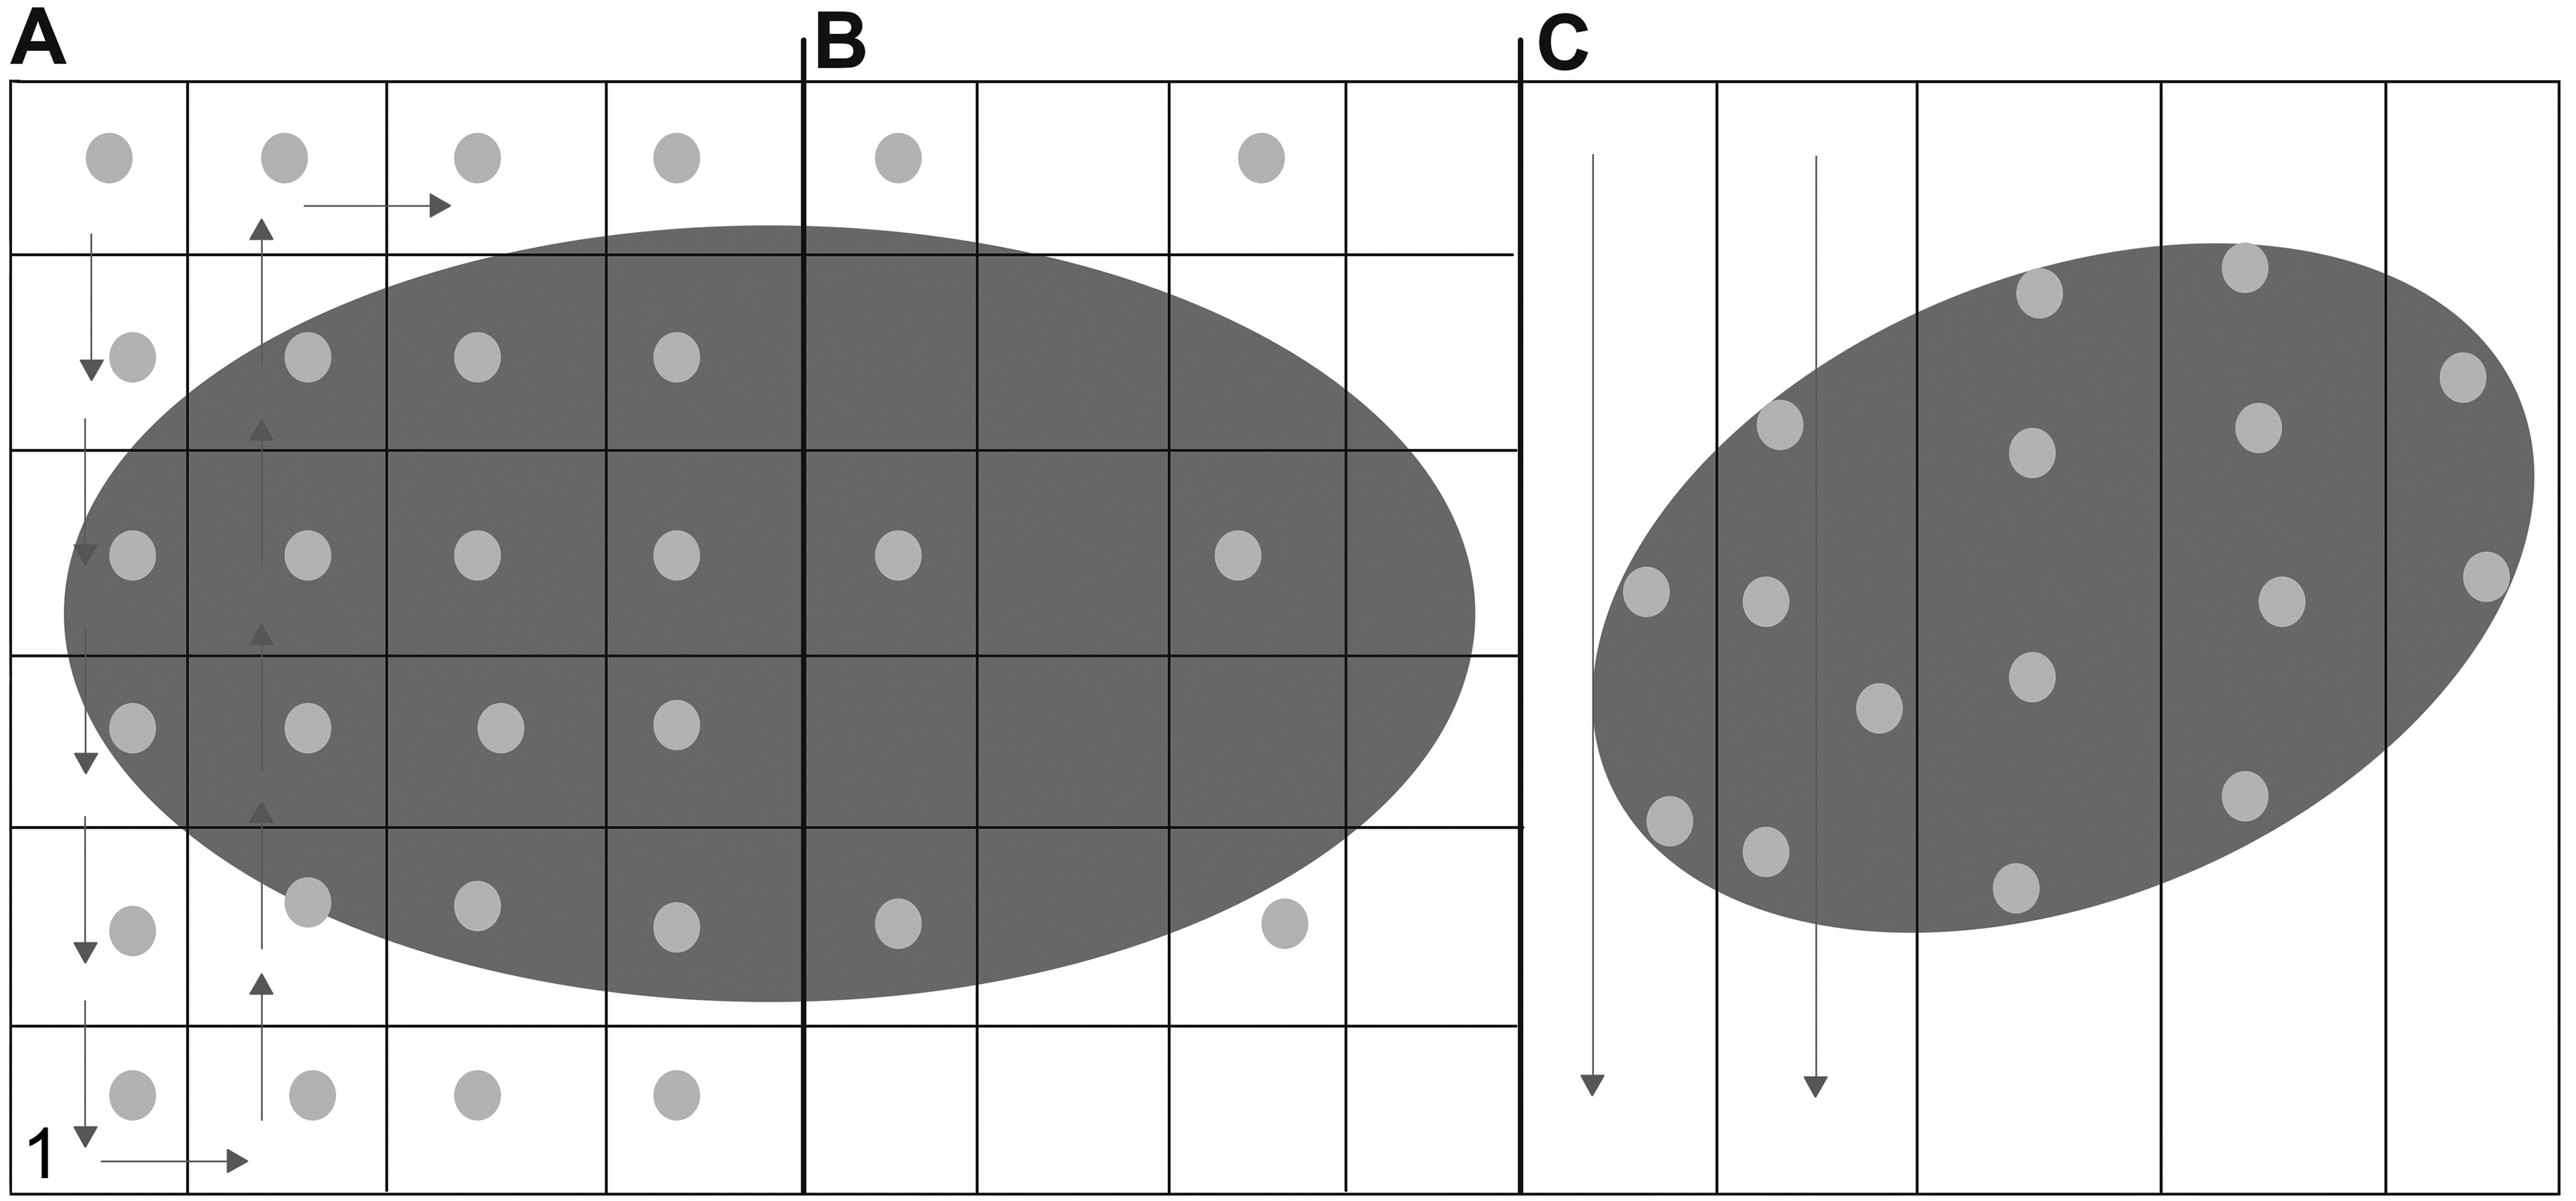
Scanning patterns. (A) Tile scanning of every tile. The arrows indicate direction of scanning. Dots within a tile indicate a focus point. (B) Tile scanning of every nth field. (C) Line scanning pattern. Dots indicate focus points of a focus map. With permission from Aeffner et al. 4
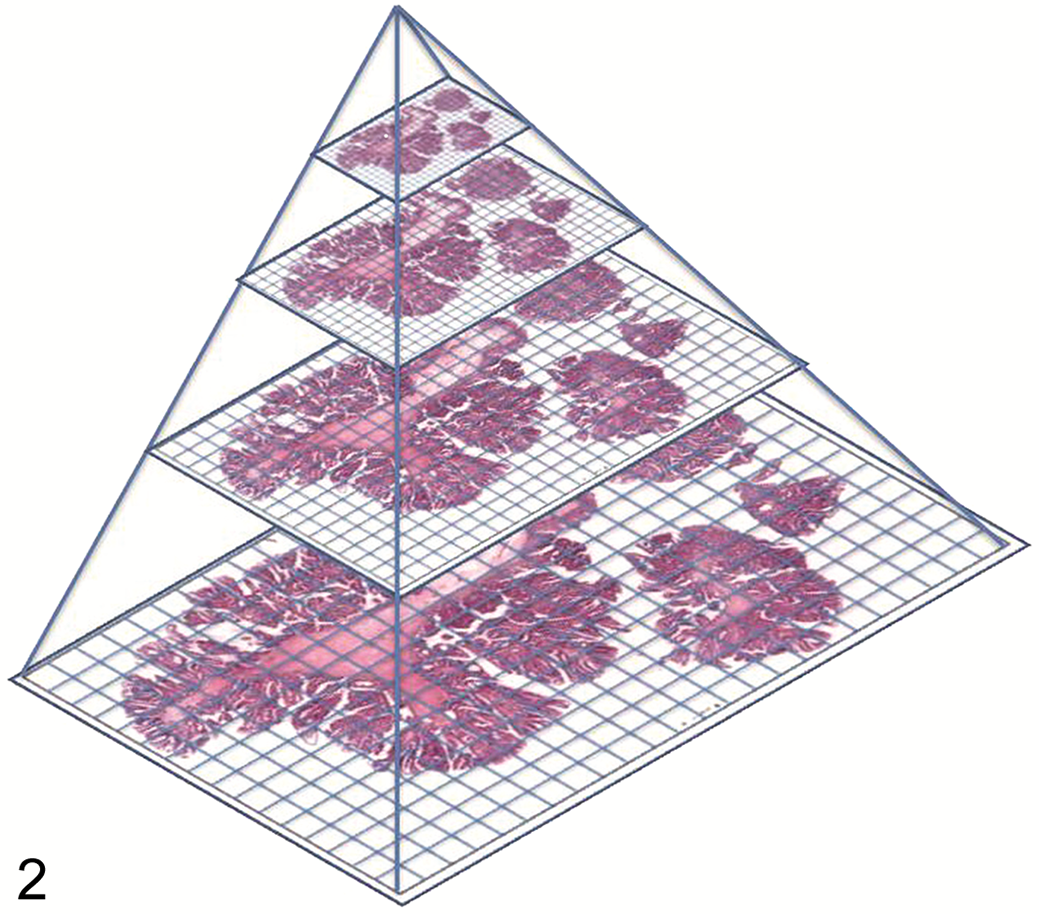
Illustration of digital slide storage in a pyramid structure of different magnifications. In this example, 4 different magnifications of the slide are stored in the layers of the pyramid. With permission from Hamilton et al. 59
One of the biggest determining factors of scan quality is slide quality. Whole-slide scanners are far less permissive for slide preparation imperfections than the human observer. Every fold, dirt particle, or air bubble on the glass slide can result in out of focus areas of the whole-slide image. Tissues sectioned at an excessive thickness will result in poor identification of the correct focal plane. Other histological artefacts impacting sample quality include tissue folding, compression, tearing, over- or under-staining, stain intensity variability, and stain batch variation. 116 In addition, the scanner itself can contribute to suboptimal scan quality as well, for example, out-of-focus scanning, uneven illumination of the slide, or contrast issues. 70 Currently, there are tools available that automatically detect histological artefacts and exclude them from analysis. 70,74 In addition, algorithms are available to aid in digitally mitigating staining variability. 26,43 However, the best approach to generating high-quality scans is to start with high-quality and cleaned glass slides.
Each scanner brand produces whole-slide images in its manufacturer’s proprietary file format. In the past, this impeded collaboration and whole-slide image exchange between institutions with different scanners, and limited image analysis work to software compatible with the specific file format. Currently, many slide viewers can accommodate several different file formats, and most commercial image analysis solutions are scanner/file-format agnostic. While digital radiology adopted a uniform file format strategy early on through the Digital Imaging and Communications in Medicine (DICOM) standards, similar efforts were lacking at the onset of whole-slide imaging. 30 Digital pathology-specific efforts are underway, and connectathons using DICOM standards have shown its general feasibility to communicate between separate whole-slide acquisition, storage, and viewing components. 29 To learn more about DICOM in digital pathology, the interested reader is encouraged to review Clunie et al. 30
Cost of Adoption
A hurdle to adoption of a digital pathology workflow is the upfront investment. This not only includes the cost of scanners and information technology (IT) infrastructure but also of additional laboratory space for equipment and of training personnel. Some academic institutions have combatted this by establishing centralized imaging cores that service the entire organization. However, the financial hurdle of adoption is often still too high for smaller companies and academic institutions. Some vendors offer slide scanning as a service and others have released more affordable whole-slide scanning solutions to help reduce the upfront digital pathology cost. In addition to the monetary investment, there are several other hurdles of adoption such as setting up the correct IT infrastructure (including hardware, software, network bandwidth), determining return of investment for an organization, and optimizing the digital pathology workflow including the scanning QC. Addressing all of these factors in detail is beyond the scope of this article and relevant information can be found elsewhere. 79,81,82
Scan Storage and Metadata
Whole-slide image storage can be a significant challenge when establishing a digital pathology workflow. Assuming an average whole-slide image size scanned at 40× of 1 GB, 134 its file size exceeds that of a radiology scan by approximately 30-fold. 36 Depending on the laboratory’s throughput, thousands or millions of slides could be scanned per year, thus producing terabytes and petabytes of data resulting in significant data management needs. Not only does this require significant server or cloud storage capacities but also in-depth considerations around building a digital slide repository or database. A meaningful database incorporates appropriate metadata storage and includes various ways to search its content. Metadata is “data about data” and includes information used for the identification, description, and relationships of electronic records or to each other. 108 At a minimum, scan-related metadata should include specimen-specific information, such as study number, case number, animal and group identifier, species, sex, and stain. Depending upon the database, slides can also be linked to relevant documents, such as study protocol or experimental design documents. 4 Ideally, the database is linked to the laboratory information management system (LIMS), and all specimen-related information is consistently captured and automatically integrated into the whole-slide image database. This contrasts with any metadata that may require manual entry, which is error prone and should undergo several layers of QC to ensure accuracy and consistency of data capture. In addition, such slide repository allows for access management, data maintenance, and data security. These tasks may require dedicated IT support of specifically trained laboratory personnel. Most commercial scanners now come with access to its vendor’s scan database software/structure. However, vendors also offer building custom database solutions fit for the client’s specific needs. Lastly, considerations should be given to appropriate data backup strategies.
Computational Pathology
A new concept emerging from digital pathology is computational pathology. It entails extracting meaningful information from integrated datasets that combine morphologic pathology images with other sources of raw data, such as metadata, clinical pathology, -omics analyses, spatial transcriptomics, and other “big data” sources. 2,80 The aim of this new field is to generate more holistic data assessments that aid in medical decision-making as well as biomarker discovery. Successful integration of different data assessment approaches will rely on further in-depth collaboration of computer scientists, imaging experts, data analysts, and pathologists as part of a strong multidisciplinary team. 2 To foster these approaches moving forward, some human medicine departments have founded computational pathology divisions (including but not limited to Duke University School of Medicine, University of Minnesota Medical School, UC Davis Health), 9,32,40 with select educational institutions developing multidisciplinary educational programs (eg, Clinical Informatics Fellowship Program at UC Davis Health). 28 Through the efforts of the Pathology Informatics Committee of the American College of Veterinary Pathologists (ACVP; discussed below), similar educational efforts are being started in the veterinary pathology field.
Digital Tissue Image Analysis
With the wide adoption of whole-slides imaging, information-rich tissue sections are now digitally available to be interrogated via algorithms to extract not only more robust and reproducible data but also to assess features that were previously not amendable to visual review. 8 Furthermore, image analysis data can be integrated into larger databases and datasets, and the numeric data can be extensively analyzed by statistical tools. 6 While digital tissue image analysis can aid in reducing bias in the assessment of tissues, it is most powerful when combined with the unique skills of a pathologist involved in the image analysis workflow. 7 However, it is also important to acknowledge that image analysis may not be the appropriate tool for every tissue interrogation, and that it can be labor-intensive with a need for significant amounts of up-front planning, QC processes, specialized tools, and trained personnel.
More recently, advances in computational tools have expanded digital tissue image analysis from a mainly quantitative focus, into the space of decision support systems helping pathologists prescreen their cases and identify relevant regions of interest for final diagnosis. 64
Available Tools
The market of digital tissue image analysis tools is rapidly evolving, and the availability of software solutions for various budget sizes has aided in its wider adoption. There are free and open-source solutions available online, including QuPath (specifically for digital tissue image analysis) and ImageJ (used for various image analysis approaches). 67,100 These solutions usually come with limited customer-support and may still require some coding skills for specific applications but can be used as a flexible base application upon which computer scientists and image analysis scientists can build their own fit-for-purpose solutions. In contrast, commercially available software tools not only include regular software updates and customer support, but they are also relatively more user friendly and the purchase price often includes training sessions. Many of the commercial products in this space are 21 Code of Federal Regulations (CFR) part 11 compliant, meaning that their application meets specific FDA-mandated standards including audit trails, system validation, and documentation. If in-house image analysis is not a viable option, services providers are available to complete this work as an outsourced activity. These companies are largely either software vendors also providing in-house analysis service, or more general contract research organizations (CROs) with super-user experience of specific commercial software tools. In addition, few service providers exist that only offer specialized and fit-for-purpose image analysis work utilizing highly customizable proprietary software tools without commercializing their software for external use. Despite these available choices, some institutions still decide to build their own custom software solution, requiring access to appropriate software development expertise.
Image analysis platforms can also be grouped by the type of algorithm development environment and degree of customization they provide. The easiest to use are prebuilt application modules, but they come with little to no ability to modify and are therefore restricted to only the use that they were specifically created for (eg, count Ki67-positive nuclei). Others provide development environments that allow the user to modify many parameters via graphical user interface (GUI) to customize algorithms specifically for the intended use without the need to be able to code. 134 Depending upon the degree of flexibility, these platforms may require more experienced image analysts to aid in algorithm development. Lastly, AI-based training modules allow for algorithms to learn from training datasets (discussed in more detail later), some of which are easier to use and train than others. In general, less customization option equals easier to use, and vice versa.
The Basics of Quantitative Image Analysis
Digital image analysis is by and large applied to extract quantitative information from tissues in a way that cannot be assessed in this fashion or to this extent via manual evaluation. The most commonly used categories of assessment are area-based, object-based, and, among them, cell-based measurements. 6,8 Independent of the image analysis approach used, the pathologist is an important part of the workflow ensuring quality data generation and interpretation. More important, basic knowledge and understanding of image analysis concepts is applicable to either analysis scenario and learnings from non-AI-based approaches can provide important insights when evaluating AI-based models.
Area/Pixel-Based Approaches
While an area-based measurement may appear simplistic in its approach, it nevertheless can be both an expedient as well as a powerful analysis tool. The knowledge of the area of a given pixel allows for the calculation of an area based on the number of pixels it entails. The most straightforward approach utilized may consist of manual annotation of the area of interest on a slide, and automated quantification of the encircled area (see below for more detail on manual image annotations). More commonly, a specific stain is used to identify an area of interest, and the algorithm is used to quantify the area of said staining. For example, to quantify the extent of cardiac or hepatic fibrosis, sections may be Masson trichrome–stained to highlight the areas of interest (fibrosis), and an algorithm is used to quantify the area of the blue staining (Fig. 3). 37 Applying such area-based assessments to immunohistochemical (IHC) staining, one has the ability to develop an algorithm with a built-in scoring paradigm, for example, to quantify not only areas of staining above a certain staining intensity threshold, or to quantify all staining, but to break down the overall area into different staining intensity “buckets” akin to a manual scoring paradigm (1+ = mild staining intensity; 2+ = moderate staining intensity; 3+ = marked staining intensity). 7
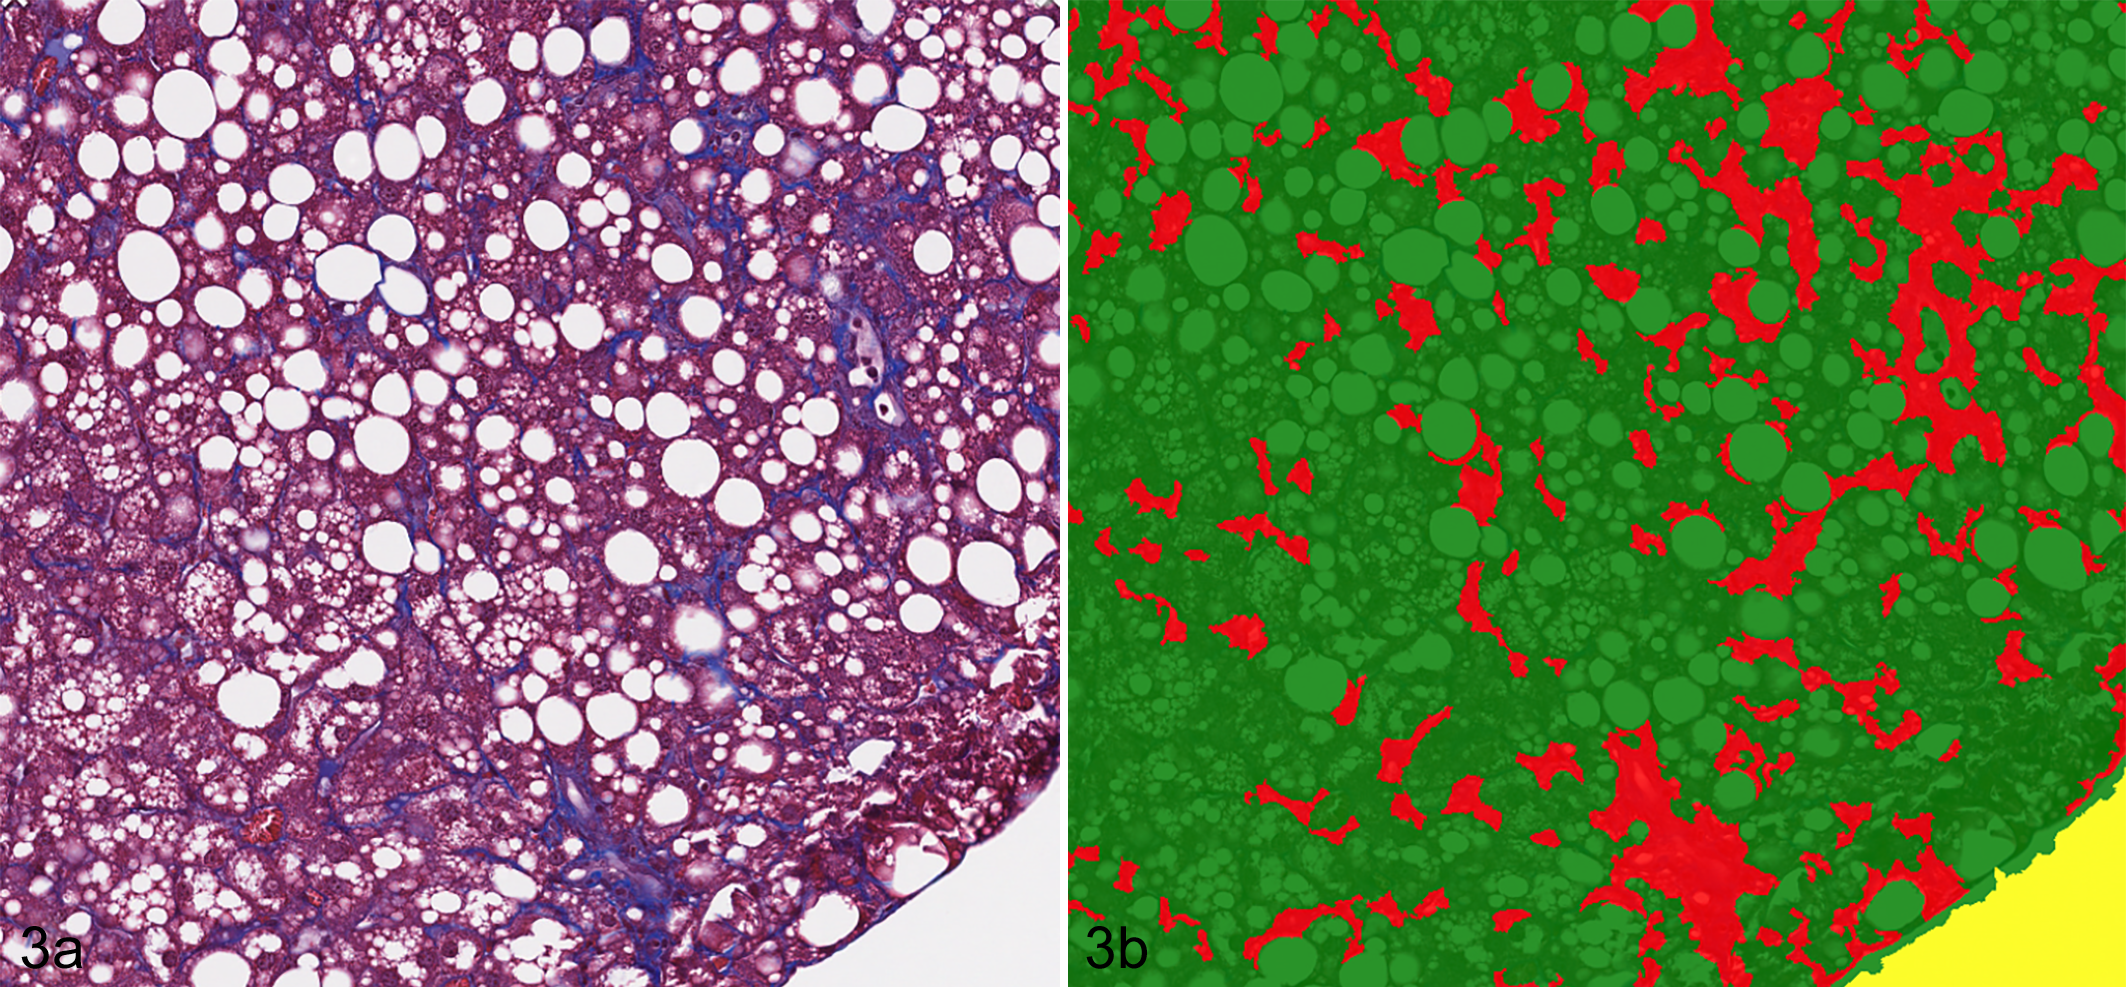
Fibrosis and lipidosis, liver, mouse. Example of area-based assessment in quantification of hepatic fibrosis. (A) Areas of fibrosis are stained blue. Masson’s trichrome. (B) Algorithm markup images quantifying areas of fibrosis/blue staining. Red = fibrosis, green = remaining liver tissue area.
At times, even an assessment that in its concept is cell-based may deploy area-based measurements. In several papers published on the quantification of the exclusively nuclear biomarker Ki-67, instead of enumerating each Ki-67-positive nucleus, the analysis was based on quantifying the total Ki-67-stained area and dividing this measurement by an average nuclear size to generate cell-based data points (ie, number of Ki-67-positive nuclei). 65,78
It is important to ultimately be aware that the area measured on the slide does not directly translate to the exact area of tissue prior to harvest, as many preanalytical steps introduce tissue deformation (both shrinkage and expansion). These deformations are neither uniform across an entire sample set nor across all areas of the same sample; therefore, one cannot assume that such error equally applies to the entire project. Since the standardization of preanalytical variables is not always possible, stringent sampling methods as described in the stereology section below should be considered.
Object-Based Approaches
Object-based measurements rely on segmentation of the image into individual objects. These can be tissue structures composed of cells, as well as objects within tissue that are not comprised of cells. For objects composed of cells (eg, glomeruli, hair follicles, vessels), the analysis approach can rely on first detecting cells and subsequently merging them into objects or detecting objects without performing prior cell segmentation. Once an object is identified, data can be extracted on an object-by-object basis. For example, vascular profiles are formed by endothelial cells; however, cell-by-cell data is usually not of interest in vascular analysis. In fact, vascular detection algorithms often do not rely on detection of individual endothelial cells. Instead, the detection focuses on the general object (vessel) and extracted data usually includes enumeration of vascular profiles, their luminal area, circumference, minor/major diameter, and so on. These data points are generated on a vessel-by-vessel basis, and then can be analyzed across a region of interest (ROI) or an entire sample.
There are also tissue structures that are not formed by cells, yet still may warrant quantitative assessment. Examples include both subcellular structures independent of cell enumeration (eg, fat vacuoles) as well as cell-independent structures (eg, Alzheimer plaques; Fig. 4). 4,6
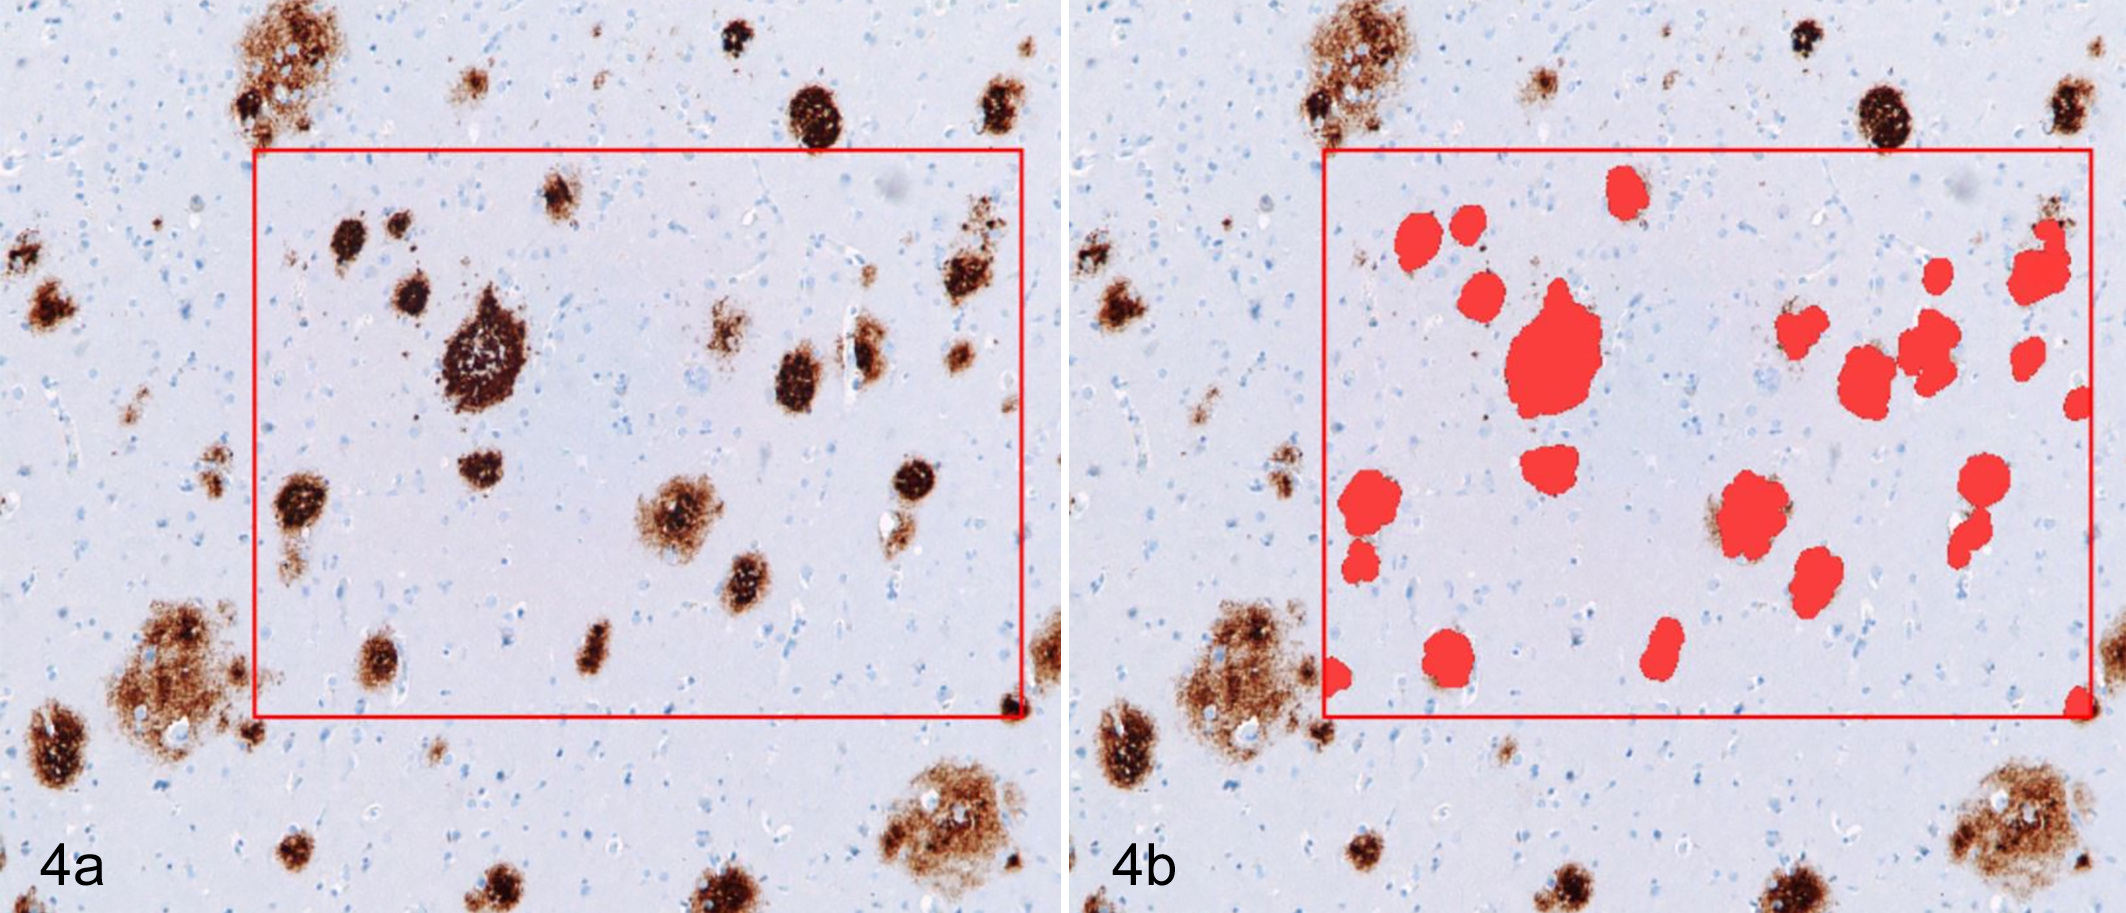
Senile plaques, brain, human. Example of object-based measurements that are not based on cellular detection. (A) Senile plaques (brown) are identified via immunohistochemical labeling for beta-amyloid. The red box marks the region of interest. (B) Algorithm markup (red) of beta-amyloid plaque areas. Modified from Nephron. 92
Cell-Based Approaches
Most quantitative image analysis work appears to be centered on identifying cells as the most fundamental components of tissue.
Based on the identification of individual cells and the segmentation of the tissue into these units, algorithms can then use cellular features to identify and analyze specific cell populations. Cellular morphology features are manifold, including cell size, diameter, cytoplasmic area, roundness, eccentricity, and nuclear orientation along the major axis. 4,6,8 Adequate combination of these features can at times enable separation of tumor from stroma without the need for a tumor-specific stain. Spatial relationship to each other and orientation within the tissue can also aid in grouping cells together, for example, to identify pre-neoplastic lesions based on cellular features and proximity, 5 or to identify glandular epithelium based on nuclear axis orientation. 77 Data can be extracted and analyzed both on a cell-by-cell as well as a cell population basis (eg, characteristic of the tumor cell population in general).
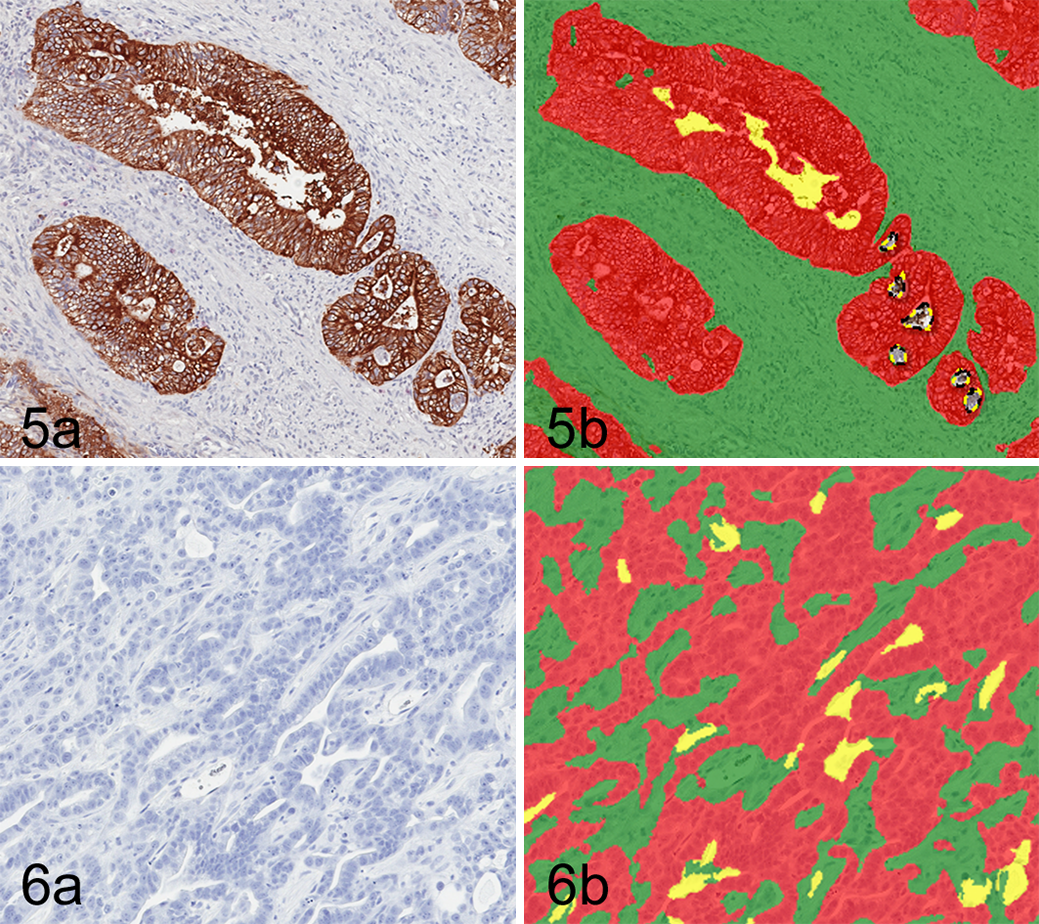
Example of tumor-stroma separation via image analysis with a tumor marker. (A) Carcinoma, colon, human. Immunohistochemistry for cytokeratin (DAB chromogen, hematoxylin counterstain). (B) Algorithm markup of panel A separating tumor (red) and stroma (green) based on presence or absence of IHC labeling.
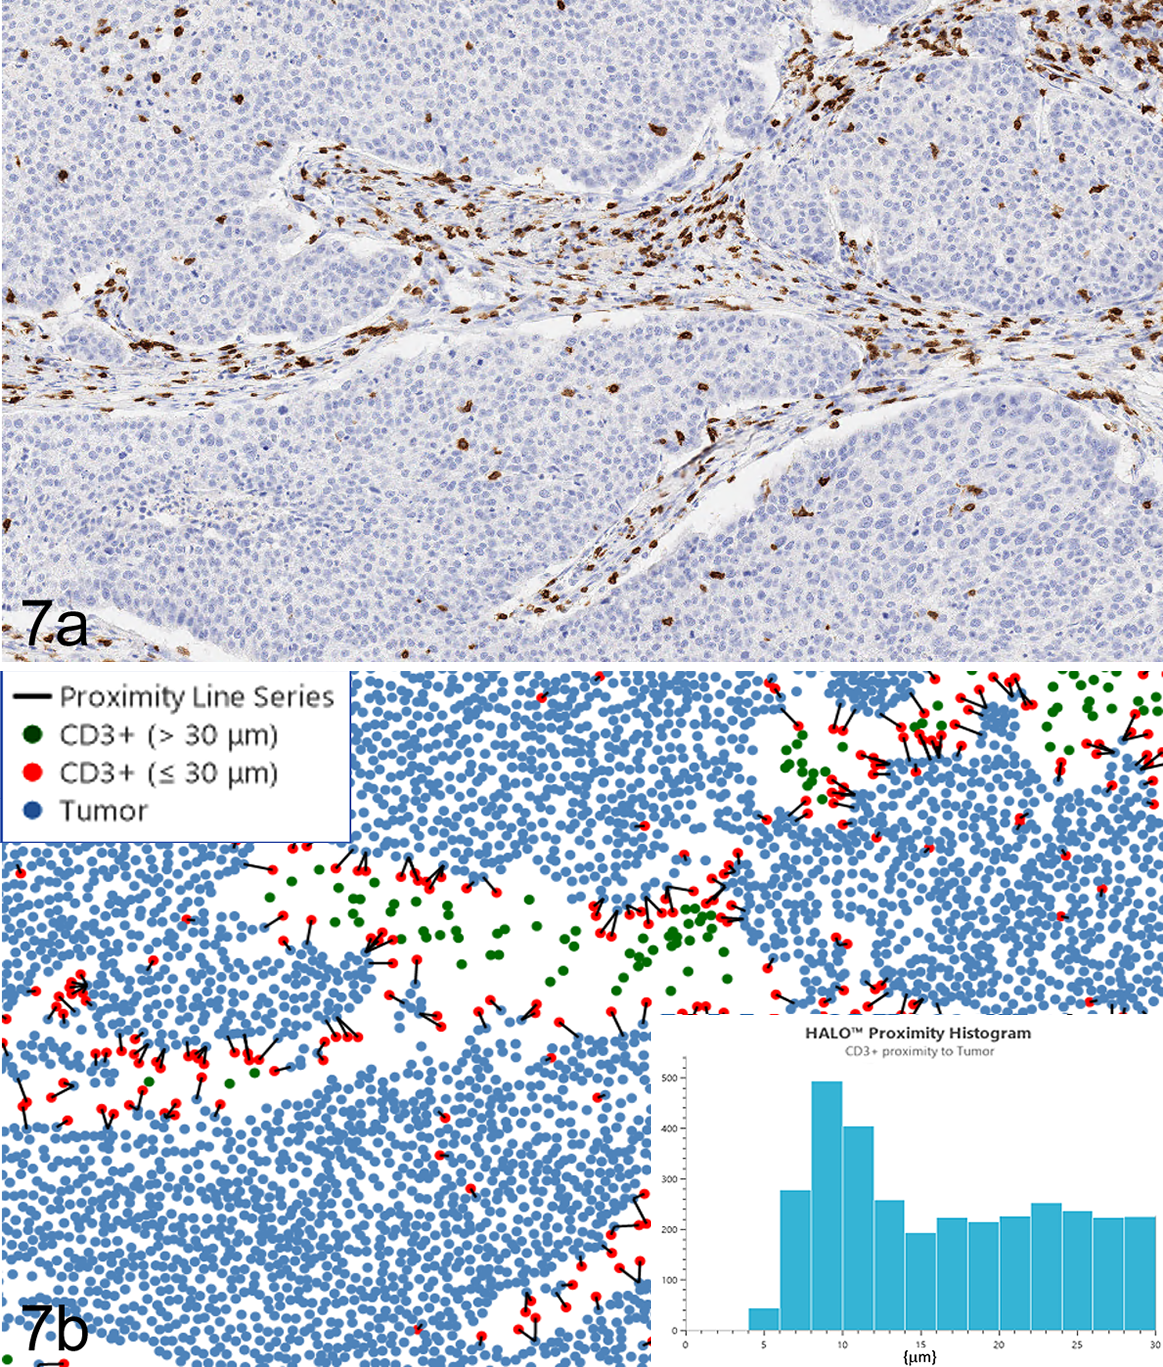
Non-small-cell carcinoma, lung, human. Digital pathology image analysis (proximity analysis) in spatial context reveals biomarker and cell heterogeneity. (A) Immunohistochemistry for CD3 (T cells; DAB chromogen, hematoxylin counterstain). (B) Tumor cells and T cells identified by image analysis were plotted spatially and analyzed to quantify T cells within 30 µm of tumor cells (proximal immune cells). Tumor cells are represented by blue dots, proximal T cells by red dots, and nonproximal T cells by green dots. The distance between tumor cells and proximal T cells are recorded to create a histogram (inset, bottom right) and are connected by nearest neighbor lines in the dot plot. Spatial plot generated with HALO, Indica Labs. With permission, Indica Labs.
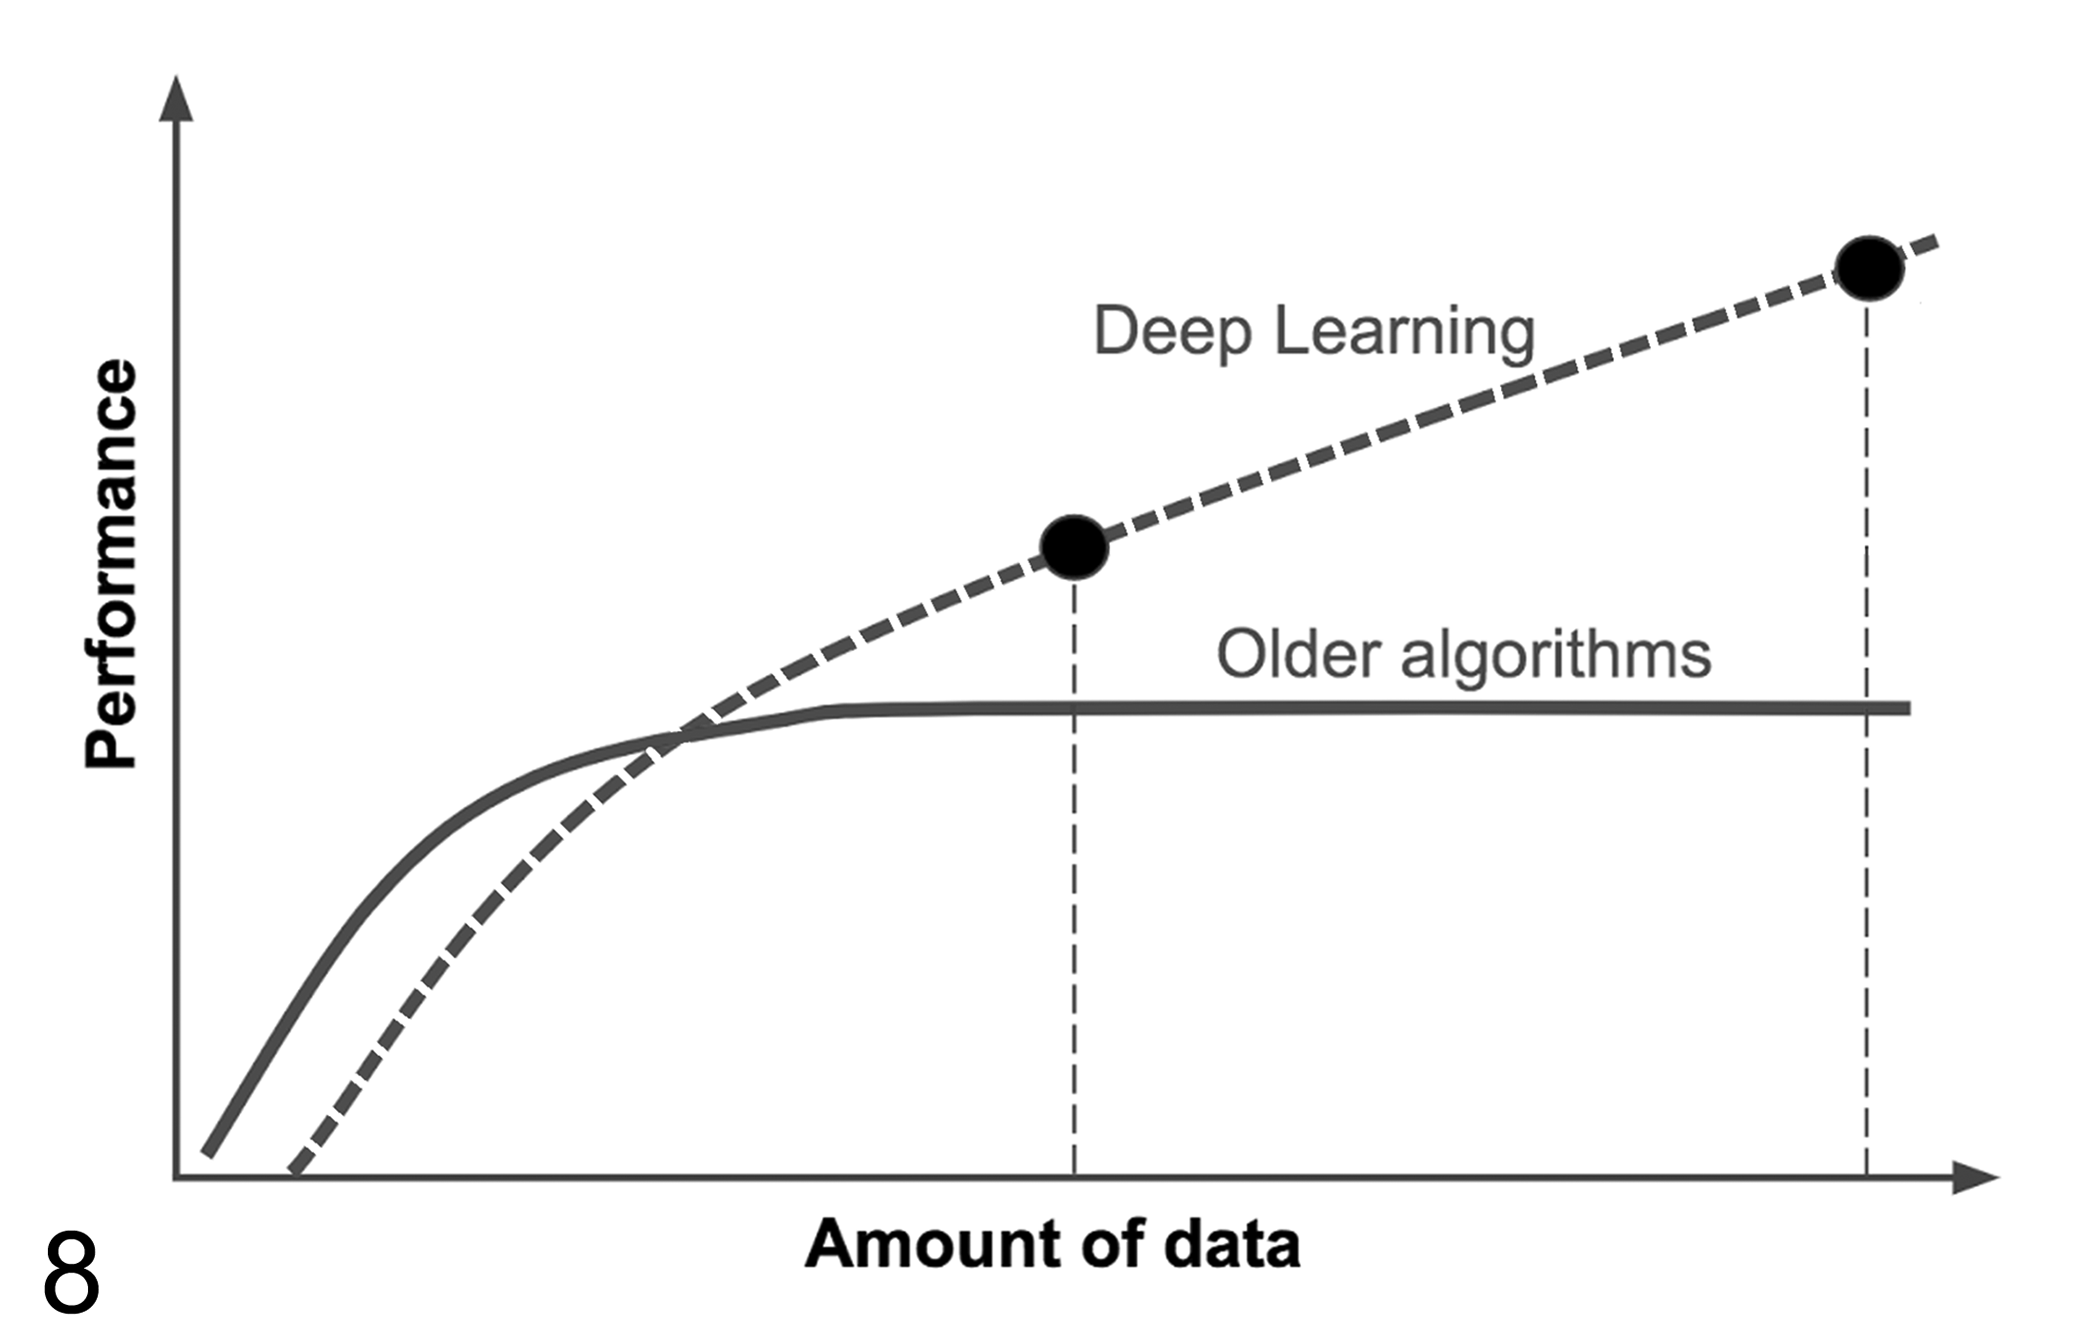
The performance of deep learning algorithms increases with the amount of labeled data used for algorithm training. However, when limited amounts of data are available, older algorithm approaches can deliver superior performance. Modified after Ng. 93
Other useful parameters that can be derived from cell-based analysis are the spatial relationships of cell populations to each other, which is of particular relevance in the field of immuno-oncology: There is growing interest to not only characterize the immune cell populations in the tumor compared to the stroma but also to establish where the immune cells are in relationship to other cells (eg, proximity analysis, nearest neighbor analysis; Fig. 7). This may include the spatial distance of immune cells to the tumor margin in general, the distance to the nearest individual tumor cell, or to the nearest cell expressing a biomarker of interest (eg, CD8, PD-1). 8
AI-based approaches
In AI-based approaches, the identification of different cellular and tissue features is based on providing the AI model with examples of different categories of structures (ie, tumor cells). The model learns to recognize the structures and is subsequently able to detect and classify them in previously unseen images. For more on AI-based image analysis see below.
Overview of the relationships between relevant disciplines within the field of artificial intelligence. Modified after Turner et al. 123
Rule-Based Image Analysis
While there is a lot of excitement around AI-based trainable image analysis tools, it is important not to completely discard all traditional or so-called rule-based image analysis approaches. In fact, when sample sets are small, non-AI-based approaches are known to perform better and generate robust results (Fig. 8). This is largely due to the fact that AI models require a significant number of examples across many samples for model training, and such a training set ideally needs to be separate from the test and qualification sample set, further increasing overall required sample numbers. Another advantage of rule-based approaches is the fact that the algorithm decisions are easily explainable which is usually not the case with AI models.
Carcinoma, subcutis, allograft (proprietary cell line), mouse. Manual image annotation with immunohistochemical labeling. A single large “inclusion” annotation (green outline) is combined with multiple “exclusion” annotations (yellow) to exclude larger areas of necrosis and several histology artifacts (tissue folds) from analysis.
In rule-based approaches, the algorithm follows previously programmed and rigid rules of decision making to classify pixels into structures that are categorized by attributes such as shape, size, color, intensity, and similarity. 129 Most tissue algorithms start with identifying the nucleus, governed by rules that group blue pixels together that form a round structure of a certain size. 133 Once the nucleus is identified, the algorithm can use its location as a fixed point from which to identify the cell membrane and cytoplasm (based on programmed rules). When the tissue is then segmented into its cellular and subcellular compartments, analysis approaches as outlined above can be applied. Within an entire image analysis project, certain algorithm settings may need to be adjusted on a per-sample basis to ensure appropriate performance. This can be a time-consuming process.
Artificial Intelligence–Based Image Analysis
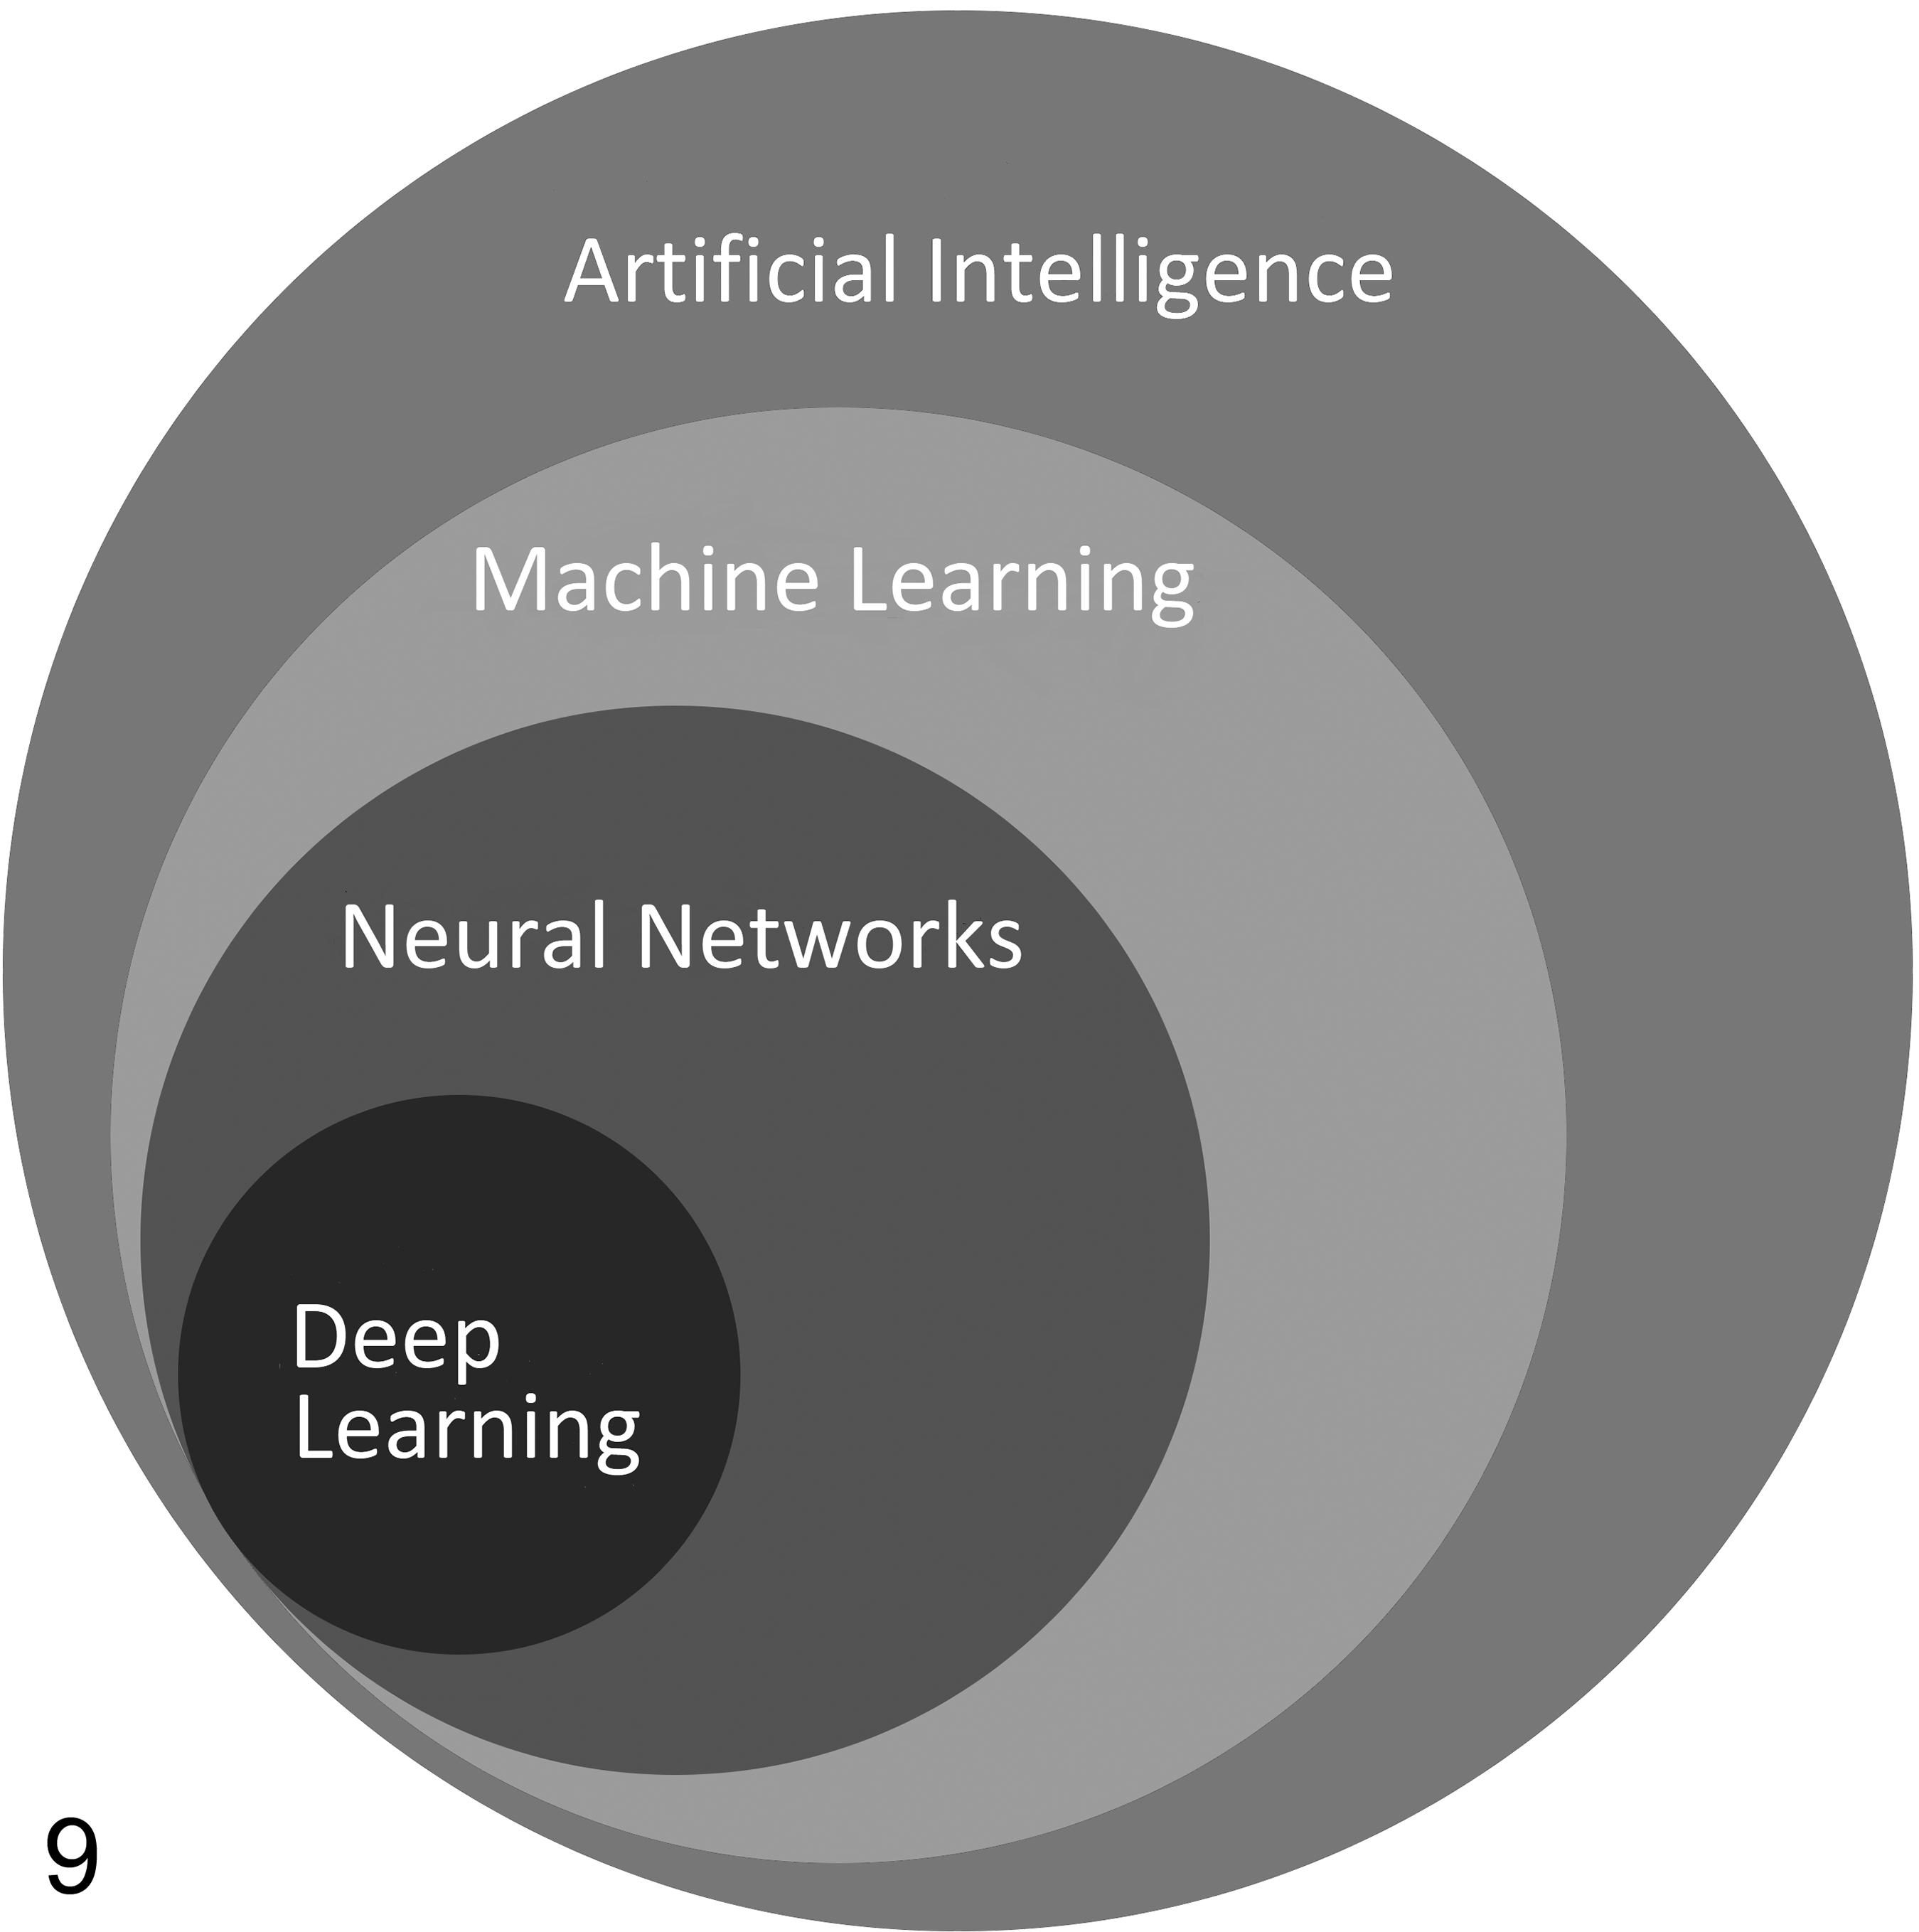
In recent years, digital tissue image analysis methods shifted from the traditional, rule-based approaches of manual algorithm tuning on a per-sample basis toward applying AI machine learning (especially deep learning)–based methods to entire sample sets. These AI-based approaches have been shown to outperform other algorithmic methods in solving complex computer vision tasks such as object recognition in photographs. 24,73,75 In pathology, AI-based approaches are used for complex problems and large datasets, where rule-based approaches may fail or are too time-consuming. Recently published examples of utilization of AI-based image analysis of animal tissues include spermatogenic staging assessments in rats, 34 identification and quantification of DSS-induced colitis in mice, 14 evaluation of cardiomyopathy, 119 retinal atrophy, 38 and hepatocellular hypertrophy in rodents, 99 screening for bone marrow cellularity in non-human primates, 113 and detecting mitotic figures. 11 AI is an overarching field of computer science aimed at simulating human intelligence to solve complex problems, whereas machine learning is a subset of AI intending to train computers to learn from and interpret data without being explicitly programmed (Fig. 9). 123 From the user perspective, the difference between the traditional rule-based approach and the machine learning approach is that in the former, tissue features for analysis were defined by the user and the algorithms were hard-coded to detect them, whereas in machine learning the algorithms are trained with example data (training set) to identify the tissue features required for analysis without the need for manually defining these analysis parameters. It is then expected that the AI algorithm detects similar features in a new and previously unseen data set (test set). 73
One subfield of machine learning—deep learning—has been constantly outperforming other machine learning methods for solving computer vision tasks and thus was adopted for medical imaging data analysis, including pathology images and tasks such as breast cancer metastasis detection in sentinel lymph nodes. 127,128 The models in deep learning aim at resembling neuronal connections in the human brain and are called artificial neural networks (ANNs). One type of ANN, the convolutional neural network (CNN), has been shown to be particularly apt for analyzing pathology images. In order to extract the information necessary for detection of the structures of interest, a CNN performs a series of mathematical operations called convolutions on all pixels of the input image providing an output in the form of structure of interest detection, classification, and/or segmentation. The detailed description of how CNNs work is beyond the scope of this review and can be found elsewhere. 68 CNNs can learn in either a supervised or an unsupervised way. 123 Supervised learning requires examples of labeled data, such as histopathological diagnosis, manual annotations of regions or structures of interest, or any other type of labeling, to show the network what should be detected and how it should be classified in an unknown data set. The unsupervised learning method lets the CNN group data within the data set according to their similarities of various features without any previous labeling. 24,120
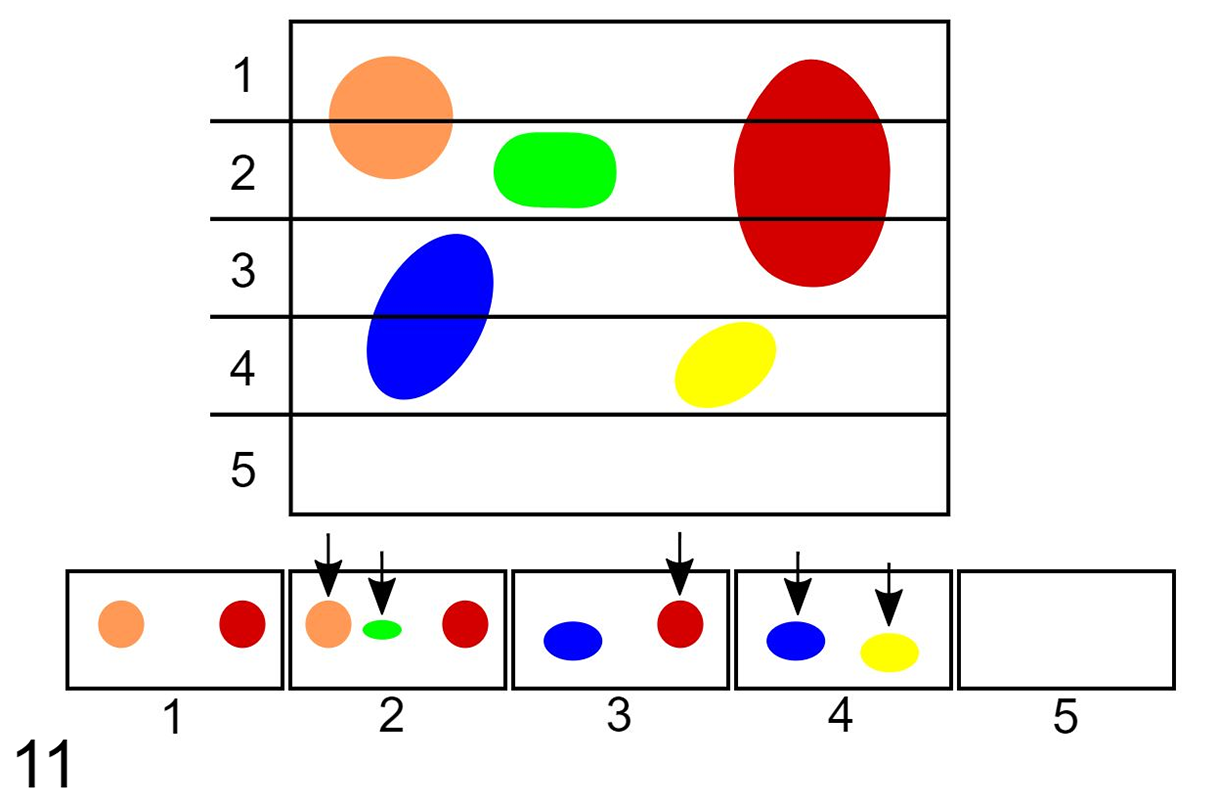
Exhaustive sectioning of a 3-dimensional tissue into 2-dimensional planes. If all of the sectioning planes (1 through 5 in this example) are laid side by side and objects are only counted if they are present within one section but not within the next section, as occurs with the physical disector, each object would only be counted once (arrows). This would result in the correct number of objects being counted; 5 in this example. In contrast, if the tissue is exhaustively sectioned and objects are counted on every sectioning plane without the application of the disector, the number of objects would be overestimated. In this case, the total number of objects counted would be 9. Notice that objects that are larger and perpendicularly oriented to the sectioning plane (ie, the red object) would have a higher tendency to be over-counted. With permission from Brown. 20
In histopathology, unsupervised learning methods have already been used for such applications as context-based image retrieval (CBIR). This method retrieves images similar to a query image, 73 and could be useful to both diagnostic veterinary pathologists as well as toxicologic pathologists for comparing current cases with historical ones stored in a database. Other reported approaches include virtualization of IHC tissue staining, 76 nucleus detection, 62 and cancer detection. 35 To increase the overall performance of the deep learning models, unsupervised approaches can be combined with supervised and other image analysis methods into semi-supervised and multi-instance learning, 73 and take tissue image analysis to the next level.
As the mathematical operations on an image within a CNN are far more complex and the decisions made by the CNN more difficult to interpret than in simpler machine learning methods, CNNs are often referred to as a “black box” as it can be challenging to identify how the CNN generates a specific result. In accordance with the General Data Protection Regulations, AI systems used in health care should have a certain level of explainability to allow human users to retrace the system’s decisions. 50 This is the focus of an emerging field within AI called explainable AI (XAI). XAI is tasked with explaining the way current AI systems work and designing new systems in a more explainable fashion. XAI is being increasingly applied in medical imaging including pathology. 112,121
Similar to traditional image analysis, image analysis teams can apply deep learning–based approaches using commercially available tools (no AI programming skills required) or independently code custom solutions using flexible programming languages. The pathologist is an important member of an image analysis team and should be involved in project planning as well as QC strategy development. Algorithm QC for supervised deep learning models is slightly different from QC of traditional image analysis approaches. While it involves qualitative visual QC of the markups, it can also incorporate their quantitative, automated comparison to ground truth (ie, manual, or curated automated annotations generated both for training and later validation of the model). 135 However, visual QC is mainly used for the early development stage of the model, while progress and model improvement are monitored by mathematically comparing the performance of the model to the provided ground truth. This is done by tracking the improvement of specific evaluation metrics. Detailed review of the machine learning model evaluation metrics is beyond the scope of this article and can be found elsewhere. 60,61,88,94 Similar to traditional image analysis approaches, up-front project planning with the entire team should involve selecting appropriate performance metrics to monitor algorithm performance specifically tailored to the context or goal of the analysis project. 135
While AI-based image analysis models perform most optimally when analyzing high-quality whole-slide scans, especially deep-learning-based approaches can incorporate automated recognition and elimination of tissue and staining artefacts. 13,72,110 This usually requires the introduction of additional categories (so-called classes) to the model (ie, tissue fold, focal blur) and the generation of sufficient ground truth data (ie, examples) to reliably train the model. While sample size is an often-encountered limitation, it is of note that such models can later be used for other projects, potentially reducing, for example, the future project’s dependence on highest quality slide preparation.
AI-based digital tissue image analysis remains a rather new and evolving discipline with adoption still posing challenges. These hurdles include lack of validated software tools, lack of widely adopted workflow guidance, necessity for large amounts of high-quality labeled data for supervised model development, high complexity of pathology diagnostic problems (eg, often several pathological processes visible on the slide), and affordability of computational power and data storage space. 118 We will discuss a subset of these adoption hurdles in the following sections. In other disciplines, such as radiology, cardiology, and diabetes research, AI-based analysis tools have already been validated to gather FDA clearance or approval as medical devices. 120 Even though the AI-based tissue image analysis field is rapidly advancing, as of today, there is no AI-pathology application that has gathered enough data to be accepted by the FDA for clinical use in human medicine.
One barrier to wide adoption is the need for sufficient amounts of curated labeled data for supervised AI model development. 118 Although almost all slides contain a certain type of description or metadata (eg, animal species, tissue, diagnosis), the consistent application of labeling categories and terminology is oftentimes lacking. Pixel-level annotations vary between different annotators and projects, limiting their reusability. The generation of consistently labeled or annotated data by pathologists is time-consuming and often becomes the bottleneck of the analysis workflow. To overcome this challenge, some AI service providers have built large networks of pathologists that collaborate on large annotated data sets for AI model development. One industry-wide effort to overcome this challenge is the Innovative Medicines Initiative’s BIGPICTURE project. 90 In general, the more individuals are involved in this step, the higher the need for rigorous QC for consistency. Alternatively, data augmentation, active learning, weakly supervised and unsupervised deep learning methods can be utilized. 104,114,118 However, these approaches come with their own challenges and require combined pathology and computer science expertise within the image analysis team for correct interpretation. 114
The complex nature of pathology diagnostic problems often requires development of very precise multi-class segmentation models, which in turn require even larger amounts of labeled data for acceptable performance. 118 However, if the AI model is focused on a single problem (eg, mitotic counts, positive cell counts, specific tissue feature, or region detection), the models are able to quickly reach performance comparable or exceeding that of a manual read. 24 Aside from increased data accuracy and precision, these approaches also have the ability to increase workflow efficiency and to liberate pathologists from mundane and time-consuming tasks.
Nonquantitative Image Analysis
At times, images analysis tools are deployed without the intention to generate a quantification output. These applications are often geared toward pattern recognition to identify samples or tissue areas that are different from normal, in order to flag them for pathologist’s review. These applications, also known as decision support systems, generate a markup (eg, a probability heat map) that aids the pathologist in focusing more on a particular region of the slide. 64 The ability of an algorithm to accurately identify normal versus abnormal tissues is an active area of research and development. Successful generation of such tools will require large sample sets accounting for real-life data heterogeneity, including different tissues, species, and laboratories of origin. While the expectation remains that every slide is reviewed by a pathologist, ultimately such tools have the potential to significantly increase the efficiency of the pathology workflow by streamlining slide evaluation. These applications are generally based on AI. Akin to this overall process, AI-based algorithms can be used to verify the presence of proliferative lesions in positive control groups of Tg-rasH2 carcinogenicity studies. 106
Manual Image Annotations
In the larger context of digital pathology and image analysis, the term “annotation” can be used in different contexts. At times, “annotating a sample/slide” may refer to adding metadata to a sample (ie, adding a digital tag to a whole-slide scan that identifies the sample as being a colonic adenocarcinoma). In the following paragraph, we are referring to annotations as manual delineations of certain whole-slide image regions or tissue components.
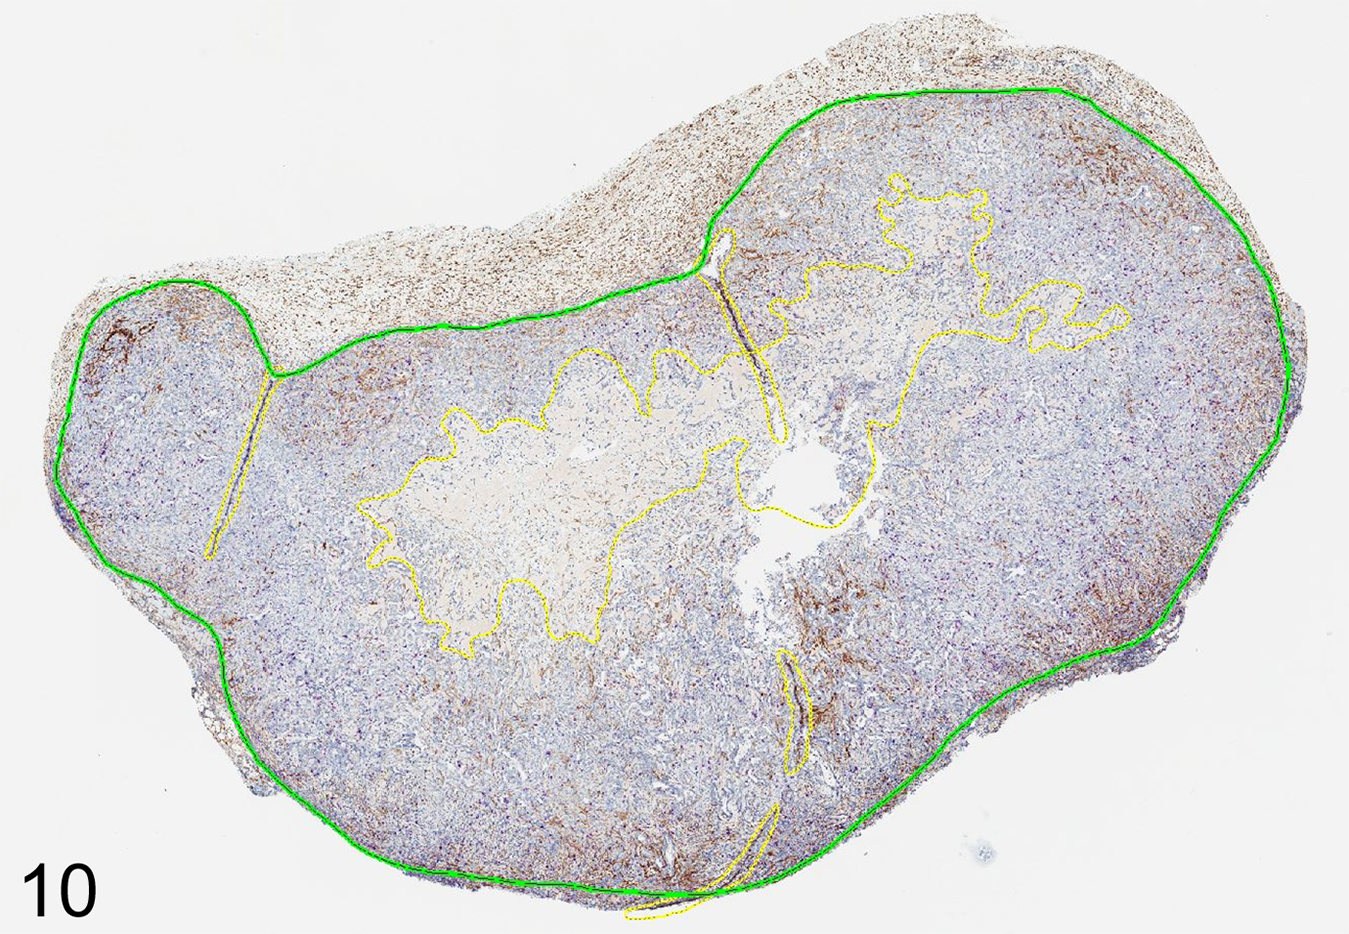
In traditional rule-based image analysis, annotating (also called image masking) tissue areas as ROI aids downstream image analysis work. For one, it reduced the area the algorithm needs to analyze, which both reduces the processing time, as well as the generation of irrelevant data (eg, assessment of clear glass or tissue not of interest). In addition, annotating tissue in a way that limits the ROI to fewer components greatly aids the algorithm development. For example, it is much easier to tune an algorithm to distinguish tumor tissue from surrounding stroma if the general tumor area is annotated. However, it is significantly harder to tune it to distinguish tumor from stroma as well as from preexisting non-neoplastic tissue. Manual annotations consist of drawing inclusion lines (everything within the closed inclusion line will be analyzed) and can be modified by adding exclusion lines (everything within a closed exclusion line will not be analyzed, despite being within an inclusion line; Fig. 10). 8 By these means, one can manually exclude histological artefacts and unwanted tissue components (eg, thick walled vessels, nerves, necrosis, preexisting normal tissue). This process can be labor-intensive (at times more labor-intensive than the algorithm development itself) and does not necessarily need to be performed by a pathologist. However, it is important that the pathologist oversees the annotation process and plays an active role in annotation QC as their quality can significantly impact the quality of the data generated by image analysis. 6
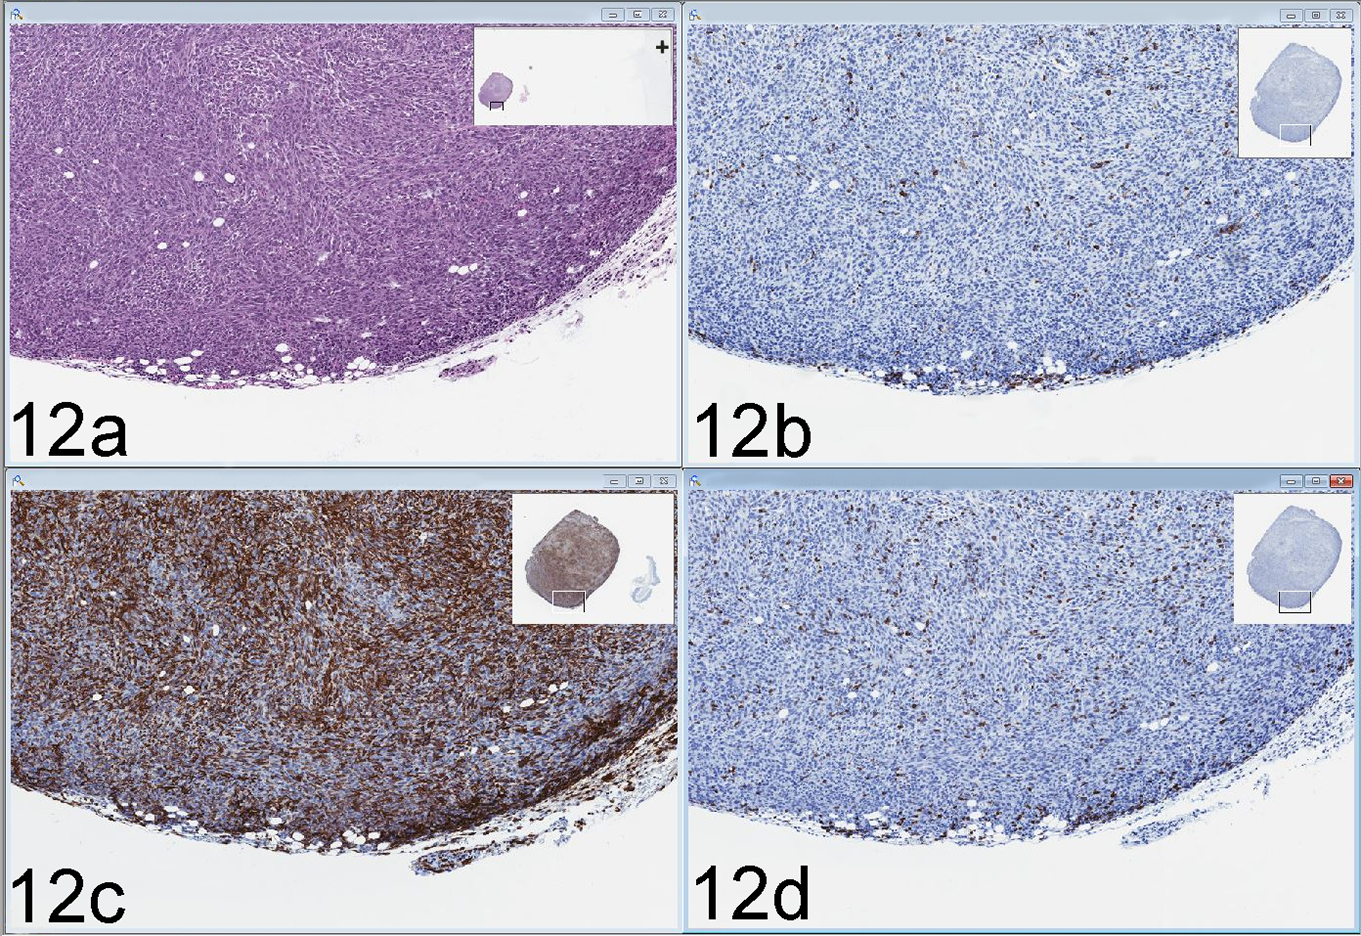
Carcinoma, allograft (proprietary cell line), mouse. A digital slide viewer allows simultaneous assessment of multiple characteristics of the same specimen by side-by-side viewing of serial sections stained with hematoxylin and eosin (A) and immunohistochemistry for 3 different markers (B–D, marker names proprietary). Primary antibody chromogenic detection with DAB and hematoxylin counterstain (B–D). Inset rectangle at the top right of each of the 4 displays shows a full slide scan overview. View displayed here using Aperio ImageScope v12.3.3.5048.
When applying AI-based image analysis approaches, manual large ROI annotations (eg, tumor, stroma) are usually not necessary. Instead, multiple small areas of various classes of interest are delineated as examples for the model to be trained in identifying these classes in the whole-slide image (including classes for clear glass, tissue artefacts, necrosis, and other areas to be excluded from data generation). Based on the model performance, annotations may need to be added or modified to further improve its performance.
Role of Pathologists in the Image Analysis Team
The makeup of an image analysis team can vary widely, based on the work environment, available resources, frequency, and scale of image analysis projects. There are several key competencies that should be represented within such a team. While one person may embody several of these competencies, it is most likely that it takes a team of several people to bring the right expertise together. In addition, there may be variable need for technical support of slide staining, scanning, scan QC, and annotations. Because algorithm development and tuning can be a time-intensive process and, depending on the software tool, may require specialized image analysis expertise, this task is rarely performed by pathologists themselves but rather by an image analyst. Most often, histopathology and disease biology expertise are represented by the pathologist team member; however, there may be added value in having a researcher with in-depth biology expertise in the condition/disease interrogated as part of the team. 6
The pathologist’s input and expertise are important to the overall success of an image analysis project. This starts at inception and planning and continues along the progress of the project at specific steps in the workstream, when pathology QC should occur to ensure only samples worth taking forward continue along the analysis workflow. Not all QC steps need to be performed by the pathologist, but the QC process design and oversight should be the pathologist’s responsibility. This is due to the fact that the pathologist is uniquely qualified to evaluate the impact of various factors on the quality of the final data generated (eg, selection of animal model, tissue biomarker). These factors also include preanalytical variables introduced at tissue harvest, sectioning and staining, as well as histomorphological features and tissue characteristics that may affect analysis strategies. 6 An extensive review of the impact of preanalytical variables on slide and image analysis data quality is beyond the scope of this article and can be accessed elsewhere. 25,69,116
Quality Control Considerations
In the planning stages of an image analysis project, considerations of appropriate QC steps and criteria are a key aspect. In general, the QC should center on identifying key reasons why a specimen or its data should be included or excluded from the final data set, and at what point in the workflow it would be most effective to make these decisions. One can consider performing all QC at the very end of the image analysis work; however, that may mean that samples that are of insufficient tissue, staining, or scanning quality have progressed through the entire image analysis process and wasted valuable annotation and analysis resources. On the other hand, controlling the quality of every sample at every step is likely not an appropriate use of resources either. As outlined above, while the pathologist should oversee the QC process, individual steps may be delegated to trained personnel. 6,135
The following questions and considerations may aid in designing a project-specific QC process with selection of adequate QC criteria:
– Is the sample set large enough for the desired analysis and expected effect size?
– Is the tissue of sufficient quality (eg, appropriately fixed and handled)?
– Is the histology specimen of sufficient quality (eg, not obliterated by tissue folds, air bubbles under the coverslip, or other artefacts)?
– Is the tissue compartment of interest present in sufficient quantity to interrogate it? For example, in a tumor study, not every slide may include tumor, or the tumor area present is comprised of too few cells to enable meaningful data generation.
– Is the staining of sufficient quality, including appropriate staining protocol optimization for image analysis endpoints? Is the staining modality appropriate for the scientific question posed (eg, chromogenic vs fluorescent staining, IHC vs in situ hybridization [ISH], single stain vs multiplex, or is [linear] dynamic staining range required)?
– For the staining used, how is “biomarker-positive” defined (eg, binary approach [present/absent], staining intensity threshold, number of ISH dots)?
– What is the impact of staining variation on the study? This may include staining differences between different laboratories, different autostainers within the same laboratory, staining days, laboratory personnel (autostainer operator), manual or automated staining process, differences between racks and slide positions within the same autostainer, and so on.
– Is the whole-slide image of sufficient quality (eg, slide cleaned prior to scanning, in focus, all relevant tissue captured)?
– Is the manual annotation placed appropriately? Does it capture enough of the tissue (compartment) of interest? Does it remove artefacts appropriately? Are annotations placed in a consistent manner according to a previously defined annotation strategy in order to avoid biased ROI selection?
– Which aspects of the analysis algorithms should be locked in and consistently applied across the entire study? Which parameters can/should be adjusted on a sample-by-sample basis?
– If a scoring paradigm is part of the algorithm assessment: Are staining thresholds for scoring selected appropriately and locked in for the entire project?
– Which QC method should be used? Should the accuracy of image analysis markups be assessed visually in a qualitative manner, automatically by quantitatively comparing the image analysis markups to manual annotations, or should a combination of both approaches be used?
○ Is the analysis approach deployed chosen appropriately in order to answer the scientific question?
○ Is the area, tissue compartment, or structures of interests appropriately identified?
○ For object-based assessments:
▪ Are the objects identified and enumerated appropriately (eg, not over-merged or over-split)?
▪ Are biomarker-positive cells/structures identified appropriately based on staining?
▪ Multiplex staining: Are the colors appropriately separated? This can be especially challenging for chromogenic staining including DAB/brown labeling.
○ If AI-based approaches are used:
▪ Is the amount of training data provided sufficient to provide reliable detection of structures of interest? Does it capture enough of the structure variability?
▪ Are there any underrepresented label classes? Do they need to be enriched within the training data to reliably recognize them in the available dataset?
– How many samples should be reviewed and at which stage of the workflow?
– For every QC step: What is the list of criteria applied, and how stringently is pass/fail defined for each criterion? These performance criteria need to be defined prior to the onset of the review step in order to be consistently applied to all samples/reviews. A screening project may require less stringent pass/fail criteria or less overall samples reviewed than other project types such as a more in-depth analysis project or one that may inform decisions of large investment or patient treatments.
– If a sample fails at specific steps, can action be taken for it to remain part of the project (eg, recut tissue, restain slide, rescan, modify annotations, invest more time into algorithm improvement)? If so, how much effort should be spent on attempts to retain the sample before deciding to remove it from the project entirely?
This is by no means a complete list but should highlight enough aspects to start the conversation within the team around project planning and QC strategy. For each individual project and approach there may be additional unique aspects that should be considered on a fit-for-purpose and team-specific basis.
Algorithm development is usually an iterative process that involves creating test algorithms or models on a subset of samples or tissue areas, which are reviewed by the pathologist to provide feedback to the image analyst to help improve the algorithm performance via algorithm tuning or model training. Once final algorithms and models are locked in, run on the sample set, and the analysis results pass QC as defined in the project plan, data should only be extracted from approved samples that passed final QC.
In clinical human pathology practice, pathology review of each sample is a regulatory requirement. In contrast, review requirements for animal studies in veterinary pathology supporting drug development have not been defined by the regulators. 135
A Brief Note on Bias
Histopathological evaluation remains a subjective assessment and can be significantly impacted by the experience of the individual pathologist. While pathologists are trained to identify and avoid certain types of biases, a completely unbiased assessment is impossible. However, it is important to realize that although the use of digital analysis tools can help overcome some biases, it does not completely remove them either. In fact, image analysis itself can introduce bias via various avenues, including biased sample selection, ROI selection, analysis strategy, or via biases unintentionally programmed into the algorithm. To ensure the most objective image analysis results, it is important to understand what visual and cognitive biases pathologists are susceptible to, and which of them can be reduced by image analysis approaches. 7 Lastly, any quantitative image analysis performed in single (2-dimensional [2D]) tissue sections is biased, as any stereologist will be quick to point out. 20
Stereology
While whole-slide scanning enables digital image analysis of entire tissue sections, this analysis still entails a 2D slide of 3-dimensional (3D) structures. 130 While this is a commonly used analysis approach, it is important to understand that at times it may be biased and inaccurate (Fig. 11). 31,53,87 A methodology that aims to minimize this is stereology, which applies stringent sampling methods (eg, systematic uniform random sampling [SURS]) to survey 3D information and generate absolute number/values of events instead of cell ratio or density estimates. 58,115 In addition, stereology factors in tissue shrinkage, a variable rarely considered in 2D image analysis projects. 55,87 The downside of this approach is that design-based stereology studies are time and resource intensive. They often depend upon a pilot study for proper final study planning, require significant amount of tissue, including potentially sectioning through an entire tissue block, and cannot be run on a sample set retrospectively. 57 However, digital image analysis tools have increased the efficiency of stereology, with some commercial vendors offering dedicated software solutions for this approach. One should consider a design-based stereology approach when an effect may be below the detection range of the 2D approach or routine light microscopy survey, or if an unbiased assessment of effect levels between experimental groups is desired and such effect is expected to be small. 20 The importance of stereology for certain assessment is underscored by the fact that the American Thoracic Society and European Respiratory Society published an official joint statement outlining standards required for lung structure assessment, documenting that image analysis of alveolar number and size could only be accurately measured using a stereology approach. 63
Most important, this type of work requires the involvement of a skilled stereologist (eg, a pathologist with extensive stereology experience) to oversee study design, analysis approach, and data interpretation. An in-depth review of stereology techniques and its statistical approaches is beyond the scope of this article and can be found elsewhere. 17,20,42,55,56,61,84 –86,95,102
Digital Pathology Applications in Veterinary Medicine
Veterinary medicine adopted digital pathology tools much earlier and more broadly than human clinical medicine. 108 This is in part due to differences in regulations governing diagnostics of human compared to animal tissue samples. Subsequently, this early adoption has resulted in a wealth of in-depth experience utilizing these tools in the fields of veterinary education, academic research, diagnostics, and drug development.
Academia
Adoption and availability of digital pathology varies widely between academic institutions. While some veterinary pathology training programs incorporated digital slides review of training sets and whole-slide scanning capabilities into their curriculum over a decade ago, other institutions may still not have in-house access to these resources. When available, whole-slide images are mainly utilized for teaching, collaborations/consulting, and research. However, most academic veterinary pathology institutions have not adopted a fully digital workflow for their routine diagnostic services.
In education, many institutions now teach the histology and histopathology curriculum via access to digitized slides. 15 This has the advantage that all students review the same specimen, they have continuous access via an online repository, and instructors can include image annotations to highlight specific features for teaching. In addition, institutions do not have to maintain costly microscopes for entire class sizes and glass slides sets that require regular replacements of broken specimen. Similarly, pathology residency programs may utilize digitized teaching sets to facilitate all residents reviewing common histomorphological features as well as rare disease presentations. In addition, veterinary pathology residents worldwide heavily utilize the free online resource maintained by The Joint Pathology Center (JPC) that accompanies the so-called Wednesday Slide Conference series, which includes access to annotated slides, descriptions, and additional disease-related information. 124 A similar collection, called PathPresenter, is available with human pathology cases. 98 Just as importantly, utilizing digital pathology as part of training programs allows trainees to gain experience with digital pathology technology, which will be an important skill utilized in their future career paths.
The veterinary field that incorporated digital pathology the earliest is (academic) research pathology. The main advantage of utilizing whole-slide images is that samples can be instantaneously shared with multiple collaborators at a time without the need to ship (and potentially lose) fragile material. 45,83 Experts can be consulted independent of their geographical location. In addition, slides can be shared in an annotated fashion, enabling focused communication and in-depth discussion of areas of interest. 4 Whole-slide imaging can also enable data capture and mining of information that is not always accessible via visual microscopic evaluation. Furthermore, image analysis tools can capture features, disease progress, or biomarker staining on a continuous scale, in contrast to manual scoring paradigms that rely on binary decisions (feature absent/present) or semiquantitative binning (eg, on a scale of 0, 1+, 2+, 3+). 130 The generation of continuous data enables more in-depth statistical data interrogation.
For the individual researcher, reviewing digital scans adds such functionalities as reviewing different stains of the same sample side by side (Fig. 12). Most notably, reviewing and scoring tissue microarrays (TMAs) can be easier digitally, as most whole-slide image viewers allow for simultaneous low magnification overview of the slide, enabling easy tracking of individual core locations for accurate data collection/entry. Lastly, digitized slides enable convenient image capture and generation of high-quality figures for publications and journal covers. In addition, some journals have started to include access to select whole-slide images as part of their online offering. 4
Nevertheless, hurdles of adoption remain in place, with many small institutions not having the financial means to invest in the acquisition and maintenance of slide scanning technology, IT infrastructure, and digital databases. Some academic institutions have established centralized shared resources that often include an imaging core offering slide scanning and hosting services. 4
Diagnostics
In 2014, large veterinary diagnostic organizations (ie, Antech, IDEXX) went fully digital for their anatomic pathology diagnostic services, resulting in histology slides being scanned for primary diagnosis. 108 This digital workflow enables a limited number of histology laboratories with scanning capacity to produce slides and whole-slide images that are distributed internationally to a large number of pathologists and facilitates rapid consultation with experts worldwide. The whole-slide images also allow for easy inclusion of images in reporting, and annotations of lesions and landmarks. Academic institutions that are not using digital pathology for their regular diagnostic services, but that have slide scanning available through their research activities may utilize whole-slide images for diagnostic consultation on a case-by-case basis.
Nonclinical Drug Development
In general, digital pathology is widely used in nonclinical drug development; however, there are stark differences in the extent of use between various stages of the drug-development process. In early discovery research including biomarker discovery, digital pathology and image analysis have been used widely for a significant amount of time in a capacity similar to academic research. 38,48,119 Many of the advantages listed for academic research and remote diagnostics are also leveraged in drug research, such as side-by-side viewing of multiple samples or multiple stains of the same samples, capture of digital images for reporting and sharing, review of whole-slide images by pathologists at any physical location of a company with multiple sites, consulting with external experts, utilizing simple measuring as well as more advanced digital tissue image analysis tools, and building of searchable digital slide databases. When needed, formal pathology working groups can be convened digitally. 83 By and large, these efforts are mostly limited to non-GLP (Good Laboratory Practice) work as specific regulatory guidance remains incomplete. However, more companies and CROs are exploring ways to incorporate digital pathology into their safety study workstreams, 18 for digital primary reads, digital peer review, and for image analysis under GLP guidelines. Utilization of image analysis tools in support of toxicologic pathology in non-GLP fashion is becoming more commonplace. 65,9,106,113 For both drug-development companies and CROs, over time digital whole-slide imaging enables the creation of easily accessible digital slide databases, eliminating time-consuming slide-retrieval from physical storage archives. These databases also allow for creation of content-based image retrieval systems, further expanding upon the utility of databases beyond digital archiving and simple keyword searches. 4 Aside from the lack of clear and specific regulatory guidance regarding the utilization, qualification and validation specifically of digital pathology workflow and tools, a hurdle to adoption in this area is the paucity of digital slide viewers and computer peripherals that are specifically designed around the needs of a toxicologic pathology evaluation of studies. The vast majority of digital pathology viewers allow for slide review amendable to research settings or diagnostic case evaluation. Recently, select vendors have entered the market with promising tools for toxicologic pathologists that allow for similar functionalities as a primary study read based on glass slides and that can maintain or potentially increase pathologists’ efficiency.
Agrochemical and Chemical Development
In contrast to drug development, the agrochemical and chemical industry has utilized digital pathology and image analysis tools in a GLP-compliant fashion for specific studies for over a decade. 108 In general, these studies include assessment of cell proliferation via image analysis of Ki67 or BrdU IHC staining, differential ovarian follicle counting, and central nervous system morphometry as these evaluations are currently required by the Organization for Economic Co-operation and Development (OECD). 89 Most recently, Carboni et al published their experience with establishing a GLP-compliant digital pathology workflow for differential ovarian follicle counting utilizing AI tool. 21
Regulatory Aspect of Digital Pathology in Veterinary Medicine
Several areas of veterinary pathology, such as education, academic research, and diagnostics, are not conducted in a regulatory environment restricting or mandating a certain use of digital pathology systems. Even though the FDA does not have regulatory oversight of digital pathology devices intended for animal use, it can take appropriate regulatory actions if a device is misused or misbranded. Therefore, it is not a requirement for an animal device manufacturer to submit any type of premarket approval application before manufacturing and using a device on animals. 23 However, the FDA encourages veterinarians and animal owners to report adverse events and product defects associated with animal devices. Due to this paucity of regulatory oversight of digital pathology systems used for veterinary diagnostics, veterinary laboratories were able to provide whole-slide image-based, remote pathology diagnosis several years before the first system for diagnosing human samples was FDA approved (2014 vs 2017). 66,108
Toxicopathologic evaluations supporting drug development processes, however, are often conducted within the regulatory framework of GLP. Although there is a lack of clarity on how to exactly apply digital pathology systems in this regulated environment, neither the OECD Principles of GLP nor the FDA regulations specifically preclude the use of digitized histopathology slides in GLP studies for the histopathological assessment of tissue samples. 54,96,122 The use of digitized slides may include the primary read of tissue slides by the study pathologist, as well as both prospective and retrospective histopathology peer review. The definition of slide scans within the toxicological pathology workflow is currently uncertain and a subject of ongoing discussion. Whole-slide scans are necessary to reconstruct the events or conclusion of a GLP study when they were used to generate raw data. Therefore, keeping in accordance with GLP principles, slide scans that were used to create raw data should be archived similar to other study specimens and data. 108 Whole-slide images should be archived in an electronic format that ensures their integrity over time and allows their review at a later point if required for regulatory purpose. 96 While there are no regulatory authority guidelines for the technical specifications of scanners for nonclinical use, it is anticipated that they would be similar to the bench and system testing expected for clinical use. 18 If digital pathology systems are utilized that are not fully validated, it should be documented as an exception in the GLP Compliance Statement for the study.
Digital Pathology Workstation: Ergonomics, IT, and Hardware Considerations
While there are many recommendations regarding how to set up an ergonomic work environment for a general office worker who uses a computer, there is a paucity of guidelines on how to best set up a digital pathology workstation. This can be especially challenging as many pathologists continue to straddle both light microscopic review of glass slides, as well as digital review of whole-slide images. This setup requires increased desk space and specific spatial and ergonomic considerations. In general, improving the ergonomic setup of workstations has been linked to increased productivity. 126 In a Swedish study of pathologists diagnosing human tissue samples, the individuals themselves preferred working at an ergonomically optimized digital workstation over using light microscopy for routine diagnostic work. 117
When available, it is advised to work both with the IT department as well as employee health/ergonomics resources. This will ensure that the right hardware and IT infrastructure is considered for top computational performance, while also evaluating ergonomic aspects that may impact the user’s performance and health. For example, most pathologists likely use the standard computer peripherals (computer mouse and keyboard) for their work; however, it would be advised to test alternatives to the regular mouse for potentially improved ergonomics as well as to explore personal preferences. 4 Some vendors have recognized the need for fit-for-purpose peripherals dedicated to navigating digital slides, for example, devices resembling the micrometric screw of a microscope, and are making those options commercially available.
In addition, it is important to consider the IT environment and capabilities when deciding where to store whole-slide images, not only for archiving but also for optimal viewing. Local storage of files on the pathologist’s workstation computer requires adequate capacity which will likely minimize latency times that can negatively affect the viewing experience but comes with the risk of data loss in cases of hardware failure. Larger medical centers that have transitioned to a fully digital workflow have adjusted by outfitting pathologist offices with larger bandwidth/updated data ports. These efforts to reduce latency can contribute to an increased satisfaction of pathologists in their digital work environments while maintaining centralized, safe storage of whole-slide scans.
When considering optimal workstation set up, one should also take into consideration the type of work performed at the computer/monitor and how it may be impacted by various ambient light conditions, as it has been shown to affect diagnostic performance. 27 For example, fluorescent image work would require the ability to dim the room and control glare on the monitors that may stem from changing sunlight shining through windows.
The optimal selection and number of computer monitors is a topic of ongoing discussion. While some are of the opinion any computer or laptop monitor can be sufficient for hematoxylin-eosin slide evaluation, it is widely recognized that especially the ability of monitors to accurately display colors can have a significant impact on the viewer’s experience and the pathologist’s diagnostic performance. 12,91 While specific monitor recommendations are sparse, it appears that investment into medical-grade monitors may not be required to reach optimal viewing experiences. Differences in color display can come from multiple sources. For one, if the monitor has a significantly reduced color range compared to the scanner camera, color may be adequately captured during scanning, but not adequately displayed on the monitor. In addition, manufacturers and models vary in their quality and factory color-calibration. Lastly, the monitor’s ability to accurately display colors can fade over time and therefore it is generally recommended to replace color-calibrated monitors every 2 to 3 years. Alternatively, independent software and hardware devices are commercially available to color-calibrate monitors. Governing and documenting color-calibration via standard operating procedures (SOPs) should be considered best practice and is a requirement in a regulated environment. In a study evaluating the impact of aging displays in a diagnostic setting, pathologists not only required more time on average to score whole-slide images, but also reported a noticeable decrease in “ease of reading” when using aging monitors. In addition, this study reported a 20% higher agreement in diagnostic scores when evaluating whole-slide images on nonaged displays. 12 While monitors can be calibrated and tested for performance, it is important to understand that the individual’s ability to see different color hues can vary significantly from person to person, and can even change over time with age and presence of certain medical conditions. 7
Other factors to consider in monitor selection include, but are not limited to, display size, number of monitors, resolution, viewing angle, and refresh rate. To learn more about display characteristics in the context of digital pathology, please consult the recent and comprehensive review by Abel et al. 1 Monitor resolution should be matched with the scan resolution to avoid a loss of information at the display. 91 In addition, it has been shown that fewer but larger monitors result in a better viewing experience as users are more likely to turn their head (ergonomically preferred) instead of not moving and relying on peripheral vision to evaluate the entire field of view. 101
Increased time spent sitting at a desk and viewing digital displays can cause strain on the body. The Centers for Disease Control and Prevention (CDC) recommend taking short breaks at least every hour to stretch, walk around, change positions, and have a light snack with water. 46 General ergonomics recommendations exist for proper monitor set up, desk chair selection and configuration, and keyboard and mouse use. To prevent eye strain, it is recommended to follow the 20-20-20 rule, which calls for a 20-second break while looking at an object 20 feet away for every 20 minutes of screen work. 41,111
Pathologist Training Approaches in Adopting Digital Pathology
While is it important that training programs prepare the next generation of graduates for the changes that our profession is experiencing, it is equally important to aid current pathologists in their transition from exclusively evaluating glass slides, to becoming competent and confident in their diagnostic ability using digital pathology tools. A systemic review of 38 peer reviewed human diagnostic validation studies found a mean concordance of whole-slide imaging diagnosis with light microscopy diagnosis of 92.4%. By comparison, the concordance rate for repeat light microscopy review of cases was 93.7%. 52 Despite this and many other examples in the literature documenting overall concordance between glass and digital reads, there still seems to be apprehension for experienced pathologists to move to digital reads. Within any group of pathologists, it is to be expected that there will be a variety of different attitudes toward digital pathology, ranging from enthusiastic early adopters eager to go fully digital, to skeptics lacking confidence in digital diagnostic performance. While both play a key role in the adoption of digital pathology tools, especially the skeptics usually provide vital input (criticism) along the process of training and adoption. The goal of a digital diagnostics training program should be to help pathologists gain awareness of both their individual abilities as well as their limitations regarding digital diagnosis. 132 In addition, these pathologists should be familiar with their hardware and software so that they could recognize and report performance issues. 132 Overall this requires the support of a pathology department or pathology group that has a shared understanding of digital pathology systems, and that is willing to invest into these systems appropriately. Ultimately this combination of appropriate training and departmental support will lead to building fit-for-purpose ways of utilizing digital pathology tools to improve workflows, work environments, and overall pathology deliverables. 132 To aid in the transition to digital reads and build diagnostic confidence, the Leeds Teaching Hospitals NHS Trust developed a training program that by their own accounts was deemed “cautious” and “safety focused,” which centers on having microscopes still readily available for slide review whenever needed, and helping pathologists not only gain competency in using digital tools but also confidence in their own digital diagnostic abilities. 132 In short, this approach is comprised of 3 phases: (1) training phase with one-on-one formalized training in digital pathology tools, (2) validation-training phase incorporating a training set of 20 challenging and informative cases viewed digitally first with immediate check of corresponding glass slides, and (3) validation-live reporting phase where all diagnostic cases are scanned prospectively, diagnoses are made digitally, and reconciled with glass slides prior to sign-out. At the end of the third phase, there is a review of concordance statistics leading to a mutual decision between pathologist and digital pathology trainer to deem the pathologist validated, and potentially identify specific exceptions that may require additional time performing parallel digital/glass reads. 132 The applicability and success of such a 3-phase training program has even been documented for such a specialized diagnostic discipline as neuropathology. 131 These training and transitioning approaches should be considered for adoption in veterinary pathology to aid pathologists in gaining competence and confidence in their digital pathology abilities.
Future Considerations and Conclusion
Since the introduction of microscopic image digitization methods in the early 1990s through the introduction and adoption of whole-slide scanning in the 2000s, the applications of digital pathology have spread throughout all areas of pathology including the most heavily regulated ones such as human clinical diagnostics and non-clinical work performed under GLP standards. 18,97,103,132 Glass slide digitization enabled the development of automated tissue image analysis tools which are now regularly assisting pathologists with visually difficult quantification tasks. 8 Pathology has benefitted from the advances in computer vision in real time, and image analysis approaches are continuously evolving. Even though a strong shift from the traditional rule-based approaches to AI-based approaches is evident with reduced need for manually defining individual features of interest, the general principles of object, cell, and region detection remain the same and their understanding by a pathologist is crucial in providing adequate guidance to the image analysis team. 8 Also, regardless of the image analysis approach, high-quality and consistent annotations are paramount for successful algorithm and model development. If this is achieved, AI can aid in liberating pathologists from tedious counting tasks, increase the consistency of pathology scoring systems, add quantitative dimension to changes previously only assessed semiquantitatively, and support diagnostic decision making by highlighting particular areas of the image for further review. 24,118,120
While advances in AI-based tools in general have been astounding, it is important to also acknowledge the failures. For example, the development of an AI-based tool for screening applicant resumes did not in fact reduce bias in candidate selection, but further perpetuated it. 10 Similarly, an AI-based chat bot started out as a friendly conversation partner that quickly turned offensive. 125 Therefore, while it has been shown that AI-based tissue assessments can match or outperform pathologist’s assessment, 24,107 our profession remains far away from being replaced by computers (if ever). However, judging by the impact of technology on other medical specialties such as radiology, it is important to acknowledge that these technological advances may profoundly impact how pathologists conduct their profession in the future. As is so often said, digital pathology will not replace the pathologist, but it may replace the pathologist who is not adapting to the utility of these novel tools. According to Amara’s law, we tend to overestimate the effect of technology in the short run and underestimate the effect in the long run. 105 In that vein, pathologists’ job descriptions are likely not going to change much in the immediate future, but it is reasonable to anticipate that they will substantially evolve over the coming decades. The demand for trained pathologists will continue, but the list of required skills will likely be different. The ACVP has recognized this shift within the veterinary pathology profession in its 2018 strategic plan, which resulted in the formation of multiple task forces (eg, future practice task force). Today, the ACVP’s Pathology Informatics Committee is actively working on the following 3 main charges: (1) proposal of a resident/trainee curriculum in Pathology Informatics; (2) assistance with development of a Virtual Training Network where trainees may have access to scientific experts and cutting-edge technologies that are not readily available at all veterinary pathology training program sites; and (3) facilitation of opportunities for continuing education for practicing pathologists. 109 While these ACVP-related activities originated in 2018, the current COVID-19 pandemic reality has accelerated the interest in and adoption of digital pathology across the various pathology-related disciplines. In general, this pandemic-related switch to digital and remote formats is further illustrated by the fact that the ACVP cancelled the in-person Phase II certifying exam in 2020 and decided to hold the 2021 examination in a digital format which will utilize only electronic multiple-choice questions, not whole-slide images. 33 It is a goal of the ACVP to utilize whole-slide scan for the Phase II certifying exam in the future. 33 Under current circumstances, the transition from analog to digital across all areas of pathology is progressing at a rapid pace; therefore, it is important that appropriate educational resources are made available both to aid current pathologists in this transition, as well as to prepare future generations of pathologists for a changing work environment. Periodic, updated review articles such as this one aim to aid in making foundational knowledge available to all veterinary pathologist and trainees.
Footnotes
Acknowledgements
The authors would like to express their sincere gratitude to the following colleagues for their assistance in figure generation: Dr Kristin Lewis Wilson, Dr Jason DeVoss, Dr Deepali Sawant, Dr Jun Zhang, Yingwu Li, Zhengyu Gao, Brian Belmontes, Tabita Popovici, Efrain Pacheco, Erna María Jónsdóttir, and Cynthia Swanson.
Declaration of Conflicting Interests
The author(s) declared no potential conflicts of interest with respect to the research, authorship, and/or publication of this article.
Funding
The author(s) received no financial support for the research, authorship, and/or publication of this article.