
Abstract
Digital pathology, the practice of pathology using digitized images of pathologic specimens, has been transformed in recent years by the development of whole-slide imaging systems, which allow for the evaluation and interpretation of digital images of entire histologic sections. Applications of whole-slide imaging include rapid transmission of pathologic data for consultations and collaborations, standardization and distribution of pathologic materials for education, tissue specimen archiving, and image analysis of histologic specimens. Histologic image analysis allows for the acquisition of objective measurements of histomorphologic, histochemical, and immunohistochemical properties of tissue sections, increasing both the quantity and quality of data obtained from histologic assessments. Currently, numerous histologic image analysis software solutions are commercially available. Choosing the appropriate solution is dependent on considerations of the investigative question, computer programming and image analysis expertise, and cost. However, all studies using histologic image analysis require careful consideration of preanalytical variables, such as tissue collection, fixation, and processing, and experimental design, including sample selection, controls, reference standards, and the variables being measured. The fields of digital pathology and histologic image analysis are continuing to evolve, and their potential impact on pathology is still growing. These methodologies will increasingly transform the practice of pathology, allowing it to mature toward a quantitative science. However, this maturation requires pathologists to be at the forefront of the process, ensuring their appropriate application and the validity of their results. Therefore, histologic image analysis and the field of pathology should co-evolve, creating a symbiotic relationship that results in high-quality reproducible, objective data.
Histomorphologic evaluations have served as a core skill for pathologists for more than 125 years. 6 However, throughout this history, pathologists have expanded their repertoire to include new techniques and technologies to facilitate the acquisition of increasing amounts of information from histologic specimens. These technologies include the development of histochemical stains, immunohistochemistry, in situ hybridization, laser microdissection, and, in recent years, digital pathology and image analysis (see additional articles in this issue of Veterinary Pathology). Digital pathology is the capture, storage, and interpretation of pathologic specimens using images in digital file formats. 16,42 Early versions of digital pathology included transmission of static images captured with microscope-mounted cameras between remote sites. Digital pathology subsequently developed into robotic telepathology, in which a pathologist at a distant site controlled a robotic stage and viewed specimens in real time. 41 More recently, digital pathology has evolved to include whole-slide imaging, in which digital slide scanners are used to create digital images of entire histologic sections. 1,41 Following digitization, the image can be viewed through a computer interface that mimics the tools of a light microscope. 1,38 Several readily identifiable benefits of digital pathology include its ability to facilitate transmission of pathologic images and data worldwide; its ability to provide safe, secure, permanent, and rapidly retrievable archival solutions for histopathologic specimens; and its ability to facilitate qualitative and quantitative image analysis on pathologic specimens. 1,13,29,30,38 As evidenced by the number of technologies and techniques that can be included under the umbrella of digital pathology, digital imaging has had a long and evolving relationship with pathology. However, the field of digital pathology is continuing to evolve, and its role in the practice of pathology is still being defined. In this review article, we will discuss whole-slide imaging technologies, their potential applications in pathology, and the use of digital image analysis technologies in pathology, including the potential strengths, limitations, and considerations of these technologies.
Whole-Slide Imaging Technology
Digital Slide Scanning
Whole-slide digital imaging is the process by which digital images of entire histologic slides are created by high-resolution scanning of the slide. 1,8,26 Digital imaging vendors may use slightly different technologies to produce these digital images, but most vendors use a tiling system, in which multiple individual high-resolution images are acquired as tiles, or a line-scanning system that creates linear scans of tissue areas. Both methods require the tiles and line scans to be stitched together and smoothened to create a single digital image of the histologic section. 1,42 For digital pathology, the concepts of magnification and resolution need to be considered in the context of how images are acquired and displayed. 8,41 The concept of magnification as commonly considered in light microscopy (20× objective lens × 10× eyepiece lens = 200× magnification) is not applicable to whole-slide imaging because the images used are viewed on variably sized screens that can further amplify or shrink the original magnification. In whole-slide imaging, resolution is defined by the objective used to scan the slide and the imaging sensor and is measured in micrometers per pixel. 8 Most digital slide scanners are able to scan slides with 20× or 40× objectives. To ease the transition from conventional light microscopy to digital microscopy, the terminologies 20× and 40× magnifications have been maintained to refer to the objectives at which the slides were scanned. For most scanners, 20× magnification images have a resolution of approximately 0.5 μm per pixel, and 40× images have an approximate resolution of 0.25 μm per pixel. 8,41 The 20× objective slide scans are suitable for most histopathologic evaluations and remain the standard magnification for most scanned images. However, this may be a limiting factor for duplicating the process of making primary diagnoses, since conventional light microscopes invariably have 40× and often 100× objectives, and many pathologists feel uncomfortable not having ready access to these objectives. Migrating to 40× objectives will quadruple both scan time and file size of the final image, increasing the slide processing time and storage costs. 8 An additional consideration with regard to the reproducibility for primary diagnosis is the numerical aperture of the scanner’s objective, as this can significantly influence image resolution. However, as these instruments evolve and storage continues to become more affordable, it is a reasonable assumption that 40× will become the scanning standard at a numerical aperture that is equivalent of a high-end analog microscope. Some manufacturers also produce digital slide scanners equipped with oil immersion lenses and fluorescent scanning capabilities. These capabilities increase scan times even more as a 100× objective often requires Z-stacking (taking multiple tiles/line scan of the same area at different fields of focus), and most fluorescent scanners require separate scans in channels that correspond to each fluorophore on the tissue. In addition, depending on the marker of interest and specimen (cultured cells vs tissues), fluorescent microscopy may require higher resolution imaging of 40×, 60×, or 100× magnification, which further increases scan times. Digital slide scanners vary in their scanning capacity, but many manufacturers produce scanners that can scan 100 to 200 slides in a single batch. To facilitate automation, slide scanners have incorporated tissue identification abilities, allowing the scanner to localize the tissue on the slide, and auto-focusing methods. 8,42 Second-generation scanners are incorporating independent dual-sensor scanning that allows for quicker and more accurate auto-focusing than first-generation instruments. 24 However, digital slide scanners are limited by the quality of the tissue and slide preparation, including tissue artifacts, uneven tissue sections, and staining or immunolabeling quality. Therefore, high-quality digital imaging first and foremost requires high-quality specimen preparation, and quality control procedures should be in place to ensure the highest quality scanned images possible. 10 Even when the staining is flawless, getting consistent, high-quality scans requires attention to quality control. Slides should be clean and dust free before scanning and should be reviewed to ensure the images are in focus.
Digital Slide Storage and Viewing
Digital image file sizes vary depending on the scanning objective and tissue size but commonly range from approximately 200 MB to 1 GB. 42 Digital image files from all platforms require some degree of image compression. Currently, there is no standard file format for digital pathology. This lack of standardization has the potential to create difficulties when moving between digital imaging platforms. The JPEG2000 format is being used by some vendors, but there is an interest by many in the field of digital pathology to migrate to Digital Imaging and Communications in Medicine (DICOM) formats, which are currently used for digital radiography. 17,38,42
Once scanned, image files of the digital slides and the associated metadata, including the specimen ID, specimen type, study or patient information, and relevant histochemical or immunohistochemical information, must be stored in a searchable and retrievable database or image management system. For whole-slide images, this is most efficiently and accurately accomplished when a barcode is affixed to the slide that has a unique identifier allowing the metadata from the slide to be permanently associated with the image produced.
Digital pathology slides are viewed through computer interfaces designed to emulate a light microscope (Fig. 1). To overcome the large file size of digital slides, slide viewers function by only accessing and displaying the tissue area being requested at a given time, then eliminating prior queries as the image is moved to new areas within the tissue section. 13,38 Basic slide viewer functions include controls that allow the user to change magnifications, to pan across a tissue section, and to acquire photomicrographs of raw and/or annotated images, which can be incorporated in reports and publications. However, some interfaces also contain more advanced features, including micrometer bars to measure objects within tissue sections, magnifying windows to view specific tissue features at higher magnifications, annotations tools, whole-tissue thumbnails that allow the operator to both view their current location in the context of the entire tissue section and to immediately move to a different area within the tissue, and the functionality to view multiple slides simultaneously in the same field of view on the monitor. 1,38 This side-by-side viewing allows for direct comparisons between 2 or more specimens or evaluations of differently stained/labeled sections from the same tissue block simultaneously.
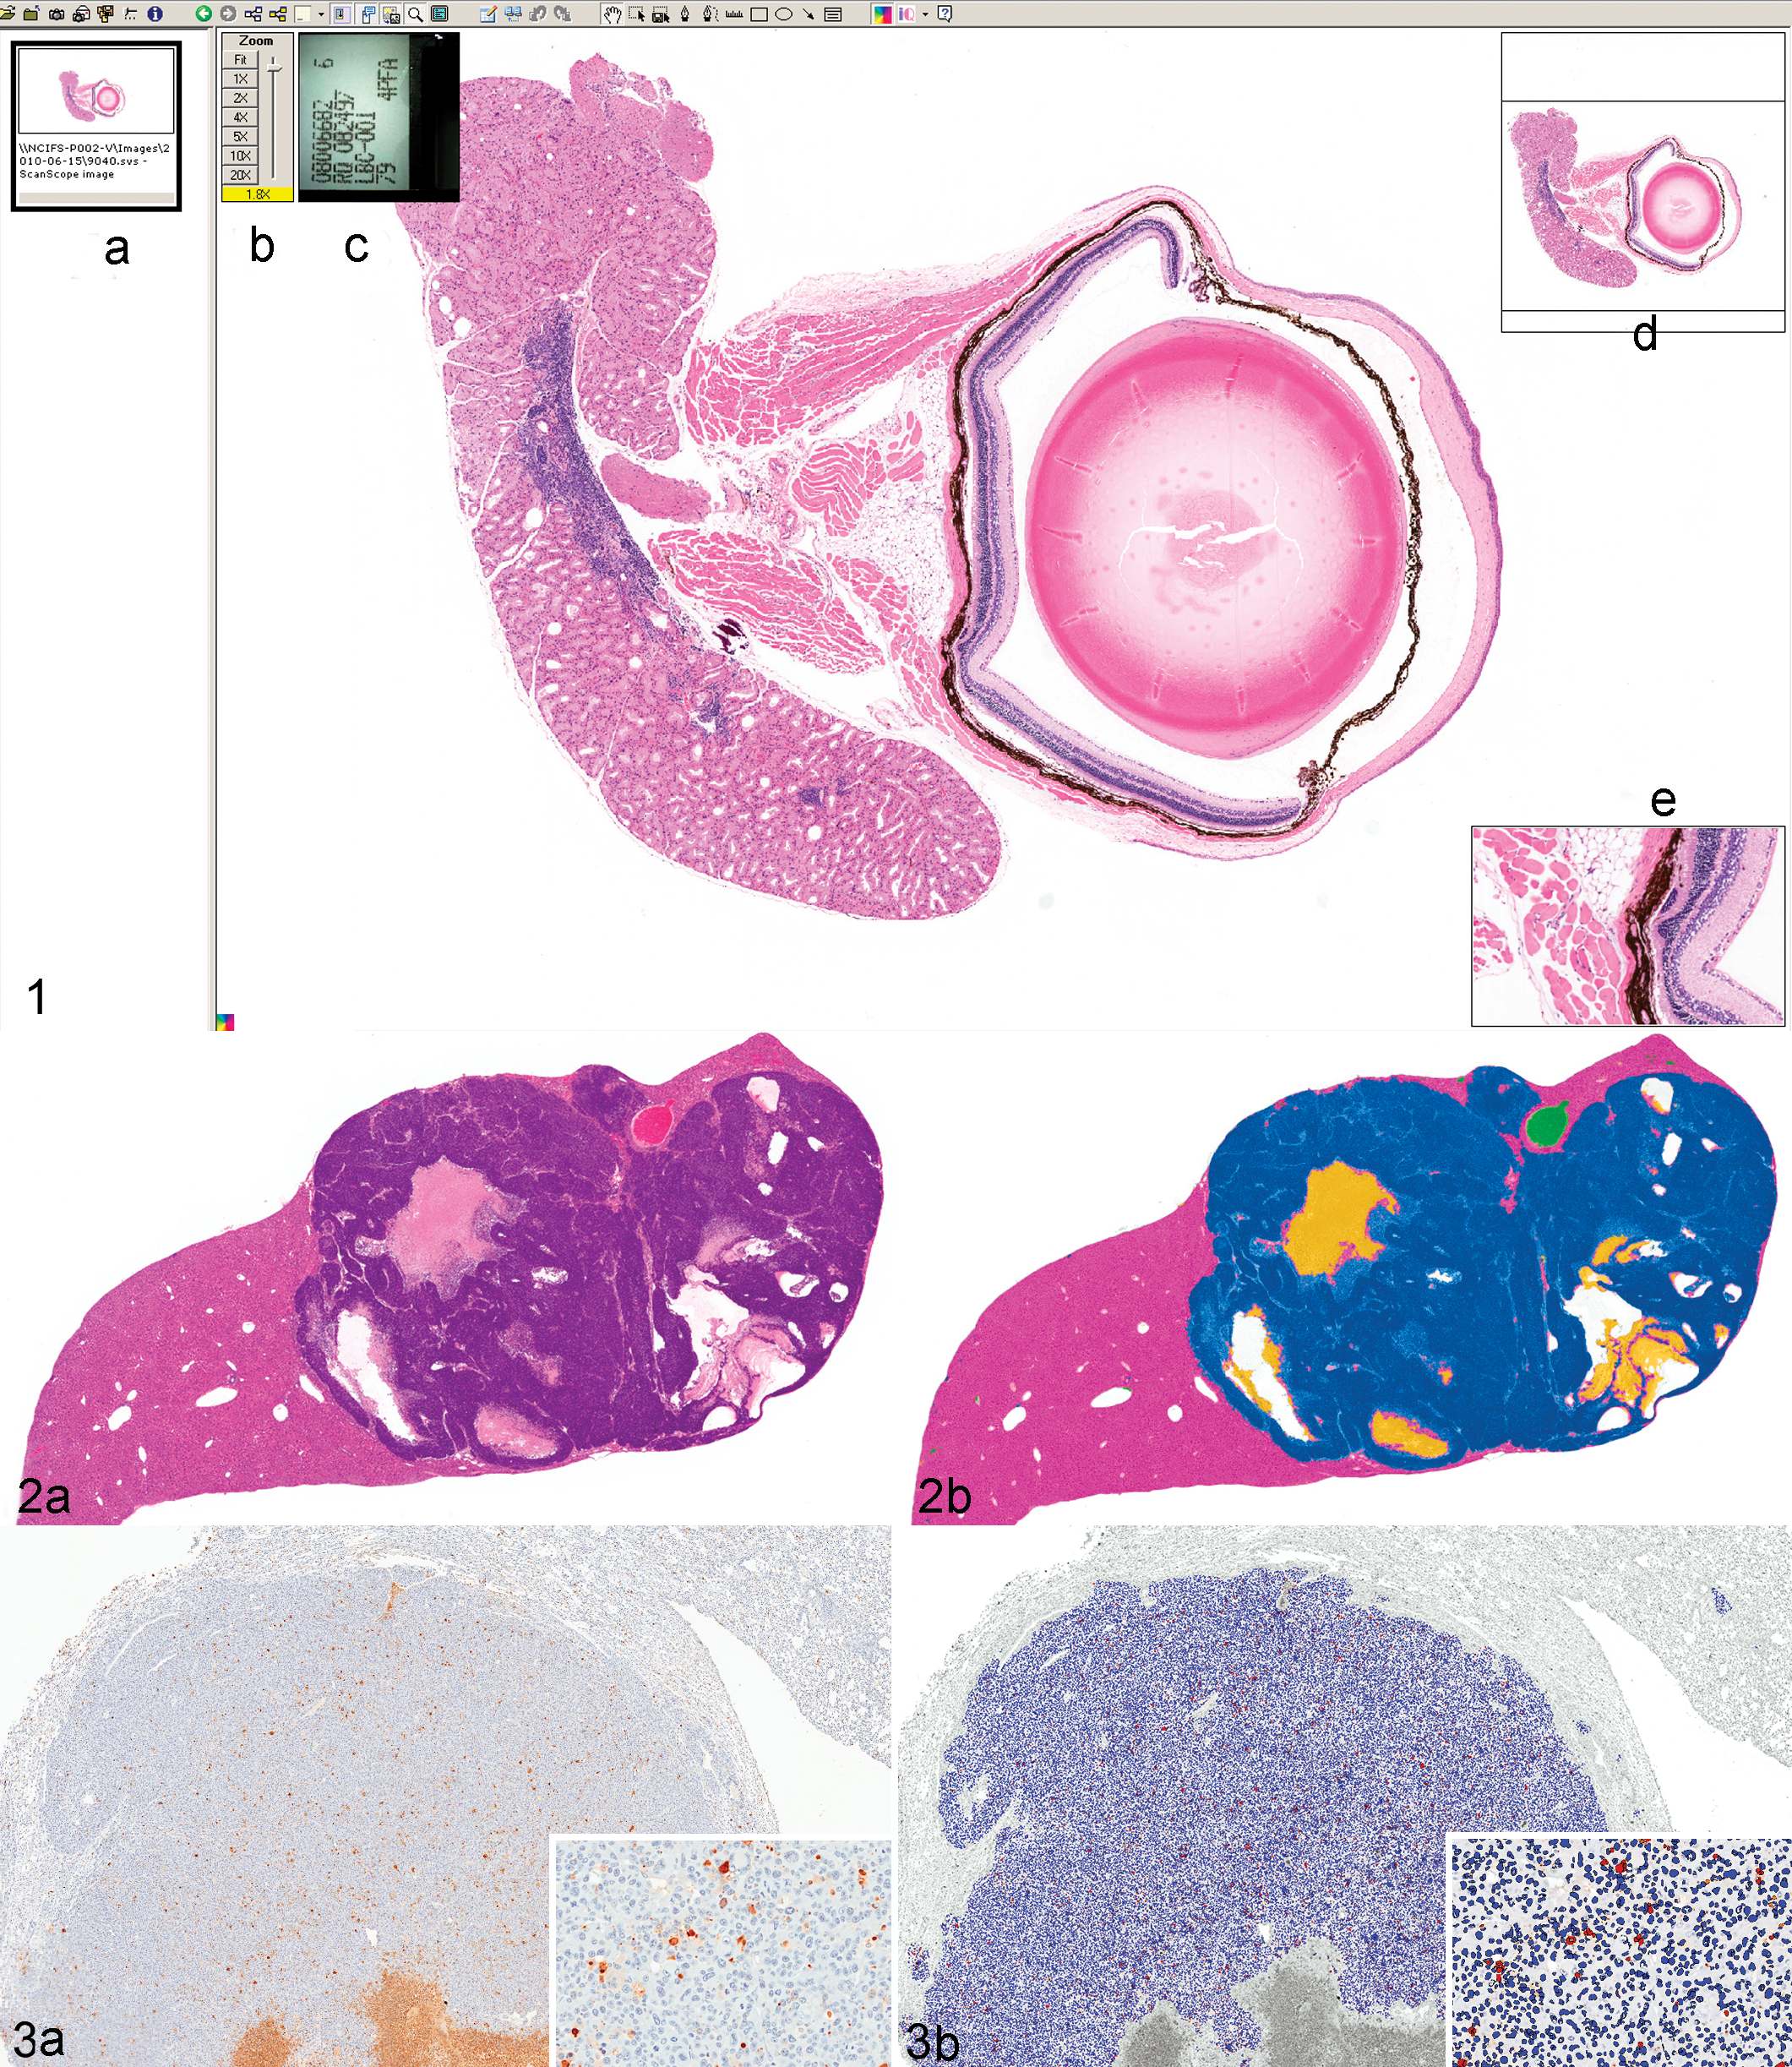
Screenshot of Aperio’s ImageScope digital slide viewer (Aperio Technologies, Vista, CA). The digital slide viewer simulates the microscope interface with additional functionality, including (A) a filmstrip showing thumbnail images of slides currently available for viewing, (B) a zoom slider to adjust magnification, (C) a thumbnail of the slide label, (D) a thumbnail of the slide that demonstrates the current location within the slide and allows for quick navigation throughout the slide, and (E) a magnifier window to look at subregions of the slide at higher magnification.
Cost Considerations Prior to Implementation
Costs, both upfront and ongoing, and information technology (IT) infrastructure are important considerations in the implementation of digital pathology. Currently, upfront costs for many digital slide scanners are upwards of $100,000 and annual investments in service and maintenance contracts and technician support time are required. 8 Significant additional costs may be separately incurred for image analysis software licenses and, depending on needs and throughput, potentially a dedicated full-time image analyst. In addition, digital pathology systems require significant IT investment to facilitate image storage, acquisition, and analysis. 1,29,42 The complexity of the IT infrastructure will depend on the goals of the system (eg, image archiving, teleconferencing, multisite integration, or image analysis), the slide volume, the user volume, and geographical distribution of the users. 29 As digital pathology becomes a more routine component of the pathologist’s daily workflow, there will also likely be increased interest in its incorporation with laboratory information systems. 27 Excellent communication between the imaging groups, IT groups, end users, and vendors is essential to ensure optimal performance. These conversations should begin prior to implementation of digital pathology to ensure configurations are established to meet the anticipated needs.
Whole-Slide Imaging Applications
Routine Histopathology
Digital slide scanners are considered type III medical devices by the US Food and Drug Administration and therefore require validation prior to approval for use in primary diagnosis. 8 There has been discussion in the pathology community regarding what type of study would be required to validate digital pathology, and some have suggested that digital pathology should be validated for specific indications rather than being validated more broadly. One challenge of digital pathology validation studies is the need for a defined gold standard by which to measure digital pathology. The most basic question in validating digital pathology is still being resolved—can a pathologist make an identical diagnosis with identical confidence using digital pathology as he or she can with light microscopy? Therefore, measurements of intraobserver variability, using a washout interval between digital and light microscopic evaluations, will likely be the best approach for validating digital pathology. 8 Several studies that have been conducted suggest that digital pathology is comparable to light microscopy in terms of diagnostic accuracy and confidence; 8,12,14 however, this diagnostic accuracy may be more variable depending on the tissue and disease process being evaluated. 16 Aside from its validation for use in primary human diagnosis, digital pathology still has other hurdles that must be crossed before it becomes part of routine pathology, including costs, workflow incorporation, user interface, and pathologist’s comfort. 8 Although current digital slide viewers provide easy-to-use interfaces, there are still lag times in loading images, changing magnifications, and panning across slides, as well as need for improved tissue focusing across entire sections. 10,12 Before digital pathology becomes the standard for viewing histologic sections, it must be refined as an economically viable option that can be incorporated and managed within a pathology laboratory’s work flow, and the viewing interface must be as good as or better than a light microscope interface for a pathologist.
Another major hurdle of the routine implementation of digital pathology is within the industry itself, as there has been no attempt at standardization. Slide scanner manufacturers have not adopted a common format for image viewing, and comparisons between scanners are rare. When comparisons are performed, as in the 2nd International Scanning Contest (http://scanner-contest.charite.de/en/), there is considerable variability between the focus, hue, saturation, intensity, and even magnification when the same slide is used to produce whole-slide images on different scanners. This suggests that diagnostic accuracy defined on one scanner may not be translatable to another and that image analysis algorithms (discussed below) may need to be modified substantially to work on images created by another scanner.
Telepathology and Data Transmission
One of the earliest uses of digital pathology was the rapid transmission of pathologic data between pathologists and other pathologists, clinicians, or collaborators. Initially, this involved the transmission of static images between pathologists, but in recent years, digital pathology has been enhanced through the use of whole-slide imaging. 41 Assuming interinstitutional firewall and access issues can be overcome, whole-slide imaging allows for the transmission of pathologic data to pathologists/collaborators around the world within a few minutes after a slide is created. Following staining and coverslipping, a slide can be digitally scanned and placed on a server or the “cloud” where, using appropriate logins and passwords, the slide image can be viewed around the world through an Internet-based interface for further evaluation and interpretation (PathXchange, www.pathxchange.org [Ventana Medical Systems]; SlidePath, us-demo.slidepath.com [Leica Biosystems, Buffalo Grove, IL]). This technology allows for rapid second opinions and consultations on challenging diagnostic cases, facilitates peer-review processes, and facilitates discussions between investigators, study directors, and pathologists. 29,41
Using telepathology, challenging cases can be sent to specialists with particular diagnostic expertise in a matter of minutes, allowing for critical clinical determinations to be made in a matter of hours, rather than days. The transition from static to whole-slide imaging in digital pathology allows the consulting pathologist to evaluate the entire tissue section at multiple magnifications and eliminates the reliance on the submitter to select the correct regions of interest for evaluation. 26 However, in some environments, such as in developing countries, static image digital pathology may be preferred due to its minimal resource requirements. 35 For investigational studies conducted between collaborators across multi-institutions/organizations, entire study sets can be made available to colleagues around the world without the risk of slides being lost or damaged during shipment. In addition, all investigators can have access to entire slide sets simultaneously, allowing all interested parties to review the materials prior to or during meetings, and to make individual evaluations and interpretations of the pathology data, facilitating communications and data interpretation. 26 Using either built-in conferencing functions in image databases or through other computer conferencing tools such as GoToMeeting (www.gotomeeting.com; Citrix Systems, Santa Clara, CA), Adobe Connect (Adobe Systems, Inc, San Jose, CA), or WebEx (www.webex.com; Cisco Systems, Inc, San Jose, CA), images can be viewed by multiple parties simultaneously, similar to a multiheaded microscope. The concerted review of pathology data through these conferencing tools allows all parties to ask questions and evaluate the slides together, which can help avoid miscommunications and misinterpretations of data. Therefore, these interactions can not only expedite diagnostic cases and investigative projects but also facilitate communications within research teams. 29
Education
The use of pathologic specimens in medical education has numerous challenges. A collection of teaching quality specimens can take an entire career span to develop, and the availability of certain disease processes or etiologies may be dependent on the pathologist’s specialization, geographical location, and/or caseload. Development of teaching sets requires the availability of high-quality specimens, free from artifacts, and there must be enough tissue available to produce representative sections for an entire class. Maintaining teaching collections is equally challenging due to the risk of slides breaking, disappearing, or fading. Digital pathology has several distinct advantages that can be used to address many of these challenges. Digital image files of histologic tissue sections can be created, placed on web servers, and made available to the entire student population both on and off campus. 13 This requires only a single tissue section for scanning, eliminating concerns of adequate tissue availability for serial sections that contain representative changes. Since all students evaluate the same digital histologic images, there is also elimination of slide-to-slide variability, thus ensuring that all students have the same opportunity and responsibility to evaluate the same lesion. 13 Incorporation of digital slides in medical training also creates unique learning opportunities. Evaluation of histologic specimens on screens increases interactions between students and facilitates classroom discussions. Histologic features can be pointed out to entire classes simultaneously, and annotations can be used to draw attention to key lesions within tissue sections. In addition, decision-making and slide-tracking tools can be used to evaluate how trainees are making their interpretations and how that affects their final diagnosis. 13
An additional advantage of digital teaching slide sets is that they allow for easier distribution and sharing of histopathologic specimens. Since digital image files can be copied, digital image files of pathologic processes that might be regionally or institutionally unique can be easily shared, allowing for broader and more homogeneous resource availability among training programs. 11 Online pathology databases allow for global access to enormous pathology archives. 13 In addition, similar to its ability to facilitate research and diagnostic interactions, digital pathology can also be used to facilitate distant learning for students, pathology trainees, and working pathologists through virtual slide conferences and lectures, allowing access to expertise that might not otherwise be available. 11,13,35
Pathology Archiving
Manually filing glass slides requires physical space to store the slides with the risk that they can be misfiled, broken, or fade over time. 1 A digital archive may provide a long-term storage solution, allowing for only tissue blocks to be physically stored. In addition, the digital archive can include associated metadata, allowing for retrieval of both the image file and metadata together and for the retrieval of images using metadata-based searches. Primary considerations for a digital archive include the need for appropriate IT support of an expandable digital storage space and the need for periodic backup of the digital archive, preferably at a distant site should any disasters occur. With the increasing availability of servers that can be expanded by multiple terabytes at a time and the advent of cloud computing, allowing for remote storage of data, these considerations should not significantly impede the creation of a digital slide archive. However, archiving images can become expensive. Assuming a standard scanned image is 500 MB, 2000 images can be stored in a terabyte-sized file. The annual cost of this size of storage, with appropriate backup and security, ranges from $3000 to $10,000. In addition, the benefits of digital storage of whole-slide images will not be realized until it is accepted that these images are the diagnostic equivalent to conventional glass slides and that a diagnosis or study can be reproduced with the same accuracy as glass slides on reexamination. If equivalency cannot be validated, then digital storage and manual filing could become redundant and actually increase resources spent on slide archiving.
Image Analysis
Introduction and Basic Concepts of Image Analysis
The goal of image analysis in histopathology is to increase the amount and quality of data that are derived from a pathologic specimen, preferably by providing quantitative measurements of histologic features. 23 Pathology has traditionally focused on descriptive, subjective assessments of pathologic specimens, but the role of image analysis in pathology can be traced back to van Leuwenhoek. 23 Similar to the evolution of digital pathology, image analysis has its roots in evaluations of images of representative regions of a histologic section, but with the advent of whole-slide imaging and pattern recognition image analysis software, it is now possible to perform automated evaluations of entire tissue sections that result in objective, analytical data readouts. 30 The advent of digital pathology and whole-slide imaging offers pathologists the opportunity to broaden their analytical capabilities and to transition pathology from a subjective science based on descriptive assessments toward an increasingly objective, and eventually quantitative, science based on measured end points. 10
Currently, automated image analysis approaches are being increasingly used in diagnostic and investigative pathology. Within the past decade, several image analysis-based diagnostic tests have received 510(K) clearance from the US Food and Drug Administration 20 (https://digitalpathologyassociation.org/_data/files/DPA_Regulatory-FDA-510k_list.pdf) for breast cancer. However, there is a dearth of cleared assays for other diseases, which is likely due to the combined challenges of identifying clinically relevant biomarkers, especially when evaluated by immunohistochemistry, and the lack of preanalytical standardization. 10 In investigative settings, image analysis is being increasingly applied to a number of applications, including assessment of renal injury, 18 biobank quality assurance, 39 automated scoring of animal models, 19 tissue microarray construction, 2 and assessments of protein expression in tissues 5 and cell-based microarrays. 36 In the coming years, the application of whole-slide imaging and image analysis in pathology is likely to continue to increase, making this a critical area of development for pathologists engaged in all fields of pathology.
The basic principle of automated histopathologic image analysis is the use of a series of mathematical algorithms that process images, enabling the segmentation of picture elements into regions of interest based on their color, texture, and/or context. Color is defined by the amount of red, green, and blue present in a pixel usually on an 8-bit scale of 0 to 255. For brightfield microscopy, which is absorptive, 255 represents the brightest or maximal color (white) intensity and 0 represents the absence of color (black); 10 however, for fluorescence-based digital pathology, which is absorbance coupled with emission, single color images representing individual fluorophores are converted to a gray scale, and the intensity is then measured on a similar scale, although the dynamic range of the scale may be larger depending on the imaging system being used.
Image Analysis Software
Although many image analysis software apply similar image segmentation and image-processing concepts to their algorithms, a key differentiating factor of commercial software packages is the amount of supervision required, or allowed, by the user. 10 Unsupervised software packages, such as Aperio’s Image Analysis Toolbox (Aperio Technologies), inForm (PerkinElmer, Waltham, MA), and Tissue Studio (Definiens, Carlsbad, CA), are out-of-the-box software that require minimal user training and rely on algorithms built into the software to perform specific functions. These packages allow users to adjust certain parameters, such as defining nuclear size or roundness, but lack some higher level spatial analyses. The advantage of unsupervised methods is that pathologists can readily perform quantitative tasks without having extensive training in image analysis. These systems can work well for laboratories that perform repetitive routine analyses such as quantifying the proportion of immunolabeled nuclei within a tissue section or the area of a given tissue feature. The disadvantage of these systems is that they lack flexibility to perform higher order analyses, including assessments of spatial relationships that might be desired for more complex investigative studies.
In contrast, supervised software, such as Definiens Developer (Definiens), Visiopharm (Hoersholm, Denmark), or Matlab (MathWorks, Natick, MA), allows users to program specific algorithms to develop unique analyses. The use of supervised image analysis software requires upfront training in image analysis, image segmentation, and more user input as new analysis methods are developed. However, the software also allows users to perform analyses that are more complex, and analysis limitations are mostly constrained by the users’ creativity. Supervised systems are likely to work best in investigative laboratories that have personnel dedicated to image analysis and are engaged in varied investigative studies. Supervised software allows for “workarounds” for artifacts and may be more forgiving in controlling for staining variation. It also allows for relational analysis. For example, using supervised software, it is possible to define the number/area of macrophages that surround different-sized amyloid plaques in tissue from patients with Alzheimer's disease. It is also possible to quantify the plaque’s size and even the percentage of the plaque’s circumference that is surrounded by these macrophages. Thus, one can determine the relation of one structure to another with considerable sophistication. This is important because this is the first step toward true pattern analysis.
Image analysis software is an expensive investment; therefore, it is important to consider carefully what analysis package will be best for a given laboratory. Unsupervised or supervised methods might work best for different laboratories depending on the workload, the variation in the tissues and the diseases studied, and the amount of time that can be dedicated to image analysis. Software packages vary in their functionality with regard to their ability to work on whole-slide vs static images, brightfield vs fluorescent images, and different file formats. 33 In addition, analysis tools available vary among different software packages. 25,33 Most unsupervised software have the ability to perform a set of basic tasks, including quantification of immunolabeled cells based on nuclear or cytoplasmic labeling, and quantification of stained or immunolabeled areas. Other algorithms that may be available include microvessel density algorithms, which identify and quantify blood vessels based on immunolabeling (factor VIII–related antigen or CD31) and shape; co-localization algorithms, which quantify areas containing 2 immunolabels or stains; quantification of cytoplasmic immunolabeling; and pattern recognition image analysis (Figs. 2, 3). 25,30,33 In addition, some systems are uniquely suited for evaluating multiplexed assays and multispectral imaging, such as the Nuance and Vectra systems from PerkinElmer. For a detailed discussion of multispectral imaging, please refer to the manuscript by Mansfield, also in this issue. 22 Pattern recognition image analysis uses “teachable” software that requires the operator to provide examples of specific tissue types or histologic features that it will encounter in a set of histologic sections. 4,30 An iterative learning process is subsequently applied to identify colorimetric, spatial, or textural properties that define and differentiate each tissue type or feature. 4 This allows the software to develop an algorithm that can segment tissue components within histologic sections (Fig. 2). The algorithm can then be used to quantify areas of tissue components within histologic sections or to define regions of interest for further downstream analyses. 5,30,39,40 For example, a pattern recognition image analysis algorithm can be created to identify tumor tissue within a tissue section and can then be used in tandem with a nuclear algorithm to quantify nuclear immunolabeling of tumor cells (Fig. 3). This allows for measurements to be automatically performed specifically on areas of tumor within tissue sections, eliminating stroma or normal adjacent tissue from the analysis area. 5 There is a difference between pattern recognition as defined above and pattern analysis—the recognition of structural components and their relation to the regions recognized by pattern recognition. For example, pattern recognition software can define regions of hepatocellular lipidosis and with different thresholds can separate degrees of lipidosis. However, pattern analysis describes where (periportal or centrilobular) the change is more severe and how interconnected the change is (eg, does it extend across lobules?). An example of pattern analysis is shown in Fig. 4. In this analysis, the software not only identifies vacuoles within the neuroparenchyma but is also able to quantify vacuoles based on their spatial relationship to choline acetyltransferase–positive neurons (Fig. 4). The use of software to perform pattern analysis is the next step in image analysis. The field of pattern analysis is still developing, but applications such as assessment of tumor heterogeneity are beginning to emerge. 31
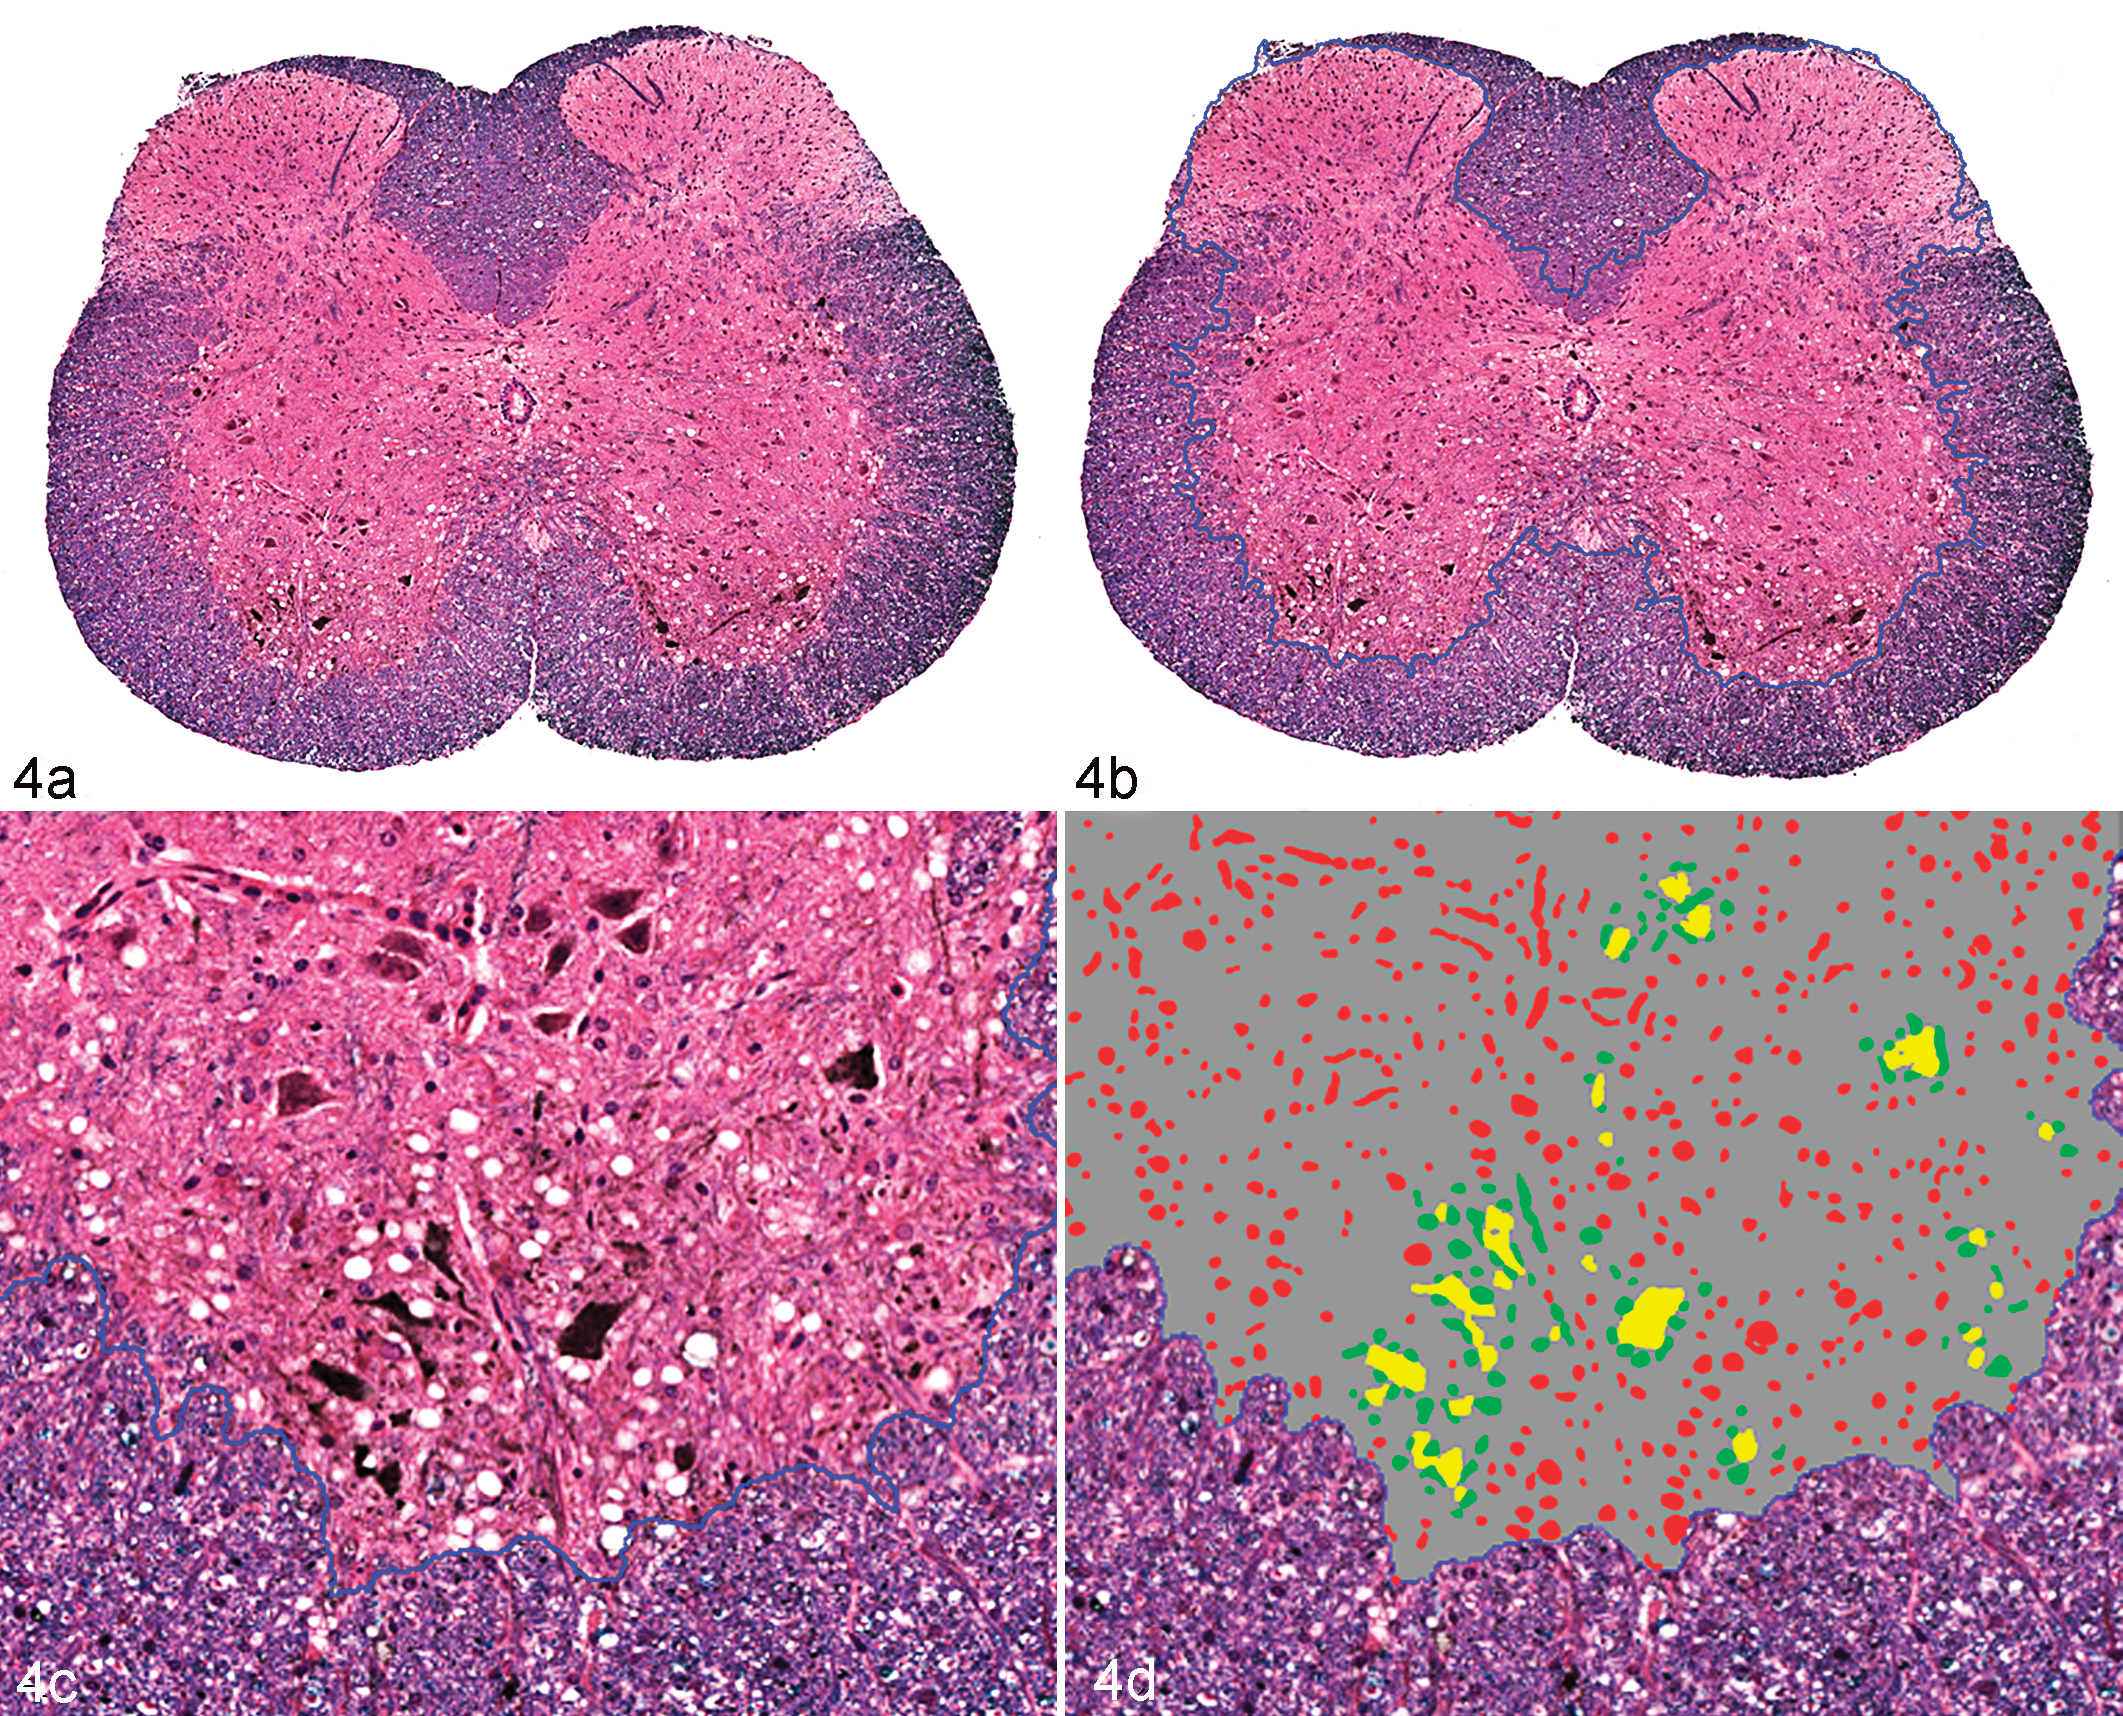
Brain; mouse. Demonstration of the results of image analysis algorithms to define motor neurons in the ventral horn of an Sod1G93A transgenic mouse, a model for familial amyotrophic lateral sclerosis. Affected mice have vacuolation associated with neurons and neuritic processes (A, C). The goals of the algorithms were to (1) separate the gray from the white matter; (2) identify motor neurons immunohistochemically labeled with anti–choline acetyltransferase (ChAT); and (3) distinguish vacuoles by their proximity to ChAT-positive structures. (A) Step 1 separated the gray from the white matter. This was done by using luxol fast blue as a counterstain, which produced differential staining that allowed for computer separation. (B, C) The border between the gray and white matter generated from the analysis is defined by the dotted blue line. (C, D) Step 2 established a gradient of staining that separated strong ChAT labeling neurons and neurites (yellow staining) from less intensely labeled structures (not identified). There is an element of “educated subjectivity” in establishing this threshold; however, with consistent staining, the results will be reproducible from section to section and study to study. (D) Step 3 identified vacuoles, and these vacuoles were separated based on proximity to yellow-stained structures. Those vacuoles ≤50 μm are defined as green; more distant vacuoles are defined in red. Further analysis could also separate vacuoles based on size (algorithm written by Diana Fahrer, Biogen Idec [Cambridge, MA], using Visiopharm software). Anti–ChAT with diaminobenzidine chromogen, luxol fast blue counterstain.
Final considerations for choosing an image analysis software package must include a realistic assessment of the cost to benefit ratio, the ease of the user interface, and functionality. Many of the currently available software packages have been recently reviewed elsewhere, and comparing and contrasting image analysis packages is beyond the scope of this review. 25,33 However, it must be stated that each image analysis software package has its unique advantages and disadvantages. No single package is perfect for every laboratory. In contrast, for large laboratories focused on image analysis, multiple software packages are likely to complement each other, each being used for specific tasks or to answer specific questions.
Stereology
It should be noted that while whole-slide imaging allows entire tissues sections to be analyzed, the analysis is still only performed on a 2-dimensional, planar section of 3-di-mensional tissues. Stereology uses random sampling from series of 2-dimensional images to quantify features in 3-dimensional spaces. 15 Stereology can allow for evaluations of entire tissues instead of single “representative” sections of a given tissue and is delineated as established guidelines for publishing in some fields. 15 Few vendors offer specific software solutions for stereology, and there remains a debate among stereologists and image analysts about the value of each other’s methods. 32 Stereologists often decry the inaccuracy of image analysis and the potential for misinterpretation when an assumption is made that evaluating a single section of tissue is representative of the organ as whole. Image analysts claim that stereology is too “hands on” and takes too much work, and interpretation of most diseases is made from a single histologic section, so why is that not representative of the organ as a whole? At the same time, it cannot be denied that stereology is gaining acceptance by regulatory agencies and by a number of scientific disciplines, especially those in respiratory physiology and neurology. 3,7,15,34 As part of new drug applications, it may be necessary to demonstrate that morphology-based analytical data obtained in preclinical studies are reproducible and representative of the organ as a whole, aspects that may be best demonstrated using stereologic approaches. 7,21 What image analysts need to realize is that most of the problems they want to solve can be “stereologically valid” with a little more effort. The key concept of stereology is “systematic, uniform, random sampling,” which means that a stereological evaluation requires that every cell in the tissue has the same probability of being sampled and quantified. 15 Stereology invariably requires a pilot project to determine the number of blocks that have to be made, the number of sections in the blocks that have to be evaluated, and the area in the sections that needs to be quantified. If an image analysis approach is desired, this study should demonstrate if a single section from an organ is sufficient to represent the organ as a whole. Note that determining the area of the feature to be quantified in a section is not at odds with stereology and can be performed rapidly on most image analysis software. Where stereology becomes cumbersome is when the number or length of structures needs to be determined, as current software can improve efficiency but do not negate manual quantification. For some studies, validation of an image analysis approach on single tissue sections may be accomplished by performing comparisons with 3-dimensional imaging modalities, such as magnetic resonance imaging or computed tomography. Still, the benefit of the additional data acquired through stereology must be weighed with the additional costs in tissue processing and time.
Implementing Quantitative Image Analysis
Standardization of Preanalytical Variables
As with any biologic assay, the quality of data obtained from image analysis methods is directly dependent on the numerous preanalytical variables that preceded the analysis, such as tissue collection, handling, fixation, processing/embedding, sectioning, staining/labeling, and digital image acquisition. 10,30 As has been recently reviewed, the pathology discipline lacks standardization in nearly all aspects of tissue procurement, processing, and staining. 10 This lack of standardization can produce significant variability between tissue sections. Even tissue dehydration and paraffin embedding, which are often overlooked as potentially influential variables in histopathology, can introduce significant variability that can influence measurements of histopathologic parameters, and day-to-day variations in hematoxylin and eosin stains can lead to variations in pattern recognition image analysis software’s ability to segment tissue sections. Historically, pathologists have been trained to read through artifacts 10 and variability in tissue staining and labeling. This training in versatility has served pathologists well for descriptive tissue assessments. However, reproducible, automated assessments of tissue sections rely on standardization of all preanalytical variables, allowing for the elimination of confounding variables that might influence the ability to identify real biologic differences between treatment groups. Some preanalytical variables such as tissue procurement, fixation type, fixation time, and antigen retrieval will likely depend on the tissue being evaluated, the target antigen/molecular end point, and other study specific variables, such as other concurrent methodologies or assessments that need to be made using the study samples. However, to perform measurements within a study, each of these preanalytical variables must be clearly defined to make accurate comparisons between study groups. Furthermore, if the goal of our research is to compare data between studies and to apply biomarker discovery to clinical practice, standardization needs to go beyond single studies and instead should be spread across the profession. 10 In the authors’ experience, lack of preplanning is not uncommon and can have a major impact on data analysis and comparisons between studies. For example, imagine a series of experiments with the goal of measuring the area of metastatic tumor per unit lung area following different interventions. If the investigators evaluate metastases in single lung lobes in one experiment and dorsal planar sections of the entire right and left lungs in a second experiment, the measurements will not be comparable due to the differences in sampling. It is important to track preanalytical variables, such as warm and cold ischemia times, fixation times, and processing conditions in the metadata associated with the specimens, since these data will serve as a key measure to identify problems or variability should they occur. 28
Experimental Design and Quality Control
In addition to standardization of preanalytical variables, the variables being measured need to be clearly defined a priori. As a rule, most image analysis data are presented as a ratio of the measured value (the numerator; eg, tumor area, number of immune-positive cells) compared with the total tissue or cellular population (the denominator; eg, total tissue area, mucosal length, total cell population). This provides context to the measurements being assessed and is essential for comparisons between study groups. Accuracy is as dependent on the measurement of the denominator as it is on the numerator (which is usually the easiest of the ratio to define when identified by a chromogen or a fluorophore). For example, as discussed above, it is equally important to standardize the measurement of metastatic foci in the lung as it is to standardize the measurement of the total lung area being evaluated. In order for comparisons between individuals and groups, the measurements of the numerator and denominator should be defined and standardized a priori. In unsupervised programs, it is also important to remember that image analysis algorithms analyze tissue sections based on the user-defined segmentation features and do not understand cell populations in the context of the tissue as a whole or in relation to other features of the tissue. For instance, the nuclear algorithm for an unsupervised program does not understand the difference between pyknotic tumor cells in an area of necrosis that are nonspecifically binding to the secondary antibody and immunolabeled lymphocytic infiltrates. Therefore, it is important that analysis area and algorithm parameters are properly and specifically defined to ensure measurements are being made on the metrics of interest. Ideally, this should be done by a separate algorithm. If the user cannot rely on the software to define the parameters that are most appropriate for measurements and references, and selection is to be performed manually, it is important for the user to define criteria for selection/rejection to avoid bias and to increase reproducibility. A pathologist’s oversight is essential for image analysis studies since his or her expertise is required for both designing the study, determining what biological end points are most relevant, and determining if the software is measuring these end points with satisfactory accuracy. 40 To ensure this accuracy, a subset of image markups should be routinely evaluated at the end of each study as a quality assurance measure. The most significant limitations to quantitative image analyses are the lack of appropriate, standardized specimen preparation and the lack of thoughtful experimental design and oversight. 10 If there is sample variability within the study, representative samples encompassing the variability within the study should be evaluated to ensure the image segmentation is consistent throughout the study. In addition, it is important to perform the quality control at a resolution that allows for the evaluation of individual object segmentation. For example, although evaluations of the segmentation accuracy of large tissue areas can be performed at low magnification, higher magnification is needed to evaluate nuclear segmentation and ensure there is adequate identification of individual nuclei. Continual quality control in all studies is essential to ensure validity of the results and to prevent both type I and type II errors from occurring due to inaccurate image segmentation.
Added Value of Image Analysis
Histopathologic evaluations of tissue sections have traditionally provided subjective, interpretive, and descriptive evaluations of disease processes. These subjective interpretations provide invaluable insight into the pathogenesis of the disease process, especially when performed by experienced pathologists. However, many experimental and interventional studies do not have black and white differences between treatment groups. Instead, the disease process occurs as a spectrum in severity and requires the measurement of objective, preferably quantitative or semi-quantitative, end points to identify biologic differences between study groups. For example, to compare the influence of a specific gene on the development of an autoimmune disease, one could compare the amount of inflammation or fibrosis in wild-type vs knockout mice under given experimental conditions. It is likely that both wild-type and knockout animals will develop qualitatively similar lesions in terms of the type of tissue and cellular reaction. Therefore, quantitative end points, such as the number/area of infiltrating leukocytes, percent of tissue affected, or percent of replacement fibrosis, could aid in identifying biologic differences between wild-type and knockout animals. Subjective scoring systems rating tissue reactions such as inflammation, demyelination, hyperplasia, atrophy, or fibrosis as absent (0), minimal (+1), mild (+2), moderate (+3), or severe (+4) have been incorporated into histologic evaluations to provide qualitative or at best semi-quantitative metrics. 30 However, differences between study groups might not be identified because the data are ordinal rather than continuous. Subjective scoring systems are also vulnerable to interobserver variability if multiple pathologists are involved in reading a study, as well as intraobserver variability, due to day-to-day variability in histologic interpretations by a single pathologist and observer fatigue. The value of automated image analysis is that most metrics can be measured on continuous rather than ordinal scales, potentially revealing differences hidden by ordinal values, and they can then be interrogated with statistical analyses. It should be mentioned, though, that some image analysis algorithms, especially those assessing chromogen intensity on unsupervised platforms, report data as ordinal values, similar to a visual assessment; however, the value of these algorithms is still derived from the reproducibility and minimization of observer variability when analyses are automated. Since image analysis algorithms require parameters to be set a priori and all specimens are evaluated in an identical manner by the algorithm, inter- and intraobserver variability is eliminated. 39 This is not to say that automated image analysis is purely objective. Operator inputs to determine what metrics will be measured, how those metrics will be measured, and how the metrics will be interpreted are still required. For example, an algorithm quantifying nuclear immunolabeling requires the user to provide input parameters for the size and shape of the nuclei of interest and what intensity of immunolabeling is considered “real.” 37 However, assuming consistent control of preanalytical variables, such as sample collection, processing, and staining or immunolabeling, this subjectivity is defined a priori, and although it does influence how the entire study is interpreted, it does not result in variability in interpretation from one sample to the next. Therefore, although there is intrinsic subjectivity in the creation of algorithms, automated image analysis approaches eliminate the intra- and interobserver variability within a study. This can be essential if studies are conducted over extended periods or involve multiple pathologists interpreting subsets of specimens. 39 An additional advantage of automated image analyses is that they are amenable to multiple quality control measures. Quality control assessment of image analysis algorithms can be performed by randomly sampling a subset of the areas quantified, potentially using stereologic approaches, and determining the percentage of the results that are false positive or false negative. 21,32 In addition, intraslide (when a consecutive section is on the same slide) and interslide variability (when multiple sections from the same tissue are on different slides) can be determined. Defining these parameters against known controls can ensure the data are standardized and reproducible.
Final Considerations
A common consideration regarding the implementation of automated image analysis is the impact it has on time management and laboratory workflow. On a superficial level, it seems logical that automated image analyses should decrease a pathologist’s workload because it eliminates time spent doing subjective scorings or complex manual annotations of histologic images. However, in reality, the time gained from automated image analysis depends on the question being queried, the complexity of the model system and analysis, the quality of the materials being evaluated, and the volume of samples being analyzed. In addition, running an image analysis algorithm on a study has not advanced to a “set it and forget it” process. Algorithms tend to perform best on specimens that were used for training, and there tends to be more variability in the performance when series of unknown specimens are evaluated. Therefore, numerical results need to be correlated with the images after the analysis. Although outliers are often obvious with graphing, even with the most basic of algorithms, a subset of values within the “expected range” should always be reviewed. After such a review, it is not uncommon to find the need to rewrite algorithms in the course of the study despite having been “trained” on a large number (>50) of whole-slide images. The reason for this discrepancy is algorithms do not typically have the same intrinsic contextual understanding of an experienced pathologist; 40 instead, the contextual understanding of these algorithms will be restricted to what the user has defined mathematically. For instance, an experienced pathologist is likely to be able to differentiate nonspecific labeling of an alveolar macrophage from a tumor cell based on its morphology and location in the tissue; however, the features need to be mathematically defined in the algorithm to have equivalent differentiation of these cell populations. Unsupervised analysis packages allow limited room for the user to provide contextual inputs; therefore, there are some questions that these image analysis algorithms cannot yet answer due to the complexity of the tissue or biologic system, or the quality of the specimens. Time can easily be wasted trying to optimize a system that is not designed to answer a given question. To gain the most benefit out of image analysis tools, it is best to first identify if and how these tools can be used to answer a specific investigative question. If more complex analyses are needed, supervised packages that allow for increased user input would be necessary to provide contextual definitions to the tissues. For most pathologists, image analysis is a tool used to define morphologic features of tumors (apoptosis, mitosis, necrosis, etc) or relatively obvious structures such as amyloid plaques or vacuolation in hepatocytes. What is recognized as the “artistry” of pathology consists of sophisticated recognition of patterns. The application of true pattern recognition to histologic sections is just in its infancy; however, it would be naive to assume that, with the emergence of artificial intelligence and highly accurate facial pattern recognition software, sophisticated pattern analysis will not be applied to histologic sections. Surprisingly, what may be the most difficult challenge for image analysis software is to define what is normal. Pathologists who are trained to recognize abnormal typically define a tissue as normal by the absence of abnormal. Although the authors may be underestimating the power of image analysis, it is difficult to imagine that these programs will be able to identify novel lesions without pathologists’ support. In addition, review of false-positive or false-negative assessments will have to be done by a pathologist.
Conclusions
Automated image analysis offers pathology an opportunity to transition from a descriptive to a quantitative science. This transition will serve as a major step in the growth and development of pathology as a scientific discipline. As biomedical research increasingly shifts toward quantitative biology, histopathologic image analysis will secure pathology as a critical lynchpin for translational research. However, image analysis should not be viewed as a replacement for traditional histopathology evaluations; instead, these approaches are complementary, providing different relevant data sets to create a complete picture of the pathologic process and experimental model. Although image analysis tools provide objective measures for research end points, subjective, interpretive assessments provide the context of these measurements. As a discipline, there should be no concerns of automated image analysis replacing the pathologist, unless we do not learn to adapt and lead the utilization of these tools as they are developed. The role of the pathologist will change, with digitization and image analysis becoming a standard method for defining morphologic changes. However, the pathologist will continue to play the most important role in ensuring that analyses are performed correctly and providing the context for all downstream data.
Footnotes
Acknowledgements
We acknowledge and thank Lalage Wakefield and Chi-Ping Day, Laboratory of Cancer Biology and Genetics, National Cancer Institute, for providing tissues samples demonstrated in Figs. 2 and 3, respectively; Mark Simpson and the Molecular Pathology Unit, Laboratory of Cancer Biology and Genetics, National Cancer Institute, for thoughtful discussions and insight; Diana Fahrer, Biogen Idec, who developed the image analysis algorithm demonstrated in Fig. 4; and Jeffrey Eastham-Anderson, Genentech, for critical review of the manuscript.
Declaration of Conflicting Interests
The author(s) declared no potential conflicts of interest with respect to the research, authorship, and/or publication of this article.
Funding
The author(s) received no financial support for the research, authorship, and/or publication of this article.