
Abstract
Many compounds affect the cellularity of hematolymphoid organs including bone marrow. Toxicologic pathologists are tasked with their evaluation as part of safety studies. An artificial intelligence (AI) tool could provide diagnostic support for the pathologist. We looked at the ability of a deep-learning AI model to evaluate whole slide images of macaque sternebrae to identify and enumerate bone marrow hematopoietic cells. The AI model was trained and able to differentiate the hematopoietic cells from the other sternebrae tissues. We compared the model to severity scores in a study with decreased hematopoietic cellularity. The mean cells/mm2 from the model was lower for each increase in severity score. The AI model was trained by 1 pathologist, providing proof of concept that AI model generation can be fast and agile, without the need of a cross disciplinary team and significant effort. We see great potential for the role of AI-based bone marrow screening.
Keywords
Introduction
Many xenobiotics, including those intended for immunotherapy and chemotherapy, can affect the cellularity of hematolymphoid organs including bone marrow. 1 In addition, physiologic stress can also cause these changes. 2 Hematopoietic and pluripotent stems cells in the bone marrow are critical for the regenerative capacity of peripheral blood and lymphoid organs and thus histologic evaluation of bone marrow is a routine component of safety studies. In the case of cynomolgus monkey studies, the bone of the sternum are most reliably used to assess the bone marrow. Anatomic pathologists evaluate hematoxylin and eosin-stained sections of sternum and as part of their evaluation provide a subjective assessment of the cellularity in dosed animals compared to control animals. Quantification or cell counting of the bone marrow is not typically performed by anatomic pathologists in tissue section. The increasing use of slide scanning has provided the opportunity for the development of computer-based tools, including artificial intelligence (AI), that can provide diagnostic support to toxicologic pathologists.
Artificial intelligence algorithms and models can be developed to provide a more objective quantification of bone marrow cellularity. Artificial intelligence models have been developed to recognize and enumerate neurons. 3 An automated image analysis tool has also been reported to quantify hematopoietic cells in the bone marrow of rats. 4 We developed an AI model that can enumerate hematopoietic cells in bone marrow from sternebrae of cynomolgus macaques from which a cell density value can be calculated and serve as an objective measure of bone marrow cellularity in tissue sections.
Methods
All the slides in this study were stained and scanned in the same laboratory as described below. Glass slides containing sternum from 6 cynomolgus macaques (3 males and 3 females), which were used as control animals, were identified from archived material for training the AI model. An additional 20 (10 males and 10 females) sections of sternum were selected from an independent study in which decreased cellularity was diagnosed by the study pathologist. Ten of these slides were also used to validate the AI model. The sternum slides had been prepared from formalin fixed and decalcified tissue samples, embedded in paraffin and stained with hematoxylin and eosin using standard procedures. The glass slides were scanned by a Leica Aperio AT2 (Leica Biosystems) whole slide scanner at ×20 (0.5 µm/pixel) equivalent magnification using a ×20/0.75NA Plan Apo objective and uploaded to the Aiforia software platform. No slide-specific adjustments of image quality, for example, color, brightness, contrast, denoising, were done at any stage of AI model training, validation, or analysis.
The AI model was trained with 6 whole slide images (WSI) of cynomolgus sternebrae (3 males and 3 females) by a board-certified veterinary pathologist using the Aiforia software platform, version 4.7 (Aiforia Inc). The AI model was trained in a layered approach consisting of 4 hierarchical layers, not to be confused with the neural network concept of layers. 5 The layer structure used is reminiscent of the layers of an onion such that the resulting AI model analyzes the first layer, then the second and so forth. Each layer can only analyze what has been trained to be identified in the preceding layer. A layer identifies a compartment, such as total bone, then restricts identification of the subsequent layer, such as bone marrow, to that compartment. This method seems to reduce problems with false-positive noise. In this study, the first layer was trained to recognize the combined bone and marrow space but excluded cartilage, periosteal tissue any attached skeletal muscle. The second layer segmented the marrow compartment from the cortical and trabecular bone. The third layer further segmented the marrow compartment into hematopoietic cells and excluded adipocytes and blood vessels. The fourth layer performed an object identification task, whereas the 3 preceding layers performed semantic segmentation (ie, identified areas falling into 2 or more classes), a total of 690 hematopoietic cells were annotated and used for training the last layer (Figure 1). The other layers had a combined 198 distinct annotations of varying size. The resulting data included the total area of the sternebrae in square millimeters provided from the first layer and a total number of hematopoietic cells in the entire section provided from the object identification in the fourth layer. A cell density (cells/mm2) measurement was calculated from these data.
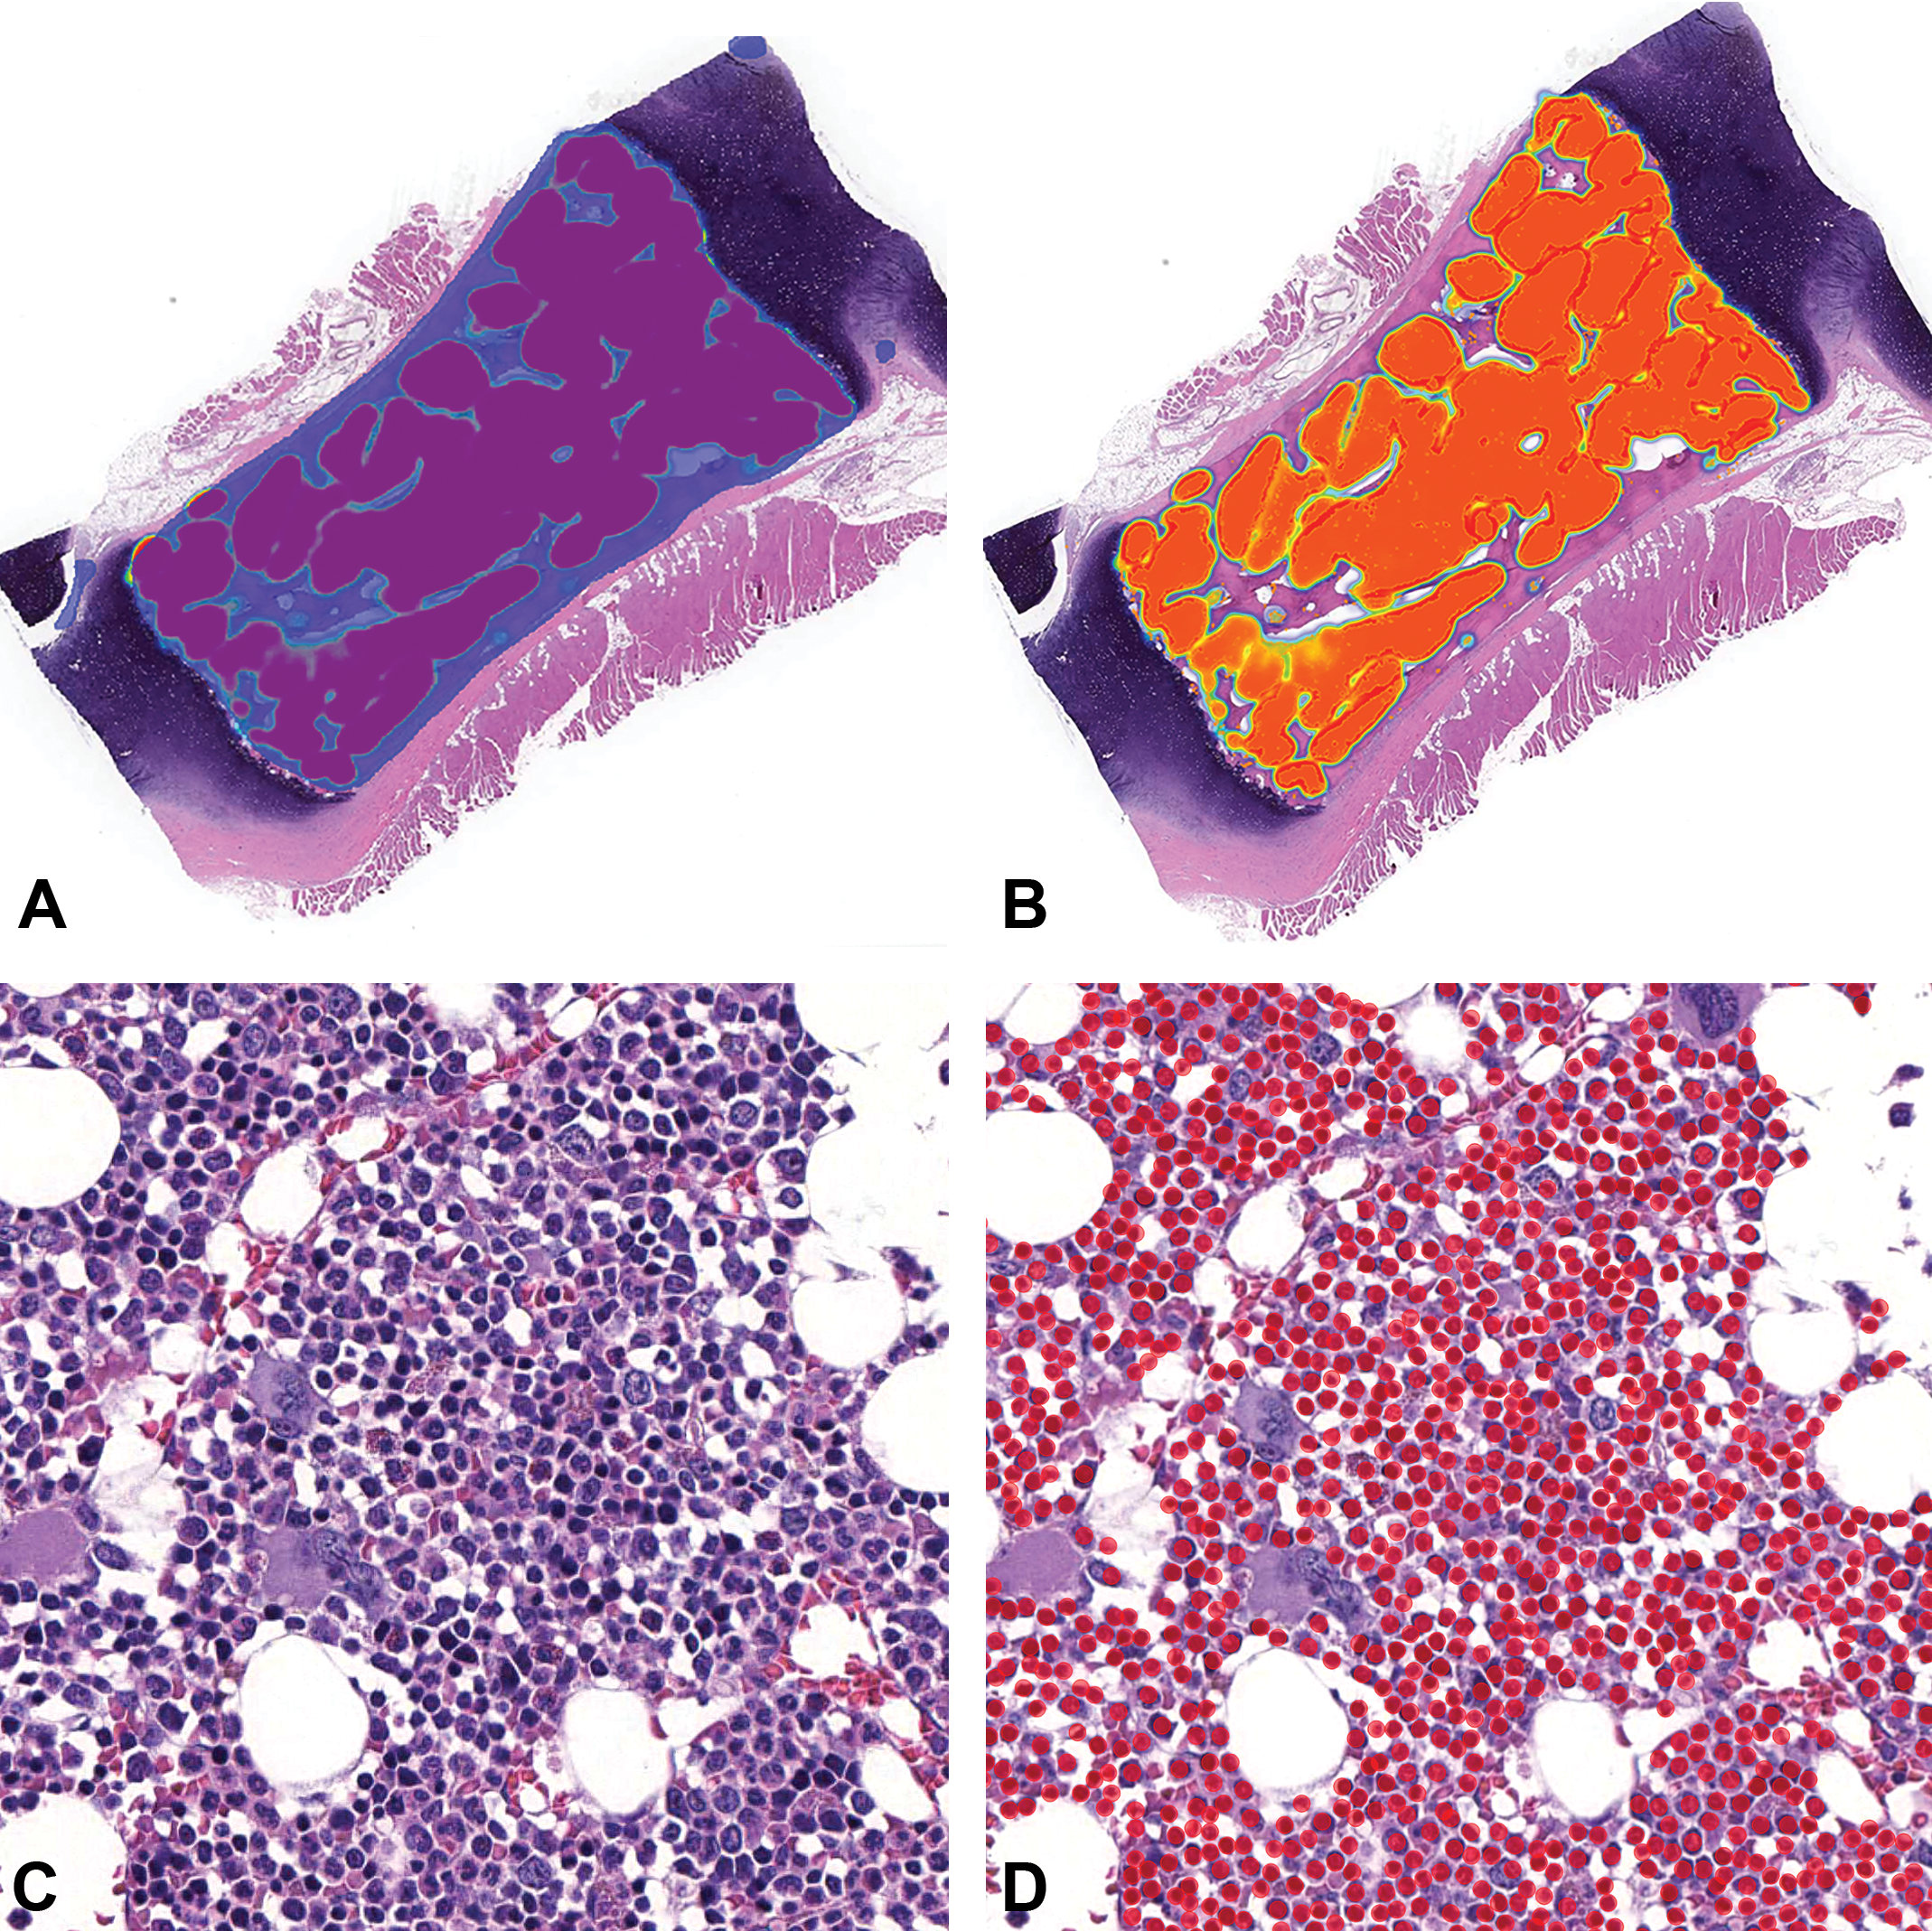
Sternebra, cynomolgus macaque (whole slide image, hematoxylin and eosin): A, First layer (blue) segments the combined bone and marrow space from the cartilage and muscle. B, Layer 2 (orange) segments the marrow compartment containing hematopoietic cells from bone, adipocytes, and blood vessels (magnification ×0.6). C, Hematopoietic cells in the marrow space (magnification ×36) D. Annotations created by the AI model on hematopoietic cells following image analysis (solid red circles; magnification ×36). AI indicates artificial intelligence.
In order to validate results of the AI cell identification and count, a comparison was made between the AI model and a team of veterinary pathologists. Validation regions, known in the Aiforia platform as regions of interest (ROI), were defined by the same individual pathologist that performed the AI training. Ten WSIs of sternebrae were selected from an independent study set for validation. The WSIs were selected to represent the range of appearances and cellularity in the marrow. Three ROIs per WSI (30 total) were designated for validation. Selected ROIs were areas of bone marrow drawn by the pathologist using an annotation tool in the Aiforia software. The regions were estimated to contain about 100 hematopoietic cells and represented a spectrum of cellularity levels. Five board-certified veterinary pathologists (4 anatomic and 1 clinical), that were not involved in the AI model training, annotated the cells in the ROIs. The Aiforia software provided an automatic count of the annotations (ie, objects annotated as hematopoietic cells) in the ROIs. The validation data was compared both as a correlation, comparing of total counts per ROI selected, as well as “object level validation.” The object level validation method used here on the Aiforia platform evaluates any pair of objects between 2 observers (human or AI) and scores an agreement between observers when any object pair show a greater than 30% “intersect-over-union” overlap (also known as the Jaccard Index). The object level validation data are reported here as an F1 score, that is, the harmonic mean of precision (also known as positive predictive value) and recall (also known as sensitivity). The equation for F1 is F1 = 2 × ((precision × recall)/(precision + recall)). The results of the validation cell counts per ROI were evaluated using a Bland–Altman plot comparing the differences in each pathologist’s count to the AI model and the other pathologists (object level validation). We evaluated the agreement between the AI model and the other pathologists with the Pearson correlation. Validation of the superseding layers was visually gauged to be correct and were not independently validated.
We then examined a practical application of the model. Twenty WSIs of sternebrae from a discovery study in which decreased hematopoietic cellularity of the bone marrow was diagnosed by the study’s anatomic pathologist were selected to evaluate the AI model. The study was composed of 9 groups with 1 control group and 8 treatment groups. Eight groups including the control group contained 1 male and 1 female macaque and 1 treatment group contained 2 animals from each gender. The WSIs were analyzed by the AI model yielding the total area and total hematopoietic cell count. The cell density (cells/mm2) was calculated and compared to the pathologist’s subjective severity scores which were based on a 6-point grading scheme (0-5) for decreased cellularity: no lesion, minimal, mild, moderate, marked, and severe.
All primate experiments in the studies were reviewed and approved by the Institutional Animal Care and Use Committees of Charles River Laboratories, Inc and conformed to the Guide for the Use and Care of Laboratory Animals (National Research Council of the National Academies, Institute for Laboratory Animal Research, 2011). All study animals were within 2 to 4 years of age, purpose-bred for laboratory use and of Chinese origin. Control animals were clinically healthy and serologically negative for the following viral infections: SIV, Cercopithecine herpesvirus 1 (B virus), simian retrovirus (SRV), and simian T-cell leukemia virus. Tuberculin tests, other bacteriology screening tests for Shigella and Salmonella, and parasitological screening were negative. The animals were prophylactically treated for parasites and vaccinated for measles virus.
Results
Artificial Intelligence Model Hematopoeitic Cell Enumeration and Validation
The trained AI model was able to recognize sternebrae, provide an area measurement that excluded the associated cartilage, and enumerate the total number of hematopoietic cells in the marrow compartment (Figure 1). The AI model’s cell identification in the validation areas were comparable to the cell identification of veterinary pathologists (Figure 2). Both the AI and the pathologists had a low number of the false positives and negatives. In the Bland Altman plot, the mean counts of the AI and each pathologist were compared for each validation area (Figure 3). The greater the number of cells in the validation area, the greater the difference in count between the AI model and pathologists, but also between the individual pathologists. This result was likely because of the increased difficultly in counting large numbers of cells for pathologists. The AI model and one of the pathologists counted generally higher than the mean in the larger validation areas. There were 2 pathologists that generally counted lower than the mean. The greatest differences between the AI model and the pathologists were in a single slide in which the bone marrow was severely depleted. The AI model overcounted the number of cells in the ROIs of this slide.
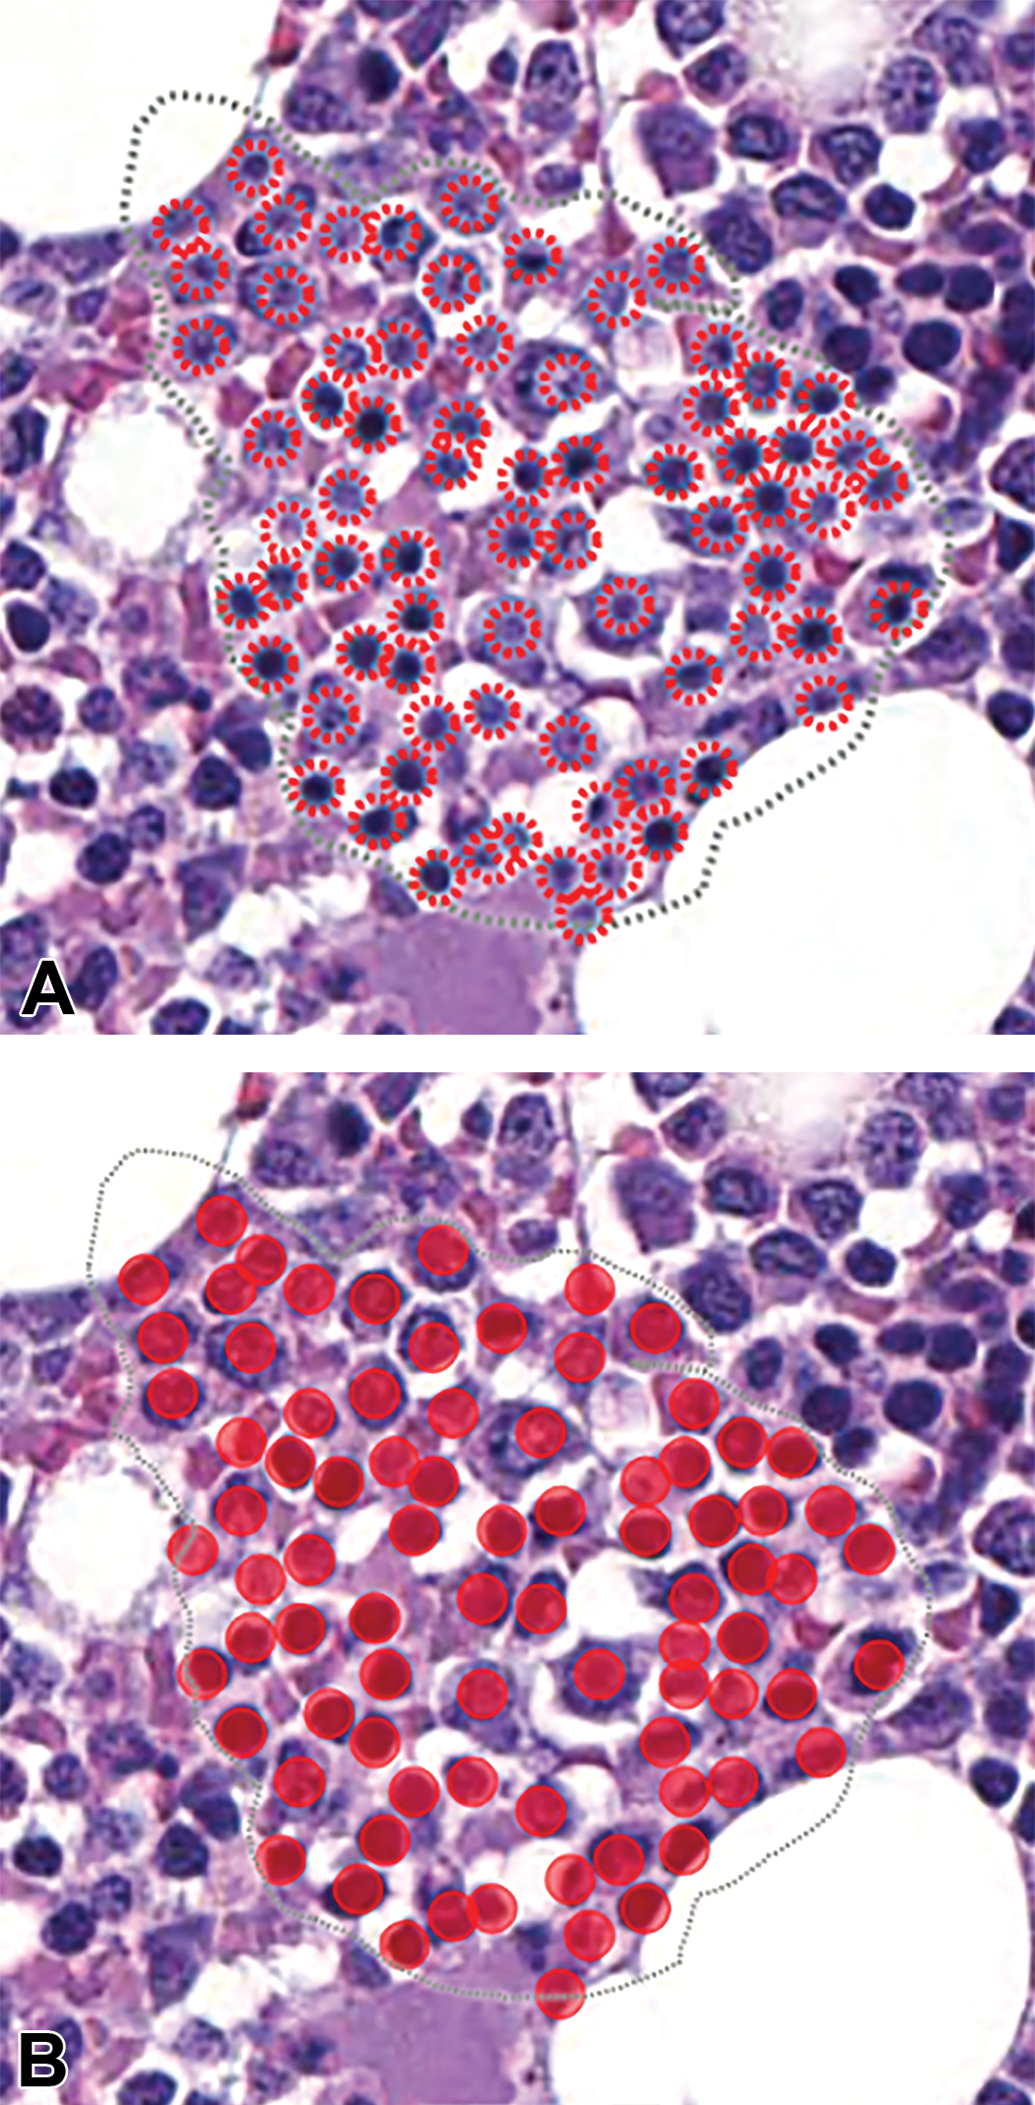
Sternebra, cynomolgus macaque (whole slide image, magnification ×72, hematoxylin and eosin): A, Validation area or region of interest (dashed line) with hematopoietic cells annotated by a veterinary pathologist (dashed red circles). B, Solid red circles are hematopoietic cells annotated by the AI model. AI indicates artificial intelligence.
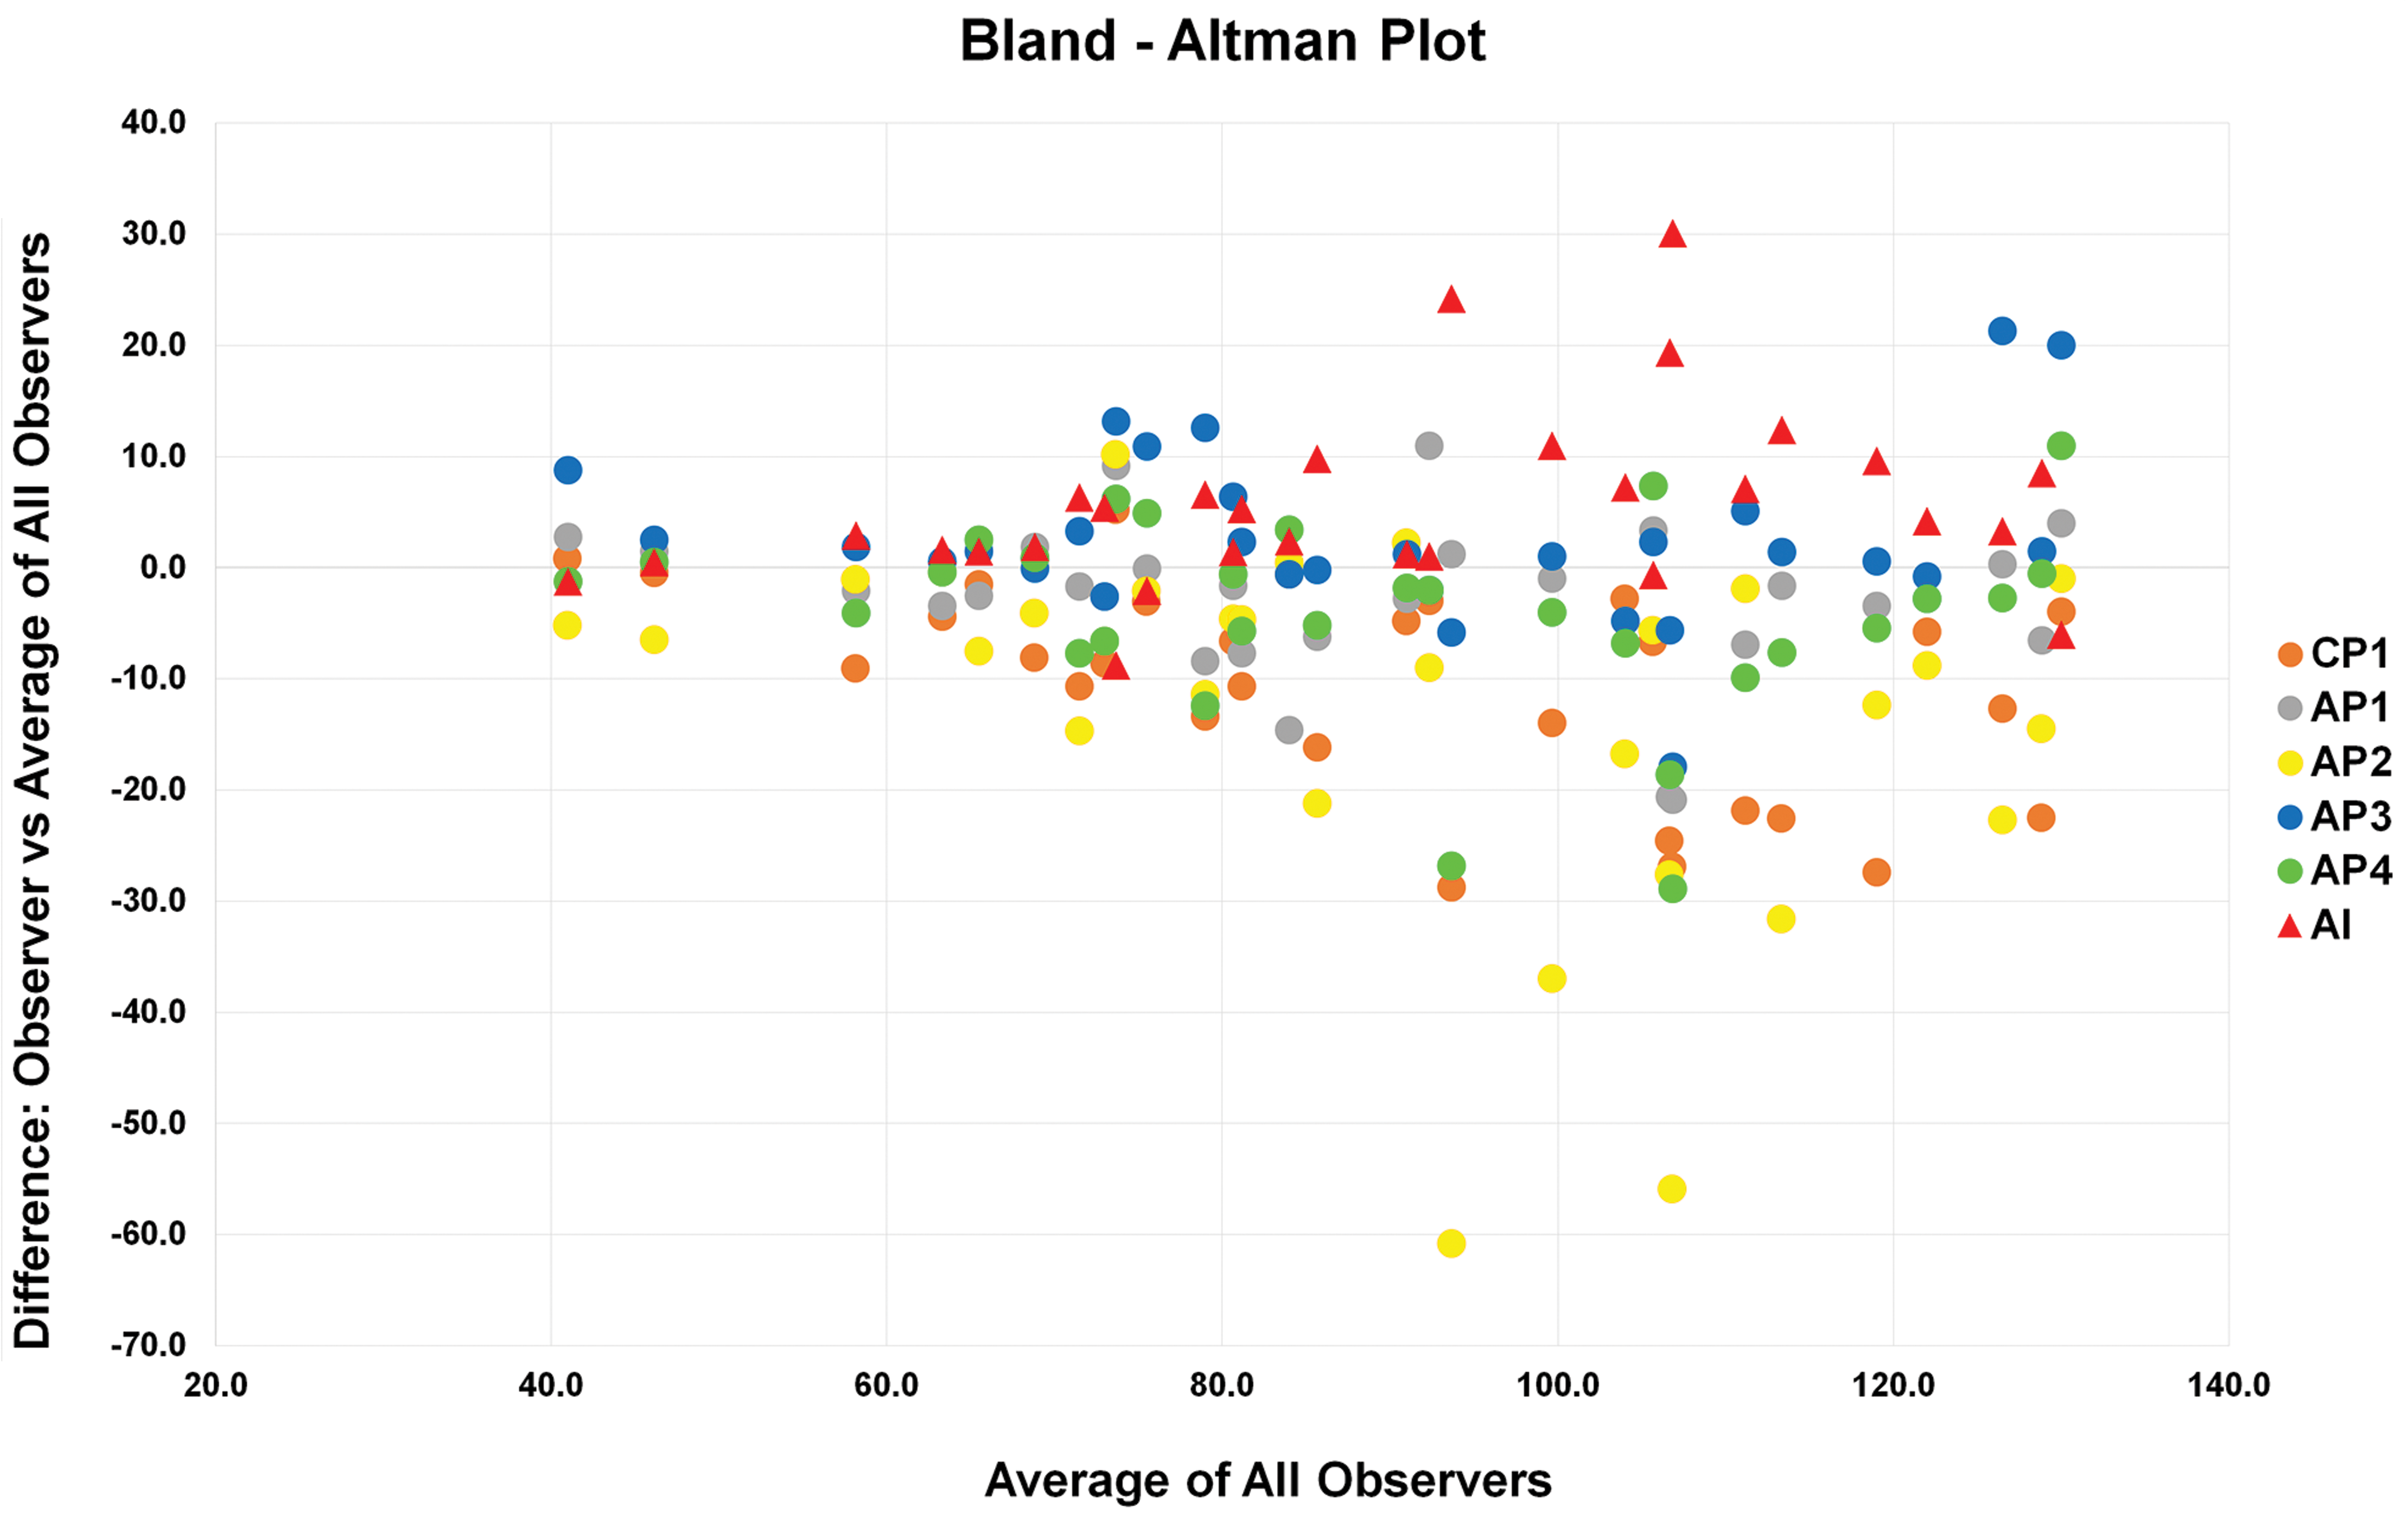
Bland-Altman plot. The x-axis shows the mean cell count in each validation area (30 total) for the AI and each pathologist (observers). The y-axis shows the difference between the count of each observer to the overall mean count for each validation area (0). Note that the higher the number of cells in the validation area, the greater the differences in count. AI indicates artificial intelligence; AP, anatomic pathologist; CP, clinical pathologist.
We used the Pearson correlation to compare the agreement of the mean counts of the AI model to the individual pathologists and the pathologists to each other (Figure 4). There was 0.91 correlation score between the AI to the overall mean count. Four pathologists had a score of 0.98 with the overall mean and 1 was 0.88 (Table 1). The range of agreement between pathologists was 0.81 to 0.95. The range of agreement between the AI model and the pathologists was 0.66 to 0.91. This method of validation has the drawback of potentially overestimating agreement as it only reflects total counts and not the exact identity of the count. The software platform provides “object level validation” (see Materials and Methods) data of human operator and AI model cross agreement. The average agreement between any pair of pathologists over all 30 ROIs evaluated was 83.96% (F1 score), and the range of agreement per ROI was 49.99% to 89.27% (F1 score). The agreement between the AI model-generated results and any pathologist was 80.54% (F1 score), and the range of agreement per ROI was 59.84% to 92.96% (F1 score). These data indicate that compared to the agreement between pathologists, the AI model evaluation is very similar (83.96% vs 80.54% average F1 score). Interestingly in the best performing ROIs, probably the easiest to score also for pathologists, the AI model had more agreement with the pathologists on average than the agreement between pathologists themselves 92.96% versus 89.27%.
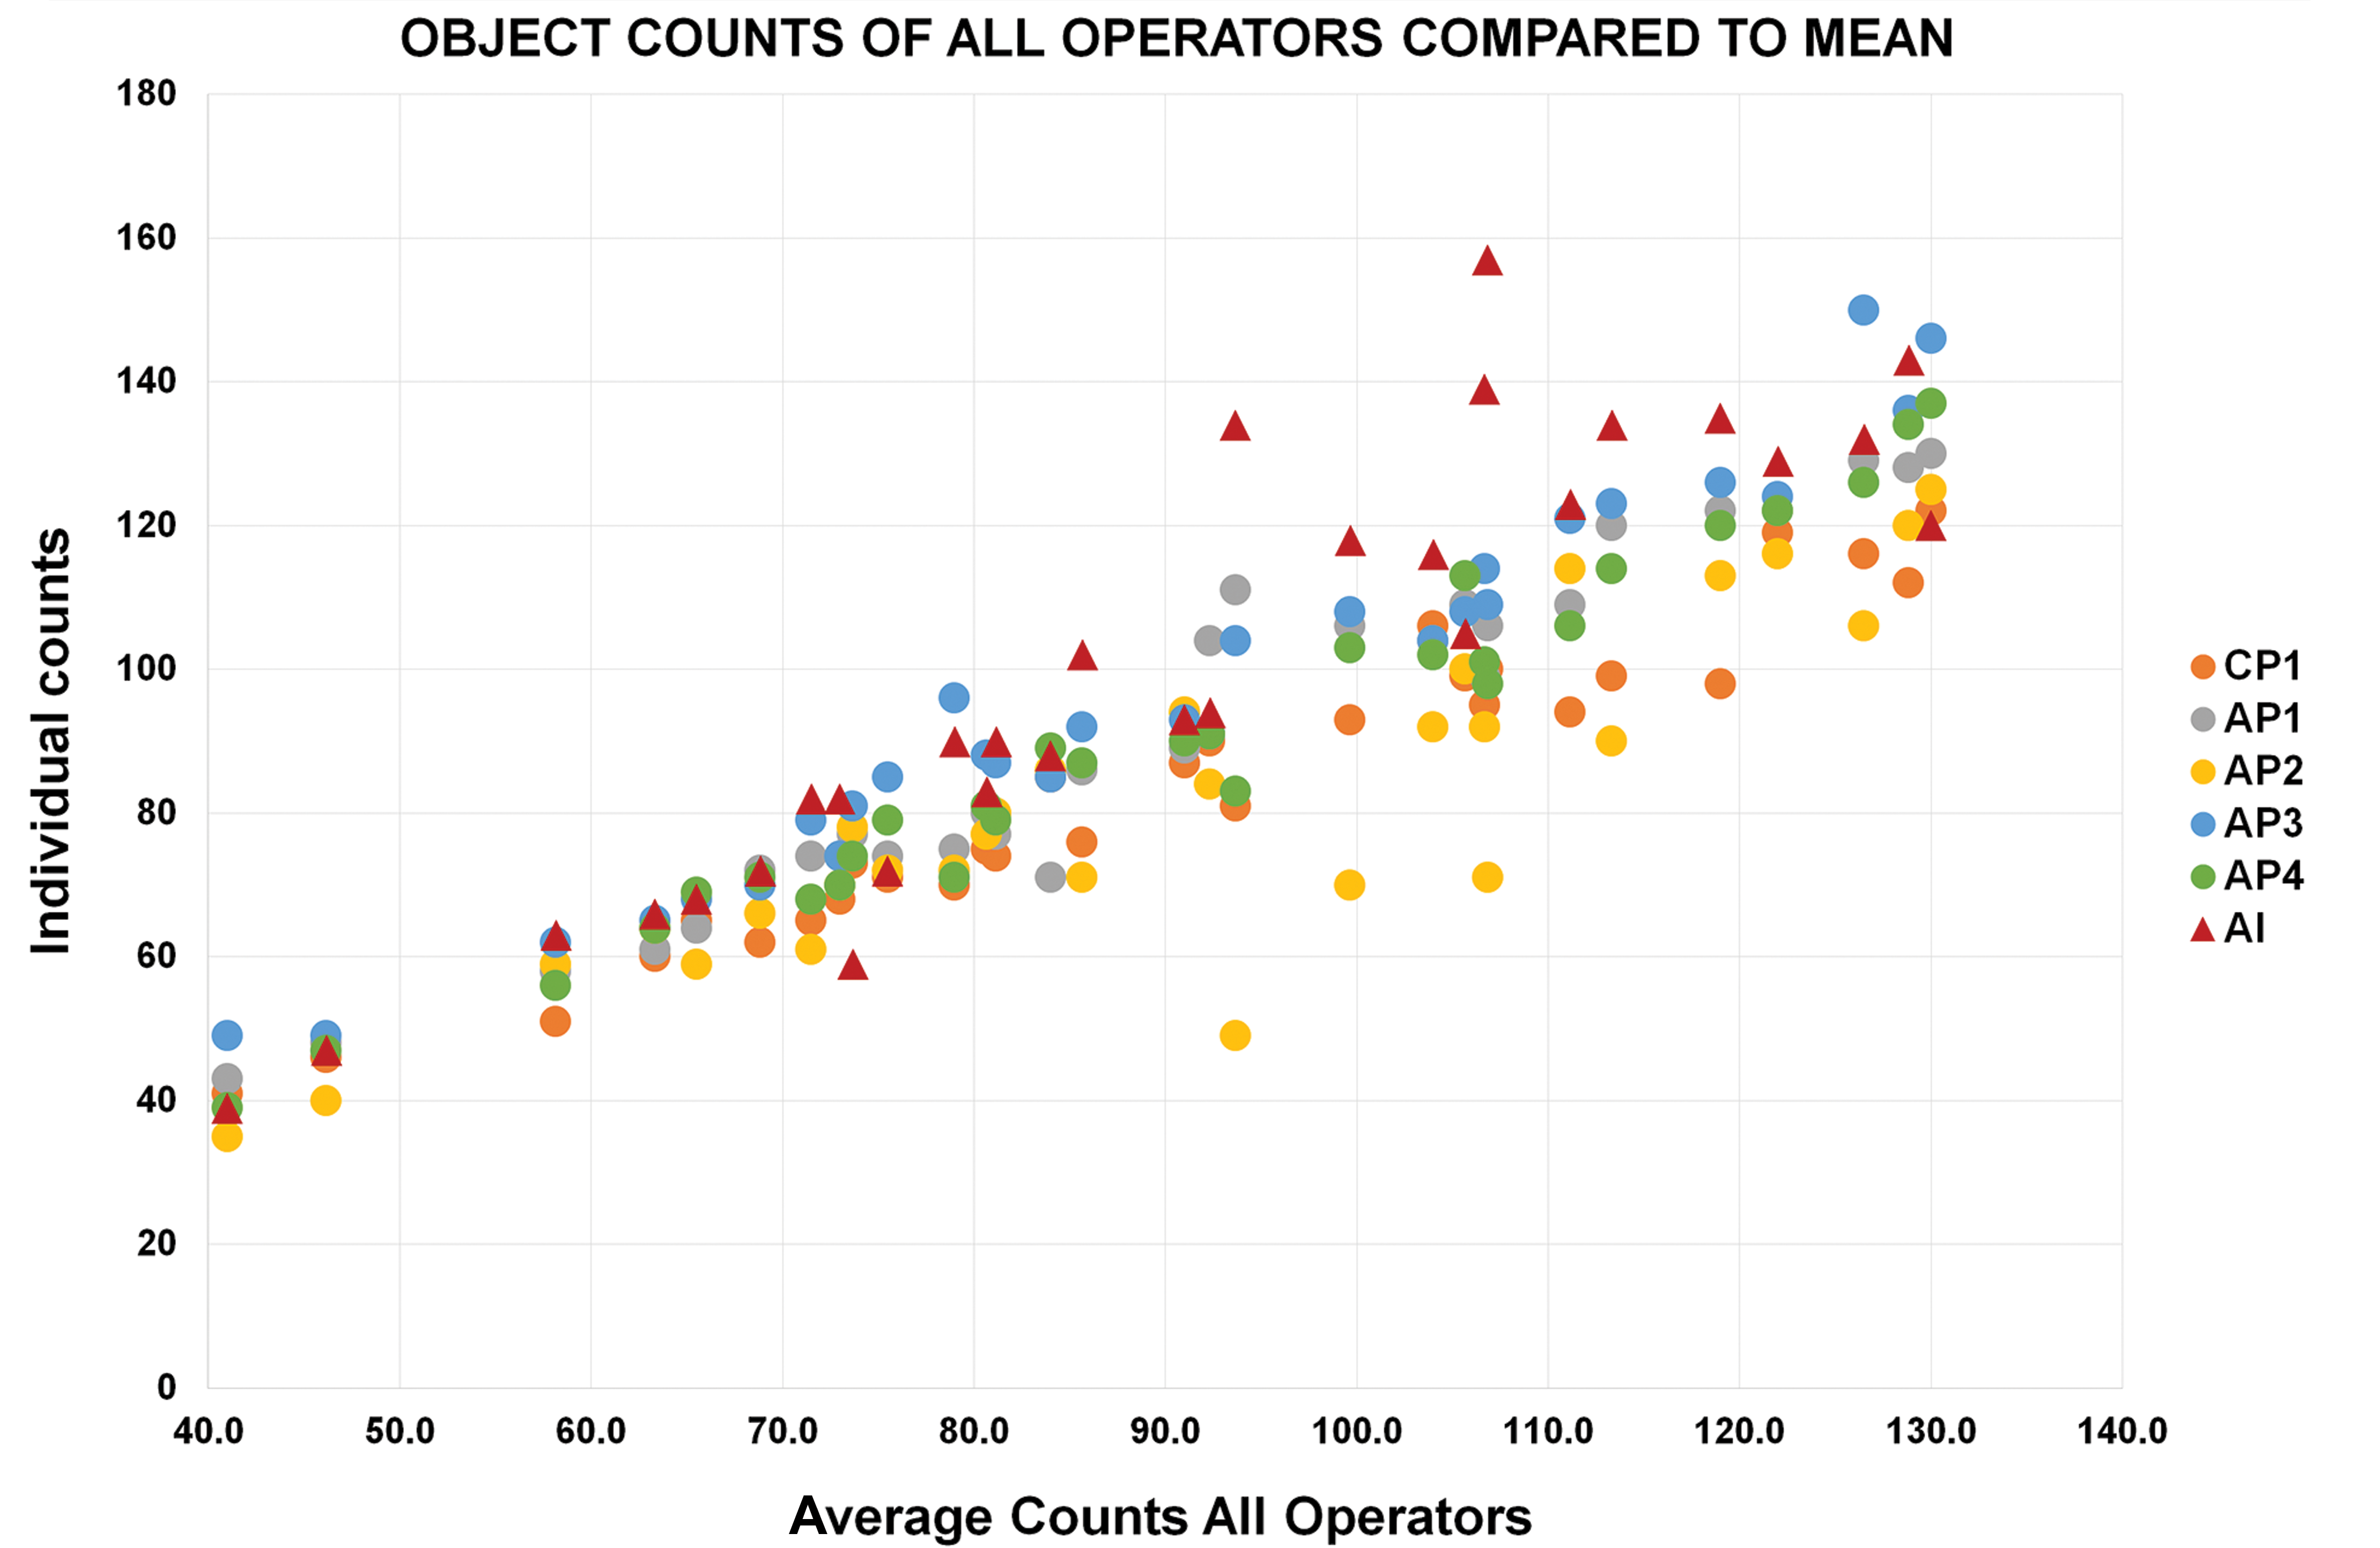
Pearson correlation to mean. The x-axis shows the mean count of each of the 30 validation areas. The y-axis shows the count from each pathologist and the AI model (operators) for each validation area. The graph demonstrates general agreement between the pathologists and the AI model. AI indicates artificial intelligence; AP, anatomic pathologist; CP, clinical pathologist.
Pearson Correlation.a
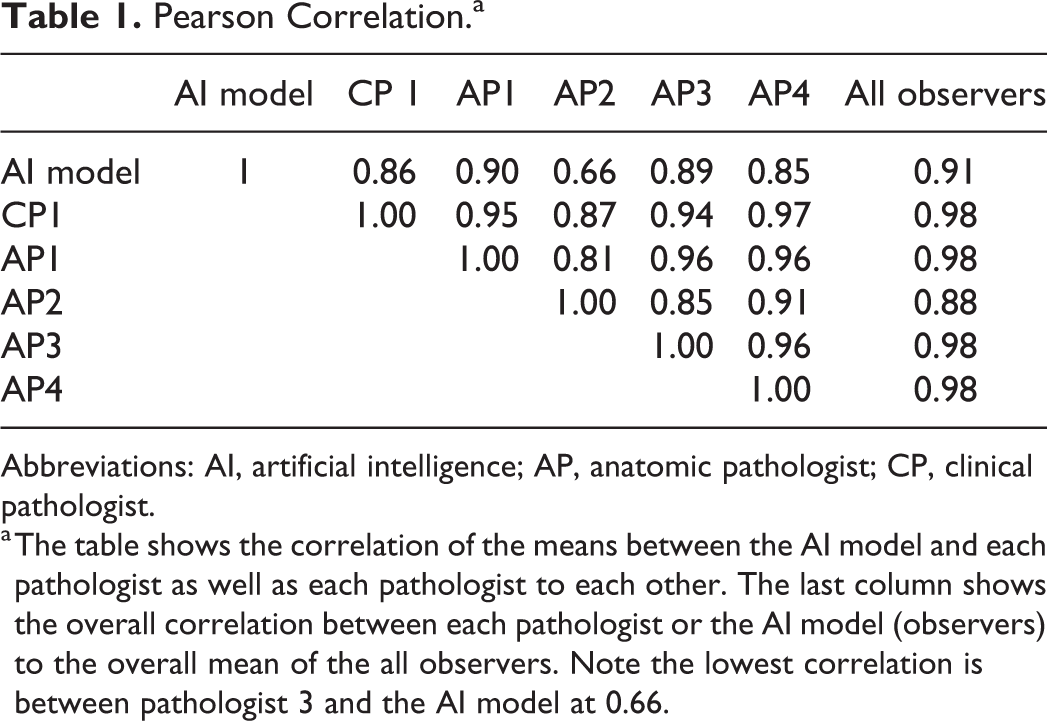
Abbreviations: AI, artificial intelligence; AP, anatomic pathologist; CP, clinical pathologist.
a The table shows the correlation of the means between the AI model and each pathologist as well as each pathologist to each other. The last column shows the overall correlation between each pathologist or the AI model (observers) to the overall mean of the all observers. Note the lowest correlation is between pathologist 3 and the AI model at 0.66.
Comparison of AI Model Counts to Severity Score of a Pathologist
The AI model analyzed 20 WSIs that had been previously diagnosed with decreased hematopoietic cellularity and scored by a pathologist. The AI model provided the total area and total number of hematopoietic cells from which the cell density (cells/mm2) was calculated. In general, the AI model did follow the trend of severity diagnosed by the study pathologist. The mean cell density counts inversely correlated to the severity scores in that the lower the cell density the higher the severity score (Table 2). However, the sample sizes were low for all severities except for severe. The SD of the mean cell density in the WSIs which were diagnosed as severe decrease cellularity was relatively high with some WSIs having cell counts higher than the 1 WSI that was diagnosed with a severity of marked.
The Mean Cell Count (Calculated From the AI Model’s Total Area and Total Hematopoietic Cell Count) Compared to the Study Pathologist’s Severity Score.
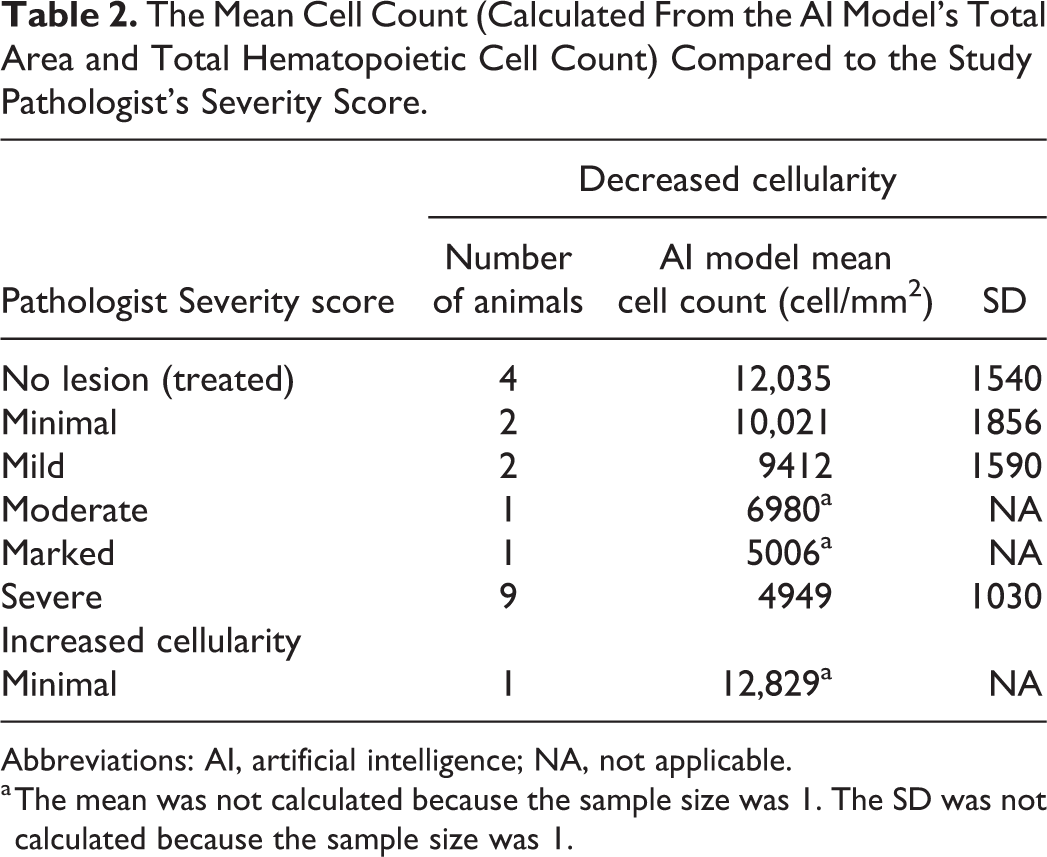
Abbreviations: AI, artificial intelligence; NA, not applicable.
a The mean was not calculated because the sample size was 1. The SD was not calculated because the sample size was 1.
Discussion
Automated evaluation of bone marrow by computer-assisted image analysis is currently being evaluated by several authors. 4,6 –8 Bone marrow aspirates have been used to develop AI algorithms and scanning hardware to recognize and provide a differential cell counts. 6 –8 Automated analysis of the histologic sections of sternal bone marrow in rats has also been evaluated. 4 In this study, we demonstrate that an AI model can be used to identify and measure the area of a sternebra and identify and enumerate the hematopoietic cells in the bone marrow contained within. We also show that the AI model’s cell count is comparable to counts by veterinary pathologists. The cell density can be calculated from the total area of the sternebra and total cell count, which can be used to set parameters for changes in cellularity and severity before review by a pathologist. While the AI model did follow the trend of severity diagnosed by the study pathologist, there was overlap of the cell count to severity score at the severe and moderate score. Thus, the AI model in its current state would be limited to use as a screening tool to alert study pathologists of potential lesions in the bone marrow when comparing treated animals to controls. The AI model offers an advantage over the study pathologist by providing objective data such as the area and cell count of the entire bone marrow section compared to a subjective severity score provided by a pathologist. Objective data are also amenable to statistical analysis and could be correlated to other study data, such as clinical pathology data. We understand that subjective severity scores can be represented numerically and used in the same manner but believe that the cell density of the bone marrow calculated from the AI model’s analysis will provide data which is less susceptible to diagnostic drift.
This model was developed to evaluate the sternebrae of cynomolgus macaques but could be expanded, or similar AI models could be trained to evaluate the cellularity of specific lymphoid compartments in other lymphoid organs, such as thymus, spleen, and lymph nodes, or bone marrow in other species. This AI model is currently being expanded to further recognize hematopoietic cell lineages in the bone marrow, such as myeloid and erythroid cell lines for calculation of the myeloid:erythroid ratio. In addition, this AI model can also be improved with additional training to reduce the number of false positives. The fact that the AI model was essentially trained by a single pathologist with Aiforia training support and consultation on criteria for cell classification within the AI model exemplifies one of the great potential benefits, the ability to develop and deploy AI models for various analytical or study-specific needs in toxicology studies. One hurdle for automated image analysis tools has traditionally been the need for a cross disciplinary development team. Removing that bottleneck would be instrumental for the practical usability of automated image analysis. The presented AI model was trained using a very limited number of training materials, yet it demonstrates reasonable performance, as measured by F1 scores (the interpathologist and AI model agreement on individually identified hematopoietic cells). Due to the nature of AI model generation for image analysis, continuous improvement of the AI model with new training data is extremely practical.
Footnotes
Acknowledgments
The author(s) would like to acknowledge and thank Agathe Bedard, Dan Rudmann, Denny Frost, and Rebekah Keesler for serving at validators and Sarah O’Connor and Cherrie Kolbe for her support with slide scans.
Declaration of Conflicting Interests
The author(s) declared no real, perceived or potential conflicts of interest with respect to the research, authorship, and/or publication of this article
Funding
The author(s) received no financial support for the research, authorship, and/or publication of this article.