
Abstract
Numerous prognostic factors are currently assessed histologically and immunohistochemically in canine mast cell tumors (MCTs) to evaluate clinical behavior. In addition, polymerase chain reaction (PCR) is often performed to detect internal tandem duplication (ITD) mutations in exon 11 of the c-KIT gene (c-KIT-11-ITD) to predict the therapeutic response to tyrosine kinase inhibitors. This project aimed at training deep learning models (DLMs) to identify MCTs with c-KIT-11-ITD solely based on morphology. Hematoxylin and eosin (HE) stained slides of 368 cutaneous, subcutaneous, and mucocutaneous MCTs (195 with ITD and 173 without) were stained consecutively in 2 different laboratories and scanned with 3 different slide scanners. This resulted in 6 data sets (stain-scanner variations representing diagnostic institutions) of whole-slide images. DLMs were trained with single and mixed data sets and their performances were assessed under stain-scanner variations (domain shifts). The DLM correctly classified HE slides according to their c-KIT-11-ITD status in up to 87% of cases with a 0.90 sensitivity and a 0.83 specificity. A relevant performance drop could be observed when the stain-scanner combination of training and test data set differed. Multi-institutional data sets improved the average accuracy but did not reach the maximum accuracy of algorithms trained and tested on the same stain-scanner variant (ie, intra-institutional). In summary, DLM-based morphological examination can predict c-KIT-11-ITD with high accuracy in canine MCTs in HE slides. However, staining protocol and scanner type influence accuracy. Larger data sets of scans from different laboratories and scanners may lead to more robust DLMs to identify c-KIT mutations in HE slides.
Keywords
Currently, hematoxylin and eosin (HE) stained slides are the gold standard to diagnose and prognosticate canine mast cell tumors (MCTs). After identification of a canine cutaneous MCT, tumor grading according to either Patnaik (3 tiers: grade 1, 2, or 3), Kiupel (2 tiers: high grade or low grade), or both are performed.13,18,22,33 In addition, prognostic evaluation of MCTs often includes the detection of c-KIT gene mutations, specifically in exons 8 and 11. 26
The most commonly analyzed c-KIT mutation of canine cutaneous MCTs is the internal tandem duplication (ITD) in exon 11 (c-KIT-11-ITD), which results in a constitutive c-KIT activation leading to uncontrolled cell growth and more aggressive behavior.27,29,35 Besides the general prognostic value of information on the mutational status, confirmation of a mutation of the c-KIT gene is required by the European Medicine Agency before treatment of dogs with non-resectable MCTs with the tyrosine kinase inhibitor Masitininb. 12 Polymerase chain reaction (PCR)-based c-KIT mutation analysis is, however, not performed routinely as it represents a supplementary cost and time factor for the dog owners. In addition, mutation analysis is often performed on formalin-fixed and paraffin-embedded material, which is usually affected by DNA fragmentation. This can lead to decreased sensitivity of the PCR, the current gold standard method for c-KIT-11-ITD detection.5,17,25
Recent studies in human oncology have shown that deep learning models (DLMs) are able to predict the genotype of tumors solely based on their microscopic morphology in HE slides. For instance, a machine-learning algorithm was trained to predict 10 specific driver mutations in human non-small cell lung carcinoma,8,21 as well as mutations in human gliomas, 19 colorectal cancer, 15 and liver cancer 6 among others obtaining classification accuracies ranging from 0.64 to 0.93.6,8,19,21
This study evaluated the use of DLMs for the prediction of c-KIT-11-ITD mutations in MCTs based on HE slides. For this study, we curated a data set of digitized HE slides of canine MCTs with PCR-confirmed c-KIT-11-ITD genotype. To reflect the diversity of HE-staining variants and scanner types in diagnostic institutions, each slide was stained in 2 different laboratories and scanned with 3 different scanning devices, resulting in 6 different data sets (stain-scanner variants). DLMs were either trained and evaluated on the same data set they were trained on (same stain-scanner variant, in-domain) or trained on 1 data set and tested on unknown data sets (different stain-scanner variants, out-of-domain).
Material and Methods
Tumors
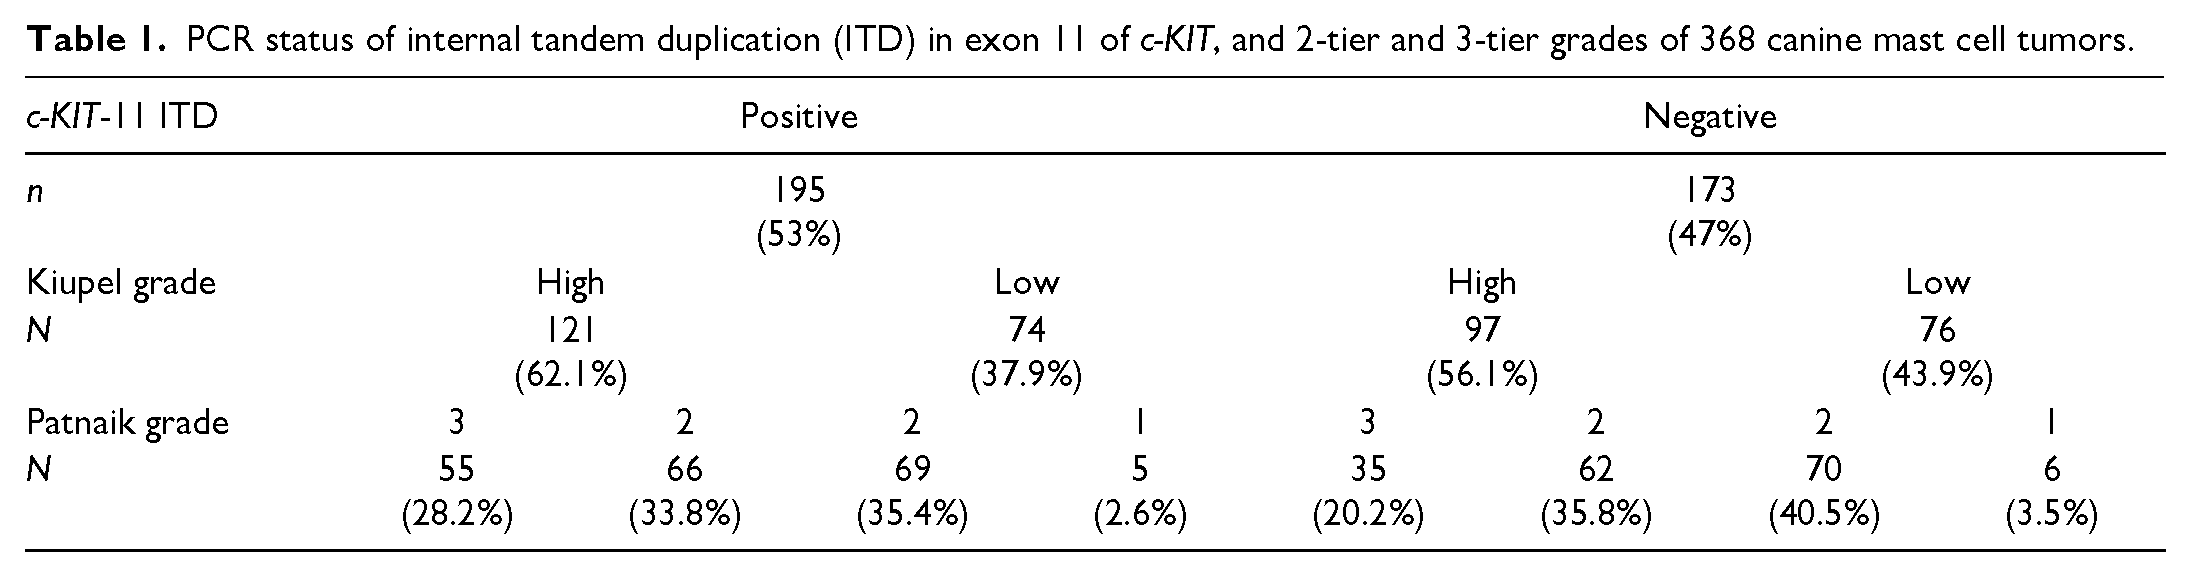
The study set was composed of 368 HE-stained histologic slides of MCT biopsies that had been submitted to the Veterinary Diagnostic Laboratory of Michigan State University between 2018 and 2022 for routine diagnostics with histologic grading as well as a prognostic MCT panel including molecular evaluation of c-KIT-11-ITD and c-KIT exon 8. The 2-tier 18 and 3-tier 22 histological grades were gathered from the histopathology reports (274 cases) or attributed retrospectively (94 cases) by 3 veterinary pathologists (2 board-certified and 1 resident). In the event of non-unanimity, the majority grade was attributed. For the 3-tier grading system, if all pathologists assigned different grades, grade 2 was attributed. In this study, all MCTs were graded equivalently to cutaneous MCTs, even though studies mention applying the 2-tier grading scheme to subcutaneous MCTs with modified cut-off values.7,24,30 There are no specific recommendations regarding the grading of mucocutaneous MCTs. Further information, such as breed, age, sex, localization of the MCT, involvement of the different skin layers (dermal, subcutaneous, or mucocutaneous), and surface condition (ulcerated or intact) could be collected in most of the cases (Supplemental Table S1). Thick tissue sections (several cell layers in fine focus), tumors with extensive necrosis, specimens in bad conservation state, damaged slide glass, presence of artifacts under the coverslip (air bubbles, tissue folds), and missing information about the c-KIT-11-ITD status were exclusion criteria. One hundred ninety-five MCTs with ITD in c-KIT exon 11 and 173 c-KIT non-mutated MCTs (negative in exons 11 and 8) were selected (Table 1).
PCR status of internal tandem duplication (ITD) in exon 11 of c-KIT, and 2-tier and 3-tier grades of 368 canine mast cell tumors.
PCR-Based Identification of ITD Mutation in the c-KIT Exon 11
The PCR-based identification of c-KIT-11-ITD was done at the Michigan State University as part of the MCT panel for routine diagnostics, as previously described. 32 Exon 11 of the c-KIT gene was amplified by PCR using the primer pair at the 5’ end of the exon 11 (PE1: 5’-CCATGTATGAAGTACAGTGGAAG-3’ sense, bp 1657–1680 of exon 11) and the 5’ end of intron 11 (PE2: 5’GTTCCCTAAAGTCATTGTTACACG-3’ anti-sense, nucleotides 43–66 of intron 11). 4 A Mutation Detection PCR Kit (Qiagen) was used for the amplification. 3 PCRs were prepared in a 25 μl total reaction volume, with 10 to 25 ng of extracted DNA; 5 pmol of each primer; 0.5 U of Taq polymerase (Invitrogen, Carlsbad, California); and final concentrations of 80 μm deoxynucleoside triphosphate, 2 mM MgCl2, 20 mM Tris-HCl, and 50 μl of KCl. 32 Cycling conditions were as follows: 95°C for 5 minutes; 35 cycles at 95°C for 30 seconds, 58°C for 90 seconds, 72°C for 30 seconds; followed by 68°C for 10 minutes. 3 PCR products were visualized on the QIAxcel Capillary Electrophoresis System (Qiagen). 3
Staining Variants
To investigate the dependency of the mutational status prediction on the staining protocol, we applied 2 stains (stains A and B) to the same tissue slice, which was de-stained in-between the staining steps, using the following protocol:
Scanners and Stain-Scanner Variant Data Sets
All 368 slides were scanned twice (first with stain A and consecutively with stain B) on 3 different scanners, Aperio CS2 (scanner 1), Aperio AT2 scanner (scanner 2), and 3DHistech Pannoramic II scanner (scanner 3). This resulted in 6 distinct stain-scanner variant data sets of whole-slide images (WSIs) (Fig. 1): data set A1 (stain A + scanner 1), data set A2 (stain A + scanner 2), data set A3 (stain A + scanner 3), data set B1 (stain B + scanner 1), data set B2 (stain B + scanner 2), and data set B3 (stain B + scanner 3).
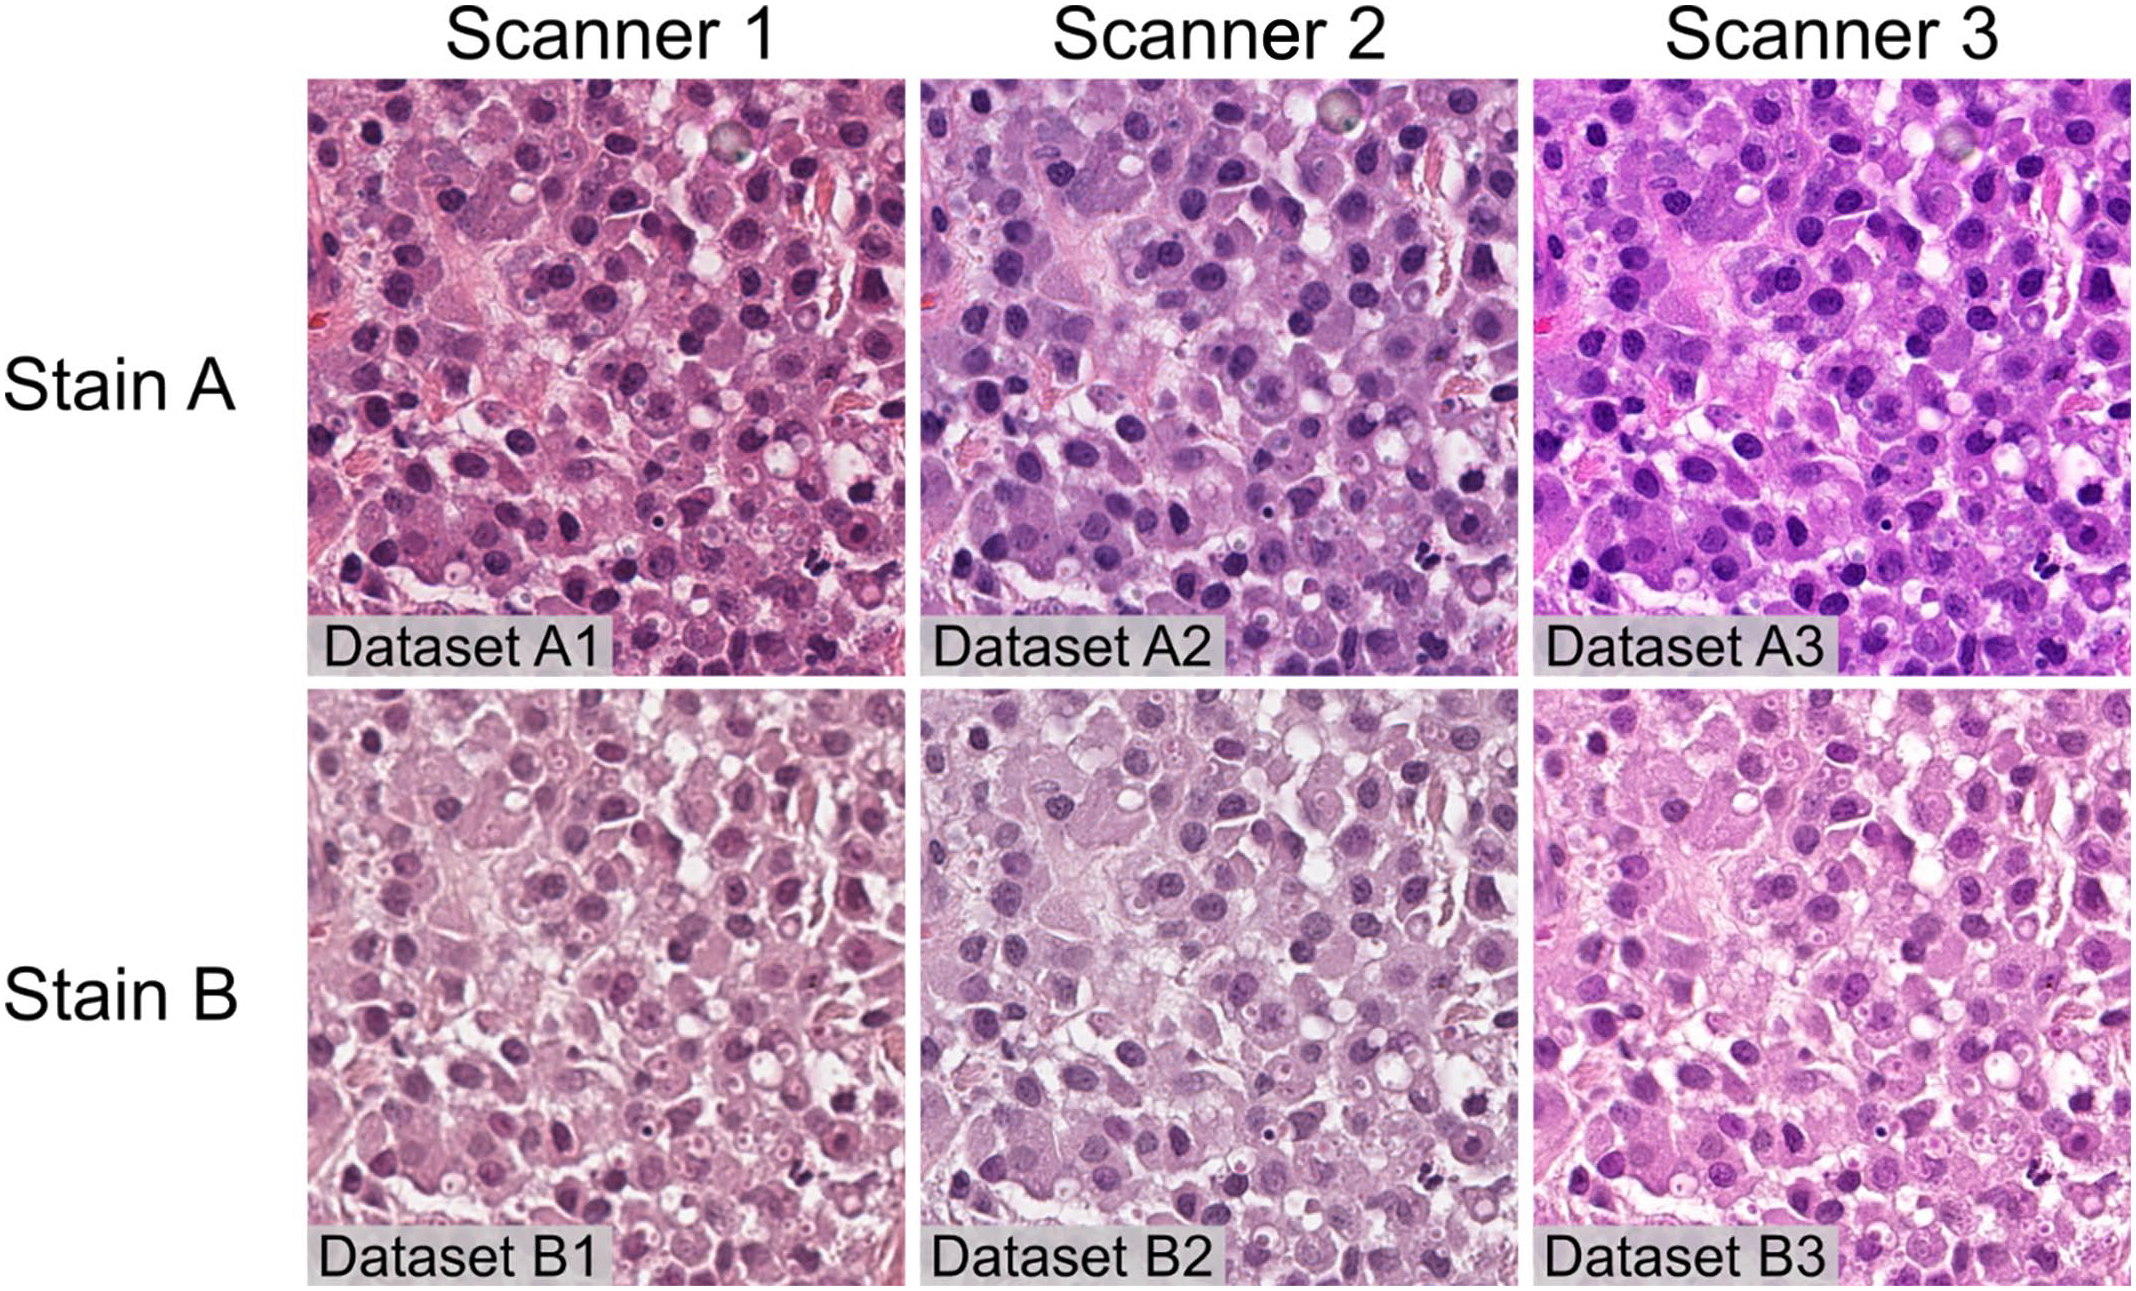
Impact of stain and scanner type on whole-slide image quality. Images of the same tumor sample with 6 stain-scanner variants. Mast cell tumor, skin, canine, and hematoxylin and eosin. Each image represents the same portion of the same tumor in a different stain-scanner variant. Images produced by the different scanners (comparison in the same row) show differences in color calibration and a slight difference in sharpness/depth of field. The staining differs in colors shades/intensity and in the amount of visible detail (comparison in the same column). Scanner 1, Aperio CS2; Scanner 2, Aperio AT2; Scanner 3, 3DHistech Pannoramic II.
Deep Learning Model
The DLMs were trained to predict the c-KIT-11 mutational status of canine MCTs based on their respective WSI. The aim was to discriminate between “c-KIT-11 mutated” and “non-mutated” tumors.
In this work, this was done by formulating the problem as a multiple-instance learning task. In multiple-instance learning, the WSI is split into image patches (instances), which together are commonly referred to as a bag of instances. 16 The information from all patches is extracted and combined to form a prediction for the entire bag, rather than making predictions for each individual patch.
The clustering-constrained attention multiple-instance learning (CLAM) algorithm by Liu et al 20 was used for multiple-instance learning (Fig. 2). To optimize computational efficiency in the first step, the WSIs were segmented into tissue and background, using the segmentation approach described by Liu et al. 20 Afterwards, the area of the slide with sufficient tissue coverage was divided into a set of M patches. Then, a feature embedding was computed for each patch, encoding the visual information of the respective patch into a 1-dimensional vector. To combine the information from all patch embeddings into a slide embedding, the DLM calculated an attention score for each patch embedding, which directly indicated the patch’s importance to the model’s prediction. If a patch did not contain meaningful information, it received an attention score close to zero and was discarded from the aggregation of the overall slide embedding. The slide embedding was a 1-dimensional vector that contained characteristic information of the entire slide. Finally, this embedding was used to predict the mutational status (Supplemental Materials).
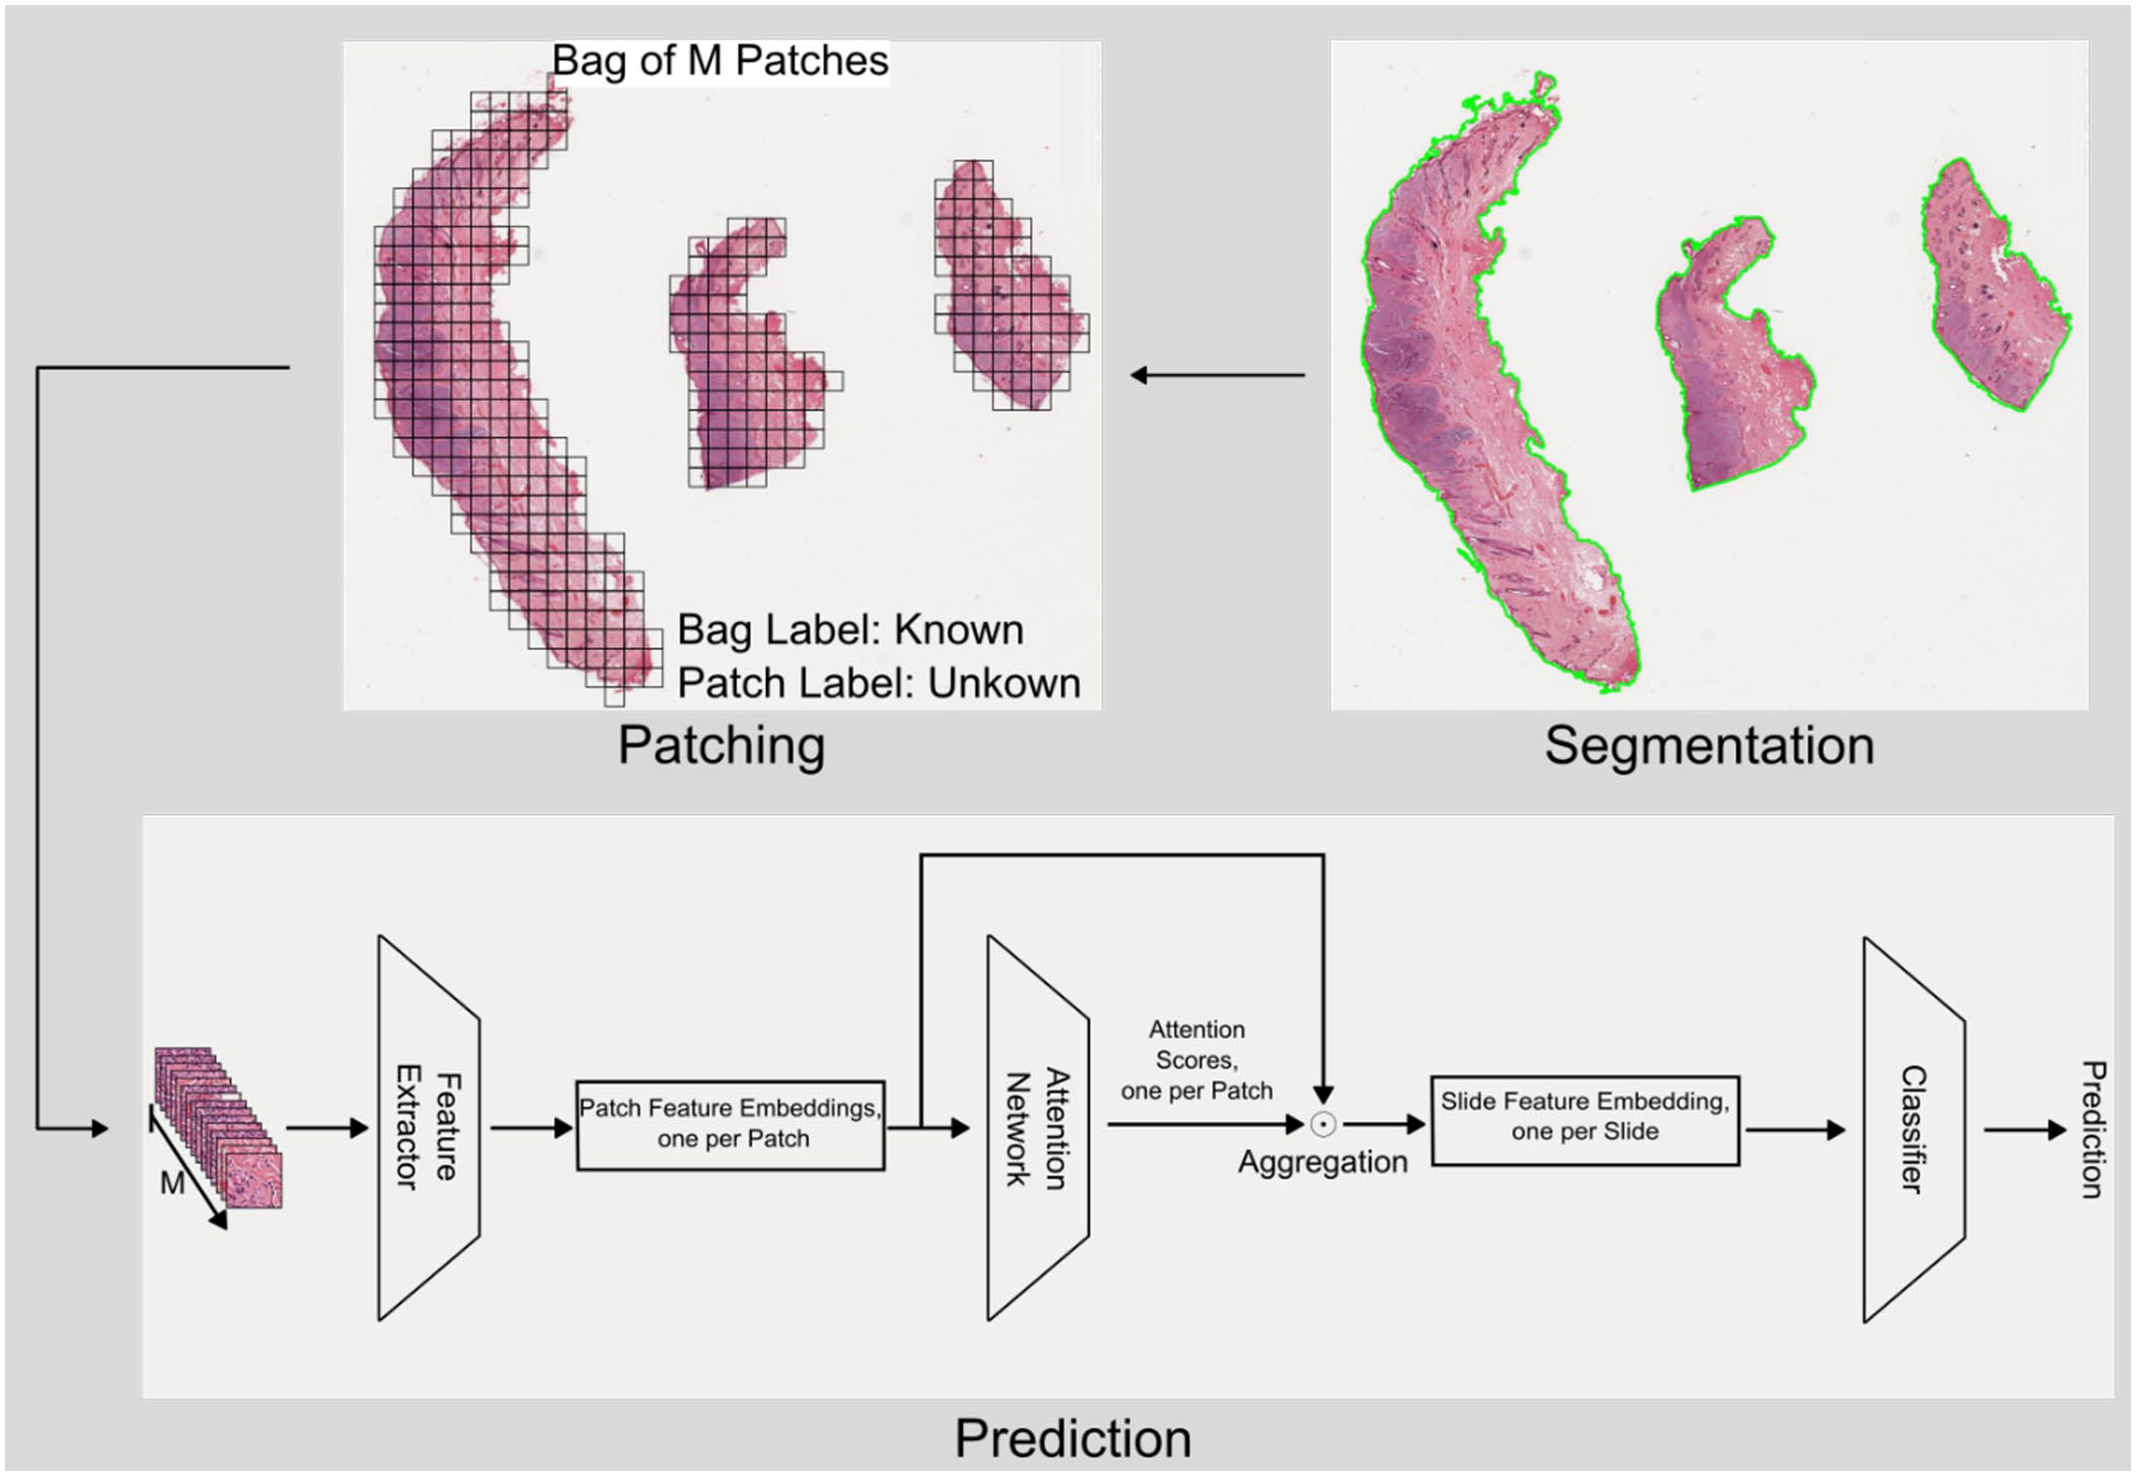
Schematic representation of the clustering-constrained attention multiple-instance learning (CLAM) algorithm that was used for multiple-instance learning. Whole-slide image classification is performed in several steps within the CLAM pipeline used in this study. First, the tissue is segmented from the background and the tissue region is separated into M patches. For each patch, a patch feature embedding is computed, which encodes the visual information contained in the respective patch. To aggregate these patch embeddings into a slide embedding, the deep learning model computes a single attention score for each patch that is directly related to the importance of the respective patch for the model’s prediction. By combining the patch embeddings with their respective attention scores, the overall slide feature embedding is computed. This feature embedding is representative for the whole slide and is used for the final prediction of the mutational status.
Model Training Scheme
To increase the statistical informativeness of the results, the DLMs were trained using a 10-fold Monte-Carlo cross-validation. This means that for each of 10 consecutive runs, the data set was randomly split into disjoint training, validation, and test splits. Within each split, 85% of the slides were used as training and validation data, and 15% were used as test data. In each run, a model was trained on the training data. To ensure comparability across experiments, the same 10 trainings, validations, and test splits were used for the experiments across all data set variants.
To assess the DLM performances, the following metrics were used: classification accuracy, mean classification accuracy (MCA), and area under the receiver-operating characteristic curve (AUC). The classification accuracy measures the number of correct predictions divided by the total number of predictions made in 1 test run. MCA is the mean accuracy achieved across 10 different test folds. AUC is used to measure the DLM’s ability to correctly distinguish the labels across all possible probability thresholds. Furthermore, the sensitivity and specificity of the models were assessed. All metrics were computed using the scikit-learn python package (v. 1.3.0). 23 All DLMs were trained until convergence as observed by the validation loss. Implementation details of the used model architecture and training parameters can be found in the supplementary materials.
Training Approach—Single Data Set
In a first approach, DLMs were trained using the training fraction of the 6 data sets. Each DLM was then tested on the test fraction of all data sets, resulting in 1 in-domain and 5 out-of-domain tests (Fig. 3, left side). Subsequently, this approach was referred to as single data set training. This simulated the following scenario: a pathology laboratory trains a model on its own archive cases, uses it to test its own cases (in-domain), and shares that model with other facilities to test their cases (out-of-domain).
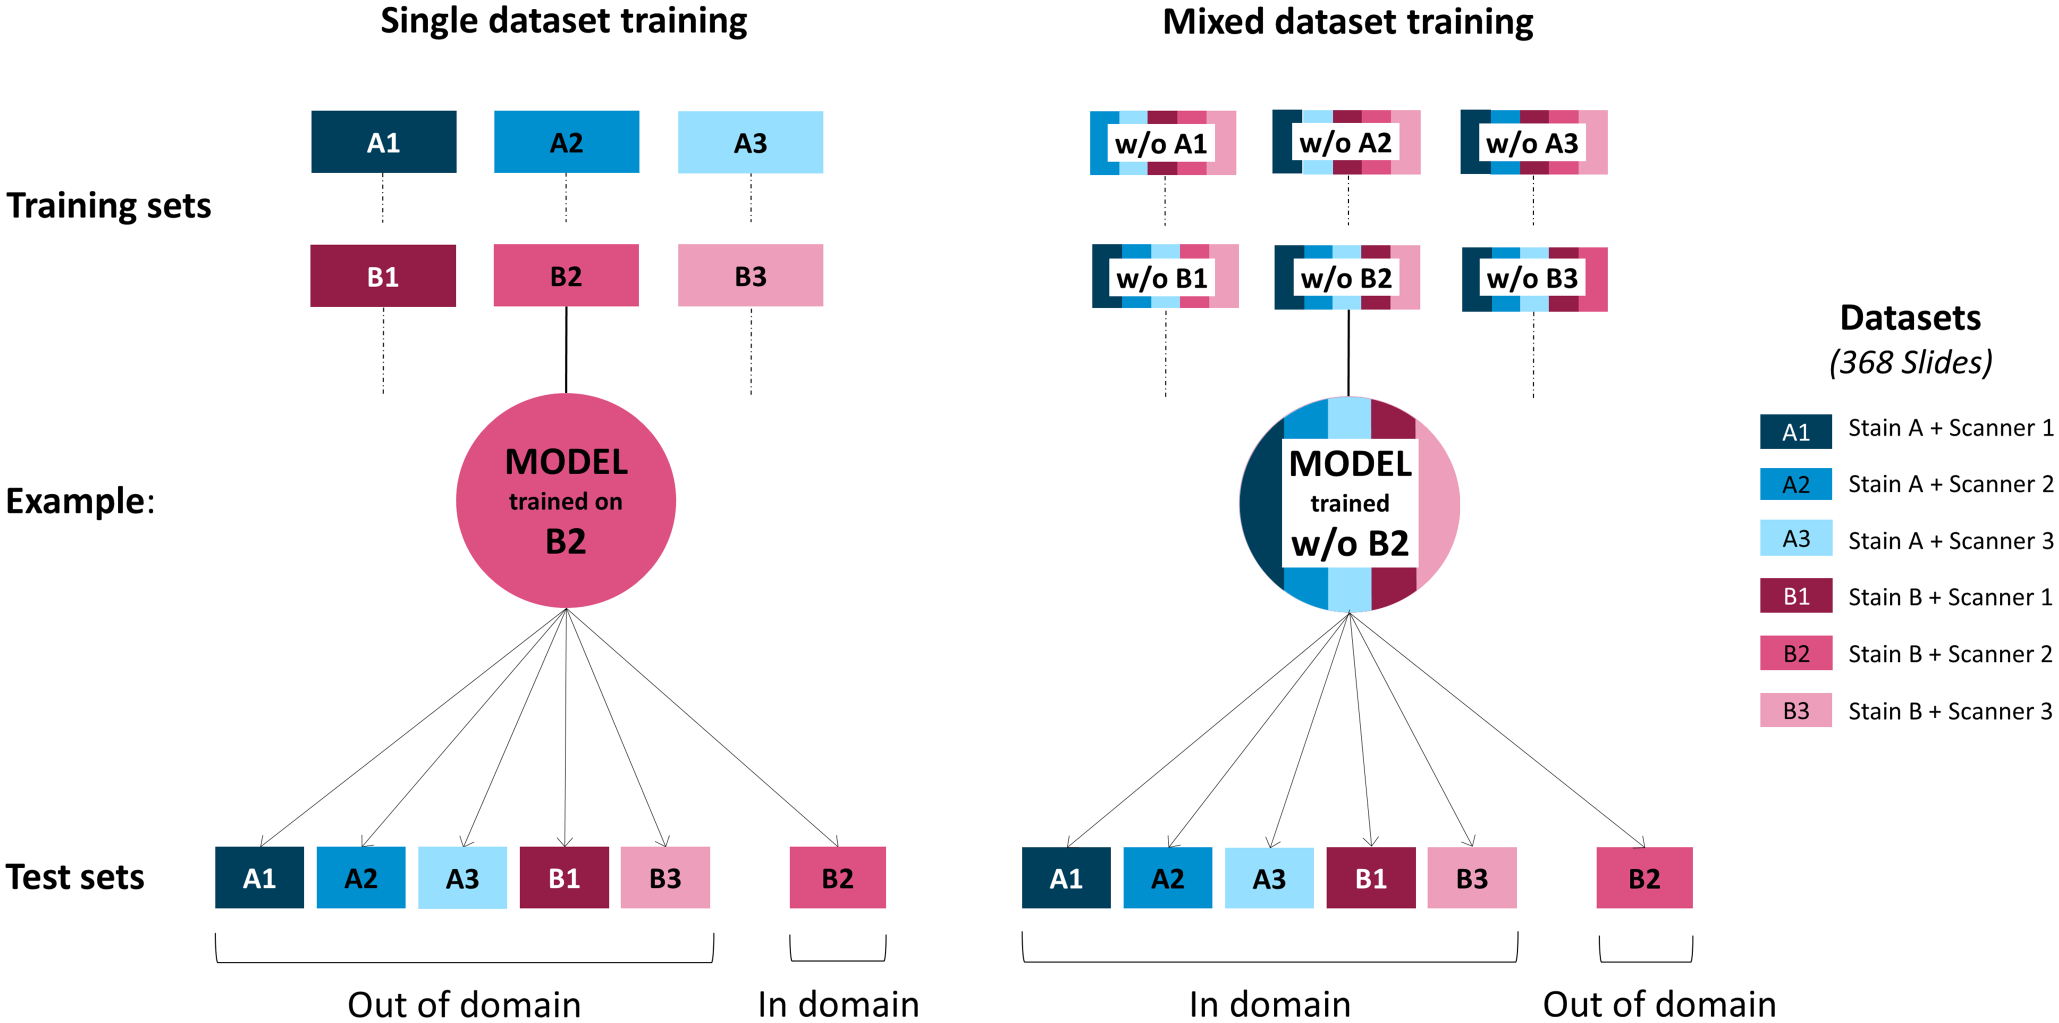
Schematic representation of the model training approaches for the detection of internal tandem duplication mutation in exon 11 of c-KIT. Two general training strategies were applied for deep learning model (DLM) training. Training sets composed of single data sets (left side) and training sets composed of equal shares of 5 of the 6 data sets (right side) were used. The resulting trained DLMs were consecutively tested on all 6 data sets to assess their performances in-domain (tested on a data set from the same stain-scanner variant) and out-of-domain (tested on a stain-scanner variant that was not included in the training). w/o, without; Scanner 1, Aperio CS2; Scanner 2, Aperio AT2; Scanner 3, 3DHistech Pannoramic II.
Training Approach—Mixed Data sets (“Leave-One-Out Approach”)
To assess whether the training with a more diverse data set leads to a more robust prediction of the c-KIT-11-ITD status, DLMs were trained with combined training data sets composed of 5 of the 6 original data sets, that is, leaving 1 data set out of the training. The DLMs were then tested on the test fraction of all data sets, resulting in 5 in-domain and 1 out-of-domain training (Fig. 3, right side). In the following sections, we will refer to this approach as mixed data set training. This simulated the following scenario: several pathology laboratories contribute to a collaborative data set to train a model on variably produced archive cases, use it to test their own cases (in-domain), and share that model with further facilities to test their cases (out-of-domain).
Test for Independence of Diagnostic Variables
To assess the association between the model’s predictions and clinical-pathologic variables like the 2-tier or 3-tier tumor grade, we used the chi-square test of independence. This is a statistical method for assessing the associations between variables of different scales. To lower the chances of misinterpreting 2 variables as associated, we applied Bonferroni correction since we conducted multiple statistical tests simultaneously. Bonferroni correction was applied separately for each of the clinical-pathologic variables. Given that 7 tests were conducted for each variable, the resulting P-values were divided by this number. The assessment only considered models trained on a single data set to establish a direct link between training data and DLM results. The pingouin python package (v. 0.5.3), 31 a statistical analysis package, was used to compute the chi-square test.
Results
Data Set Composition
In total, 50 different dog breeds were represented in the data set. The 10 most common breeds, accounting for 198 cases (53.8%), were: mixed breed (20.1%), Labrador retriever (12.8%), golden retriever (4.6%), boxer (3.3%), American pit bull terrier (3.0%), Maltese dog (2.4%), Pug (2.4%), French bulldog (1.9%), Boston terrier (1.9%), and Shih Tzu (1.4%) (Supplemental Table S2). Breed information was unavailable for 96 (26.1%) cases.
Of the selected 195 c-KIT-11-ITD positive MCTs, 121 (62.1%) were high grade and 74 (37.9%) were low grade (Table 1). One hundred sixty-four MCTs (84.1%) were cutaneous, 18 (9.2%) were subcutaneous, 6 (3.1%) were mucocutaneous, and 7 (3.6%) could not be reliably located due to lacking histologic reports and absence of orientation criteria on the slide. The 173 c-KIT-11-ITD negative MCTs were chosen in the aim of mirroring the repartition of the c-KIT-11-ITD positive group, with 97 (56.1%) being classified as high grade and 76 (43.9%) as low grade. Moreover, 145 (83.8%) were cutaneous, 26 (15.0%) subcutaneous, and 2 (1.2%) were mucocutaneous (Supplemental Table S1).
Prediction of the c-KIT 11 ITD Status Using Single Data Set Training
To assess the capacity of a DLM trained in a single stain-scanner environment to predict the c-KIT-11-ITD status in HE-stained WSIs, 6 DLMs were trained on a single training set (stain-scanner variant) and tested on a test set of the same stain-scanner variant (in-domain) and on different stain-scanner variants (out-of-domain) (Table 2). Across all DLMs, an in-domain average MCA of 0.79 (range 0.75–0.87) was found. The highest MCA of 0.87 was reached by the DLM trained on the data set 6 (stain B, scanner 3) with a sensitivity of 0.90 and a specificity of 0.83. In other words, this DLM predicted the correct c-KIT-11-ITD status in 87% of the cases with 90% probability of true positive prediction and 83% of true negative prediction. In general, DLMs trained and tested on stain B WSIs allowed for a higher MCAs (average MCA 0.82) than DLMs trained on stain A WSIs (average MCA 0.76), pointing toward a general influence of HE-staining protocol for accurate c-KIT-11-ITD prediction. Furthermore, scanner 3 seemed to be slightly more suitable (average MCA 0.84) than scanner 1 (average MCA 0.78) and scanner 2 (average MCA 0.77). However, when the models were tested out-of-domain, they only reached an average MCA of 0.65 (range 0.54–0.76). Detailed performance metrics of all single data set trained DLMs can be found in Supplemental Table S4.
Mean classification accuracies and area under the curve with respective standard deviations of c-KIT-11 internal tandem duplication mutation predictions with deep learning models (DLMs) trained on single data sets.

Abbreviations: MCA, mean classification accuracy; AUC, area under the receiving-operating characteristic curve; A, stain A; B, stain B; 1, scanner 1 (Aperio CS2); 2, scanner 2 (Aperio AT2); 3, scanner 3 (3DHistech Pannoramic II).
Bold font = MCA of DLMs trained and tested on the same data set (in-domain).
Regular font = MCA of DLMs tested on a different training data set from the one they were trained on (out-of-domain).
Prediction of the c-KIT-11-ITD Status Using Mixed Data Set Training (Leave-One-Out Approach)
To test whether more diverse data sets from multiple institutions may lead to more robust c-KIT-11-ITD predictions in HE-stained WSIs from unknown stain-scanner variants, a second set of 6 DLMs was trained on a data set that contained equal fractions (20%) of 5 of the 6 data sets and tested on the sixth, unknown, data set (leave-one-out-approach, Table 3). The average in-domain MCA was 0.76 (range 0.72–0.85), which is lower than the in-domain MCA of the DLMs trained and tested on a single data set (Table 2). However, with an average MCA of 0.73 (range 0.69–0.77), the models trained on mixed data sets showed a better out-of-domain performance than the models trained on a single data set, which achieved an average out-of-domain MCA of 0.65 (range 0.54–0.76) (Table 2). Detailed performance metrics of all mixed data set trained DLMs can be found in Supplemental Table S5.
Mean classification accuracies and area under the curve with respective standard deviations of c-KIT-11 internal tandem duplication mutation predictions with deep learning models (DLMs) trained on mixed data sets (leave-one-out-approach).

Abbreviations: MCA, mean classification accuracy; AUC, area under the receiving-operating characteristic curve; w/o, without; A, stain A; B, stain B; 1, scanner 1 (Aperio CS2); 2, scanner 2 (Aperio AT2); 3, scanner 3 (3DHistech Pannoramic II).
Bold font = MCA of DLMs tested on a data set different from the one they were trained on (out-of-domain).
Regular font = MCA of DLMs trained and tested on the same data set (in-domain).
Analysis of c-KIT Mutation Prediction, c-KIT-11-ITD Status, and Other Clinical-Pathologic Parameters
Chi-square analysis was used to test for independence between the DLM-based mutation prediction and the following parameters: tumor grade (2-tier and 3-tier grading system), location of the tumor (subcutaneous, cutaneous, and mucocutaneous), skin ulceration, and sex (Table 4 and Supplemental Table S5). Analysis confirmed that the DLM predictions were not significantly independent with either the skin layer involvement or the sex of the affected dog. A significant association was found between the 3-tier grade and the predictive output of all models trained on stain A (DLMs trained on data sets A1–3) as well as an association of c-KIT-11-ITD mutation prediction by the DLM trained on data sets A1 and B1, and the 2-tier grade. Furthermore, chi-square analysis indicated that the ulceration status of the overlying epidermis of the skin is significantly associated with the mutation prediction by all DLMs.
Associations between the deep learning model (DLM) prediction and known clinical-pathologic parameters of the tumor.

Abbreviations: A, stain A; B, stain B; 1, scanner 1 (Aperio CS2); 2, scanner 2 (Aperio AT2); 3, scanner 3 (3DHistech Pannoramic II); PCR, polymerase chain reaction.
P-values of the chi-square test of independence with Bonferroni correction. P-values < 0.05 are considered significant.
Discussion
This study was conducted to assess the efficacy of artificial intelligence-based DLMs in predicting c-KIT-11-ITD of canine MCTs solely based on HE-stained WSIs. A total of 368 MCT cases were gathered and digitized, creating 6 data sets corresponding to various stain-scanner combinations. The most successful DLM achieved an MCA of 0.87, with a sensitivity of 0.90, specificity of 0.83, and an AUC of 0.94, underscoring the effectiveness of DLMs in this predictive task.
Given the variability in fixation and staining protocols across pathology laboratories, as well as differences in WSIs from various image acquisition devices, domain shifts (ie, variations between training and test situations) are bound to affect a DLM’s performance. 1 The study addressed this by consecutively staining slides with 2 HE-staining protocols (A and B) from different laboratories and digitalizing them with 3 slide scanners (1–3). DLMs were trained on individual scanner-stain combinations (single data set) or mixtures thereof (mixed data set), simulating institution-specific versus collaborative training scenarios. Cross-validation results for DLMs trained on a single data set and tested in-domain (ie, on WSIs produced in the same training institution) showed an average MCA of 0.79. However, testing on out-of-domain WSIs (ie, from different institutions) led to an important MCA drop (0.65), underlining the domain-dependency of DLMs. A transfer of a locally trained DLM to another institution is thus not possible without tailored mitigation of the domain gap.
Mixed data set-trained DLMs exhibited comparable in-domain performance (average MCA of 0.76) and slightly improved out-of-domain performance (average MCA of 0.73) compared with single data set-trained DLMs, suggesting enhanced transferability through collaborative training. However, training with multiple data sets also increases the demands on the hardware used, especially in terms of memory space, as the calculated features of each data set must be stored in addition to the actual WSI. This high domain-dependency of DLMs has been described for HE-stained WSIs before, 2 and domain generalization is currently a major research focus in computer science to reduce data set variability required for robust real-life artificial intelligence applications.
Although scanner 1 (Aperio CS2) and scanner 2 (Aperio AT2) use the same optical system and produce images with the same resolution, they differ in their loading capacity and scanning speed. The observed performance differences between DLMs trained and tested on these respective devices might be due to processing-induced image variations.
The utilization of a weakly supervised training approach, relying solely on mutational status information without explicit annotations or tumor segmentations, posed a potential bias risk (eg, random overrepresentation of necrosis in one of the groups) but has proven to be an efficient method to train the DLMs. Histologic review of false-positive and false-negative cases did not reveal any evident sources of error. The morphologic causes of wrong predictions are thus unclear, as are the morphologic structures that allow correct predictions by DLMs. Moreover, the varying associations found between DLM-based predictions and clinical-pathologic variables through chi-square analyses emphasize the significance of considering stain-scanner combinations as integral factors influencing predictive modeling outcomes. Hence, a model trained on 1 stain-scanner combination may not generalize to other combinations without specific adjustments. For instance, tumors with ulcerated surfaces, as well as high-grade tumors, were more likely to be classified as c-KIT-11-ITD positive, as indicated by a P value largely inferior to 0.05 across all DLMs. Of the 119 cases exhibiting an ulcerated epidermis, 86 (72%) are c-KIT-11-ITD positive against 33 (28%) c-KIT-11-ITD negative. This association might just be due to the percentage of high-grade MCTs carrying a c-KIT-11-ITD being fundamentally more elevated, and high-grade MCTs being more prone to ulcerate.4,9,14,28,34 Interestingly, our study identified stain B as allowing better prediction of the c-KIT-11-ITD status across all scanners. This suggests that stain B might highlight a morphological feature linked with the c-KIT-11-ITD mutation that might not be visible in stain A and highlights the importance of stain selection in enhancing model performance. Minimal morphological changes resulting from the de-staining and re-staining processes might also be a potential source of performance variations.
This study was inspired by similar work done in the human medicine field with comparably sized data sets (between 62 and 433 samples).8,15,19,21 It is worth mentioning that these human data sets often exhibit imbalances, with notably more non-mutated samples. The AUC metric had to be used to assess the performance of DLMs trained on unbalanced data sets, whereas MCA can be used for balanced data sets. These studies reported AUCs ranging from 0.64 to 0.86. Noteworthy comparisons include a study by Elche et al, which worked with a very large data set of 8343 cases compiled from 9 distinct data sets with the aim of predicting microsatellite instabilities, a highly relevant prognostic factor in colorectal cancers, from HE slides. AUCs ranging from 0.74 to 0.96 were reported. 10 The data set generated for the present study represents, to this date, the largest digital c-KIT-11-ITD mutated canine MCT collection in veterinary medicine and achieved comparable or even superior performances, with AUCs ranging from 0.80 to 0.94.
These promising outcomes led to the planning of several follow-up projects to refine the model’s performance, ensure robustness in diverse real-life scenarios, and explore practical applications of DLMs in routine diagnostics (eg, low-cost and fast screening tool).
Supplemental Material
sj-pdf-5-vet-10.1177_03009858241286806 – Supplemental material for Artificial intelligence can be trained to predict c-KIT-11 mutational status of canine mast cell tumors from hematoxylin and eosin-stained histological slides
Supplemental material, sj-pdf-5-vet-10.1177_03009858241286806 for Artificial intelligence can be trained to predict c-KIT-11 mutational status of canine mast cell tumors from hematoxylin and eosin-stained histological slides by Chloé Puget, Jonathan Ganz, Julian Ostermaier, Thomas Conrad, Eda Parlak, Christof A. Bertram, Matti Kiupel, Katharina Breininger, Marc Aubreville and Robert Klopfleisch in Veterinary Pathology
Supplemental Material
sj-xlsx-1-vet-10.1177_03009858241286806 – Supplemental material for Artificial intelligence can be trained to predict c-KIT-11 mutational status of canine mast cell tumors from hematoxylin and eosin-stained histological slides
Supplemental material, sj-xlsx-1-vet-10.1177_03009858241286806 for Artificial intelligence can be trained to predict c-KIT-11 mutational status of canine mast cell tumors from hematoxylin and eosin-stained histological slides by Chloé Puget, Jonathan Ganz, Julian Ostermaier, Thomas Conrad, Eda Parlak, Christof A. Bertram, Matti Kiupel, Katharina Breininger, Marc Aubreville and Robert Klopfleisch in Veterinary Pathology
Supplemental Material
sj-xlsx-2-vet-10.1177_03009858241286806 – Supplemental material for Artificial intelligence can be trained to predict c-KIT-11 mutational status of canine mast cell tumors from hematoxylin and eosin-stained histological slides
Supplemental material, sj-xlsx-2-vet-10.1177_03009858241286806 for Artificial intelligence can be trained to predict c-KIT-11 mutational status of canine mast cell tumors from hematoxylin and eosin-stained histological slides by Chloé Puget, Jonathan Ganz, Julian Ostermaier, Thomas Conrad, Eda Parlak, Christof A. Bertram, Matti Kiupel, Katharina Breininger, Marc Aubreville and Robert Klopfleisch in Veterinary Pathology
Supplemental Material
sj-xlsx-3-vet-10.1177_03009858241286806 – Supplemental material for Artificial intelligence can be trained to predict c-KIT-11 mutational status of canine mast cell tumors from hematoxylin and eosin-stained histological slides
Supplemental material, sj-xlsx-3-vet-10.1177_03009858241286806 for Artificial intelligence can be trained to predict c-KIT-11 mutational status of canine mast cell tumors from hematoxylin and eosin-stained histological slides by Chloé Puget, Jonathan Ganz, Julian Ostermaier, Thomas Conrad, Eda Parlak, Christof A. Bertram, Matti Kiupel, Katharina Breininger, Marc Aubreville and Robert Klopfleisch in Veterinary Pathology
Supplemental Material
sj-xlsx-4-vet-10.1177_03009858241286806 – Supplemental material for Artificial intelligence can be trained to predict c-KIT-11 mutational status of canine mast cell tumors from hematoxylin and eosin-stained histological slides
Supplemental material, sj-xlsx-4-vet-10.1177_03009858241286806 for Artificial intelligence can be trained to predict c-KIT-11 mutational status of canine mast cell tumors from hematoxylin and eosin-stained histological slides by Chloé Puget, Jonathan Ganz, Julian Ostermaier, Thomas Conrad, Eda Parlak, Christof A. Bertram, Matti Kiupel, Katharina Breininger, Marc Aubreville and Robert Klopfleisch in Veterinary Pathology
Footnotes
Authors’ Note
CP and JG contributed equally to the study.
Declaration of Conflicting Interests
The author(s) declared no potential conflicts of interest with respect to the research, authorship, and/or publication of this article.
Funding
The author(s) received no financial support for the research, authorship, and/or publication of this article.
Supplemental material for this article is available online.
References
Supplementary Material
Please find the following supplemental material available below.
For Open Access articles published under a Creative Commons License, all supplemental material carries the same license as the article it is associated with.
For non-Open Access articles published, all supplemental material carries a non-exclusive license, and permission requests for re-use of supplemental material or any part of supplemental material shall be sent directly to the copyright owner as specified in the copyright notice associated with the article.