
Abstract
Mouse models of inflammatory bowel disease are critical for basic and translational research that is advancing the understanding and treatment of this disease. Assessment of these mouse models frequently relies on histologic endpoints. In recent years, whole slide imaging and digital pathology-based image analysis platforms have become increasingly available for implementation into the pathology workflow. These automated image analysis approaches allow for nonbiased quantitative assessment of histologic endpoints. In this study, the authors sought to develop an image analysis workflow using a commercially available image analysis platform that requires minimal training in image analysis or programming, and this workflow was used to score 2 mouse models of colitis that are primarily characterized by immune cell infiltrates in the lamina propria. Although the software was unable to accurately and consistently segment hematoxylin and eosin–stained sections, automated quantification of CD3 immunolabeling resulted in strong correlations with the pathologist’s score in all studies and allowed for the identification of 8 of the 9 differences among treatment groups that were identified by the pathologist. These results demonstrate not only the ability to incorporate solutions based on image analysis into the pathologist’s workflow but also the importance of immunohistochemical or histochemical surrogates for the incorporation of image analysis in histologic assessments.
Keywords
Inflammatory bowel disease (IBD) is a heterogeneous immune-mediated disease that is often broadly classified into 2 disorders: ulcerative colitis and Crohn's Disease. Ulcerative colitis is characterized by mucosal inflammatory infiltrates and ulceration, extending from the rectum continuously into the colon. In contrast, Crohn's Disease is characterized by discontinuous, often transmural inflammation that is frequently located in the ileum and colon but may be distributed throughout the gastrointestinal tract. Crohn's Disease may also be characterized by the presence of granulomas, strictures, and fistulas, which are absent in ulcerative colitis. The pathogenesis of IBD is incompletely understood but is thought to be due to aberrant immune responses to the intestinal microbiota. Polymorphisms in several genes, including NOD2 and ATG16L1, have been associated with increased susceptibility to IBD, suggesting a significant genetic component. 1,17 New therapies—most notably, the tumor necrosis factor inhibitors—have provided breakthroughs in treating IBD patients; however, two-thirds of patients receive only temporary or no benefit from these therapeutics. 2 Therefore, IBD continues to be an active area of basic research and drug development.
Mouse models of IBD have been used to interrogate basic biologic questions, test preclinical therapeutic efficacy, evaluate pharmacokinetics, and identify potential biomarkers. 6 Since IBD is a relatively heterogeneous condition, it is challenging to model all aspects in a single model system. As such, many IBD mouse models have been developed that recapitulate different components of the disease process or that can be used to evaluate the role of different pathways in modulating intestinal inflammation and repair. 6 IBD mouse models can be classified on the basis of their inciting event—for example, chemically induced models (dextran sodium sulfate [DSS] induced, trinitrobenzene sulfonic acid induced), genetically induced models (interleukin 10 knockout mouse [IL-10-/-], tumor necrosis factor–deltaARE mouse), or CD45RBhi T-cell transfer models. 5 Alternatively, from a pathologist’s perspective, models can be classified on the basis of their characteristic histomorphologic features, which frequently reflect the experimental drivers of the intestinal disease. DSS- and trinitrobenzene sulfonic acid–induced colitis are primarily characterized by extensive ulceration, crypt loss, and secondary inflammation consisting of neutrophils and macrophages in the acute phase. 5,6,8 In the CD45RBhi transfer colitis model, adaptive transfer of naïve CD4+ T cells to immunodeficient mice results in colitis characterized by mononuclear infiltrates into the lamina propria with secondary crypt hyperplasia and only rare ulcers or erosions. 9,12 IL-10-/- mice develop similar colonic lesions, which can be accelerated by piroxicam treatment (IL-10-/- + piroxicam). 3,4,6 Therefore, different mouse models are best suited to ask specific scientific or therapeutic questions and should be selected on the basis of their known molecular, cellular, and histomorphologic features and their relation to the question at hand. 6
Histologic assessment and scoring of intestinal lesions are a primary end point of many murine IBD studies. This is often a tedious process with minimal intellectual engagement for the pathologist. Histologic scoring systems are not standardized among institutions, although most scoring systems account for the severity and extent of inflammation and scores for these features are presented on an ordinal scale. 6 Most experienced pathologists develop standardized scoring systems that they use across studies; however, because histologic scoring systems are based on subjective criteria and not standardized, there is potential variability among pathologists, making meta-analyses nearly impossible.
In recent years, automated image analysis software has become increasingly available and incorporated into the pathologist’s workflow. The development of histologic image analysis algorithms has been greatly accelerated by the increasing availability of whole-slide scanners and digital pathology applications. 15 Automated image analysis allows for the quantitative measurement of histologic features in a high-throughput workflow. Using image analysis, quantitative measurements can be made on continuous rather than ordinal scales, allowing for increased granularity of the morphologic assessments. Additionally, since algorithms are based on defined rule sets by which quantitative measurements are performed, there is elimination of inter- and intraobserver variability and treatment group–related biases that compromise histologic scoring. 15 If preanalytic variables are standardized and defined controls are used in each experiment, this can enable not only more robust quantitative data within a given experiment but also increased ability to perform meta-analyses. 7
Image analysis software platforms vary greatly in terms of the required end-user expertise and flexibility in performing complex analyses. Image analysis software packages with predefined workflows—such as Definiens Tissue Studio (Definiens, Carlsbad, CA, USA), Visiopharm’s TissueMorph (Visiopharm, Hoersholm, Denmark), and Aperio’s Image Analysis Toolbox (Leica Microsystems, Vista, CA, USA)—consist of predefined algorithms that allow users to make limited adjustments to defined parameters within the software. These packages tend to be user-friendly but are limited in the complexity and flexibility of the analysis. In contrast, programming-based platforms, such as Visiopharm’s Visiomorph, Definiens Developer, and MATLAB, require more extensive user training and programming but allow for increased analysis flexibility. 15
Recently, an image analysis approach was reported for scoring DSS-induced colitis models using the Definiens Developer platform. This algorithm was able to score 88% of drug candidates in the same manner as the pathologist, which was used as a gold standard. Based on these results, this automated approach was suggested to be applicable to a high-throughput workflow. 8 Furthermore, given the success of this approach, we sought to develop an automated image analysis algorithm for colitis models that are primarily characterized by proprial immune-cell infiltrates, including the CD45RBhi T-cell transfer-induced colitis model and the IL-10-/- + piroxicam model. One challenge in the integration of quantitative image analysis in the pathologist’s workflow is the perceived barrier of learning the software and developing additional skill sets on an already overbooked schedule. Therefore, this study aimed to evaluate the feasibility of using a predefined workflow approach in developing a quantitative image analysis algorithm through the use of Definiens Tissue Studio, which is user friendly and requires minimal training. To identify the best approach to applying Tissue Studio to high-throughput studies, we compared assessments based on hematoxylin and eosin (HE)–stained sections to quantitative measurements performed on CD3-immunolabeled tissue sections. Additionally, to determine intrinsic limitations of HE-stained tissue sections against the limitations of using a predefined workflow, we also evaluated a HE-based algorithm developed using MATLAB, which is a programming-based software that has built-in image analysis tools and nearly unlimited flexibility. Consequently, through these comparisons, it can be determined whether predefined workflow solutions serve as a valid approach to developing image analysis-based algorithms that can accurately quantify specific histologic features of colitis across preclinical studies.
Materials and Methods
Tissue Preparation
Archived formalin-fixed, paraffin-embedded mouse colons were obtained from 2 CD45RBhi T-cell transfer-induced colitis studies and 3 IL-10-/- + piroxicam colitis studies. All studies were conducted in support of other research or therapeutic programs and were approved by the Institutional Animal Care and Use Committee at Genentech. Tissues included entire sections of colon prepared as “Swiss rolls” allowing for the evaluation of the entire longitudinal section of colon. 6,11 Tissues were formalin fixed, routinely processed, paraffin embedded, sectioned, and stained with HE.
For CD45RBhi T-cell transfer-induced colitis studies, lymphocytes were pooled from the spleen and a collection of lymph nodes from 4- to 6-week-old female donor mice. For study 1, donor cells were derived from BALB/cAnNCrl mice (Charles River Laboratories, Hollister, CA, USA) and recipient mice were CB17/lcr-Pkdcscid/lcrlcoCrl (Charles River Laboratories). For study 2, donor cells were derived from either B6.129S1-Irf4tm1Rdf/J mice crossed with C57Bl/6J-Tg(Itgax-cre,-EGFP)4097Ach/J mice or from C57Bl/6J-Tg(Itgax-cre,-EGFP)4097Ach/J mice that were not crossed, which were bred at Genentech and have been described. 13 Recipient mice were B6129S6-Rag2tm1FwaN12 mice (Taconic, Oxnard, CA, USA). All recipient mice were 6- to 8-week-old females at the time of transfer. CD4+ cells were isolated by negative selection, and CD45RBhi CD44lo T cells were purified by FACS. For study 1, 300 000 donor cells were injected intravenously into recipient mice. Total CD4+ T cells were used as a negative control. For study 2, 400 000 donor cells were injected intraperitoneally into recipient mice to induce disease. Experimental interventions were started at week 0. Animals were euthanized at weeks 10 to 12, and tissues were collected and formalin fixed for histologic evaluations.
Studies of IL-10-/- + piroxicam–induced colitis were performed on 6-week-old female S129/SvEv-Il10tm1cgn (IL-10-/-) mice, previously described. 3 For induction of colitis in IL-10-/- mice, 200 parts per million of piroxicam was added to the diet following overnight fasting. Mice were given this diet for 11 days and returned to normal chow on day 12. Then, 6 weeks after the start of the experiment, mice were given experimental therapeutics for 6 weeks (weeks 7–12). At the end of week 12, mice were euthanized, and colons were collected and formalin fixed for histologic evaluations.
Histologic Scoring
The severity and extent of colitis were scored by a pathologist according to the following criteria:
0: healthy colon; 1: minimal inflammation with minimal to no separation of crypts (generally focal affecting <10% of mucosa); 2: mild inflammation with mild separation of crypts (generally affecting 11%–25% of mucosa or mild, diffuse inflammatory infiltrates with minimal separation of crypts); 3: moderate inflammation with separation of crypts, with or without focal effacement of crypts (generally affecting 26%–50% of mucosa or moderate, diffuse separation of crypts); 4: extensive inflammation with marked separation and effacement of crypts (generally affecting 51%–75% of mucosa); and 5: diffuse inflammation with marked separation and effacement of crypts (generally affecting >75% of mucosa).
The proximal, mid, and distal thirds of the colon as well as the rectum were each scored individually and summed for the total colitis score of each animal. The pathologist was blinded to the treatment groups at the time of scoring. Negative control tissue sections that lacked significant inflammation were assessed for all studies that were evaluated.
CD3 Immunohistochemistry
CD3 immunohistochemistry (IHC) was performed on formalin-fixed, paraffin-embedded tissue sections from the same blocks that were assessed by HE. Following heat-induced antigen retrieval using target retrieval buffer (Dako, Carpinteria, CA, USA) in a PT module (Thermo Scientific, Kalamazoo, MI, USA), CD3 IHC was performed on a Dako autostainer. Primary anti-CD3 antibodies (Thermo Scientific, clone SP7; RM-9107-S) were incubated for 60 minutes at 7.5 µg/ml. The ABC-peroxidase Elite kit (Vector Laboratories; PK-6100) with 3,3′-diaminobenzidine was used for detection, and tissues sections were counterstained with hematoxylin. Negative control tissue sections were included in each IHC run. These sections were incubated with naïve rabbit monoclonal IgG in place of primary antibodies at a concentration of 7.5 µg/ml. Sections of mouse spleen were used as positive control tissue sections.
Image Analysis
Whole slide images of histologic tissue sections were acquired with a Nanozoomer 2.0-HT automated slide scanning platform (Hamamatsu, Hamamatsu City, Shizuoka, Japan) at 200× final magnification. Image analyses were performed using Definiens Tissue Studio and MATLAB. Studies in which each image analysis platform was used are shown in Table 1. Tissue Studio is an object-based image analysis platform used to develop image analysis algorithms that can be used to segment images based on the user’s input and quantify defined features within tissue sections. To develop an image analysis algorithm, Tissue Studio initially segments images into distinct objects based on the characteristics of neighboring pixels. Following object segmentation, users define tissue classes of interest and provide representative examples of each tissue class. The software then performs iterative training to identify differentiating features of these tissue classes and accordingly classifies each image object as a tissue class based on the attributes of the object (Fig. 1). Additional parameters can be set to segment cells and nuclei and to measure defined parameters within specific tissue class regions. Additionally, reclassification steps based on specific mathematical parameters, such as size and nearest neighbor, can be performed to refine image segmentation. In this study, representative normal and inflamed sections of colon were used for training. Tissue classes defined in HE algorithm 1 included inflammatory infiltrates, crypts, lumen/mucus, and muscle. Tissue classes defined in HE algorithm 2 included inflammatory infiltrates, distinct crypts, compressed crypts, lumen, muscle, and mucus/bacteria. Tissue classes defined in the IHC algorithm included inflammatory infiltrates, crypts, bacteria, lumen/glass, muscle, uterus, and coverslip. Approximately 5 to 10 examples of each tissue class were used for training. After initial development, the algorithm was tested on a subset of samples to assess segmentation accuracy. Image masks were reviewed, and reclassification steps based on specific mathematical parameters, such as size and nearest neighbor, were added to the analysis macro to reclassify consistent errors. After all the necessary corrections were made, the final algorithm was run on the entire study. All data were exported as .csv files. Final results were reported as percentage inflammatory infiltrates per total tissue area, which included crypt, muscle, and inflammatory infiltrates areas.
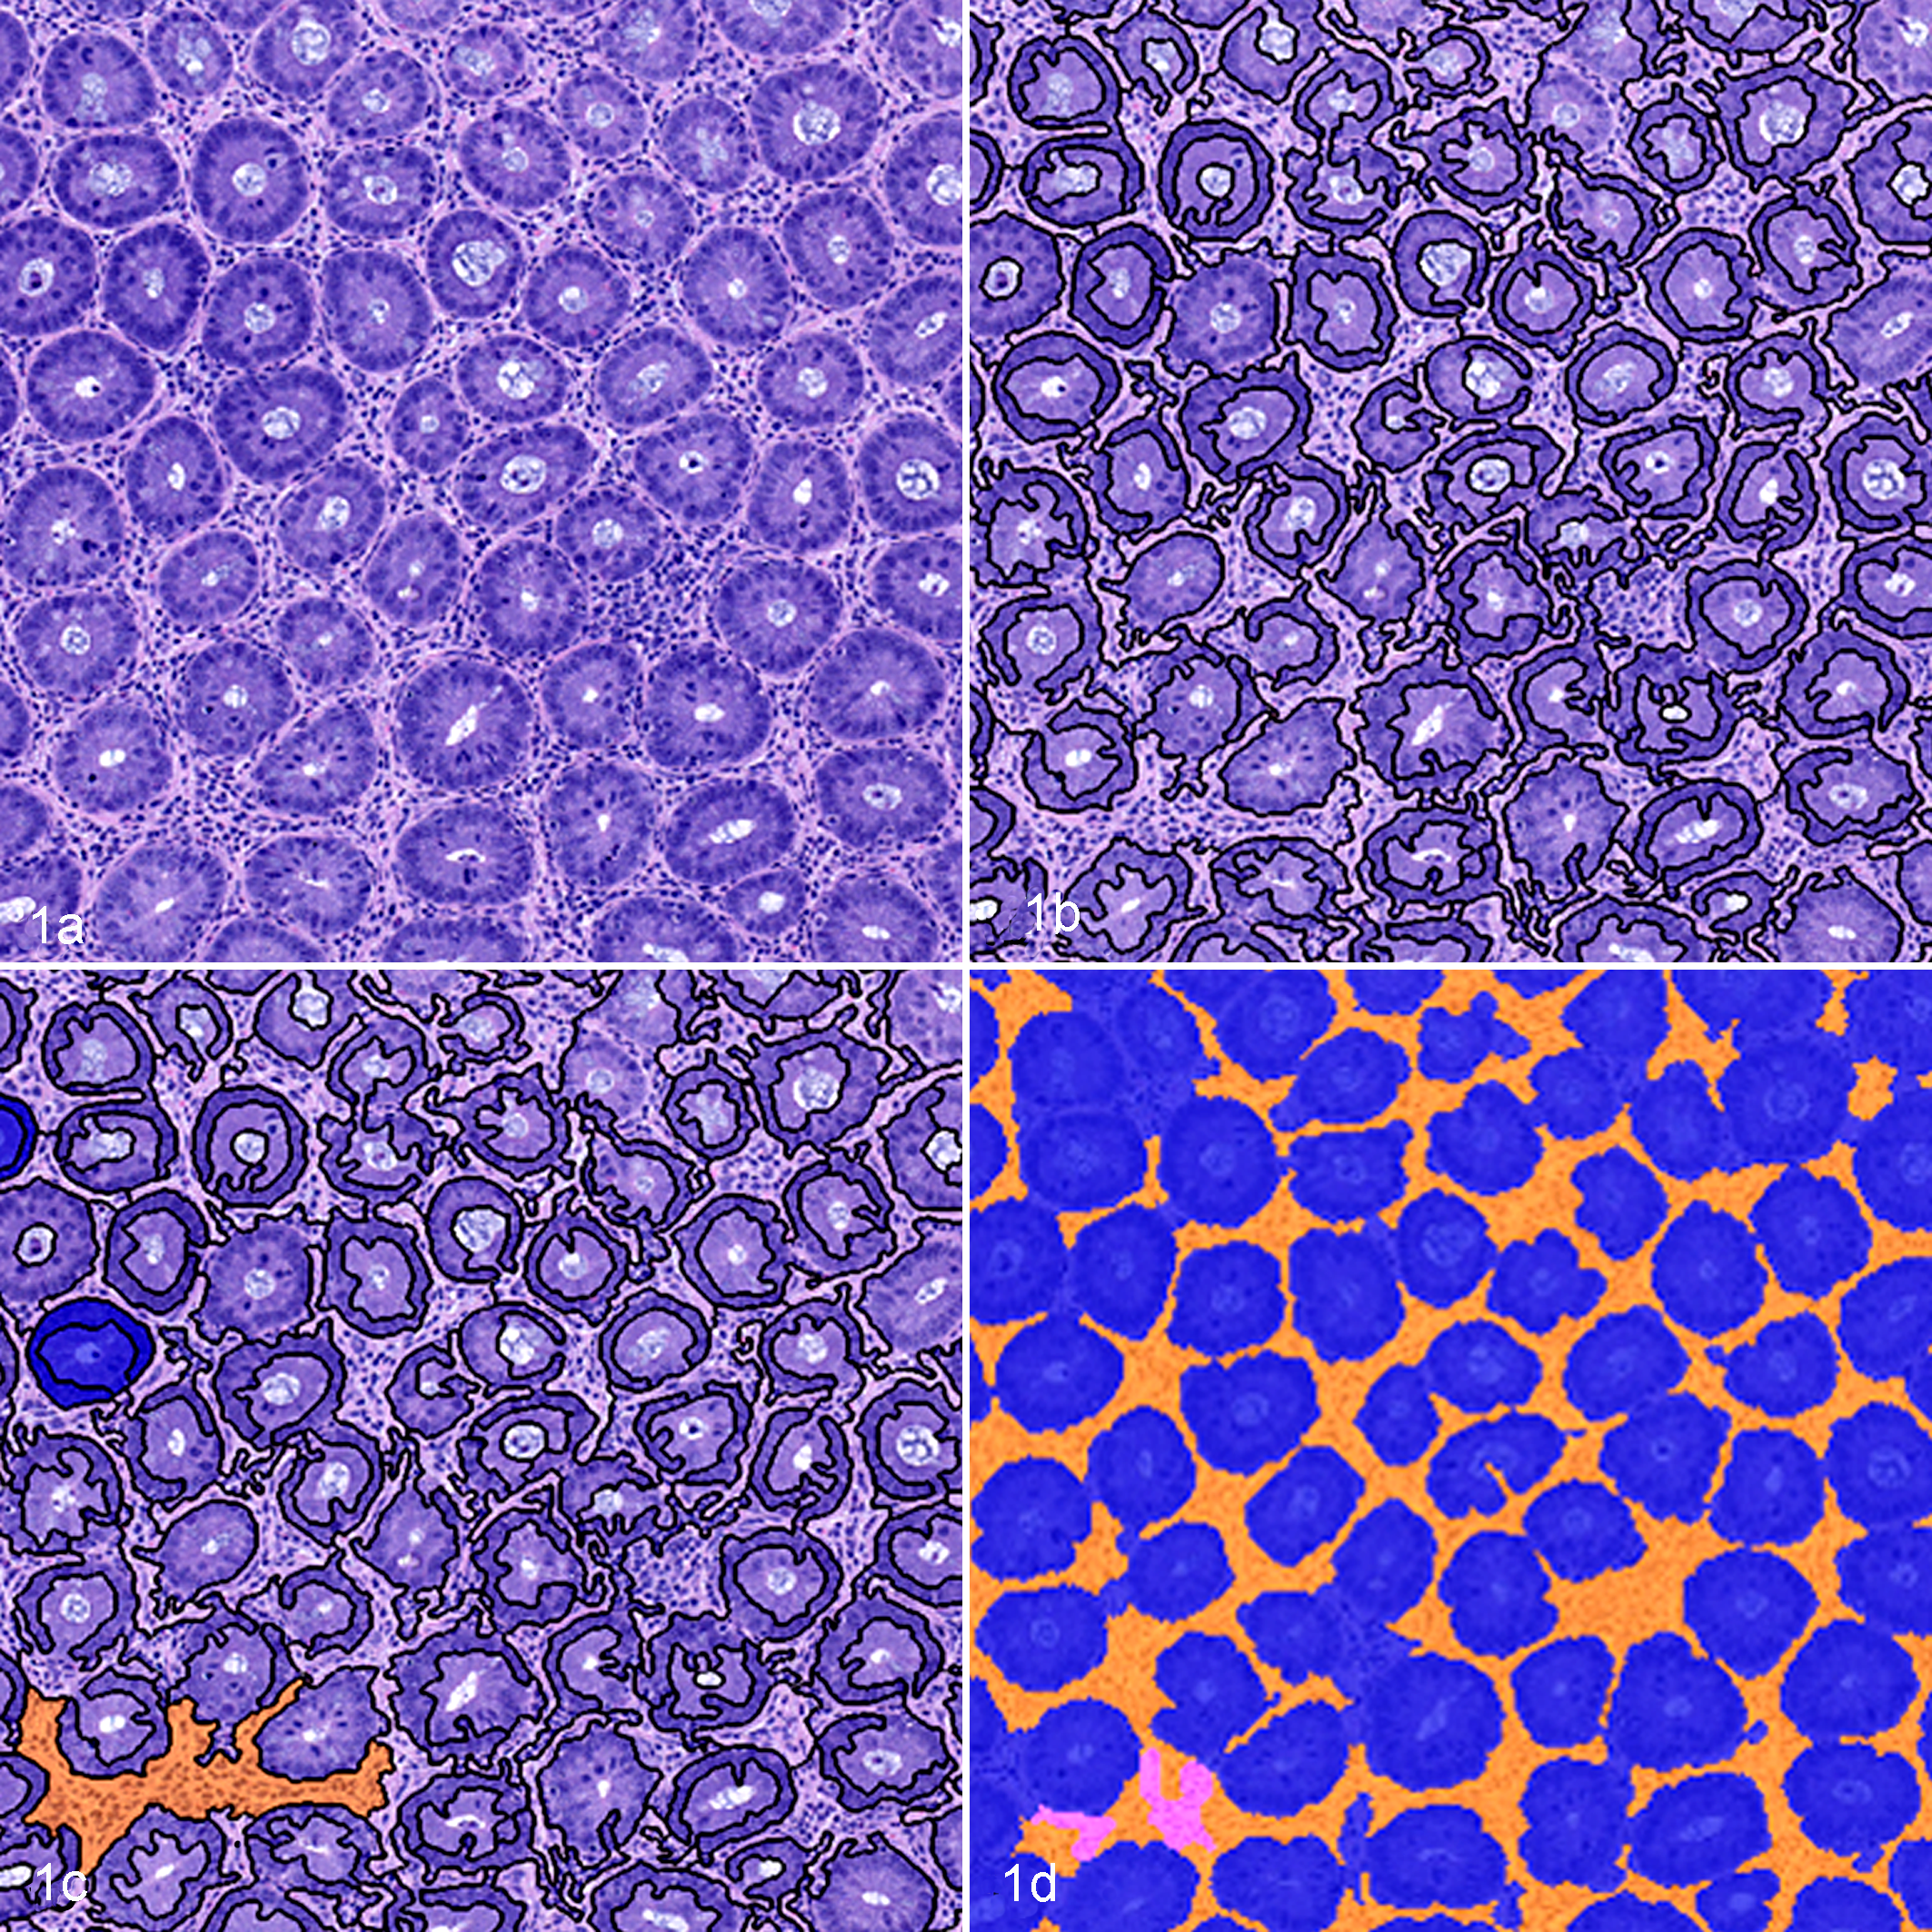
Mouse colon, hematoxylin and eosin (HE)–based Tissue Studio image analysis workflow using HE-based algorithm 1. (a) HE-stained section of colonic mucosa. (b) Automated object segmentation of histologic image. (c) User-defined examples of tissue classes within the image. (d) Final mask, segmenting objects based on unique features of the user-defined tissue class examples.
Image Analysis Algorithms, Software Used, and the Distribution of Studies in Which Evaluations Were Performed.
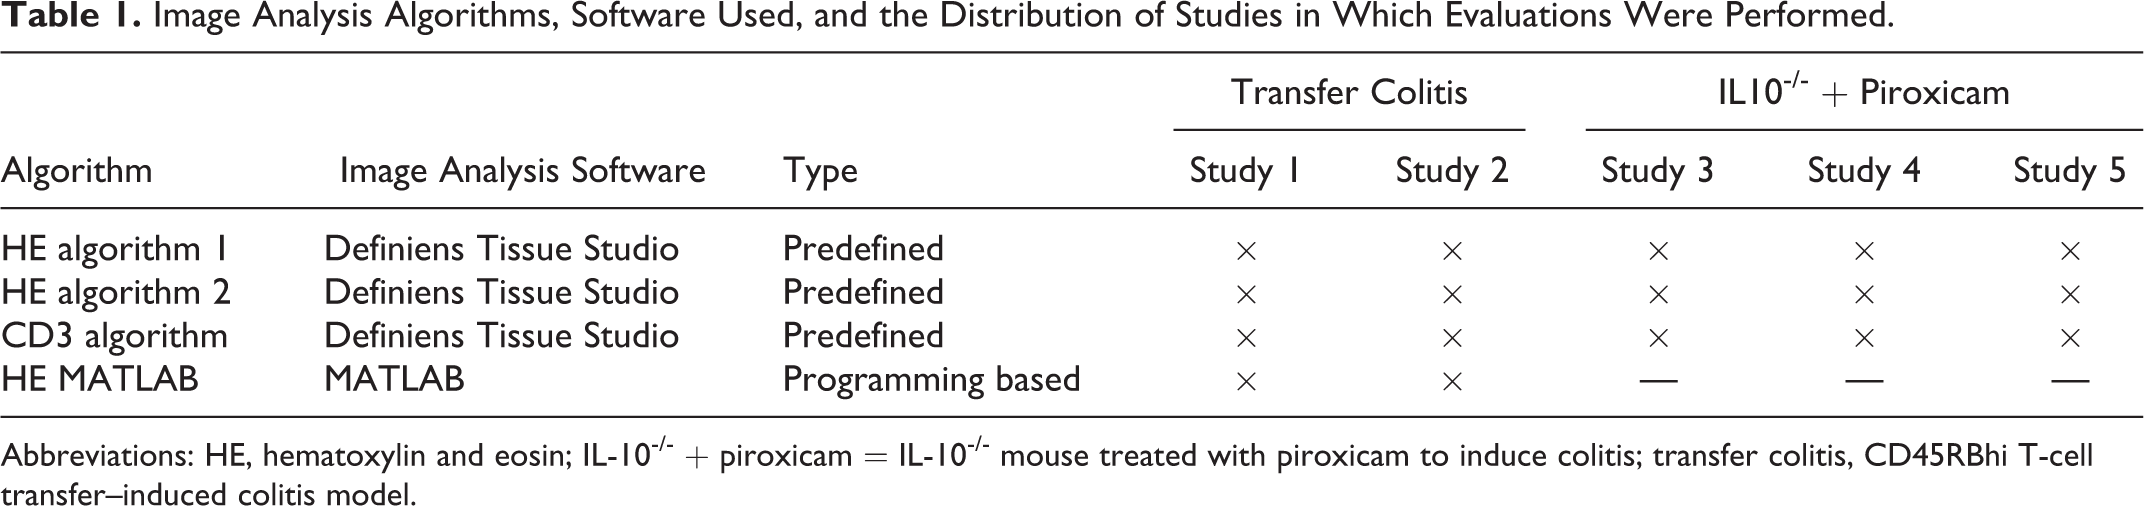
Abbreviations: HE, hematoxylin and eosin; IL-10-/- + piroxicam = IL-10-/- mouse treated with piroxicam to induce colitis; transfer colitis, CD45RBhi T-cell transfer–induced colitis model.
MATLAB is a programming environment with built-in image analysis tools. Scanned slides were analyzed in MATLAB (version R2012b by Mathworks, Natick, MA, USA) as 24-bit RGB images. Tissue areas were identified at 12.5× magnification using standard color thresholding and morphologic operations. Mucosa-specific regions were identified by application of a targeted color normalization algorithm, 10 to adjust the color histogram of all tissue-specific areas to a standardized distribution, followed by standard thresholding and morphologic operations. These regions were then processed at full magnification, again by application of the targeted color normalization algorithm but specifically tuned for mucosa regions. Inside of these normalized mucosal regions, all cell nuclei were identified using a radial symmetry and watershed-based algorithm. 14 Aggregates of small, densely packed cell nuclei associated with infiltrating lymphocytes were identified using standard morphologic operations.
Statistical Analysis
The accuracy of each algorithm was assessed by comparing the percentage inflammation calculated by the image analysis algorithm to the pathologist’s visual score, which is considered the gold standard. Since Gaussian distributions of the data could not be assumed, statistics were performed with nonparametric approaches. Correlations between the algorithm and the pathologist’s scores were calculated with Spearman rho. Group differences were measured with the Mann-Whitney U test, using Bonferroni-adjusted P values to compensate for multiple comparisons. Statistics were performed using MiniTab software (Minitab, Inc., State College, PA, USA).
Results
HE-Based Morphologic Quantification
To develop an inexpensive, high-throughput workflow that would be comparable to visual scoring performed by a pathologist, we initially sought to develop an image analysis algorithm quantifying inflammatory infiltrates in HE-stained tissue sections. Initial algorithm (HE algorithm 1) development was performed on a representative study set of CD45RBhi T-cell transfer–induced colitis. The final algorithm was subsequently run on all study 1 slides, and the percentage colonic inflammation per total colonic tissue area was compared to the pathologist’s score. A modest positive correlation between the quantified percentage inflammation and the pathologist’s score was identified with a Spearman rho value of 0.554 (Table 2, Fig. 2).
Correlation and Corrected Group Differences Between Image Analysis Algorithms and the Pathologist’s Score.
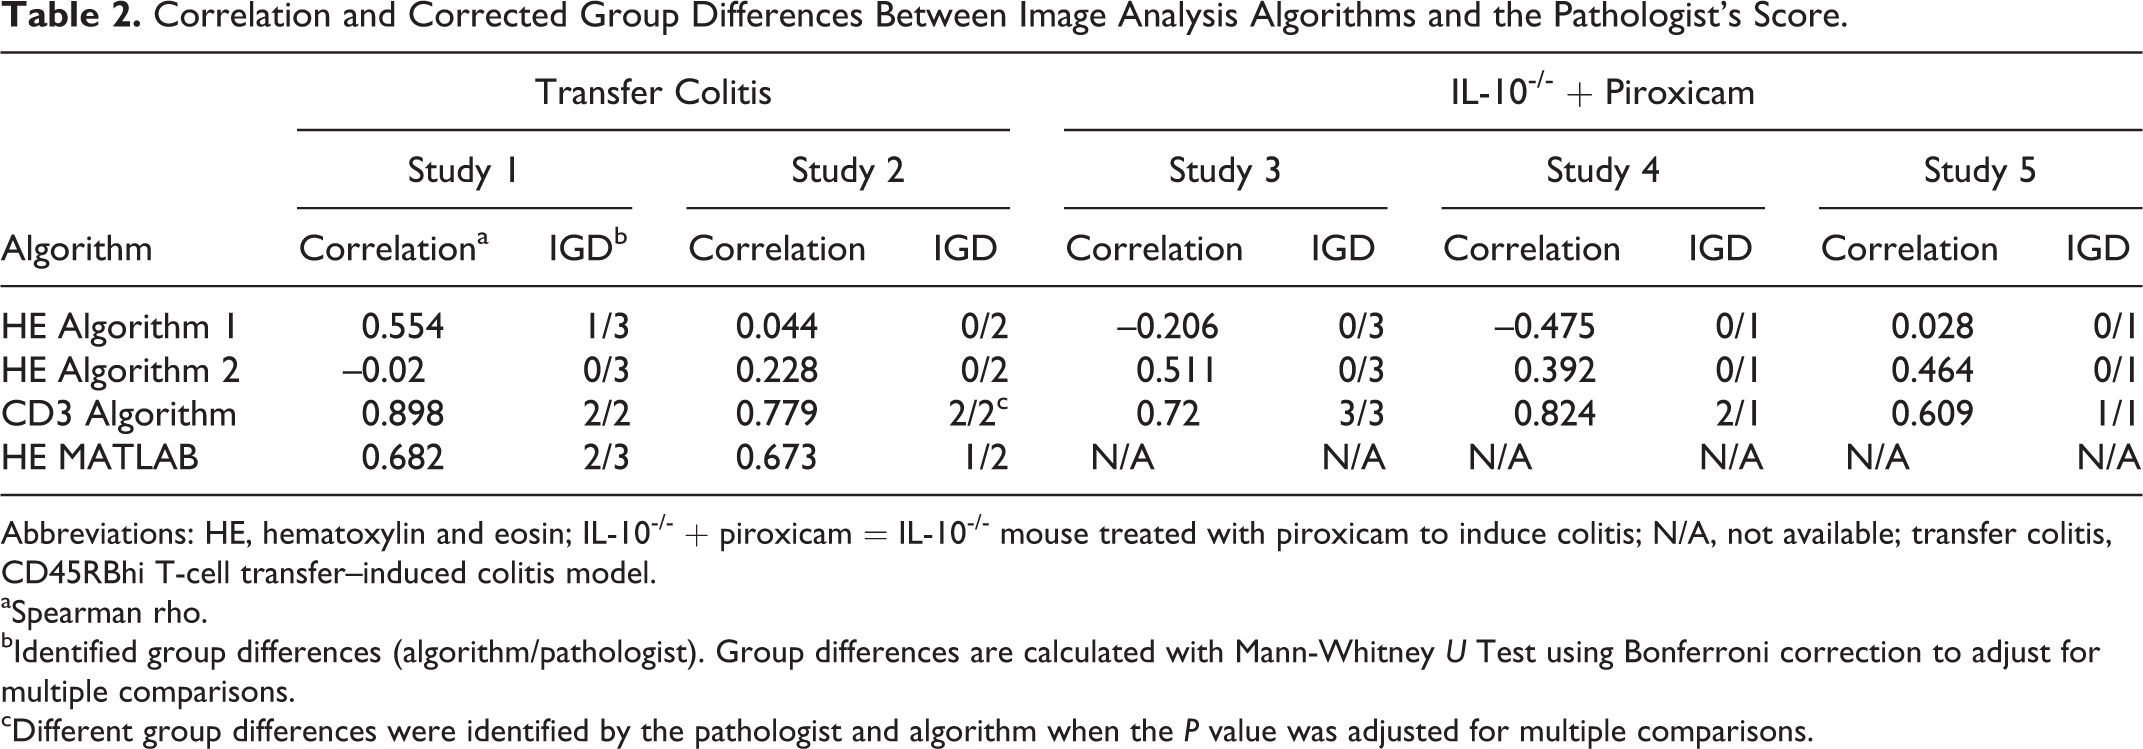
Abbreviations: HE, hematoxylin and eosin; IL-10-/- + piroxicam = IL-10-/- mouse treated with piroxicam to induce colitis; N/A, not available; transfer colitis, CD45RBhi T-cell transfer–induced colitis model.
aSpearman rho.
bIdentified group differences (algorithm/pathologist). Group differences are calculated with Mann-Whitney U Test using Bonferroni correction to adjust for multiple comparisons.
cDifferent group differences were identified by the pathologist and algorithm when the P value was adjusted for multiple comparisons.
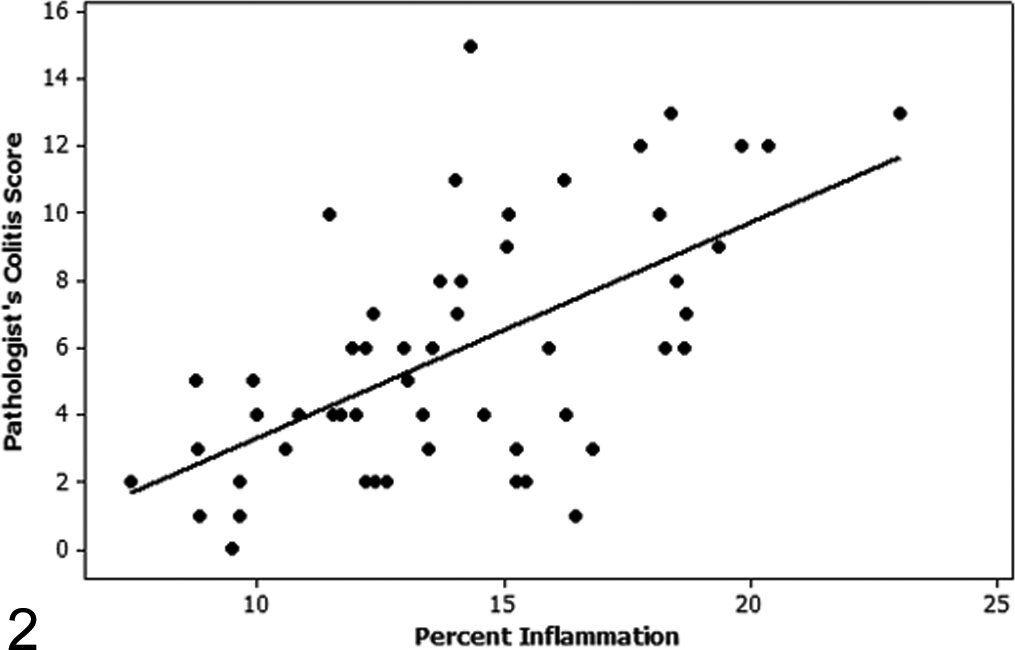
Regression plot of the pathologist’s colitis score versus percentage inflammation as determined by automated quantification using hematoxylin and eosin algorithm 1. There is a moderate correlation (Spearman rho = 0.554) between the pathologist’s colitis score and the automated calculation of percentage inflammation on the initial study used for training.
To characterize how sensitive algorithm 1 was to preanalytic variables, such as variations in hematoxylin staining intensity, image analysis was repeated on 2 sets of step sections from study 1 colons. The level 1 (original tissue sections) and level 2 step sections had similar hematoxylin staining intensities, while level 3 step sections had deeper, more intense hematoxylin staining. There was a moderate correlation between the pathologist’s score and automated assessment of percentage inflammation on level 2 step sections (Spearman rho = 0.577); however, no correlation was identified between the pathologist’s score and assessments of percentage inflammation on level 3 step sections (Spearman rho = 0.084), suggesting that the algorithm is susceptible to variations in preanalytic variables, such as variations in hematoxylin staining (Figs. 3, 4).
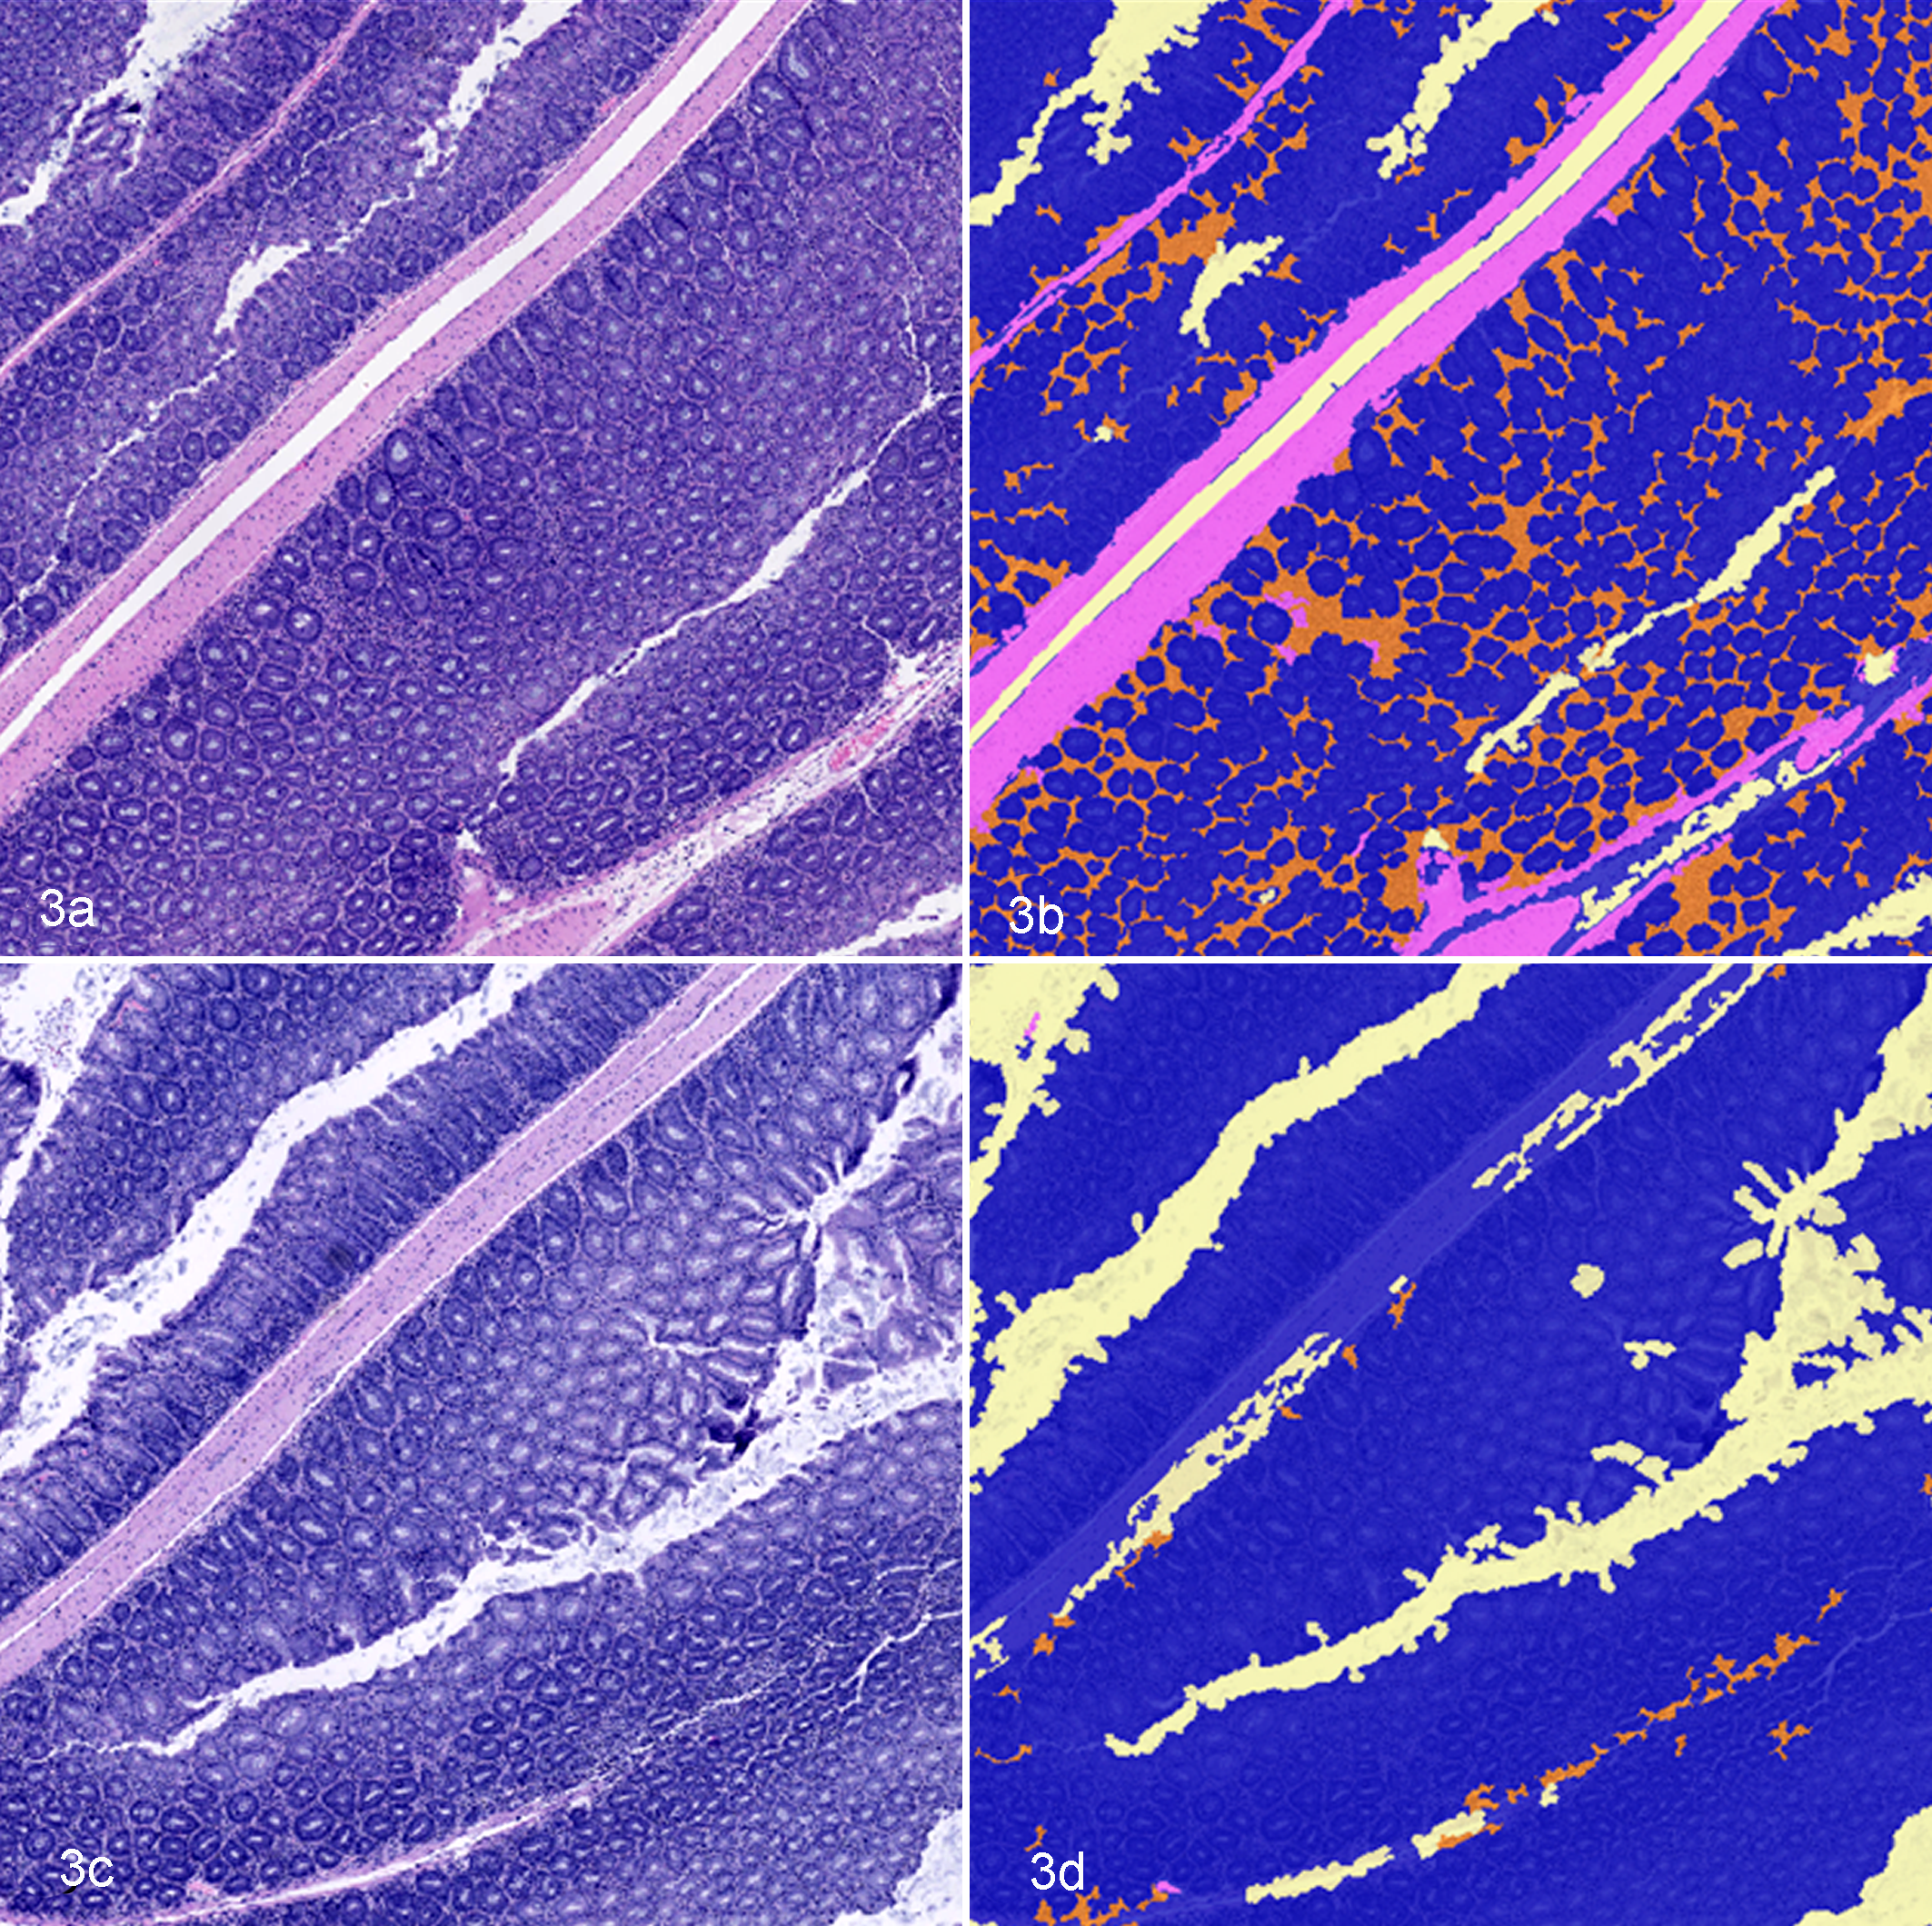
Mouse colon, hematoxylin and eosin (HE)–based automated image segmentation of step sections of mouse colon using HE algorithm 1. Levels 1 and 3 are step sections from the same colon tissue block, but level 3 has more intense hematoxylin staining. (a) Level 1 HE-stained section of colon. (b) Segmentation mask of Figure 3a showing appropriate identification of crypts (blue), inflammation (orange), and muscle (pink). (c) Level 3 HE-stained section of colon. (d) Segmentation mask of Figure 3c demonstrating inappropriate segmentation of tissue features.
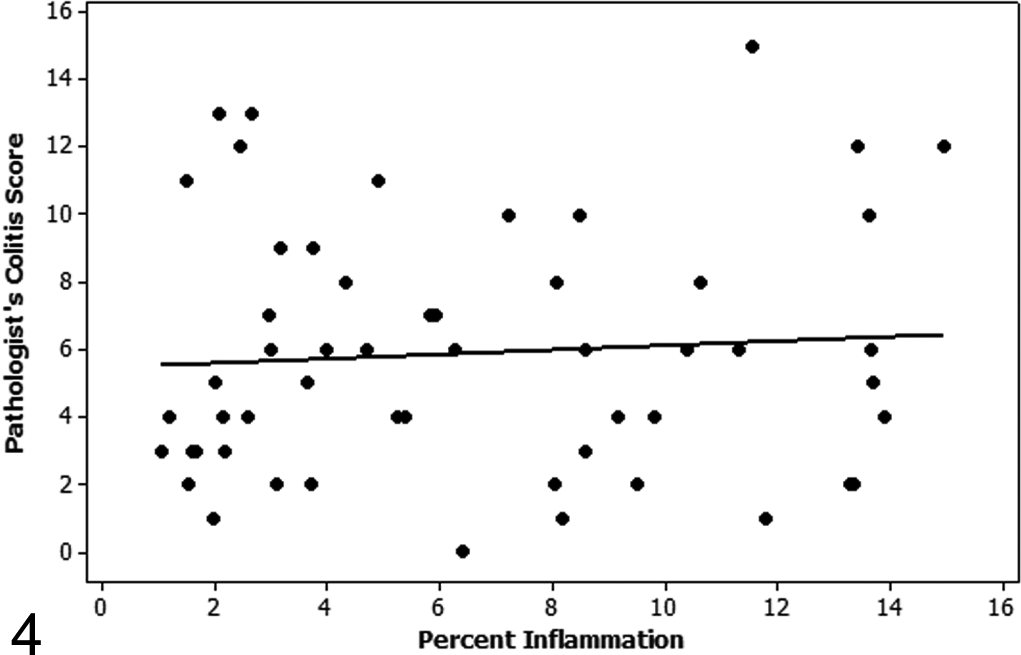
Regression plot of the pathologist’s colitis score versus percentage inflammation as determined by automated quantification using hematoxylin and eosin algorithm 1 on level 3 step sections of study 1. There is no correlation between the pathologist’s score and the automated quantification of percentage inflammation on level 3 step sections of study 1 (Spearman rho = 0.084).
Since a primary goal of developing an image analysis algorithm for assessing colitis models is to develop high-throughput workflows, algorithm 1 was assessed on 4 additional colitis studies, including 1 study of CD45RBhi T-cell transfer–induced colitis and 3 studies of IL-10-/- + piroxicam colitis. Since visual pathologist scores are considered the gold standard for histologic scoring of murine colitis models and are routinely validated by the inclusion of positive and negative control treatment groups, the percentage inflammation identified by algorithm 1 was compared to the pathologist’s visual scores. However, no positive correlations were identified between the pathologist’s score and the algorithm’s calculation of percentage inflammation for any study. The goal of histologic scoring is to identify differences among treatment groups based on the different therapeutic treatments or genetic manipulations used; therefore, group differences identified by the pathologist were compared to group differences identified by the automated algorithm across all 5 studies. Only 1 of 10 group differences identified by the pathologist was identified by the algorithm (Table 2).
Image masks showing the automated image segmentation performed by the algorithm were reviewed to determine common causes for segmentation errors that resulted in the lack of correlation between the pathologist’s score and the automated quantification. Factors that influenced accurate segmentation included variations in crypt morphologies, such as goblet cell numbers, crypt orientation within the plane of section, and the biological state of the crypt and adjacent lamina propria due to inflammation, degeneration, and/or hyperplasia. Tissue handling and processing artifacts, such as foci where tissues were compressed, also affected crypt morphologies.
A second algorithm (HE algorithm 2) was subsequently developed using training slides that were selected to better represent the morphologic diversity observed across all 5 studies evaluated. Training classes for HE algorithm 2 included inflammation, distinct crypts, compressed crypts, lumen, smooth muscle, and mucus/bacteria. The correlations between the algorithm and the pathologist’s score were moderately positive for 2 of 5 studies and weakly positive for another 2 of 5 studies. However, no significant differences were identified by algorithm 2 among treatment groups in any of the studies evaluated (Table 2). As noted for algorithm 1, image masks showing algorithm 2’s image segmentations were reviewed, and they demonstrated consistent segmentation errors that were similar to errors identified with algorithm 1 and that account for the lack of correlation between the pathologist’s score and the automated quantification of inflammation.
Based on the lack of correlation between the gold standard pathologist’s scores and the quantitative image analysis results, as well as the consistent identification of segmentation errors during review of the image segmentation masks, the predefined workflow solution failed to accurately segment and quantify tissue features in HE-stained sections. To assess the limitations of the software versus the limitations of morphologic assessments on HE-stained sections for image analysis, we developed an image analysis algorithm using MATLAB, which is a programming-based image analysis software that is reliant on user-defined segmentation that allows for increased flexibility. The MATLAB algorithm was developed to segment and quantify inflammatory infiltrates in colonic tissue sections. Analyses were performed on tissue sections from the 2 studies of CD45RBhi T-cell transfer–induced colitis and resulted in strong correlations with the pathologist’s score: Spearman rho = 0.682 (study 1) and 0.673 (study 2; Fig. 5). The ability of the MATLAB algorithm to identify differences in the severity and extent of colonic inflammation among treatment groups was evaluated by comparing the differences in treatment groups identified by MATLAB to the group differences identified by the pathologist’s visual score. In study 1, the MATLAB analysis identified 2 of 3 group differences identified by the pathologist and 1 additional group difference that was not initially identified by the pathologist. One of 2 group differences identified by the pathologist was also identified by the MATLAB analysis in study 2. These results demonstrate the improved image segmentation that can be achieved with programming-based software; however, the lack of identification of some group differences also reflects the challenge of performing image analysis on HE tissue sections.
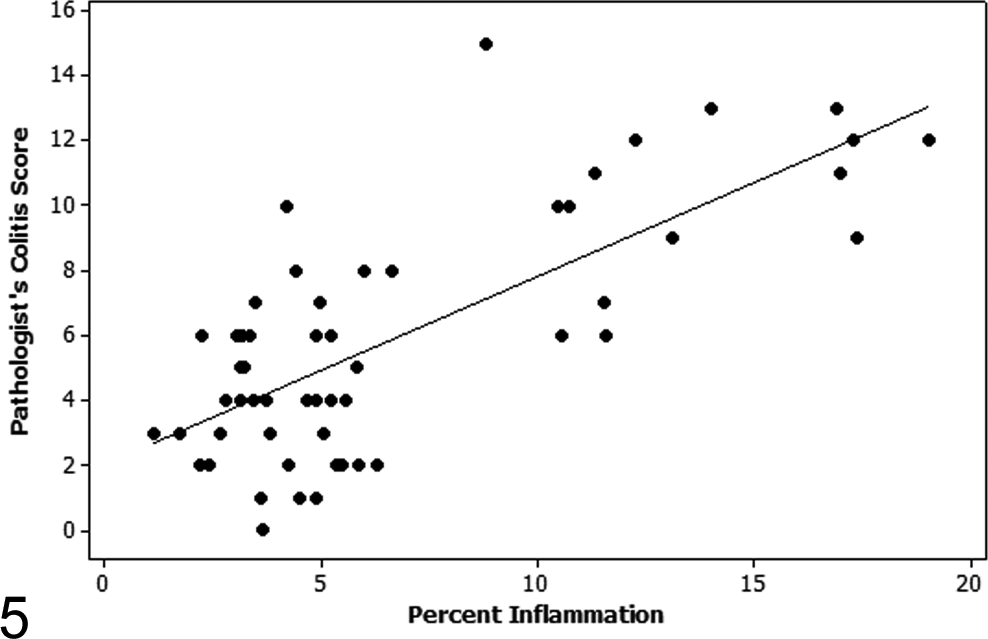
Regression plot of the pathologist’s colitis score versus percentage inflammation as determined by MATLAB automated quantification on study 1 samples. There is a strong correlation (Spearman rho = 0.682) between the pathologist’s colitis score and the automated calculation of percentage inflammation quantified by the MATLAB algorithm.
Quantification of CD3-Positive Cells
Colitis in IL-10-/- mice treated with piroxicam and CD45RBhi T-cell transfer–induced colitis are primarily characterized by mononuclear cell infiltrates in the colonic lamina propria, with changes in crypt and mucosal morphology occurring secondarily. Therefore, it was hypothesized that quantification of percentage CD3 labeling could serve as a biologically relevant and reproducible surrogate for automated colitis scoring. Through the use of Tissue Studio, an automated image analysis algorithm was developed to segment areas with infiltration of CD3-positive cells, crypts, and muscle in sections of mouse colon (Fig. 6). Additional tissue classes for bacteria, lumen, uterus, and shadows from the coverslip were included in the algorithm. Uterus was included in the algorithm since small pieces of uterine tissue were incidentally included in some sections of colon. The percentage of CD3 labeling per total colonic tissue area was compared to the pathologist’s score for each of the 5 study sets; however, only 4 of 6 treatment groups from study 1 were immunolabeled for CD3 and included in this portion of the study. Strong to very strong correlations between the pathologist’s scores and the automated quantification of CD3 labeling were identified in all 5 studies (Table 2, Fig. 7). After adjusting for multiple comparisons, 8 of 9 differences in the severity and extent of colonic inflammation among treatment groups identified by the pathologist were also identified by the automated algorithm (Table 1). In 1 study (study 2), the algorithm and the pathologist each found 1 unique difference among treatment groups that was not identified by the other approach. Additionally, the automated approach identified an additional difference between 2 treatment groups (study 4) that was not found to be significant by the pathologist when the P value was adjusted for multiple comparisons.
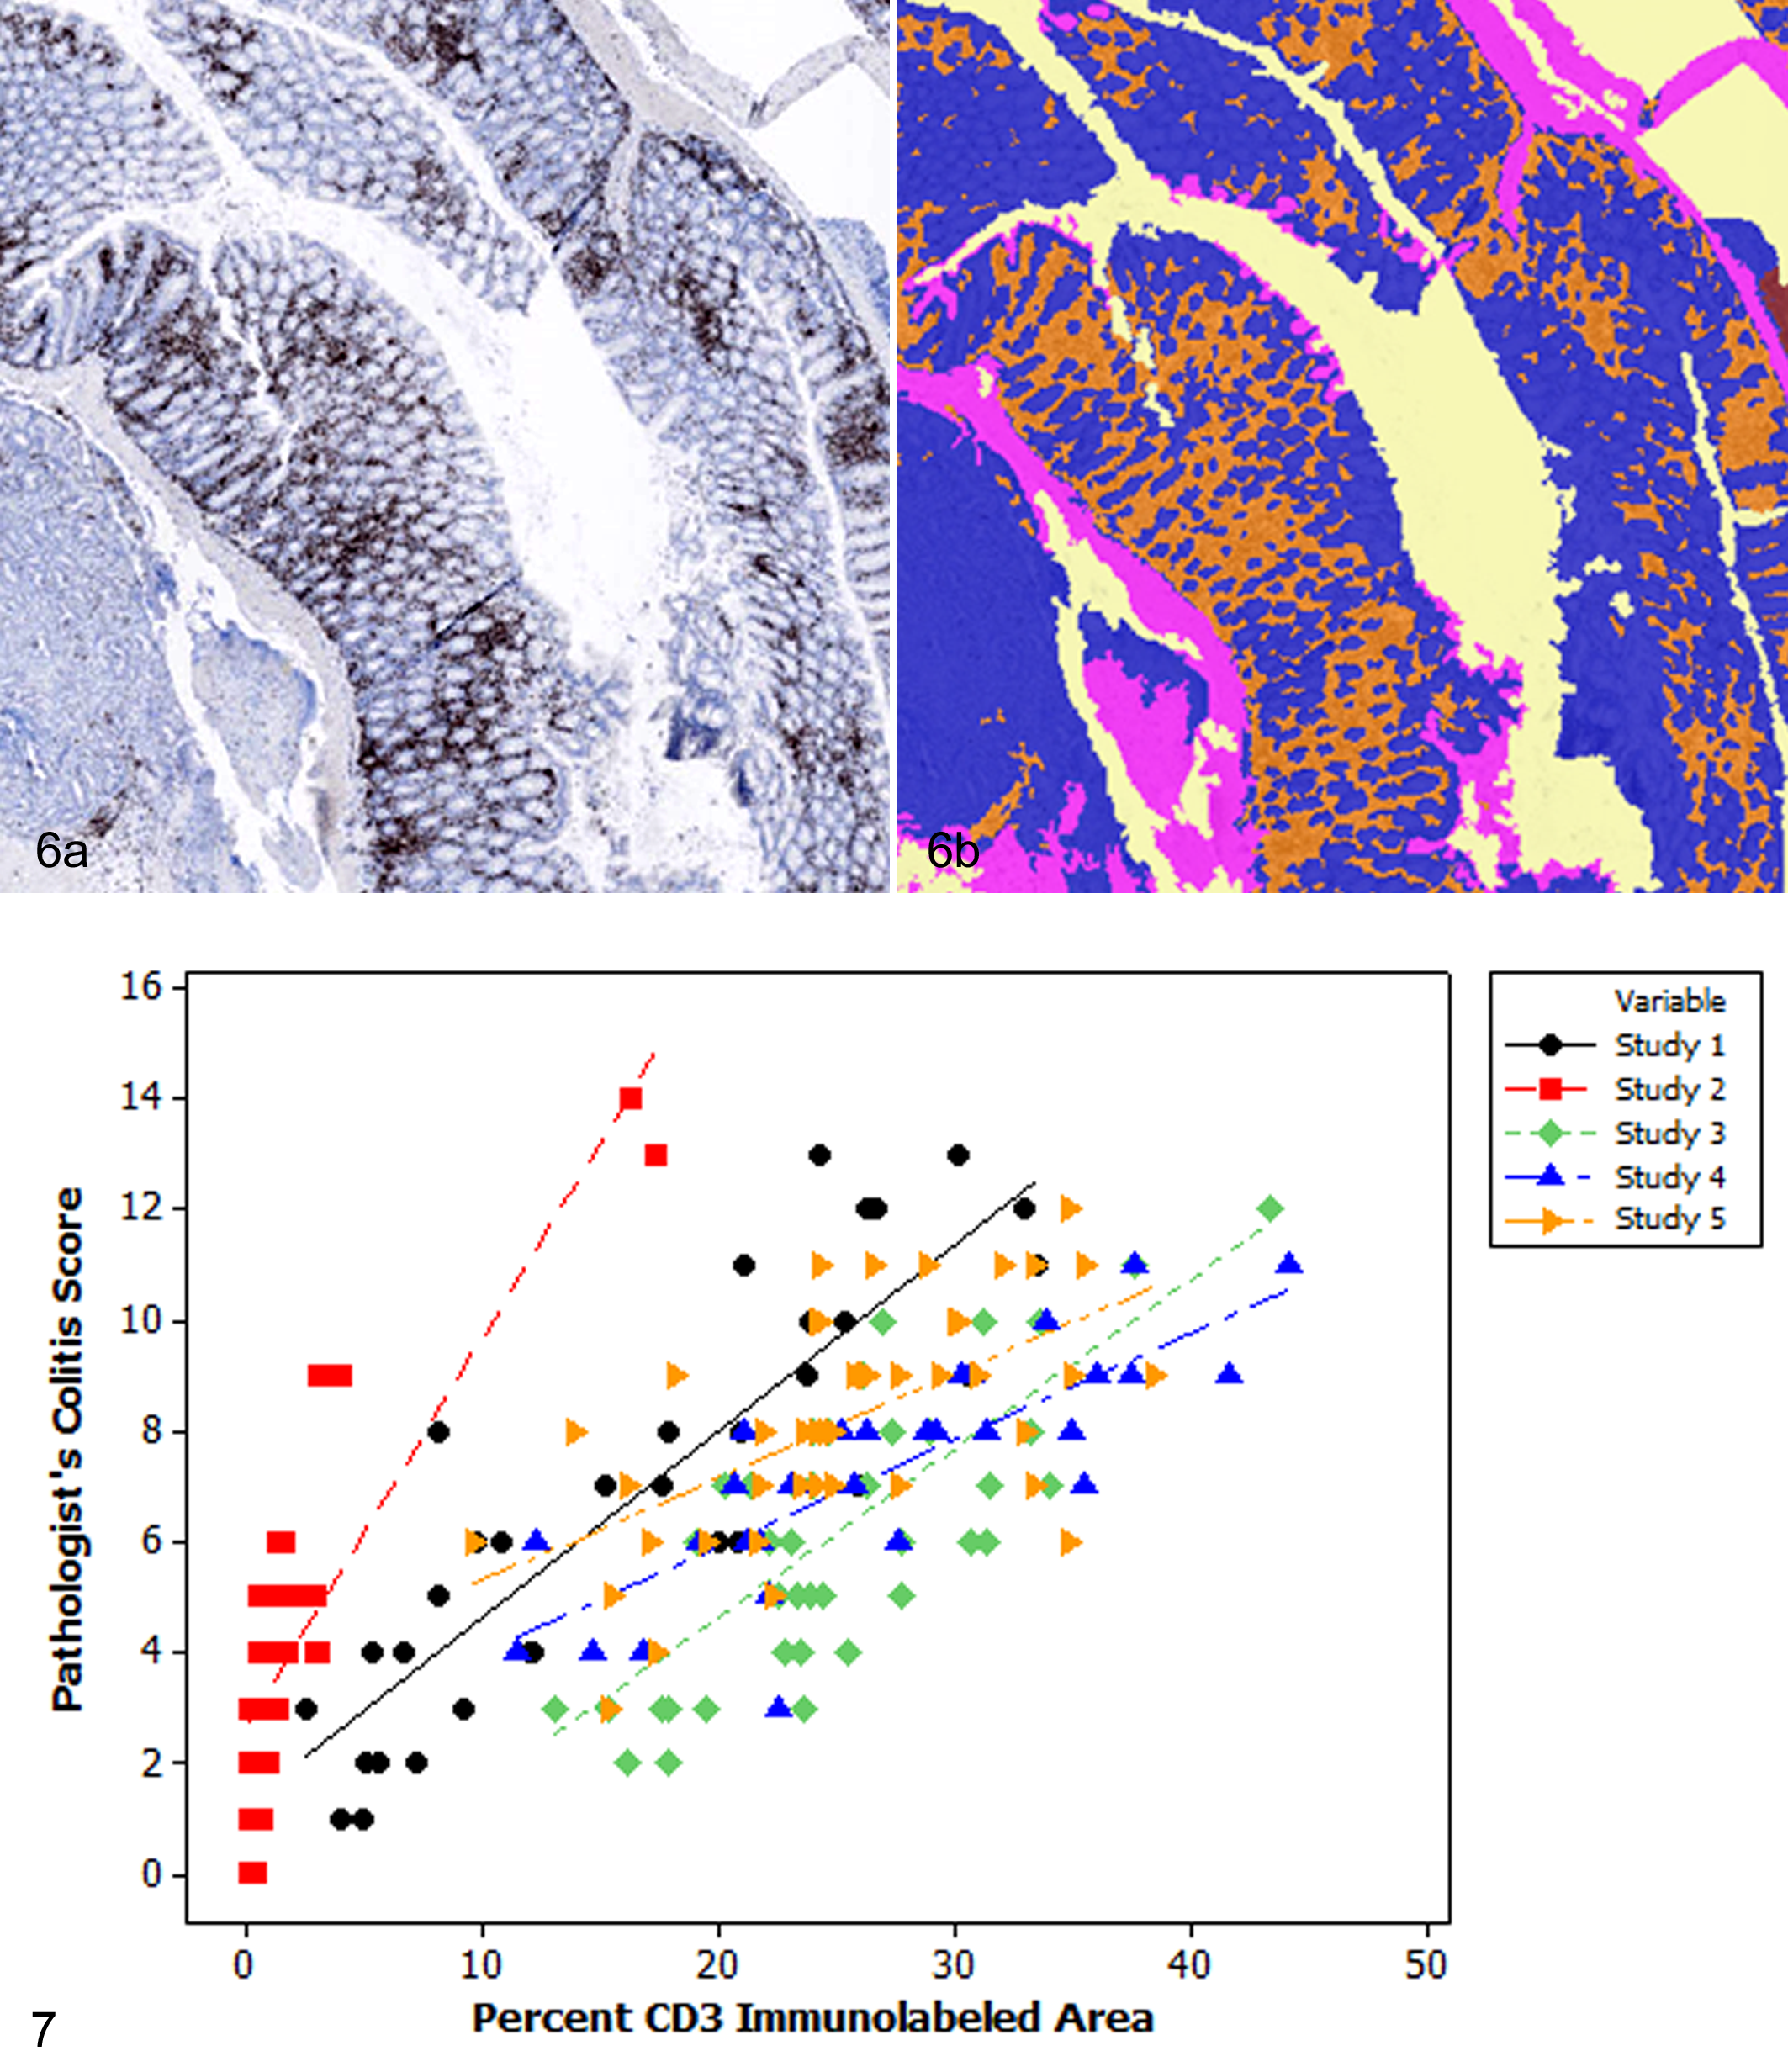
Mouse colon, automated image analysis workflow based on detection of CD3. (a) T-cell infiltrates within the intestinal mucosa. Immunohistochemistry for CD3. (b) Segmentation mask of the colon in Figure 6a demonstrating areas of CD3-positive infiltrates (orange), crypts (blue), muscle (pink), and uterus (red).
Discussion
Mouse models of colitis are routinely used in basic discovery research and in therapeutic development to interrogate mechanistic hypotheses and evaluate preclinical efficacy. 6 Histopathologic scoring by a trained pathologist is often a primary end point of these studies. Although histologic scoring of colitis models is routine and largely reproducible for single pathologists, these assessments are tedious, lack intellectual stimulation, and are inherently subjective, as the pathologist is estimating both the extent and the severity of the lesions. With the advent of whole slide imaging, automated image analysis algorithms are increasingly available and can be readily integrated into high-throughput workflows. In this report, we demonstrated the ability and utility of developing an automated image analysis workflow that is highly correlated with a pathologist’s scoring system—specifically, for colitis models that are primarily characterized by proprial immune cell infiltrations.
An automated approach for scoring the DSS colitis model based on segmentation of HE-stained sections was recently reported. 8 The DSS colitis model is a model of ulcerative colitis that is induced by direct chemical damage to the intestinal epithelium. 5,6 The primary histologic lesions observed in this model include ulceration and loss of crypts with secondary inflammation. 8 This loss of crypts results in a histomorphologic dichotomy between normal and ulcerated mucosa and is therefore amenable to automated histomorphologic segmentation. Since ulceration and crypt loss are relatively infrequent secondary findings in the colitis models evaluated in this study, we sought to develop a unique algorithm to assess the severity of inflammation in these models. Initially, we sought to perform automated analyses on HE-stained sections of colon since these sections are routinely used by pathologists to assess colitis models. Additional benefits of HE-stained sections are that they are relatively inexpensive, are routinely processed by histology laboratories, and can be produced in a relatively high-throughput manner using automated tissue processors and stainers. However, using Tissue Studio, we were not able to create an HE-based algorithm that could accurately and consistently segment colitis lesions across multiple studies, as noted by the poor correlations with the pathologist’s score and the identification of segmentation errors upon review of the image analysis masks. The primary challenges of the HE algorithms were the variability in crypt morphologies, the crypt and inflammatory cell interface, and tissue staining and processing. Pathologists are trained to read through artifacts and staining variability, which allows them to perform reproducible qualitative and descriptive assessments despite variability in staining and tissue processing. 15 However, Tissue Studio relies on object-based segmentation that is defined by user-provided examples. Since this software does not have the contextual experience of a pathologist, it is challenged when objects have variable morphologies and/or the morphologic spectrum of different tissue classes overlap. Similar challenges in segmenting tissues with overlapping histomorphologic features have been reported in segmenting stem cell–derived teratomas. 16
Segmentation of HE sections was improved by developing analysis algorithms in MATLAB. However, even with this software, there were still intrinsic challenges to segmenting the variable morphologic features present in HE sections. MATLAB is an image analysis software that allows the user to develop analysis algorithms using a programming-based language. Since the user is able to define all aspects of the analysis algorithm, this allows for increased flexibility and potentially more intuitive algorithm development. However, this approach also requires user expertise in image segmentation and coding. The results of this study suggest that complex morphology-based image segmentation on HE sections requires the use of programming-based image analysis platforms. If this approach is not available, then histochemical or immunohistochemical surrogates should be identified to facilitate assessments of quantitative endpoints.
To circumvent the challenges observed with the HE-based algorithms, we developed an automated image analysis approach to scoring these colitis models using CD3 immunolabeling as a primary biomarker for disease severity. CD45RBhi and IL-10-/- + piroxicam colitis models are primarily characterized by mononuclear cell infiltrates in the intestinal lamina propria. 3,4,6,8,12 Therefore, CD3 IHC represents a specific biomarker for these models that is a primary morphologic feature of these models and mechanistically linked to pathogenesis. Since CD3 is used as a cell marker, the primary end point being measured is percentage of immunolabeled tissue area per total colonic tissue area and not the intensity of immunolabeling. Therefore, subtle day-to-day variations in labeling intensity and counterstain are less likely to affect the reproducibility of the results. Assessment of cellular infiltrates with cell markers is a clear advantage of chromogenic IHC. In contrast, chromogenic IHC is not suitable for quantitative assessments of protein expression, due to the lack of linear relationship between the chromogen and the protein of interest and its susceptibility to preanalytic variables with rare internal controls. 7 Since a lack of correlation can be due to variability or inconsistent scoring of either the pathologist’s score or the image analysis algorithm, the strong correlation between CD3 quantification and the pathologist’s score also helps to validate the consistency and standardization of the pathologist’s score. Two unique group differences in the severity and extent of colonic inflammation were identified using the Tissue Studio CD3 algorithm that were not identified by the pathologist. For both these differences, the statistical significance of the pathologist’s score was lost after there was control for multiple comparisons. In this study, we used Bonferroni-adjusted P values to control for multiple comparisons. This is a fairly conservative method, so other less stringent methods might have allowed for the identification of additional group differences. However, such stringency has built confidence into our results.
Since automated image analysis workflows standardize the parameters that are used to assess and score histologic sections, there is decreased subjectivity and observer variability associated with these measurements. 15 Standardization of the study design, implementation, tissue processing and handling, and inclusion of control groups are critical if results are to be interpreted across studies. Positive and negative control groups should also be standardized among studies, allowing for a baseline reference by which treatment groups can be evaluated. 6 Not only do control groups serve as the reference or denominator by which treatment groups can be measured across studies, but they are also essential to determine if the study was performed correctly. Familiarity with the expected range and severity of lesions in the control group allows investigators to determine the validity of the results and to identify problems in the experiment should they occur. 6
In this study, we evaluated an image analysis software with predefined workflows, Tissue Studio, to develop segmentation algorithms for mouse colitis models. Software with predefined workflows are often advantageous to pathologists and scientists who do not have expertise in programming and image segmentation nor the available staff to perform such analyses. However, these software packages frequently have more narrow scope and functionality compared to supervised platforms. In this study, we were able to successfully use Tissue Studio to develop an algorithm that could reproducibly and quantitatively assess colitis studies using CD3 immunolabeling as a surrogate biomarker, producing results that were strongly correlated with the pathologist’s scoring system. This study demonstrates that image analysis approaches can be readily incorporated into pathology workflows. However, as noted by the failure of the HE-based algorithms and the success of the CD3 analysis, a key feature to this approach is identifying reproducible and biologically relevant biomarkers to assess disease severity. Additionally, the maximum value of such a biomarker will be gained when experimental design, implementation, and controls are standardized across studies.
Footnotes
Declaration of Conflicting Interests
The author(s) declared no potential conflicts of interest with respect to the research, authorship, and/or publication of this article.
Funding
The author(s) received no financial support for the research, authorship, and/or publication of this article.