
Abstract
E-cadherin, a glycoprotein involved in cell-cell adhesion, has a pivotal role in epithelial-mesenchymal transition, a process through which neoplastic epithelial cells develop an invasive phenotype. In human cutaneous melanomas, decreased E-cadherin expression is associated with shorter survival and increased Breslow thickness, whereas in the dog its role is poorly understood. Tumor thickness and modified Clark level were recently proposed as useful features to assess canine melanocytic tumors, but no studies investigated their association with E-cadherin expression. We performed immunohistochemistry on 77 formalin-fixed, paraffin-embedded primary canine melanocytic tumors. A 3-tier and a 2-tier classification system for assessing E-cadherin expression were tested, with the latter being more informative for the assessment of canine melanocytic tumors. E-cadherin expression was lower in cutaneous melanomas than melanocytomas, as well as in amelanotic tumors compared to pigmented tumors. In amelanotic melanomas, absent E-cadherin expression was associated with an unfavorable outcome, suggesting a potential use of this marker in defining the prognosis of amelanotic melanomas. E-cadherin expression was lower in tumors with greater tumor thickness and modified Clark level ≥IV, suggesting its possible utility in identifying the most invasive tumors. The expression of E-cadherin in oral melanomas was heterogeneous, but was associated with pigmentation and clinical outcome; thus, E-cadherin evaluation could be advantageous to detect the most aggressive neoplasms. However, cutaneous melanomas without E-cadherin expression frequently had a favorable clinical outcome. Hence, its importance as prognostic factor should be carefully considered depending on the tumor origin.
Keywords
Cadherins are a family of cell surface glycoproteins, characterized by a repeated extracellular domain and a cytoplasmic region noncovalently bound to the actin cytoskeleton through association with catenins (p120-catenin, β-catenin, and α-catenin). They form the transmembrane component of adherens junctions, mediating calcium-dependent cell-cell adhesions. 22,27,38,45,62 The different subtypes of classical cadherins (e.g. E-, N-, P-cadherin) are variably expressed depending on the stage of development and on the cell and tissue type. E-cadherin (also known as CDH1 protein) is the most important cadherin in polarized epithelial cells and its loss has a pivotal role in epithelial-mesenchymal transition (EMT) of malignant epithelial tumors. This process involves a series of morphological and biochemical changes in tumor cells, through which they lose their characteristic polarity, develop a mesenchymal phenotype, and acquire aberrant motility. 5,17,62 Although melanocytes derive from neural crest cells and are not epithelial in origin, it is recognized that melanoma cells are able to switch to a more invasive phenotype through a process similar to EMT (termed an EMT-like switch). 1,6,14,15,19,63 E-cadherin is expressed in human normal keratinocytes and in melanocytes and regulates melanocyte growth, dendrite formation, and the expression of cell surface receptors. 16,18,27,62 When E-cadherin expression on human melanoma cells is downregulated, keratinocytes lose their regulatory effect on melanocyte growth; this phenomenon can be reversed by the restoration of E-cadherin expression. 16,27 During human melanoma development, E-cadherin expression is often downregulated, with a substantial loss in neoplastic cells. 8,27,28 It has been recently shown that inhibition of ZEB2 expression, a powerful EMT inducer and one of the most important transcriptional suppressors of E-cadherin, leads to increased E-cadherin expression in melanoma cells and suppression of lung metastasis in C57BL/6 mice. 36 Downregulation of E-cadherin expression is an independent prognostic factor in human melanoma patients, being negatively associated with melanoma-specific, distant-metastasis-free, and overall relapse-free survival. 25 Only a few studies previously investigated E-cadherin expression in canine cutaneous and oral melanocytic tumors. Dysregulation of membrane E-cadherin/β-catenin complexes was previously observed in canine melanoma, 12,13 suggesting an alteration of cell-cell adhesions. The loss of E-cadherin expression in canine melanocytic tumors seems to be independent of the histological characteristics of malignancy; 12 however, further investigations are required to establish whether E-cadherin plays a key role in the progression of canine melanomas and has a prognostic significance.
In human cutaneous melanomas, Breslow thickness is the most important independent prognostic morphologic factor, 9,49 and different studies reported that its increase is significantly associated with E-cadherin downregulation. 18,25,33,35 In dogs, the evaluation of tumor thickness seems to be more appropriate than Breslow thickness, and recent studies demonstrated the association of tumor thickness with histological diagnosis, clinical outcome, hazard of death, and recurrence/metastasis development in canine melanocytic tumors. 24,50
In humans, Clark level 7 evaluates the anatomical level of invasion through the dermis in cutaneous melanocytic tumors and is associated with the frequency of metastasis and death. 34 In our previous study, we demonstrated the applicability of a modified Clark level in the assessment of canine cutaneous melanocytic tumors and its association with histological diagnosis. We suggested its utility especially in the evaluation of ambiguous cases, since the invasion of the deep dermis (IV level) can be set as a cutoff for histological characteristics of malignancy. 50
To the best of the authors’ knowledge, no studies have investigated the association between E-cadherin expression and tumor thickness or modified Clark level in dogs.
Our aim was to evaluate E-cadherin expression in canine melanocytic tumors and its association with the histological diagnosis, relevant prognostic histological features, tumor thickness, modified Clark level, clinical outcome, presence of recurrence/metastasis, overall survival, and disease-free survival time.
Materials and Methods
Sample Selection and Histological Evaluation
Formalin-fixed, paraffin-embedded samples of primary canine melanocytic tumors were selected from the archives of the Department of Veterinary Medicine at University of Perugia and the Department of Veterinary Science at University of Torino (Italy). All samples were submitted by clinicians for diagnostic purposes between 2009 and 2016. The 77 selected samples were independently reexamined by 3 operators (CB, IP, SS). When discordance emerged, the slides were reviewed together to achieve agreement. In all cases, the original histological diagnosis was confirmed. Since oral tumors with few atypical features (“oral melanocytomas”) were rare in our archives, we excluded them from the study and included 23 oral melanomas, 29 cutaneous melanomas, and 25 cutaneous melanocytomas. In order to confirm the melanocytic origin of amelanotic tumors, immunohistochemistry for melan A and PNL2 was performed.
According to the recent literature, 54 samples were reexamined as previously described for assessing the histological features that have recognized or potential prognostic value in canine melanocytic tumors. 50 In particular, the mitotic count was evaluated on 10 contiguous high-power fields (field number of the ocular of 22 mm and a 40× objective), 31 starting from hotspots and avoiding areas with necrosis or severe inflammation. The tumor thickness was measured from the most superficial cell layer to the deepest point of invasion of the tumor, using a ruler applied perpendicularly to the epidermis. In ulcerated tumors, the thickness was measured from the base of the ulcer. 50 To allow proper evaluation of cellular features, tissue sections from heavily pigmented tumors were bleached in 35% H2O2 for 24 hours.
Information about the patient’s survival, local recurrence, regional lymph node or distant metastasis, and the causes of death were obtained from the clinicians by telephone interview. Dogs having received any therapy other than surgery (e.g. chemotherapeutic agents, radiotherapy, immunotherapy) were excluded from the study. When the dog died because of the tumor, the clinical outcome was considered “unfavorable,” while when the patient was alive or dead because of causes unrelated to melanoma it was considered “favorable.” Since cases with recurrence and metastasis were not numerous, we decided to consider them together (recurrence/metastasis) for statistical analyses.
Immunohistochemistry
All samples were deparaffinized, rehydrated, and washed in distilled water. Antigen retrieval was performed by microwave treatment for 20 minutes at the lowest power in a preheated Tris-EDTA 10 mM - 1 mM buffer solution (pH 9.0) for E-cadherin and melan A, or sodium-citrate 10 mM buffer solution (pH 6.0) for PNL2. We blocked endogenous peroxidase using 3% H2O2 in distilled water for 10 minutes at room temperature, washed slides for 10 minutes in Tris-buffered saline (TBS) buffer, and performed endogenous protein blocking for 10 minutes. Sections were then incubated in a humidified chamber for 2 hours at room temperature with the primary antibodies: mouse monoclonal anti-E-cadherin (E-cadherin/CDH1 Antibody, 4A2C7; Invitrogen, Carlsbad, CA) diluted 1:50, 29,44 mouse monoclonal anti-melan A (anti-MelanA antibody [A103-M27C10-M29E3], ab200544; abcam, Cambridge, UK) diluted 1:150, and mouse monoclonal anti-PNL2 (Melanoma Marker Antibody PNL2, sc-59306; Santa Cruz Biotechnology, Santa Cruz, CA) diluted 1:150. 43 Slides were washed in TBS buffer for 10 minutes and incubated with secondary biotinylated goat anti-polyvalent antibody (commercially available kit [Mouse and Rabbit Specific HRP (ABC) Detection IHC Kit, ab93677; Abcam, Cambridge, UK]) for 10 minutes. After washing the slides in TBS buffer for 10 minutes, they were incubated with peroxidase-labeled streptavidin for 10 minutes and washed in TBS buffer for 10 minutes. We used 3-amino-9-ethylcarbazole (AEC Substrate System [Ready to Use], ab64252; Abcam, Cambridge, UK) as chromogen and Carazzi’s hematoxylin as counterstain. Finally, coverslips were mounted with an aqueous medium agent (Aquatex, 1085620050; MerkKGaA, Darmstadt, Germany). Normal canine skin was used as a positive control sample (Supplemental Figure S1); negative control was performed by omitting the first antibody and incubating sections with TBS.
Two board-certified pathologists (CB, IP) blindly and independently assessed the E-cadherin immunolabeling. In the case of disagreement, the pathologists reviewed the slides together to reach a definitive agreement. Slides were evaluated for Percentage of E-cadherin-positive neoplastic cells Intensity of the immunolabeling (absent, mild, moderate, marked) Pattern of expression (membranous, cytoplasmic, or both) and its intensity with respect to cellular localization (low [absent/mild], intense [moderate/marked]) Distribution of the positive cells in the neoplasm (diffuse, multifocal, focal) Spatial localization of E-cadherin-positive cells within the tumor (central, peripheral, diffuse, random)
Furthermore, we applied 2 different classification systems for the evaluation of E-cadherin expression adopted from human medicine. In particular, we used a 3-tier classification system according to Lade-Keller et al 25 classifying E-cadherin expression as absent (≤5% positive neoplastic cells), low (6% to 50%), and high (≥51%). Then, according to Mitchell et al, 33 we scored both percentage of E-cadherin-positive neoplastic cells and intensity of the immunolabeling, obtaining a composite score by adding them together as shown in Table 1. Using this score, we applied a 2-tier classification system, dividing cases into 2 groups considering E-cadherin expression present when the scoring was ≥4 and absent when <4. In order to compare their usefulness in dogs, we considered the association of both classification systems with histological diagnosis as well as relevant or potentially prognostic histological features, clinical outcome, presence of recurrence/metastasis, overall survival, and disease-free survival time.
E-Cadherin Expression Classification Systema.
a The table shows the 2-tier classification system adopted from Mitchell et al. 33
 E-cadherin expression present (scoring ≥4)
 E-cadherin expression absent (scoring <4)
Statistical Analysis
Values were expressed as number and percentage or median with interquartile range (IQR). For verifying assumptions of normality, we used graphic tests; as they were not met, we employed Kruskal-Wallis or Mann-Whitney U test and Spearman correlation coefficient (ρ) to compare continuous variables. Categorical data were analyzed using the chi-square (χ2) test of independence or Fisher’s exact test, goodness of fit test, odds ratio (OR), and log-linear model. For multiple comparisons, we reported Bonferroni-adjusted P values. We used Kaplan-Meier curves and the log-rank test to compare overall survival and disease-free survival time according to histological diagnosis and E-cadherin expression. We further evaluated its prognostic significance, by the univariate Cox proportional hazard model (Cox regression) and expressed it as hazard ratio (HR) with corresponding 95% confidence intervals (CIs) and P values (from Wald statistics). Statistical analysis was performed using SPSS 23.0 (SPSS Inc, Chicago, IL) and the software R (R version 3.5.2); 42 P values ≤.05 were considered statistically significant. The raw data analyzed in this study are not available.
Results
Sample Population
We examined 77 cutaneous and oral canine melanocytic tumors, consisting of 23 oral melanomas, 29 cutaneous melanomas, and 25 cutaneous melanocytomas. Signalment information was in some cases incomplete; most of the dogs were mixed breed (24/74, 32%), followed by German shepherd (7/74, 10%), Rottweiler (5/74, 7%), dachshund (4/74, 5%), and other breeds (34/74, 46%). The percentage of males was significantly higher than females (45/72, 63%, and 27/72, 38%, respectively; P = .034). Median age was 10.5 years (IQR = 8–12 years) and dogs with oral melanomas were significantly older than those with cutaneous melanocytomas (median = 12 years, IQR = 10–14 years, and median = 8.5 years, IQR = 7–10 years, respectively; P ≤ .05). No association was seen between the completeness of surgical margins (sufficient/insufficient) and the histological diagnosis, clinical outcome, presence of recurrence metastasis, overall survival time, or disease-free survival time (P > .05).
Characterization of E-Cadherin Expression
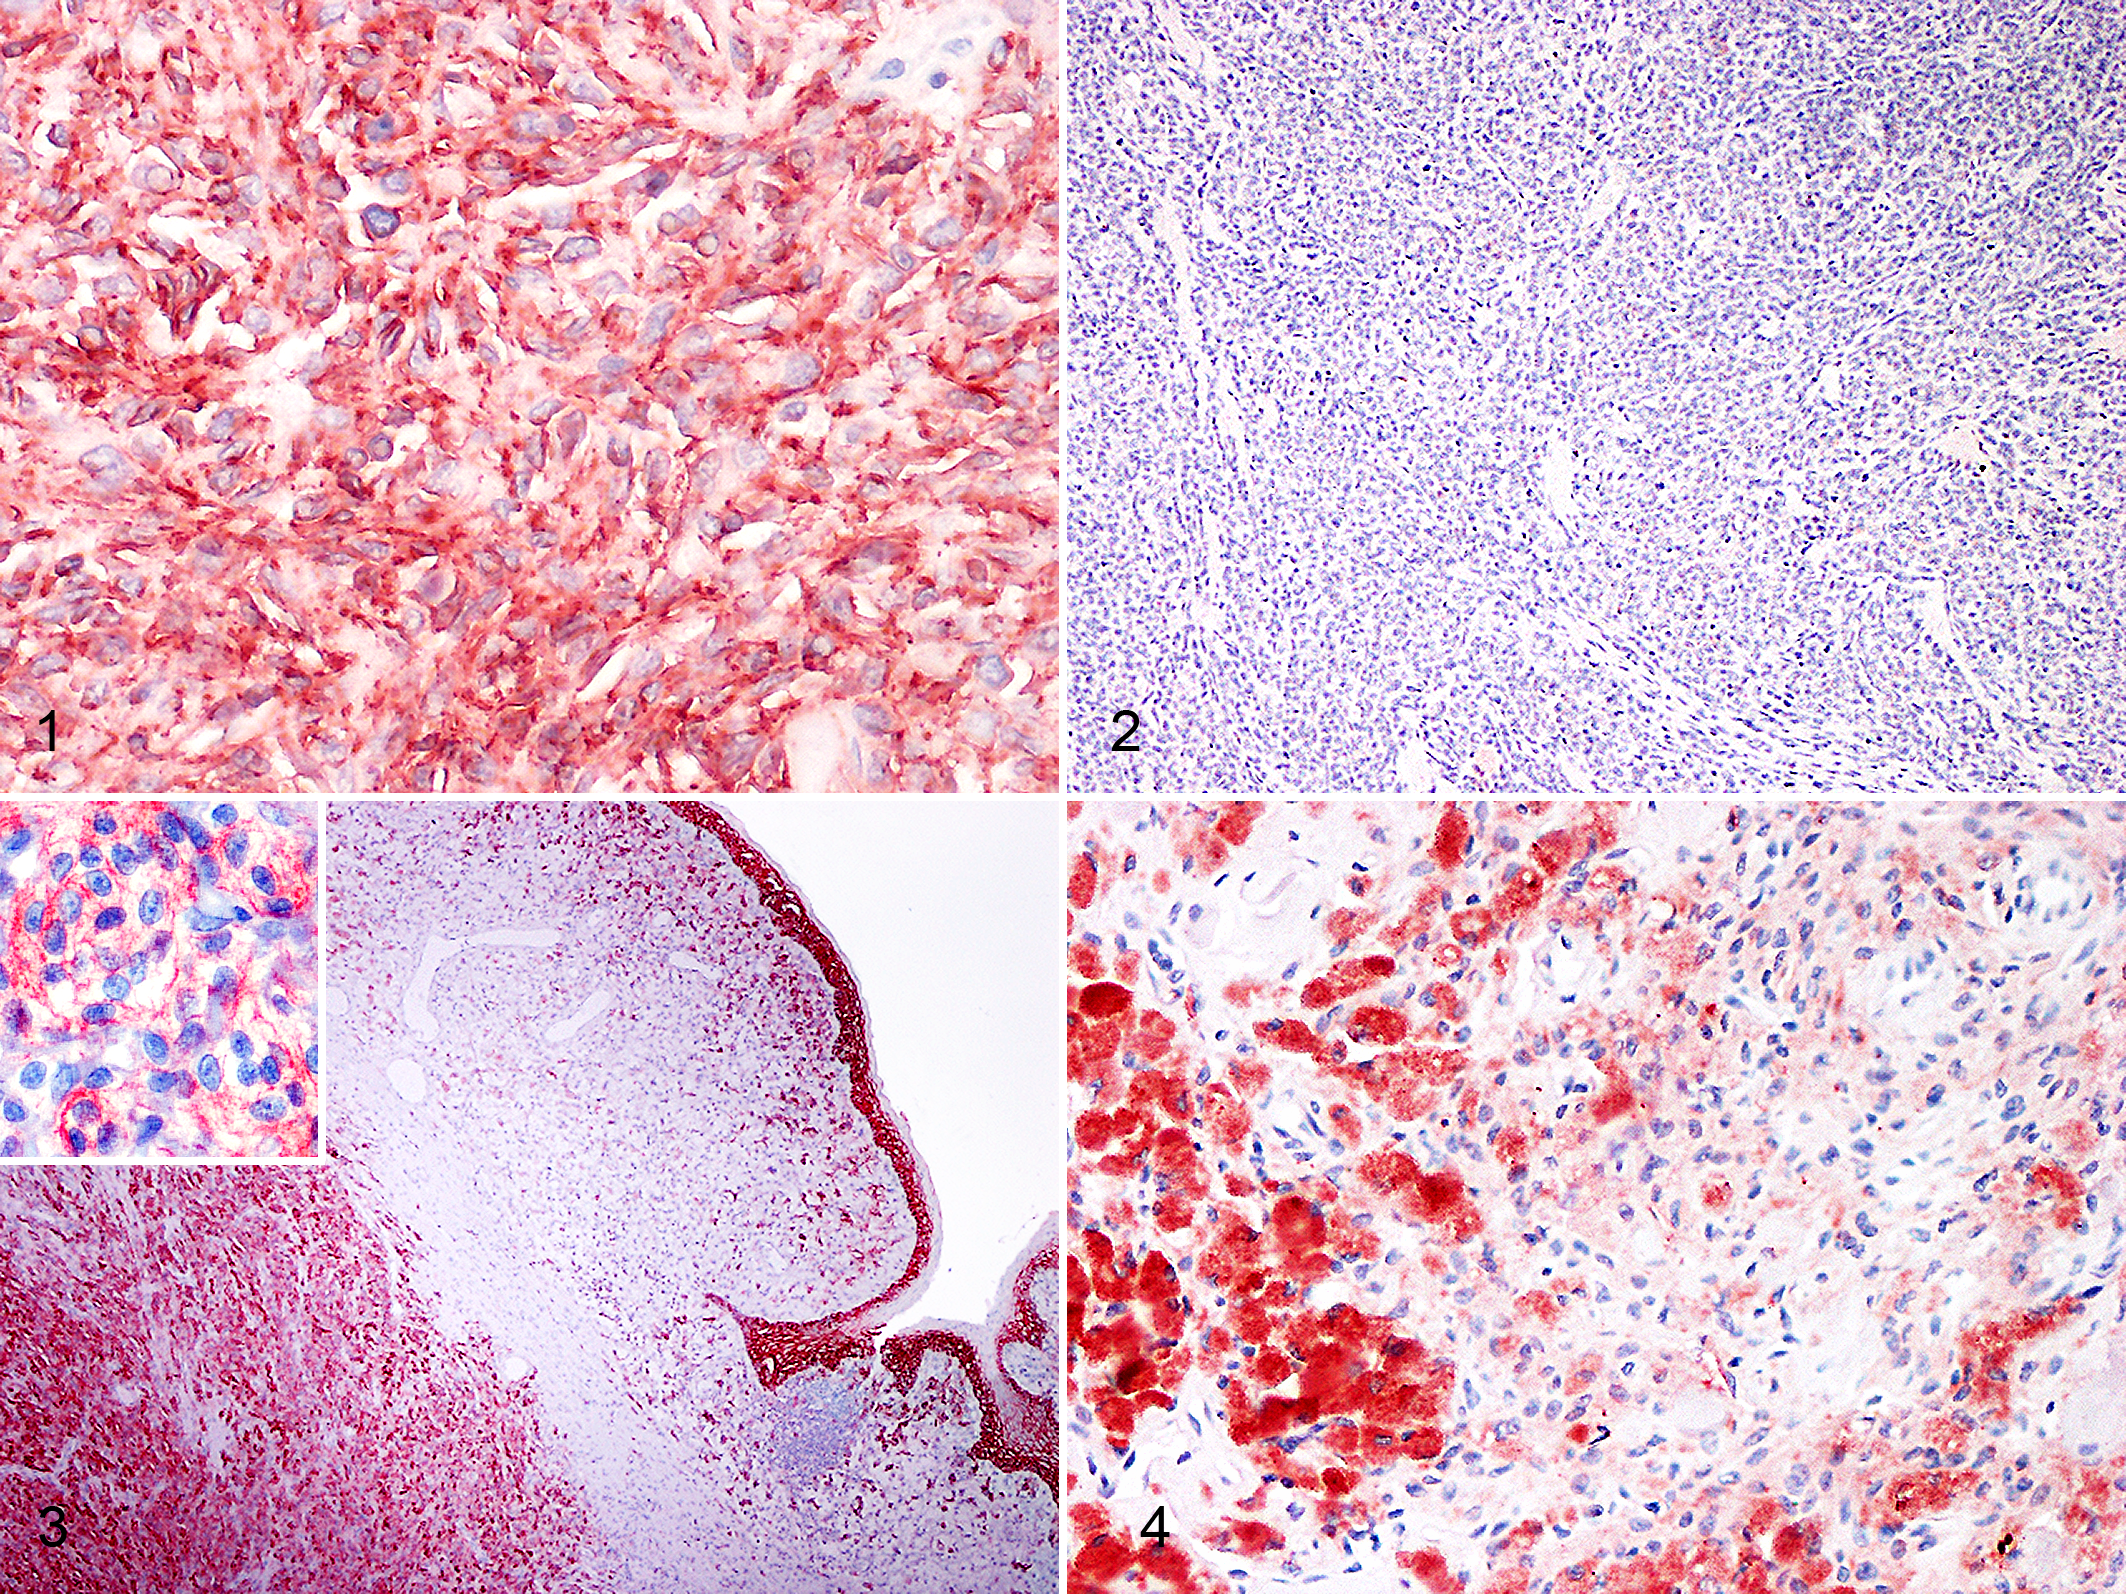
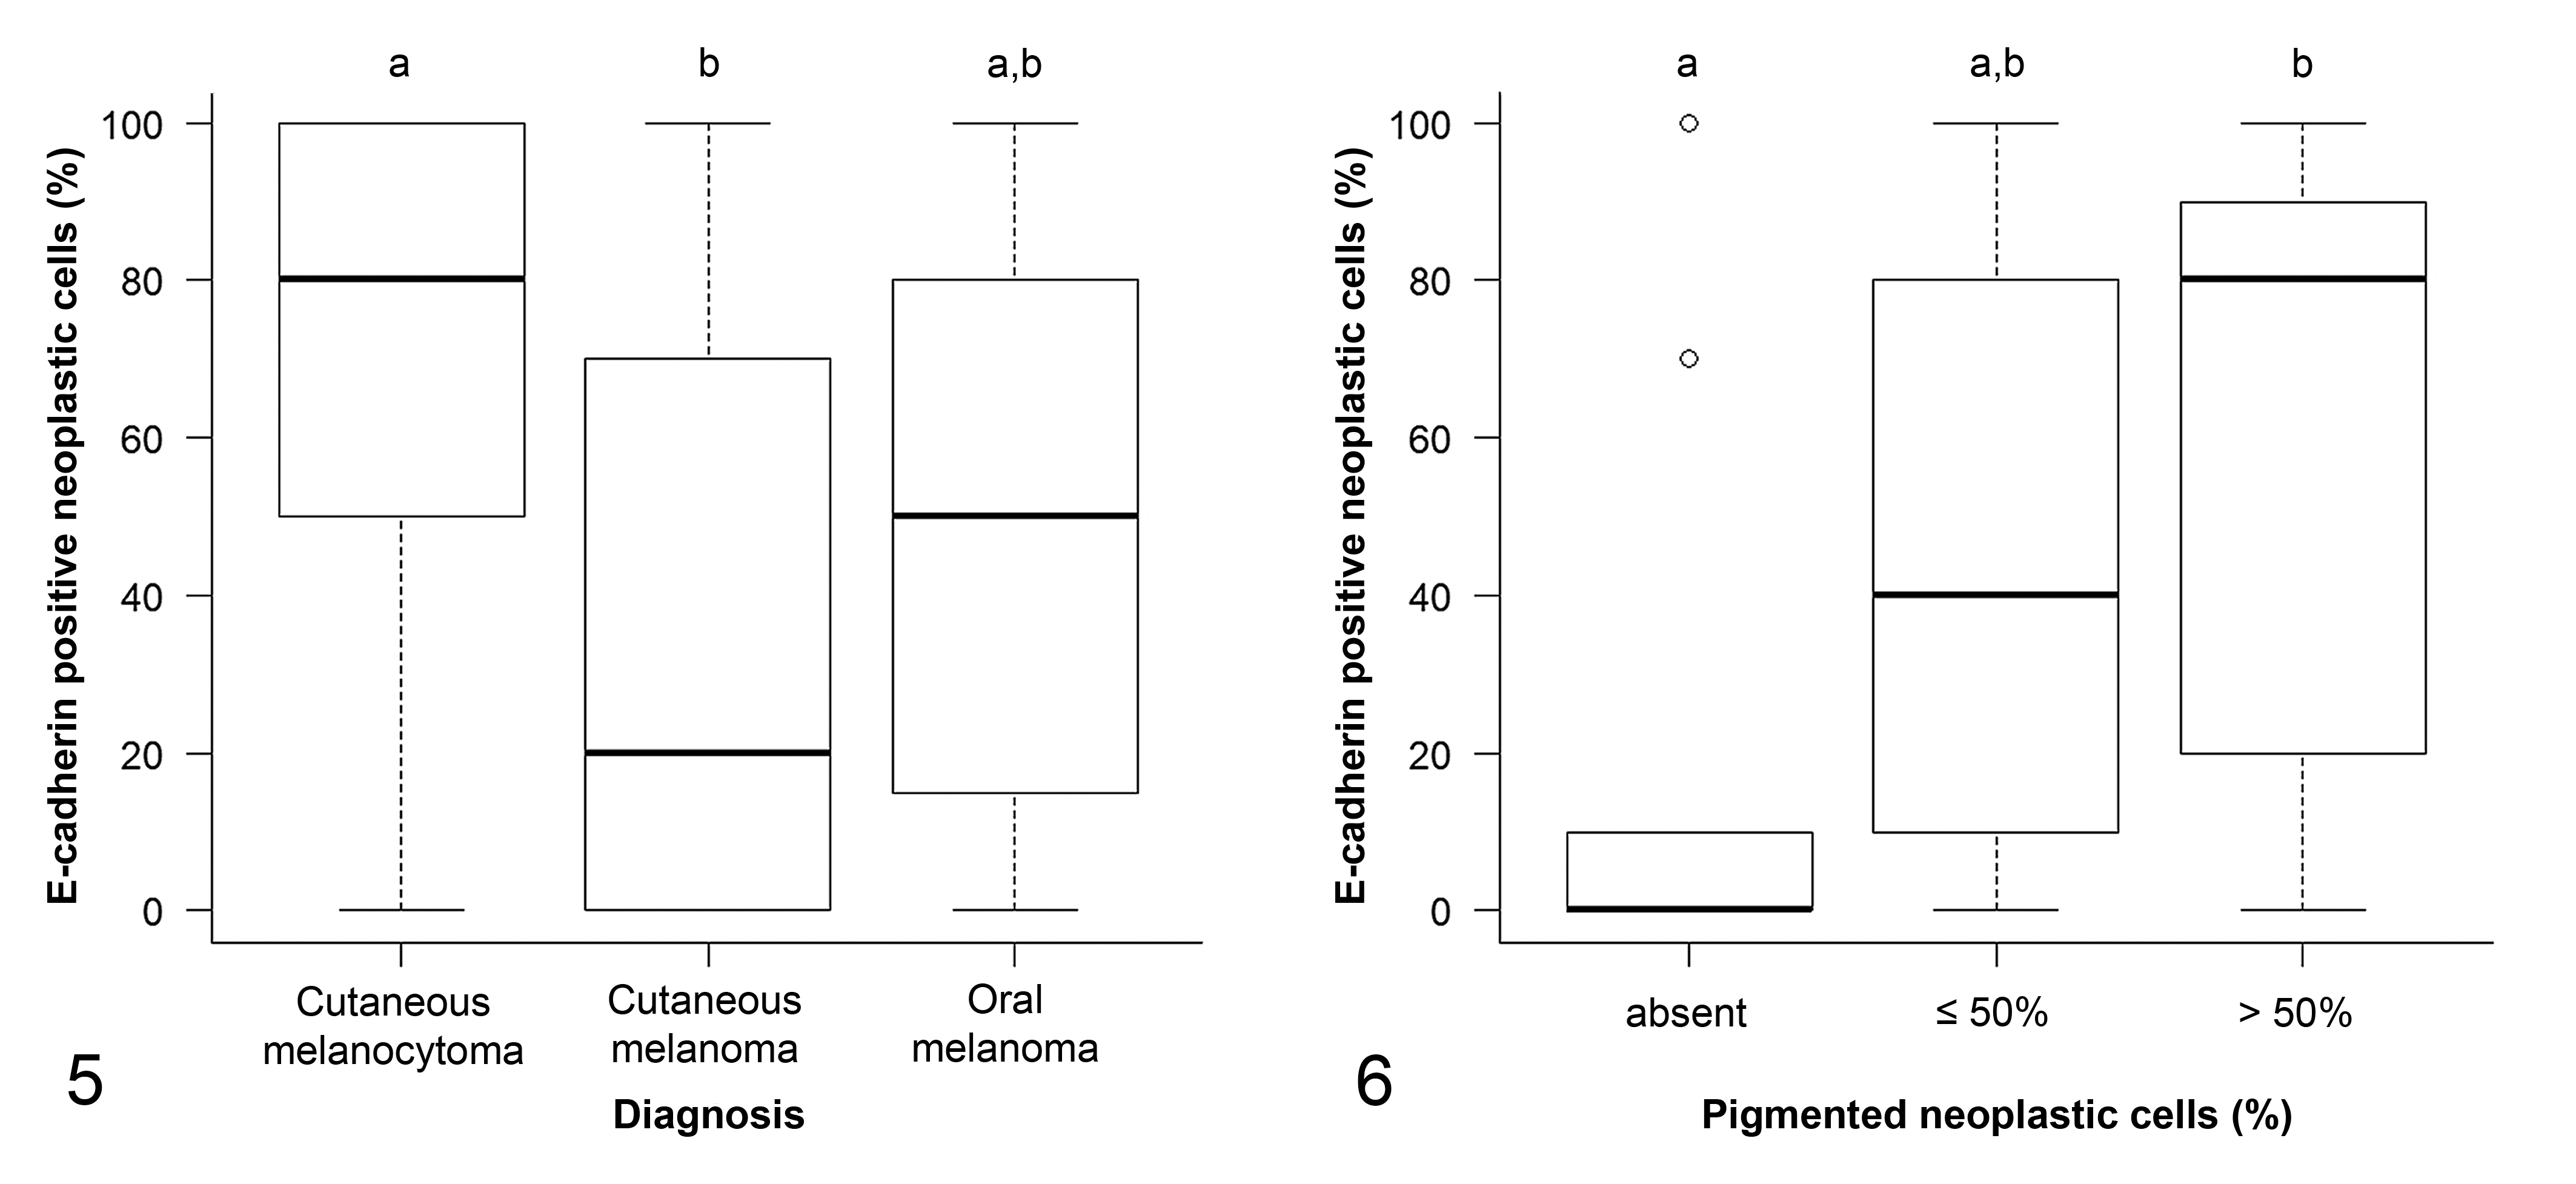
Representative images and details on E-cadherin expression are shown in Figures 1 to 4, Table 2, and Supplemental Table S1. The percentage of E-cadherin-positive neoplastic cells was significantly associated with histological diagnosis (P = .009; Supplemental Table S1). Specifically, the percentage of E-cadherin-positive neoplastic cells was higher in cutaneous melanocytomas than in cutaneous melanomas (P ≤ .05), while oral melanomas did not differ from benign nor malignant cutaneous tumors (Fig. 5). Conversely, the intensity of the immunolabeling was similar in all melanocytic tumors (P = .487).
Characterization of E-Cadherin Expression*.
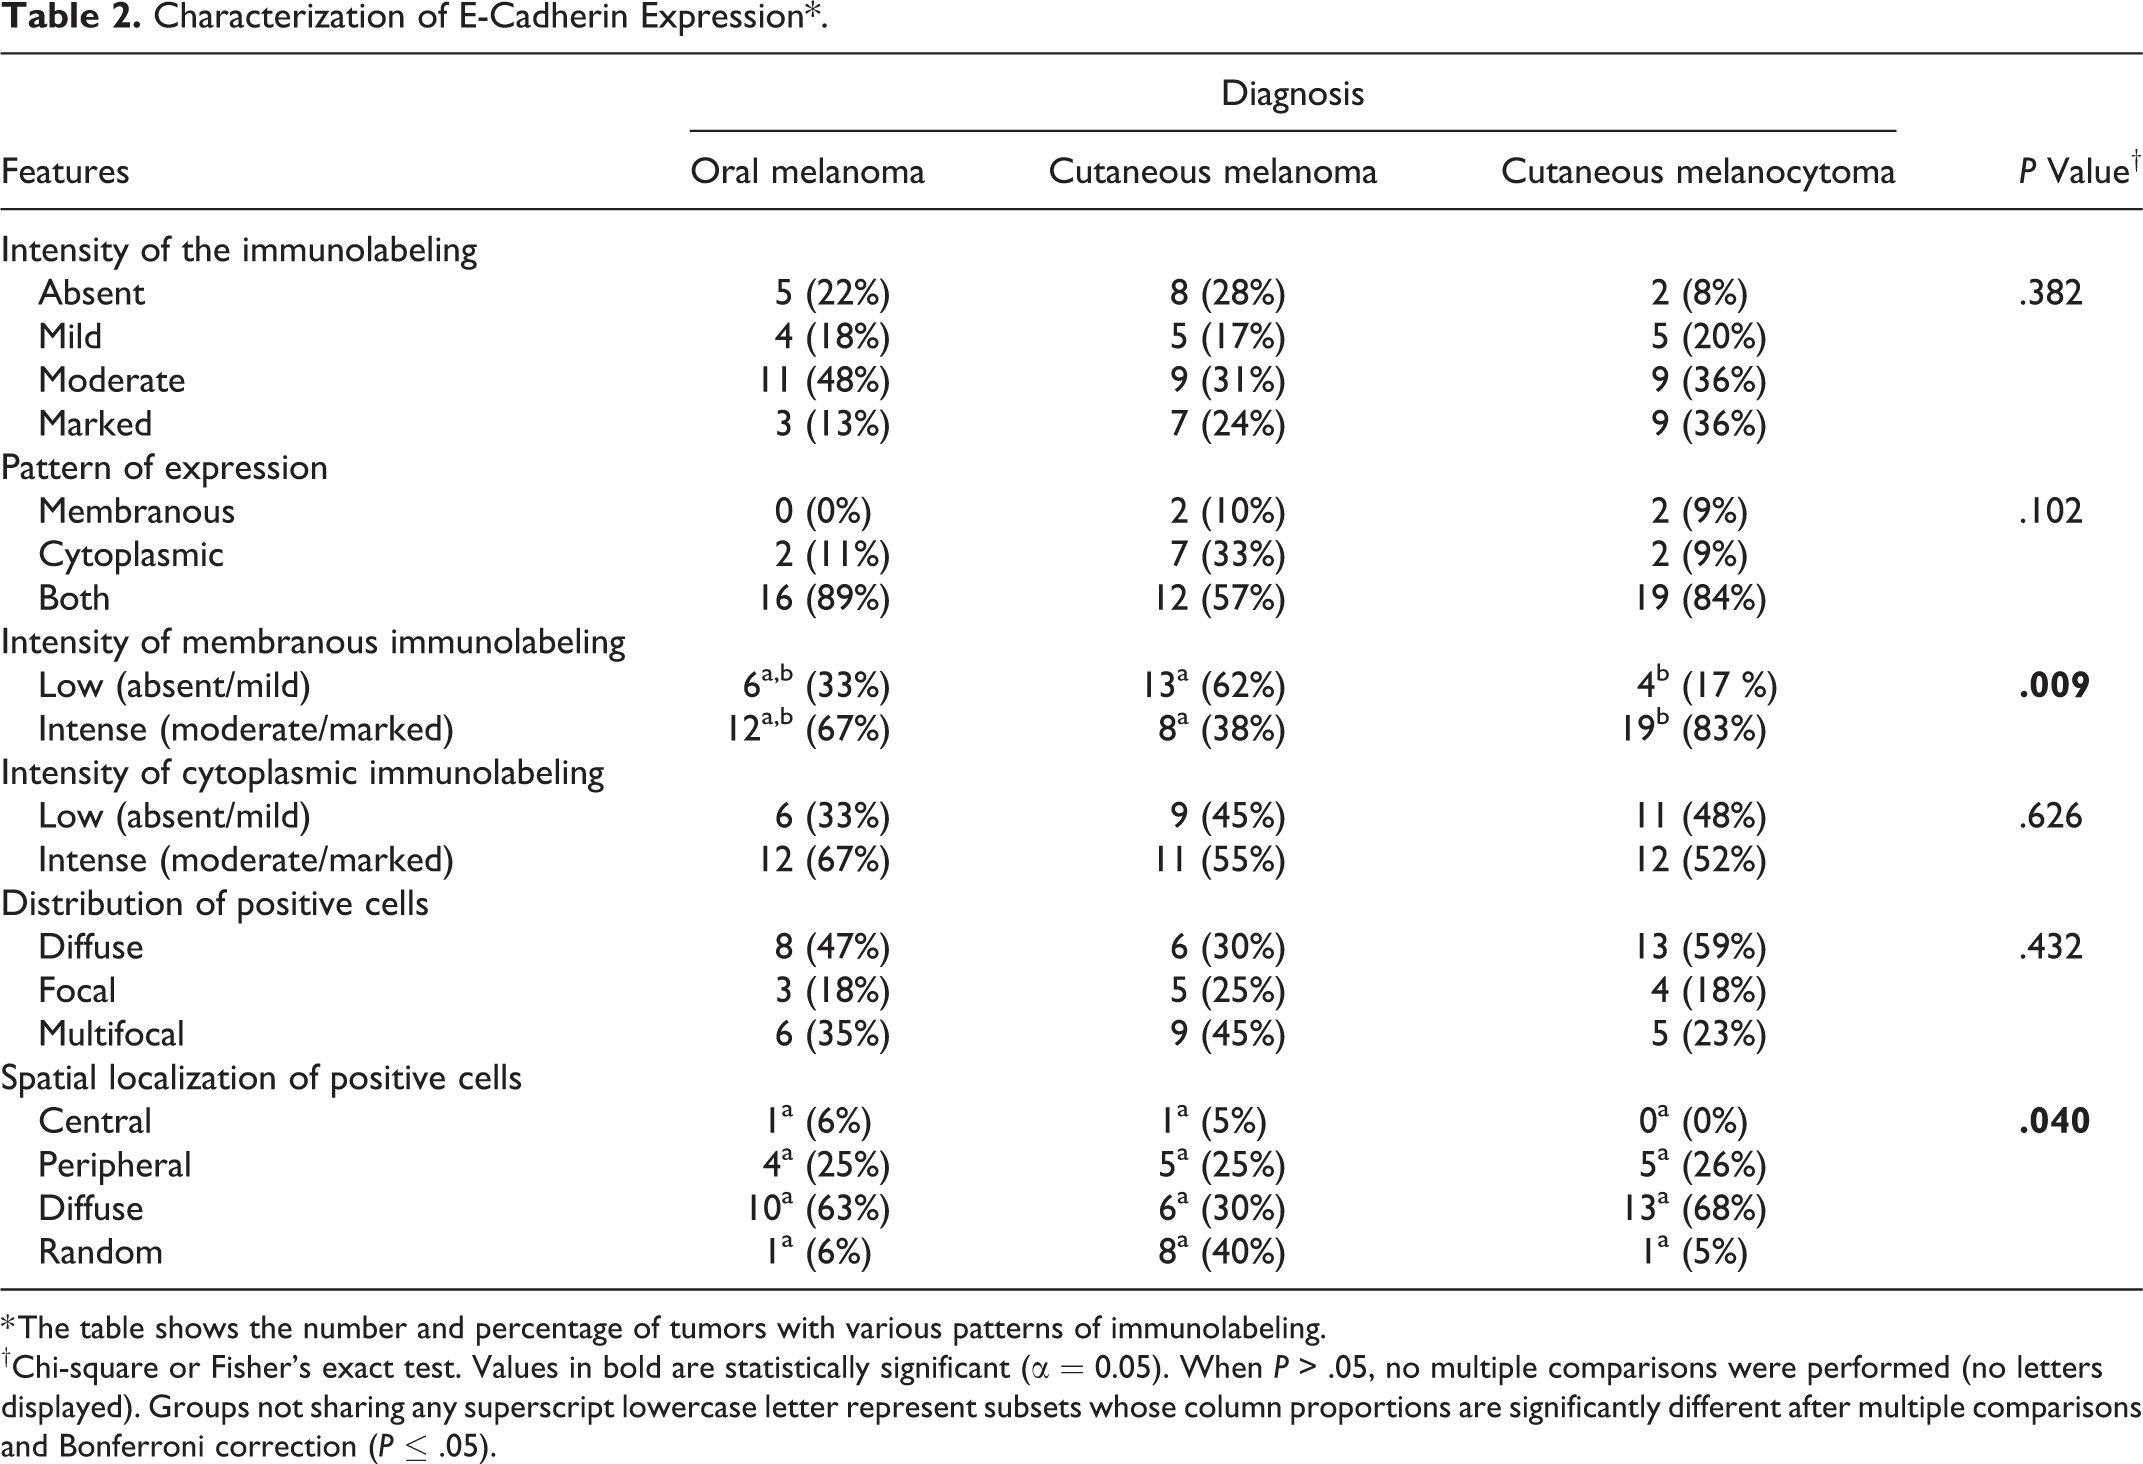
* The table shows the number and percentage of tumors with various patterns of immunolabeling.
†Chi-square or Fisher’s exact test. Values in bold are statistically significant (α = 0.05). When P > .05, no multiple comparisons were performed (no letters displayed). Groups not sharing any superscript lowercase letter represent subsets whose column proportions are significantly different after multiple comparisons and Bonferroni correction (P ≤ .05).
E-cadherin expression was membranous, cytoplasmic, or both, but there was no association between cellular localization and the histological diagnosis (P = .102). In the majority of the tumors, E-cadherin was expressed in both membranous and cytoplasmic (only 4/62 tumors had exclusively membranous immunolabeling).
The intensity of membranous immunolabeling was significantly associated with histological diagnosis (P = .009). Namely, most cutaneous melanocytomas (19/23, 83%) had more intense membranous immunolabeling compared to cutaneous melanomas (P ≤ .05). Oral melanomas tended to have intense membranous immunolabeling (12/18, 67%); however, there were no significant differences in the intensity of membranous immunolabeling when compared to cutaneous melanomas or melanocytomas (P > .05).The intensity of cytoplasmic immunolabeling (P = .626) or the distribution of the positive cells in the neoplasm (P = .432) were not associated with histological diagnosis.
The spatial localization of E-cadherin-positive neoplastic cells within the tumor was significantly associated with the histological diagnosis (P = .040): cutaneous melanocytomas tended to have a higher proportion of cases with a diffuse E-cadherin localization (13/19, 68%) and a lower proportion with a random localization (1/19, 5%) when compared to cutaneous melanomas (6/20 [30%] with diffuse localization, and 8/20 [40%] with random localization). Nonetheless, the differences between these groups were not significant after Bonferroni correction. The frequencies of tumors with central or peripheral localization of E-cadherin-positive neoplastic cells were similar among all groups.
Associations With Histological Features and Outcome
Subsequently, we investigated the association between the percentage of E-cadherin-positive neoplastic cells with relevant prognostic histological features, clinical outcome, and the presence of recurrence/metastasis (Supplemental Table S1). The percentage of E-cadherin-positive neoplastic cells was associated with the percentage of pigmented cells (P = .006). Specifically, the percentage of E-cadherin-positive neoplastic cells was lower in amelanotic tumors than in those with >50% of pigmented cells (P ≤ .05; Fig. 6). The percentage of E-cadherin-positive neoplastic cells was also significantly lower in necrotic tumors (P = .045). The percentage of E-cadherin-positive neoplastic cells tended to be lower when the mitotic count or tumor thickness were higher, although the differences were not statistically significant (P = .059 and P = .053, respectively). Finally, tumors with dichotomous modified Clark level <IV tended to have a higher percentage of E-cadherin-positive neoplastic cells than those with modified Clark level ≥ IV (P = .057).
No associations with any other histological feature, clinical outcome, nor recurrence/metastasis were seen.
E-Cadherin Expression in Oral Melanomas
E-cadherin expression in oral melanomas did not differ significantly from the expression in cutaneous melanomas or melanocytomas, and showed intermediate characteristics between them. Therefore, we investigated whether it was possible to identify subgroups of oral melanomas with different E-cadherin expression depending on relevant prognostic histological features. The percentage of E-cadherin-positive neoplastic cells in oral melanomas was associated with the percentage of pigmented cells. Namely, amelanotic tumors had a lower percentage of E-cadherin-positive neoplastic cells when compared to the pigmented tumors (P = .014; Fig. 7). No other associations emerged when we divided oral melanomas according to the other histological features. We could not further investigate whether the subgroup of amelanotic oral melanomas had a different biological behavior, since our samples were too few to perform survival analysis.
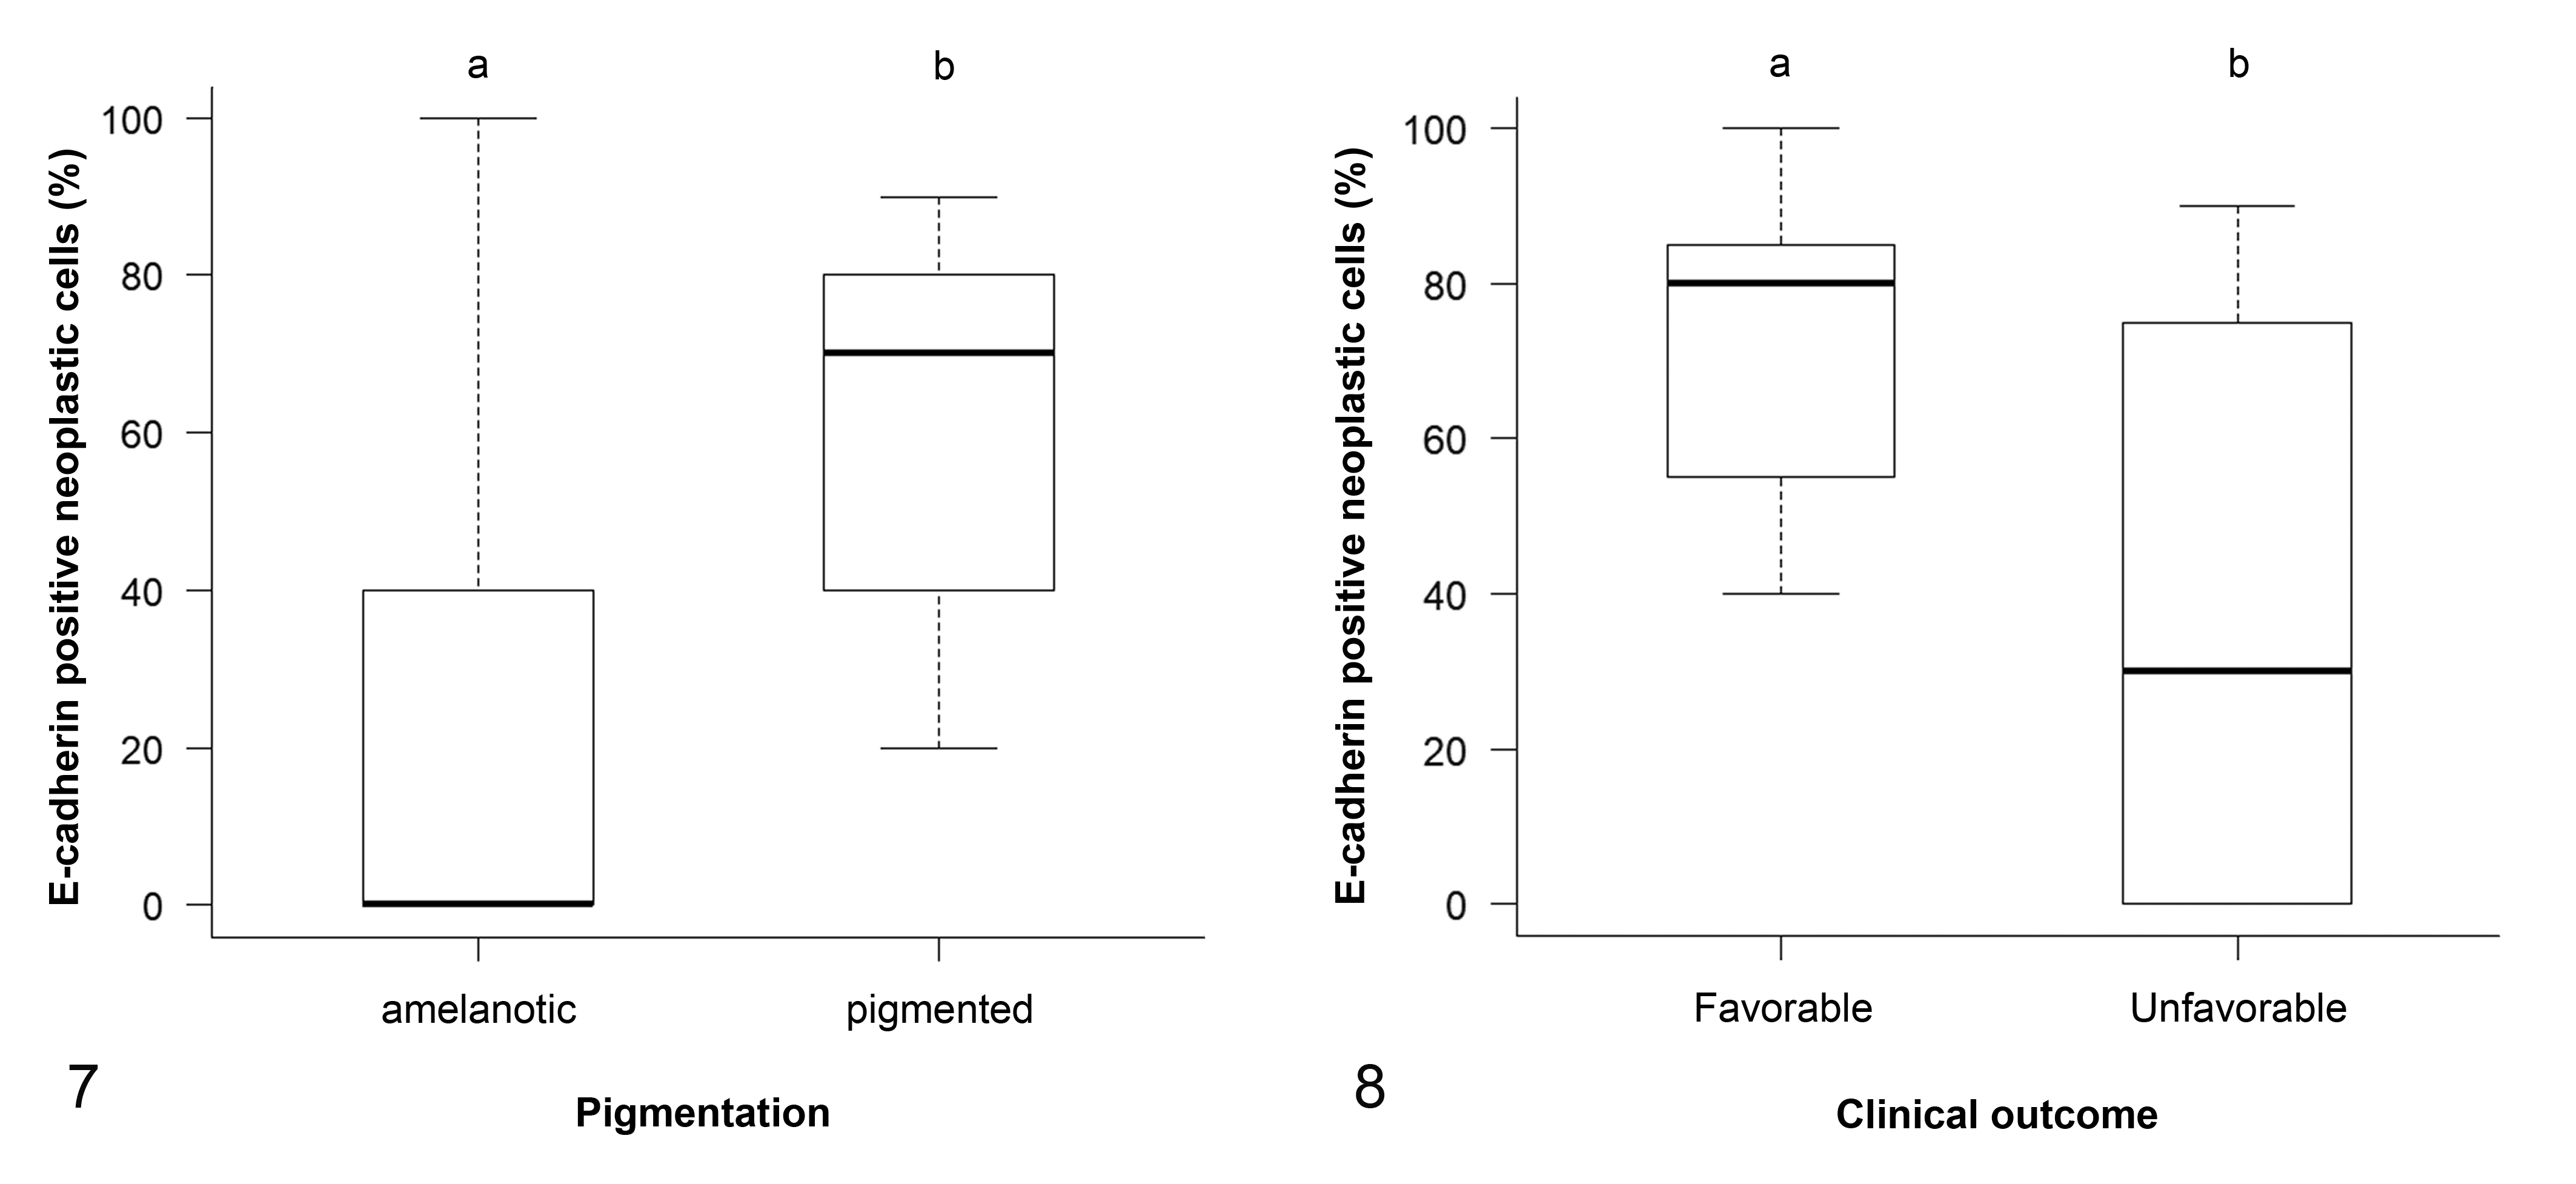
Finally, we found that the percentage of E-cadherin-positive neoplastic cells in oral melanomas was significantly associated with clinical outcome (P = .038): in particular, dogs with an unfavorable clinical outcome had a lower percentage of E-cadherin-positive neoplastic cells (median = 30.0, IQR = 0.0–75.0) than those alive or dead for causes unrelated to melanoma (median = 80.0, IQR = 55.0–85.0; Fig. 8).
E-Cadherin Expression Classification Systems
Applying the 3-tier classification system of Lade-Keller et al 25 (Supplemental Table S1), E-cadherin expression showed a significant association with histological diagnosis (P = .026). Specifically, a higher proportion of cutaneous melanocytomas (18/25, 72%) had high E-cadherin expression compared to cutaneous melanomas (8/29, 28%; P ≤ .05), but no significant differences from oral melanomas were seen. Furthermore, E-cadherin expression was inversely associated with dichotomous modified Clark level (P = .029). Indeed, E-cadherin was more often highly expressed in tumors with modified Clark level <IV than in tumors with modified Clark level ≥IV (P ≤ .05). Associations with the percentage of pigmented cells (P = .004), cellular pleomorphism (P = .038), and necrosis (P = .036) were also seen. There were no significant associations with tumor thickness (P = .123), any other histological feature, clinical outcome, nor the presence of recurrence/metastasis was found.
Applying the 2-tier classification system of Mitchell et al 33 (Supplemental Table S1), E-cadherin expression was significantly associated with histological diagnosis (P = .0005). E-cadherin expression was more often present in cutaneous melanocytomas (20/25, 80%) compared to cutaneous melanomas (8/29, 28%; P ≤ .05), but no significant differences with oral melanomas were seen. E-cadherin expression was inversely associated with dichotomous modified Clark level, being more often present in tumors with modified Clark level <IV than in those with modified Clark level ≥IV (P = .0009; OR = 9.50, 95% CI = 1.99–64.67). Furthermore, E-cadherin expression was also associated with the percentage of pigmented cells (P = .007); specifically, E-cadherin expression was more frequently present in highly pigmented (percentage of pigmented cells >50%) compared to amelanotic tumors (P ≤ .05). Tumors with absent E-cadherin expression had higher mitotic counts (median = 18.0, IQR = 2.5–47.75) compared to E-cadherin expressing tumors (median = 2.0, IQR = 0.0–38.75; P = .022). Additionally, tumors with absent E-cadherin expression had greater tumor thickness (median = 0.75 cm, IQR = 0.50–1.00 cm) compared to those expressing E-cadherin (median = 0.40 cm, IQR = 0.20–0.60 cm; P = .017). The association between E-cadherin expression and clinical outcome was not statistically significant (P = .058; OR = 2.74, 95% CI = 0.84–9.67); however, tumors of dogs that died due to melanoma often showed absent E-cadherin expression (13/20, 65%). No significant associations were found with other histological features nor recurrent/metastatic diseases.
Survival Analysis: Overall Survival Time
At the end of the study, the median number of follow-up days was 878 (IQR = 600–1262.5 days); 7 of 77 dogs were lost to follow-up (9%). Twenty out of the 52 dogs with melanoma died of melanoma, and no dogs with melanocytoma died.
Applying the 3-tier classification system of Lade-Keller et al, 25 Kaplan-Meier curves and log-rank test did not show significant differences in overall survival time among melanocytic tumors with absent, low or high E-cadherin expression (P = .336; Supplemental Figure S2a). Applying the 2-tier classification system of Mitchell et al, 33 Kaplan-Meier curves and log-rank test did not show significant differences in overall survival time among melanocytic tumors with absent or present E-cadherin expression (P = .072; Supplemental Figure S2b).
We found no significant association between the hazard of death and E-cadherin expression for any of the features examined (percentage of neoplastic E-cadherin-positive cells, intensity of the immunolabeling, pattern of expression, intensity of membranous immunolabeling, intensity of cytoplasmic immunolabeling, distribution of the positive cells in the neoplasm, spatial localization of E-cadherin-positive cells within the tumor) or in any of the classification systems adopted (3-tier or 2-tier; Supplemental Table S2).
Because of the relatively limited sample size and the low number of tumor-related deaths (especially in cutaneous tumors), it was not possible to perform stratified survival analysis, subdividing animals according to the histological diagnosis or any other variable.
Survival Analysis: Disease-Free Survival Time
At the end of the study, 15/70 (22%) dogs had recurrent or metastatic disease, including 7 dogs with oral melanoma, 7 with cutaneous melanoma, and 1 dog with cutaneous melanocytoma. Applying the 3-tier classification system of Lade-Keller et al, 25 Kaplan-Meier curves and log-rank test did not show significant differences in disease-free survival times among melanocytic tumors with absent, low or high E-cadherin expression (P = .335; Supplemental Figure S3a). Applying the 2-tier classification system of Mitchell et al, 33 Kaplan-Meier curves and log-rank test did not show significant differences in disease-free survival time among melanocytic tumors with absent or present E-cadherin expression (P = .462; Supplemental Figure S3b). We found no significant association between the hazard of developing recurrence/metastasis and E-cadherin expression for any of the features examined or in any of the classification systems adopted (Supplemental Table S3). Because of the relatively limited sample size and the low number of recurrence/metastasis (especially in cutaneous tumors), it was not possible to perform stratified survival analysis, subdividing animals according to the histological diagnosis or any other variable.
Associations With Clinical Outcome and Recurrence/Metastasis
Since E-cadherin expression assessed according to the 2-tier classification system showed associations with both histological diagnosis and percentage of pigmentation, we studied their relationship with clinical outcome or presence of recurrence/metastasis. As it was not possible to perform stratified survival analysis, because of the relatively small sample population, we used the log-linear model approach to partially overcome this limitation and test a series of independence models (Supplemental Tables S4–S7). The first model tested included E-cadherin expression, histological diagnosis, and clinical outcome and showed that the variables were not independent (P = 9.18 e− 10 ; Supplemental Table S4). Namely, among the dogs with a favorable clinical outcome, cutaneous melanocytomas with present E-cadherin expression or cutaneous melanomas with absent E-cadherin expression had a frequency higher than expected if the variables had been independent (P < .05, respectively). Moreover, among the dogs with an unfavorable clinical outcome, there was a higher than expected frequency of oral melanomas with absent E-cadherin expression (P < .0001; Fig. 9). We built an analog model by substituting the variable “clinical outcome” with “recurrence/metastasis” and showed that the variables were also not independent in this case (P = .0003; Supplemental Table S5). In this model, among the dogs without recurrence/metastasis, cutaneous melanocytomas with present E-cadherin expression had a frequency higher than expected if the variables had been independent, while those with absent E-cadherin expression had a lower than expected frequency (P < .05, respectively). Moreover, among the dogs with recurrence/metastasis, oral melanomas with absent E-cadherin expression had a frequency higher than expected (P < .05; Supplemental Figure S4).
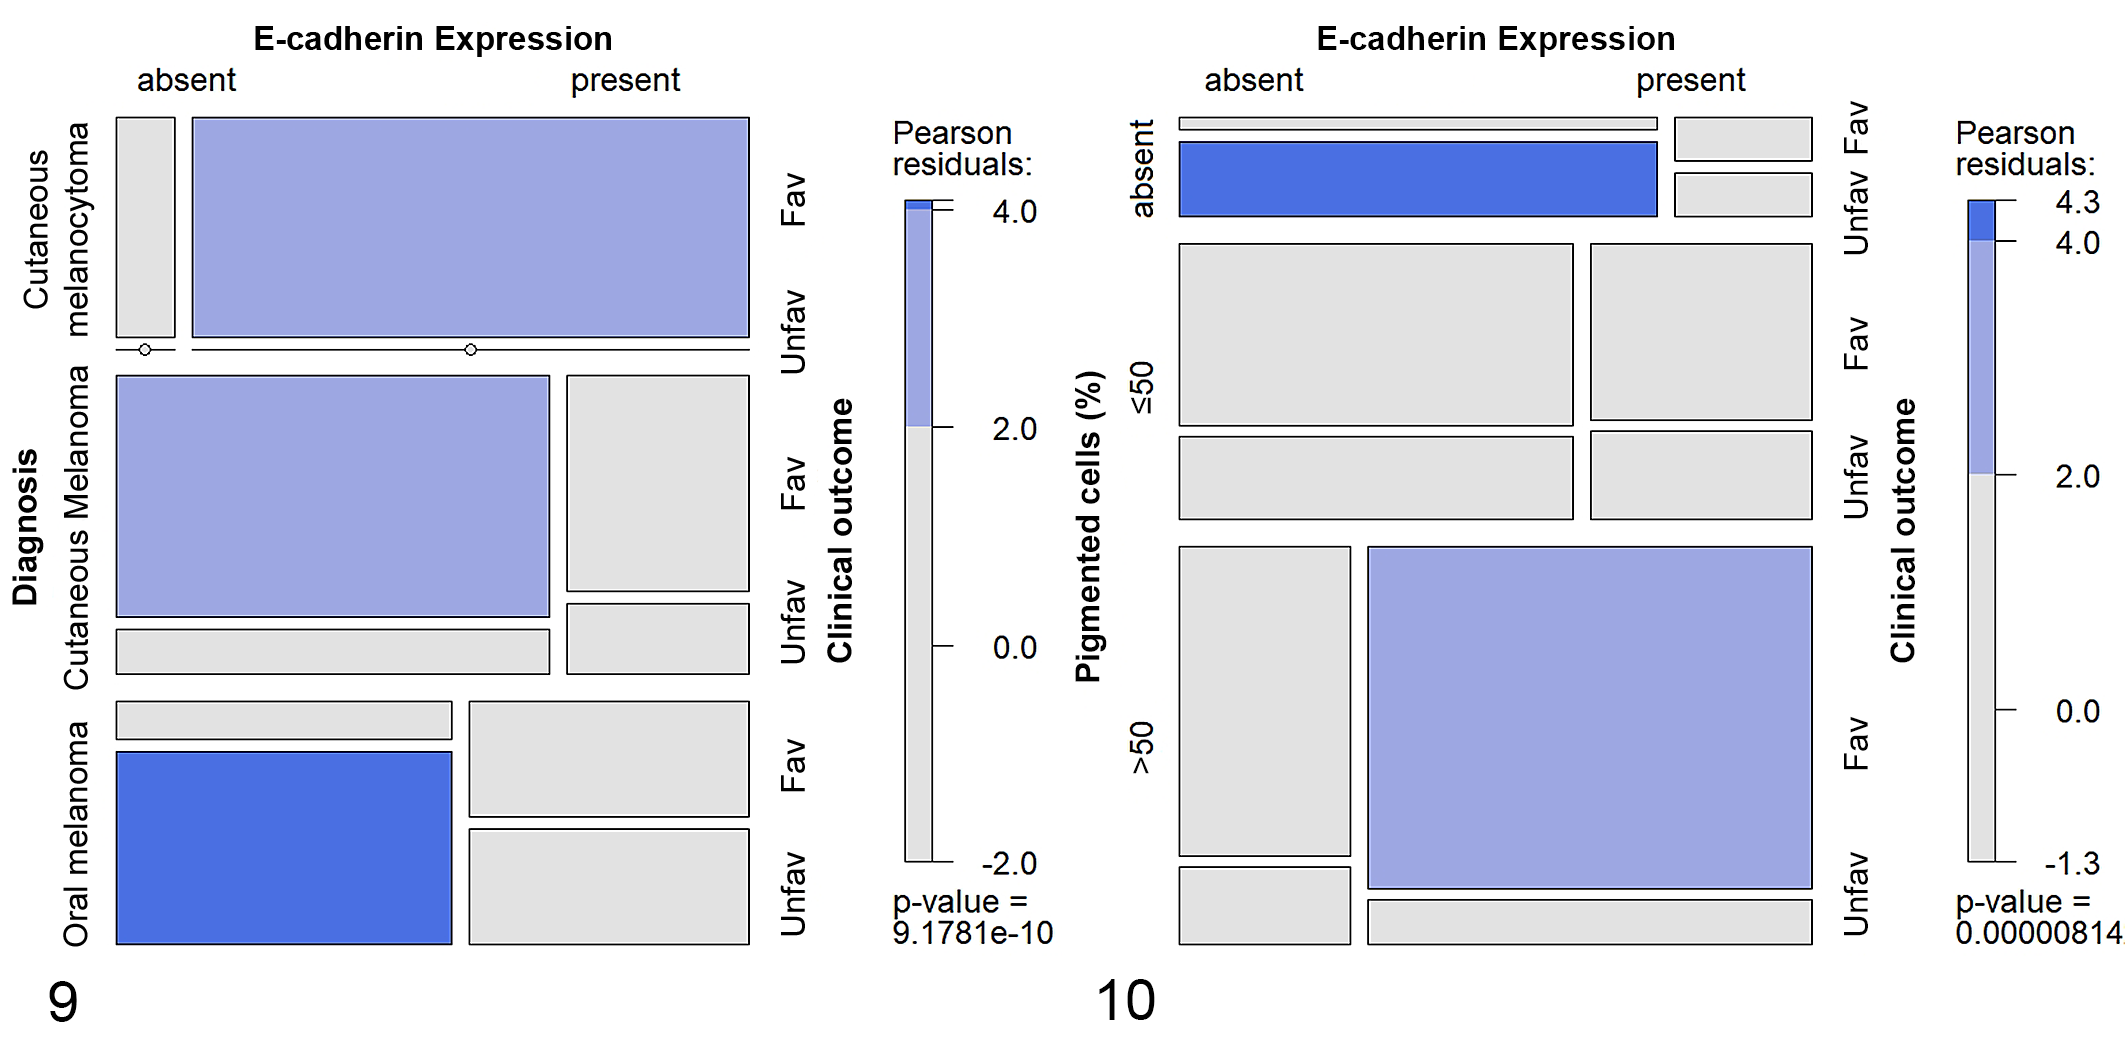
The model comprising the E-cadherin expression, the percentage of pigmentation and the clinical outcome showed that the variables were not independent (P = 8.14 e− 6 ; Supplemental Table S6). In particular, among the dogs with a favorable clinical outcome, the proportion of tumors with >50% of pigmentation and with present E-cadherin expression was higher than expected if the variables had been independent (P < .05). Whereas, among the dogs with an unfavorable clinical outcome, the proportion of amelanotic tumors with absent E-cadherin expression was higher than expected (P < .0001; Fig. 10). The last model, built by substituting in the previous model the variable “clinical outcome” with “recurrence/metastasis” also showed that the variables were not independent (P = .028; Supplemental Table S7). However, in this model, it was not possible to identify the cells responsible for the deviation from independence (Supplemental Figure S5).
Discussion
In human epithelial cancers, E-cadherin plays a crucial role in EMT, since the alteration of its expression is a foundational condition for invasive behavior. 17,48,59 In cutaneous melanocytic tumors, decreased E-cadherin expression has a prognostic value, being associated with a shorter survival. 21,25
In canine epithelial cancers, only limited studies on E-cadherin expression have been conducted (ie, oral squamous cell carcinomas, prostatic, anal sac, mammary and choroid-plexus tumors) and most of them did not identify a role for E-cadherin because of a small sample population; however, a few authors demonstrated that loss of E-cadherin expression was related to malignancy. 2,10,20,30,37,39,44,47,53,60
The role of E-cadherin in canine cutaneous and oral melanocytic tumors is poorly understood. Han and colleagues argued that a modification in cell-cell adhesion occurs in canine melanocytic tumors, since cells undergo a dysregulation of E-cadherin/β-catenin complexes. Although beyond the aim of their study, the authors observed a lack of association between E-cadherin expression and histological features of malignancy. 12,13
In contrast to these previous studies, we showed that E-cadherin expression in canine melanocytic tumors was associated with the histological diagnosis, being higher in cutaneous melanocytomas than cutaneous melanomas, while no differences were found between oral melanomas and cutaneous tumors. This association was constantly demonstrated in all systems used in this study for the evaluation of E-cadherin expression: the percentage of E-cadherin-positive neoplastic cells, and the 3-tier (Lade-Keller et al 25 ) and the 2-tier (Mitchell et al 33 ) classification systems.
The majority of tumors in our study showed a cytoplasmic E-cadherin expression, which can be interpreted as aberrant compared to the membranous immunolabeling of normal melanocytes. 12,21 In cutaneous malignant melanomas, the intensity of membranous immunolabeling was significantly lower than in melanocytomas. Moreover, while in a higher proportion of cutaneous melanomas the spatial localization of E-cadherin-positive neoplastic cells within the tumor was random, in melanocytomas the E-cadherin expression was more frequently diffuse. These findings support the hypothesis that there is dysregulation and, likely, an alteration of function of E-cadherin in these neoplasms. 3,18 Unexpectedly, the proportion of tumors with peripheral and central localization of E-cadherin-positive cells was similar; this is different from human melanocytic tumors, where a decreased E-cadherin expression at the invasive edge of the tumor was reported. 33
In human melanomas, E-cadherin is highly expressed in thinner tumors compared to thicker ones, as measured by Breslow thickness, which is the most important independent prognostic morphologic factor in humans. 25,33,35 Previous studies demonstrated an association of tumor thickness with histological diagnosis, clinical outcome, and prognosis in canine cutaneous melanocytic tumors, suggesting its importance also in the dog. 24,50 In line with previous data in humans, the present study showed that E-cadherin expression was significantly higher in thinner tumors, especially when the 2-tier classification system of E-cadherin expression was used for the assessment. However, it is important to note that contradicting results were also reported in humans by some authors who could not demonstrate a significant difference in E-cadherin expression between thin and thick melanomas 18 because of heterogeneous expression of E-cadherin in cutaneous tumors. It has been hypothesized that neoplastic melanocytes may produce factors inducing increased E-cadherin expression, even though the E-cadherin protein is not necessarily functional. 3,18,23,46 Whether this feature is shared by canine melanocytic tumors needs to be determined.
We previously showed that the evaluation of a modified Clark level in canine cutaneous melanocytic tumors could be useful, especially using invasion of the deep dermis (IV level) as a cutoff for histological characteristics of malignancy, since it is associated with histological diagnosis. 50 In the current study, E-cadherin expression, independent of the classification system used, was inversely associated with dichotomous modified Clark level and was generally higher in tumors with a lower modified Clark level (<IV level). Therefore, we can suggest that the evaluation of E-cadherin in canine cutaneous melanocytic tumors can be a useful additional parameter to distinguish the most invasive neoplasms when the diagnosis is doubtful.
We showed that E-cadherin is often present in tumors with lower mitotic counts. Since the mitotic count is considered a negative prognostic factor in canine melanocytic tumors, 41,54 this finding supports the hypothesis that E-cadherin expression can be seen in tumors that have lower proliferation activity, that are therefore potentially less aggressive.
E-cadherin expression was associated with the percentage of pigmented cells, independent of the system used to evaluate it, confirming the strong relevance of this association in canine melanocytic tumors. Indeed, highly pigmented tumors (those composed of >50% pigmented cells) had a higher E-cadherin expression compared to the amelanotic ones. Recently, the involvement of E-cadherin in melanin transfer from normal melanocytes to keratinocytes was highlighted by some authors who observed the accumulation of melanosomes within melanocyte dendrites as a consequence of the loss of E-cadherin. 51 According to these new findings, abundant pigmentation in neoplastic melanocytes with high E-cadherin expression would have been unexpected, since this protein promotes filopodia formation and melanin transfer in human melanocytes. 52 Therefore, these results could support the hypothesis of an abnormal functionality of E-cadherin protein in tumor cells, 18,47 as well as the involvement of other factors (e.g. intracellular and extracellular Ca2+ concentration) in the regulation of melanogenesis and melanosome transfer. 51 Further studies are required to elucidate the interplay of E-cadherin and melanin transfer in neoplastic melanocytes. Some authors reported a higher E-cadherin expression in polygonal than spindle-shaped cells in human cutaneous melanocytic tumors, 4 but we could not observe any association between predominant cell type and E-cadherin expression in our samples.
Oral melanomas have different characteristics and biological behavior compared to their cutaneous counterparts, 11,32,58 and recently, it has been shown that in canine oral melanomas, a decrease in CDH1 gene expression occurs. However, the authors could not perform survival analysis to investigate the prognostic significance of this finding. 39 Since oral melanomas are usually more aggressive, we would have expected to find clear differences in E-cadherin expression between oral melanomas and cutaneous melanocytic tumors. In our study, oral melanomas had heterogeneous E-cadherin expression, and no differences with cutaneous tumors emerged. Some authors reported the existence of a subgroup of oral canine melanomas having a different and unexpected biological behavior, 32 so we tried to identify subgroups of oral melanomas in which there was a different E-cadherin expression in neoplastic cells. We found an association between E-cadherin expression and pigmentation. In particular, the percentage of E-cadherin-positive neoplastic cells was lower in the subgroup of amelanotic neoplasms compared to pigmented ones, similar to the whole sample population. Moreover, the percentage of E-cadherin-positive neoplastic cells in oral melanomas was significantly lower in the primary tumors of dogs with an unfavorable clinical outcome.
Both of these differences in E-cadherin expression in the group of oral melanomas could explain why the characteristics of E-cadherin expression in this anatomical site seems to be intermediate between cutaneous melanomas and melanocytomas. We suspect that, among oral melanomas, amelanotic tumors can have a more aggressive behavior, especially when E-cadherin expression is low. However, because of the limited sample size, we could not further investigate whether this subgroup had a different biological behavior. Whether E-cadherin expression can be a useful marker to differentiate oral melanomas with highly aggressive behavior is worth evaluating in larger patient cohorts. Both the 3-tier and the 2-tier E-cadherin classification systems confirmed the association of E-cadherin expression with the histological diagnosis, the percentage of pigmented cells, and the dichotomous modified Clark level. Additionally, when the 3-tier classification system was used, E-cadherin expression was associated with cellular pleomorphism and the presence of necrosis. On the other hand, when the 2-tier classification system was adopted, E-cadherin expression was associated with the mitotic count and tumor thickness. Based on these results, we could hypothesize that the 2-tier classification system might have a higher informative potential than the 3-tier classification system, since both the mitotic count and the tumor thickness are among the most important prognosticators presently identified.
In contrast to humans, 21,25,57 E-cadherin expression was not associated with overall survival time, disease-free survival time, hazard of death, or of developing recurrence/metastasis, in any system applied in this study. The difficulty in demonstrating the prognostic significance of E-cadherin in survival analysis might be due to the limitations of our retrospective cohort study, such as the possible presence of bias or confounders that cannot be controlled because of the study type, 55,61 the relatively limited sample size, the low number of tumor-related deaths or recurrence/metastasis, the lack of information on the clinical stage of oral melanomas, and the incomplete follow-up information in some cases.
To partially overcome these limitations, we used the log-linear model to explore whether E-cadherin could influence the outcome together with other parameters.
First, we employed a model for studying the relationship among E-cadherin expression, histological diagnosis, and clinical outcome or recurrence/metastasis and we demonstrated that they were not independent. Dogs with a diagnosis of cutaneous melanocytoma with present E-cadherin expression usually had a favorable clinical outcome, while oral melanomas without E-cadherin expression more frequently had an unfavorable clinical outcome. These results would confirm the hypothesis that the absence of E-cadherin expression could suggest a potentially aggressive behavior, at least in oral melanomas. Indeed, we unexpectedly found that a higher than expected proportion of dogs with a favorable clinical outcome was represented by cutaneous melanomas with absent E-cadherin expression. Likely, this finding could be due to the relatively benign behavior of cutaneous melanomas, which often have long survival times. 11,26,32,56 These results can support the idea that, since distinct molecular pathways initiate cutaneous and oral melanomas, 40 the meaningfulness of biological markers should be carefully evaluated depending on the tumor origin.
Furthermore, dogs with oral melanoma and absent E-cadherin expression had frequent recurrence/metastasis. Dogs with cutaneous melanocytomas and E-cadherin expression frequently had no recurrence/metastasis, while cases of cutaneous melanocytomas with absent E-cadherin expression were lower than expected. This can be explained by the fact that melanocytomas only rarely lack E-cadherin expression.
Since the importance of pigmentation has been previously shown to be a prognostic factor in canine melanocytic tumors, 54 we suspected that E-cadherin expression and pigmentation, together, could be associated with the clinical outcome or the development of recurrence/metastasis. Hence, we built an appropriate model for testing the relationship between the 3 variables. We demonstrated that they are not independent and, specifically, that dogs whose tumors were highly pigmented (>50%) and expressed E-cadherin frequently had a favorable clinical outcome, while dogs with amelanotic tumors without E-cadherin expression often had an unfavorable clinical outcome. These results support a reciprocal influence of the variables and could explain why E-cadherin expression alone was not prognostic in the survival analysis.
In conclusion, in our study, E-cadherin expression was higher in canine cutaneous melanocytomas than melanomas, as well as in pigmented tumors than amelanotic ones. We could not show its prognostic relevance in the survival analysis. However, we demonstrated that pigmentation, E-cadherin expression, and clinical outcome are not independent of each other and that dogs with amelanotic tumors with absent E-cadherin expression frequently had an unfavorable clinical outcome. Hence, we suggest that the evaluation of E-cadherin expression could be useful to better define the prognosis of amelanotic tumors, since the tumors with lower E-cadherin expression would have a worse prognosis. Additionally, since the most invasive cutaneous tumors tend to lose E-cadherin expression (modified Clark level ≥IV, greater tumor thickness), we propose that it can be a helpful feature to evaluate in challenging cases. Furthermore, we demonstrated that the association between E-cadherin expression and the clinical outcome could vary depending on the histological diagnosis. Indeed, the absence of E-cadherin expression is often associated with tumor-related death in dogs with oral melanomas, whereas the same is not true in dogs with cutaneous melanomas. Consequently, we argued that the importance of E-cadherin as a biological marker could depend on tumor origin. Regarding the 2 different classification systems tested to assess E-cadherin expression, we showed that the 2-tier system was associated with the mitotic count and tumor thickness—two established prognostic factors in the dog. Therefore, we hypothesize that the 2-tier system could be more informative than the 3-tier classification system. Oral melanomas showed heterogeneous characteristics in E-cadherin expression compared to cutaneous tumors. The percentage of E-cadherin-positive neoplastic cells was lower in tumors from dogs that died because of the neoplasm, and we identified a subgroup of amelanotic oral melanomas with a lower E-cadherin expression compared to the pigmented ones. Consequently, we suppose that the evaluation of E-cadherin, particularly in amelanotic tumors, could be helpful in distinguishing the most aggressive oral melanomas. However, further studies are needed to elucidate the biological behavior of this subgroup. Although confirmation of these data is necessary to unravel the complexity of E-cadherin regulation in canine melanocytic tumors, our study provides valuable information on the use of E-cadherin expression as a tool for the prognostication of canine melanocytic tumors.
Supplemental Material
Supplemental Material, Combined_supplemental_materials-Silvestri_et_al - E-Cadherin Expression in Canine Melanocytic Tumors: Histological, Immunohistochemical, and Survival Analysis
Supplemental Material, Combined_supplemental_materials-Silvestri_et_al for E-Cadherin Expression in Canine Melanocytic Tumors: Histological, Immunohistochemical, and Survival Analysis by Serenella Silvestri, Ilaria Porcellato, Luca Mechelli, Laura Menchetti, Selina Iussich, Raffaella De Maria, Monica Sforna, Laura Bongiovanni and Chiara Brachelente in Veterinary Pathology
Footnotes
Acknowledgements
The authors thank Luca Stefanelli for technical support.
Declaration of Conflicting Interests
The authors declared no potential conflicts of interest with respect to the research, authorship and/or publication of this article.
Funding
The author(s) disclosed receipt of the following financial support for the research, authorship, and/or publication of this article: This study was partially funded by the Canine Cancer Registry of the Umbria Region, Italy, and by the Project 2013.0251.021 by Fondazione Cassa di Risparmio di Perugia (Italy)—Scientific and Technologic Research.
Supplemental material for this article is available online.
References
Supplementary Material
Please find the following supplemental material available below.
For Open Access articles published under a Creative Commons License, all supplemental material carries the same license as the article it is associated with.
For non-Open Access articles published, all supplemental material carries a non-exclusive license, and permission requests for re-use of supplemental material or any part of supplemental material shall be sent directly to the copyright owner as specified in the copyright notice associated with the article.