
Abstract
Identification of fungal organisms often poses a problem for pathologists because the histomorphology of some fungal organisms is not specific, fresh tissues may not be available, and isolation and identification in culture may take a long time. The purpose of this study was to validate the use of panfungal polymerase chain reaction (PCR) to identify fungal organisms from formalin-fixed paraffin-embedded (FFPE) tissues. Formalin-fixed paraffin-embedded curls were tested from 128 blocks containing canine, feline, equine, and bovine tissues with cutaneous, nasal, pulmonary, and systemic fungal infections, identified by the presence of fungi in histologic sections. Quantitative scoring of histologic sections identified rare (11.9%), occasional (17.5%), moderate (17.5%), or abundant (53.1%) fungal organisms. DNA was isolated from FFPE tissues and PCR was performed targeting the internal transcribed spacer 2 (ITS-2) region, a segment of noncoding DNA found in all eukaryotes. Polymerase chain reaction products were sequenced and identified at ≥97% identity match using the Basic Local Alignment Search Tool and the NCBI database of ITS sequences. Of the 128 blocks, 117 (91.4%) yielded PCR products and high-quality sequences were derived from 89 (69.5%). Sequence and histologic identifications matched in 79 blocks (61.7%). This assay was capable of providing genus- and species-level identification when histopathology could not and, thus, is a beneficial complementary tool for diagnosis of fungal diseases.
Keywords
An exponential growth in molecular diagnostics for infectious diseases has produced opportunities for confirming culture results and can be combined with other methods, such as histopathology, to confirm a diagnosis when culture is not possible. 1,5,14 DNA-based assays have been particularly helpful in diagnosis of fungal infections due to the speed of these tests compared to fungal culture, which can take 2 to 4 weeks. 10 Many fungi are not readily cultivable in the laboratory and others require biosafety level 3 precautions. In addition to culture, fungal identification has relied on histopathology and cytology, although inherent challenges exist due to the subtle nuances in distinguishing fungal morphology. 41
Polymerase chain reaction (PCR) assays have been developed to target and quantify specific genera and species of fungi from clinical samples. 11,13 These assays, however, require prior suspicion of the etiologic agent and are not available for every fungal organism, including emerging pathogens. The greatest utility has come from panfungal PCR, which amplifies conserved genes that are present in all fungi such as the ribosomal RNA (rRNA) region, including the large (28S) and small (18S) subunits, 5.8S, and internal transcribed spacer (ITS-1 and -2) and intergenic spacer (IGS) regions. Primers targeting these conserved rRNA sequences were originally developed for phylogenetic studies. 45 The resulting PCR products have regions that are hypervariable among fungi, allowing for identification by comparison of their sequences to a reference fungal database. The ITS regions are currently considered the superior regions for species resolution. 42 Panfungal PCR can potentially identify any fungal agent without prior knowledge of its suspected identity, which can greatly reduce the time and cost spent on other molecular diagnostics.
Panfungal PCR on formalin-fixed paraffin-embedded (FFPE) tissues is useful when fresh tissue was not or could not be collected. It has been successfully applied in different human tissues and for a variety of fungal infections 30,36,39 ; however, less work has been performed in veterinary cases. Two of the human studies 30,36 have included small subsets of animal tissues (6 and 19, respectively) but were lacking in breadth of animal species and tissue types. Recently, there have been more extensive applications of this assay in cats, 3,8 but there is still a need for validation in other animals. Furthermore, there does not appear to be a general consensus on DNA extraction methods for FFPE tissues, 36,40 and many of the recommended kits are expensive or the protocols are time intensive.
Improving fungal diagnostics in veterinary medicine has the potential to not only improve animal healthcare but also enable proper selection of antifungal therapeutics, thereby reducing the development of resistance that has already been documented in poultry, 7 dogs, 37 and other animals. 12 In addition, improvement in the accuracy and specificity of identifying fungi to the genus and species level would allow for better epidemiologic studies of current and emerging fungal pathogens. The purpose of this study was to validate the use of panfungal PCR on FFPE specimens in a variety of veterinary cases from birds, cats, camels, cattle, dogs, horses, and sheep. Furthermore, we aimed to test and optimize a cost-effective DNA extraction kit for amplification of fungal DNA from FFPE animal tissues.
Materials and Methods
Case Selection
From the pathology archives at the Texas A&M University College of Veterinary Medicine and Biomedical Sciences, the Dermatopathology Specialty Service, and the Texas A&M Veterinary Medical Diagnostic Laboratory, an exhaustive query was performed, and 128 paraffin blocks from 96 animals were selected for inclusion in this study. The initial selection criteria included the presence of fungi observed histologically (Supplemental Fig. 1), a diagnosis of primary fungal infection, and an attempt to select representative numbers of animal species, tissue types, and fungal etiologic agents. Once the blocks were selected, a single pathologist reviewed all archived slides to confirm the histologic diagnosis and to categorize the cases based on the amount of fungal organisms. Separate guidelines were used for yeast and hyphal morphologies since hyphae are generally more prolific, and cases were classified according to the number of organisms seen in 20 fields at 200× magnification as either rare (<3 yeast or <8 hyphae), occasional (3-10 yeast or 8-20 hyphae), moderate (10-15 yeast or 20-50 hyphae), or abundant (>15 yeast or >50 hyphae). The cases included tissues of dogs (66), cats (25), horses (19), cattle (7), birds (6), camels (3), sheep (1), or wild cats (1). The tissue types included oral cavity, respiratory tract, gastrointestinal tract, urinary tract, skin, brain, heart, lymph node, and bone. Previous ancillary testing included 69 cases with special stains, 26 with culture, 4 with cytology, 3 with PCR performed at other institutions, and 1 with immunohistochemistry. Most cases without ancillary testing showed strong fungal identification based on histopathology, and additional tests were deemed unnecessary due to costs or unavailability of fresh samples.
Twenty-four blocks were used to compare 2 commercially available kits for extraction of fungal DNA from FFPE tissues, another 52 blocks were used to further optimize the superior kit’s protocol, and the remaining 52 blocks were processed following the optimized protocol (Supplemental Fig. 1). From each block, sections totaling 50 μm in depth were cut in 5-μm scrolls with a microtome, and the blade was cleaned with absolute alcohol between blocks. The initial scroll for each block was discarded to minimize environmental and carry-over contamination. The scrolls were stored in DNase-, DNA-, and RNA-free microcentrifuge tubes until DNA was extracted.
ITS-2 and IRBP Polymerase Chain Reactions and Sequence Analysis
Fungal DNA was amplified by PCR targeting the internal transcribed spacer-2 (ITS-2) region, located between the coding regions for the 5.8S and small ribosomal RNA subunits, using the following panfungal primers: ITS3-F (5’-GCATCGATGAAGAACGCAGC-3’) and ITS4-R (5’-TCCTCCGCTTATTGATATGC-3’). 45 To evaluate quality of host DNA in each sample, a PCR targeting the Canis familiaris interphotoreceptor retinoid-binding protein (IRBP) gene, which is highly conserved in a large number of mammalian species, was performed using the following primers: IRBP-F (5’-TCCAACACCACCACTGAGATCTGGAC-3’) and IRBP-R (5’-GTGAGGAAGAAATCGGACTGGCC-3’). 17 For both PCRs, the total reaction volume was 25 µl containing 1 μl of DNA extract, 0.5 µl 10uM forward primer, 0.5 µl 10uM reverse primer, 10.5 µl Ultrapure nuclease-free water (Invitrogen, Carlsbad, CA), and 12.5 µl Accustart II Toughmix (hot-start Taq polymerase; Quanta Biosciences, Gaithersburg, MD). Thermal cycler conditions were identical for both PCRs and consisted of 5 minutes at 95°C; 40 cycles of 95°C for 30 seconds, 57°C for 30 seconds, and 68°C for 30 seconds; and a final extension step at 68°C for 5 minutes. The amplification positive control included with every group of ITS-2 reactions was 1 μl of purified genomic DNA from Cryptococcus neoformans (ATTC 208821, strain H99). The positive control included with IRBP reactions was 1 μl of DNA extracted from a block containing an assortment of animal skin biopsies that were unremarkable. A negative control was included with both PCRs by adding 1 μl of UltraPure water (Invitrogen) instead of DNA. Samples that tested negative for ITS-2 and IRBP were repeated and spiked with 1 μl of positive control DNA to determine if false negative results were due to PCR inhibitors, likely from the formalin fixation.
All PCR products were separated on a 2% agarose gel made with 1× Tris boric acid ethylenediaminetetraacetic acid (TBE) buffer and GelRed® (Biotium, Inc., Hayward, CA). The sample was separated by electrophoresis for 1 hour at 120 V and visualized with a UV transilluminator (GelDoc EZ™ system; Bio-rad Laboratories, Inc., Hercules, CA). Every ITS-2 band was excised from the gel, and the DNA was isolated using the E.Z.N.A.® gel extraction kit (Omega Bio-Tek, Inc., Norcross, GA). This purified DNA was then submitted for sequencing (Eton Bioscience, Inc., San Diego, CA) using the ITS3-F and ITS4-R primers. Sequences were trimmed for quality by removal of the beginning and end of sequences, joined as contigs using Sequencher® 4.8 (Gene Codes Corporation, Ann Arbor, MI) and then queried against the GenBank database using the Basic Local Alignment Search Tool (BLAST, NCBI). 2 Published GenBank accession matches were given precedence over unpublished ones. Sequences were assessed both quantitatively with the quality score given in Sequencher and qualitatively by visual inspection of the electropherogram. Sequences were identified as poor quality for the remaining analyses when the overall quality score was less than 70%, where no or little sequence was detected, and when a majority of peaks overlapped for each base. A fungal identification was made when a sequence matched the reference at ≥97% identity (for genus and species levels). When the sequence matched to more than 1 taxon at ≥97%, the one with the highest identity score was chosen. When there were multiple matches at the highest identity score, all matches were reported. Also, when there were multiple matches from different bands, all matches were reported. Interphotoreceptor retinoid-binding protein bands were considered positive or negative based on the presence or absence of a band at the same level as positive controls and were not submitted for sequencing.
Comparison of DNA Extraction From Paraffin Blocks Using 2 Commercially Available Kits
Two commercially available kits, the QIAGEN QIAamp® DNA FFPE Tissue Kit and Deparaffinization Solution (QIAGEN, Valencia, CA) and MO BIO BiOstic® FFPE Tissue DNA Isolation Kit (MO BIO, Carlsbad, CA), were compared through assessment of DNA extract quality (calculated as the number of IRBP-positive samples divided by the total number of samples), 36 PCR efficiency (calculated as the number of ITS-2 PCR-positive samples divided by the number of IRBP-positive samples), 36 and ITS-2 sequence quality (calculated as the number of high-quality sequences divided by the total number of samples). The 24 blocks included in this experiment included roughly equal numbers of blocks with either yeast or hyphae to evaluate the efficiency of DNA extraction from yeast capsules as well as hyphal mats and chitin-containing hyphae. The kit protocols (including an initial deparaffinization step) were followed according to the manufacturers’ directions, except the combined thickness of the scrolls included in the first step was standardized at 50 μm, and the incubation time with proteinase K was standardized at 2 hours for both protocols, the minimum recommended incubation time period. All extracted DNA was stored at –20°C prior to PCR amplification. For every block, fungal DNA was amplified through ITS-2 PCR and host DNA was amplified through IRBP PCR.
Optimization of the MO BIO BiOstic Kit Protocol
The MO BIO BiOstic kit protocol was further optimized to determine whether addition of lyticase would improve PCR efficiency. The DNA was extracted from scrolls of the 52 blocks following the manufacturer’s directions, except for a 2-hour incubation time with proteinase K. Following the proteinase K digestion, the lysate was equally divided into 2 microcentrifuge tubes. One of these tubes was then processed following the manufacturer’s directions, but 2U/100 μl of lyticase (L2524; Sigma-Aldrich, St Louis, MO) was added to the other tube and incubated at 37°C for 45 minutes. 36 After lyticase incubation, these samples were processed following the manufacturer’s directions. From each block, fungal DNA was amplified using the ITS-2 PCR and host DNA was amplified using the IRBP PCR. DNA quality, PCR efficiency, and sequence quality were calculated for all extractions.
Phylogenetic Analysis of Aspergillus spp
All Aspergillus spp sequences (n = 20) from this study were aligned with 8 reference sequences for A. flavus, A. fumigatus, A. niger, A. terreus, A. ustus, A. nidulans, A. felis, and Phialosimplex caninus (NCBI accession numbers: AF138287, AF138288, AF138904, AF138290, AF157507, AF138289, 24 KF558318.1, 6 and GQ169311.1, 22 respectively) using molecular evolutionary genetic analysis 7 (MEGA 7) 44 and multiple sequence comparison by log-expectation (MUSCLE) algorithm. 16 The alignment was chopped at the 3’ end to exclude the ITS-1 region found in the reference sequences. The alignment was then imported into Geneious 27 and, using the Tamura-Nei model to calculate the distances, neighbor joining was performed, with F. solani (NCBI accession: HQ026747.1) selected as the outgroup. Bootstrap analysis was performed with 1000 replications and the consensus tree was reported, including the bootstrap support values at branching points.
Statistical Analysis
Contingency analysis was performed in JMP® Pro 12 (SAS Institute, Inc., Cary, NC) to determine whether an association existed between the number of organisms observed histologically and ITS-2 PCR results, and with the quality of sequences derived from the PCR products. First, the correlation between variables was assessed with a chi-square test. When a significant correlation was identified for variables with multiple categories, the samples were then scored (yes/no) for the category in each variable that was suspected to contribute to the correlation. A second chi-square test was then performed between 1 category from each variable, and significant P values were reported.
Results
Comparison of 2 DNA Extraction Kits
DNA extraction using the QIAGEN QIAamp DNA FFPE Tissue Kit and MO BIO BiOstic FFPE Tissue DNA Isolation Kit was compared using 24 blocks of FFPE tissue from animals with suspected histoplasmosis (7), Malassezia infection (5), cryptococcosis (1), dermatophytosis (5), and phaeohyphomycosis (6) (Table 1). To assess the ability of the kit to remove inhibitors and preserve DNA quality, we calculated the number of IRBP-positive samples divided by the total number of samples tested (DNA quality) and found that the kits were equally successful at 100%. To test the ability of the kit to extract fungal DNA from the block, we calculated the number of ITS-2 PCR-positive samples divided by the number of IRBP-positive samples (PCR efficiency) and found that the kits were equally successful at 83%. The percentage of high-quality sequences derived from ITS-2 PCR products that yielded an identification (ITS-2 sequence quality) were the same for each kit at 71%. Based on DNA quality, PCR efficiency, and the quality of ITS-2 sequences for these 24 blocks, we determined that the MO BIO BiOstic kit was comparable to the QIAGEN QIAamp kit (with deparaffinization solution), but the MO BIO BiOstic kit had practicality advantages including a lower price and shorter protocol completion time. Therefore, we decided to further optimize the MO BIO BiOstic kit’s protocol for the extraction of fungal DNA from FFPE animal tissues.
Comparison of DNA Extraction Kits and Effect of Adding Lyticase, With Respect to DNA Quality, PCR Efficiency, and Sequence Quality.
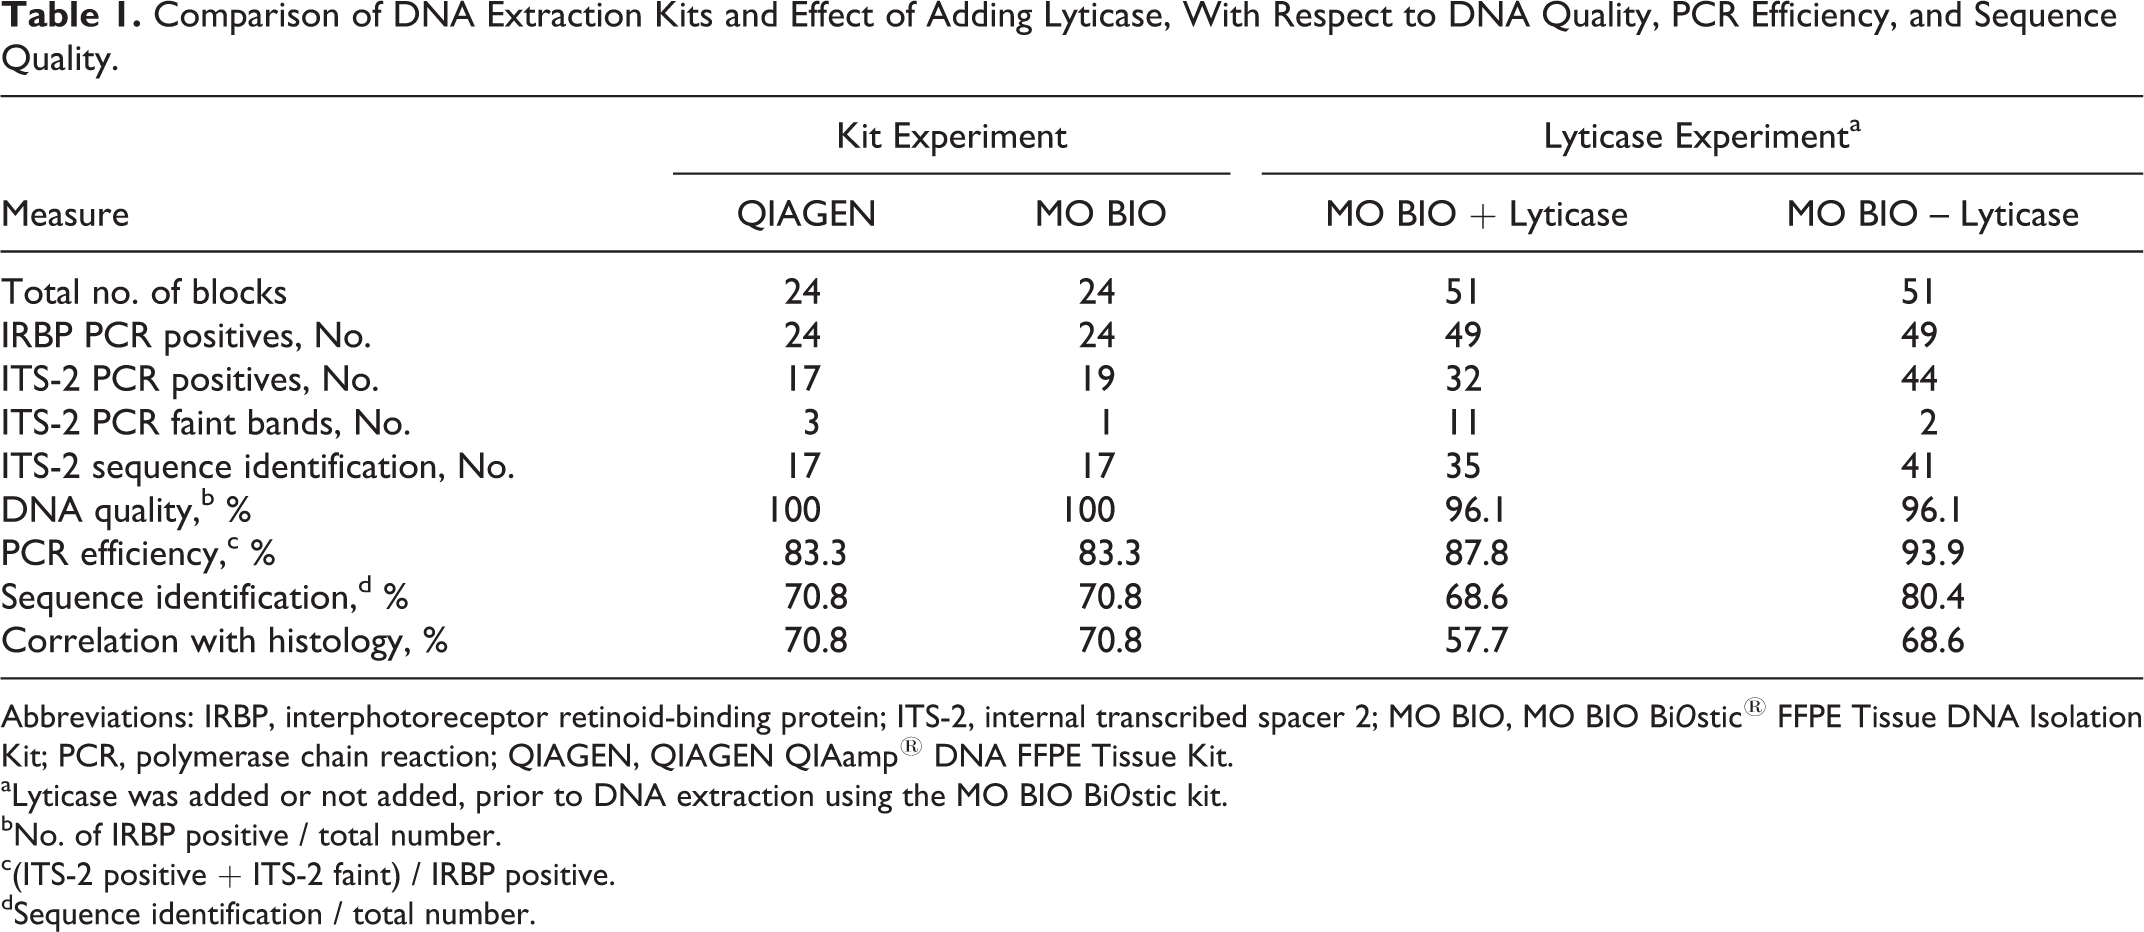
Abbreviations: IRBP, interphotoreceptor retinoid-binding protein; ITS-2, internal transcribed spacer 2; MO BIO, MO BIO BiOstic® FFPE Tissue DNA Isolation Kit; PCR, polymerase chain reaction; QIAGEN, QIAGEN QIAamp® DNA FFPE Tissue Kit.
aLyticase was added or not added, prior to DNA extraction using the MO BIO BiOstic kit.
bNo. of IRBP positive / total number.
c(ITS-2 positive + ITS-2 faint) / IRBP positive.
dSequence identification / total number.
Optimization of the MO BIO BiOstic FFPE Tissue DNA Isolation Kit
The addition of lyticase digestion to the QIAGEN QIAamp kit protocol has been shown to improve PCR efficiency, 3,36 so we wanted to test whether this would also be true for the MO BIO BiOstic kit. A set of 52 blocks of FFPE tissue (different from those mentioned above) were included in this experiment. The calculated PCR efficiency for samples digested with lyticase was 87.8%, and for samples without lyticase was 93.9%. Furthermore, only 68.6% of the samples digested with lyticase produced a high-quality sequence for which identification was possible (ITS-2 sequence quality), and only 30 of 51 (57.7%) of the samples yielded a sequence that correlated with the histologic diagnosis. In comparison, 80.4% of samples without lyticase produced high-quality sequences and 35 of 51 (68.6%) of the samples yielded a sequence that correlated with the histology. We found that lyticase did not improve amplification of fungal DNA extracted from FFPE blocks using the MO BIO BiOstic kit and, therefore, was not necessary to be included in the optimized protocol.
Sequence Analysis of Archived Case Material
An additional 52 blocks were processed with the MO BIO BiOstic kit according to the manufacturer’s directions, except that proteinase K incubation time was 2 hours. For all processed samples (n = 128; using the MO BIO BiOstic kit without lyticase; Supplemental Table S1), 117 of 128 (91.4%) were ITS-2 PCR positive, 9 of 128 (7.0%) were negative, and 2 of 128 (1.5%) were smeared on an agarose gel (Supplemental Table S1). Of the blocks that were ITS-2 PCR positive, 37 of 117 (31%) demonstrated multiple PCR product bands on electrophoresis, 17 of 117 (14.5%) had faint band(s), and the remaining 63 of 117 showed a single strongly positive band. Most PCR positives (89/117) yielded high-quality sequences, although 28 of 117 (23.9%) yielded a poor-quality sequence. Roughly equal numbers of the poor-quality sequences came from faint bands (13/28) as from strongly positive bands. None of the poor-quality sequences were queried against the database. In 6 samples, nonfungal eukaryotic DNA was amplified, including the ITS-2 sequences of plants and mites.
To calculate sensitivity relative to histologic examination, the number of cases for which genus-level identification of fungi was possible through both histology and the panfungal PCR (n = 66) was divided by the number of cases for which identification was possible through histology (n = 95). The diagnostic assay had a sensitivity of 69.5% relative to histologic examination (Table 2).
Number of Fungal Identifications Made Through Histopathology or Panfungal Polymerase Chain Reaction (PCR) for Calculation of Sensitivity.a
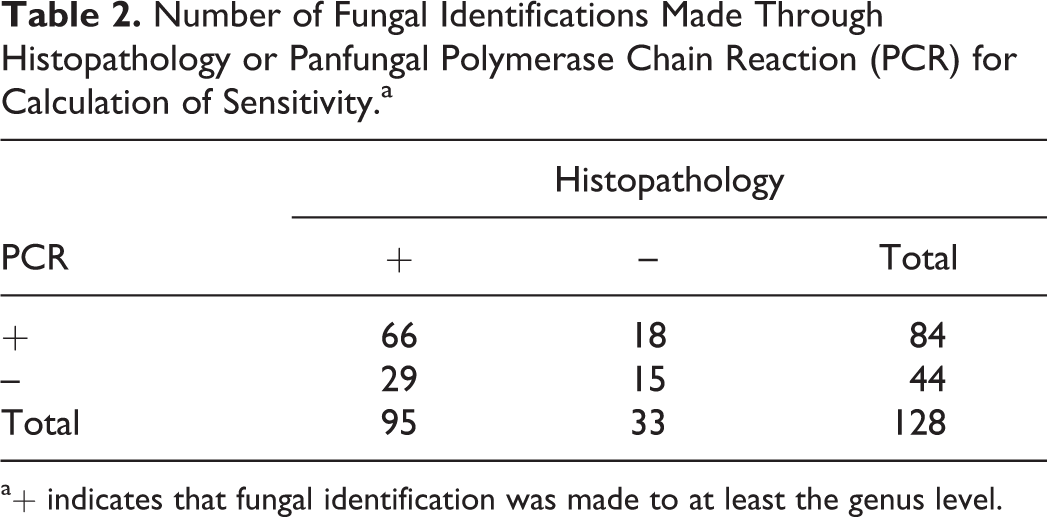
a+ indicates that fungal identification was made to at least the genus level.
A fungal identification was made through ITS-2 PCR and sequencing for 83 of 128 (65%) blocks tested. The vast majority of these sequence-derived identities (79/83, 96%) corresponded to those made histologically and only a small number (4%) identified as an organism that did not match the histologic descriptions. A genus- or species-level identification was made by BLAST analysis of sequences in 48 of 83 (60%) cases, whereas histologic evaluation was unable to do so. This included 24 samples for which sequencing provided a genus-level resolution, and 24 samples a species-level resolution. Three representative cases were selected to demonstrate the benefit of using panfungal PCR where histologic fungal morphology could not provide a genus-level identification (Figs. 1–3).
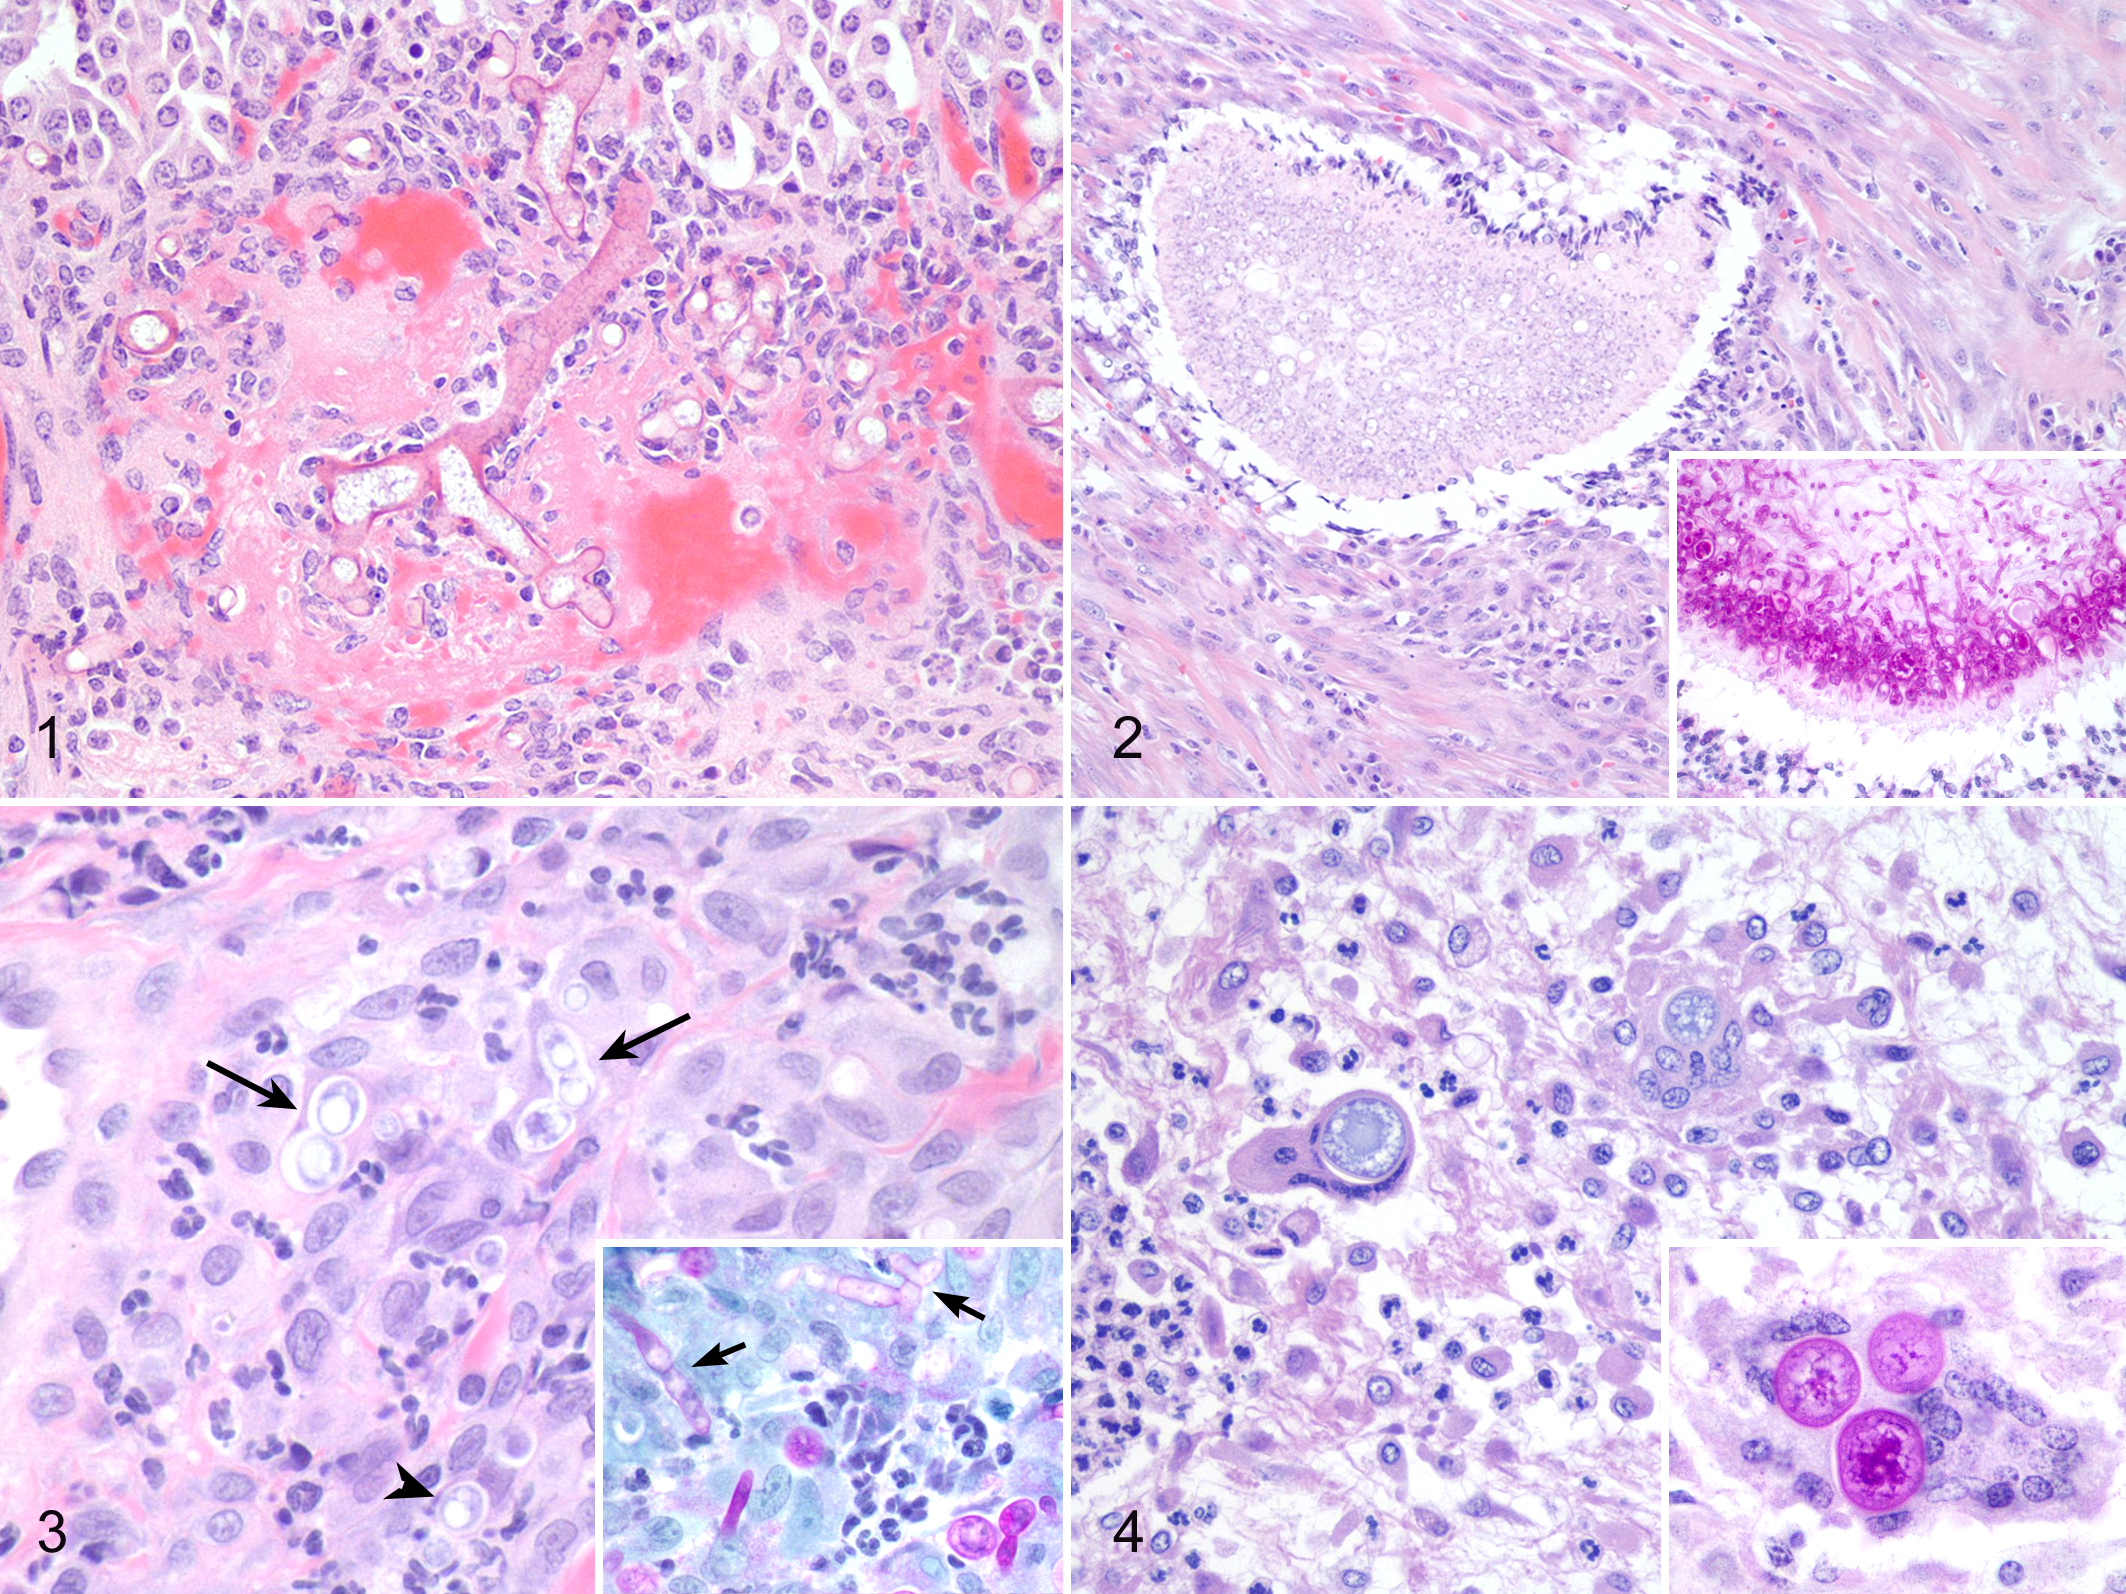
Various mycotic infections in domestic species that were classified using panfungal polymerase chain reaction.
Some of the cases that were included from the archives also had ancillary testing performed, which enabled further comparison with culture results. Fungal culture had been successfully performed on 25 cases. Panfungal PCR and sequencing results correlated with culture in 12 of 25 (48%) cases, whereas 7 of 25 (28%) did not. Aspergillus was sequenced from 3 of the blocks, and from the tissues contained within these blocks, an isolate of Mucor had been cultured. The histopathologic findings for 2 of the cases were consistent with aspergillosis, agreeing with the sequencing results, and in the third, the hyphae could not be further identified. Last, 6 of the cases that had positive fungal culture results were PCR positive, but the resultant sequences were of poor quality. To highlight the utility of this panfungal PCR assay when culture could pose a threat to the clinical microbiology personnel, several cases of dimorphic fungal infections were included in this study, and 1 of these cases of coccidioidomycosis with rare organisms is presented in Fig. 4.
Due to the high prevalence of Aspergillus cases in the present study, and the previously proposed ability of the ITS-2 region to provide speciation within the genus, additional phylogenetic analysis was performed on Aspergillus sequences to confirm BLAST results and further validate this assay. From the 20 Aspergillus sequences included, 19 of 20 (95%) demonstrated correlation between the BLAST result and the phylogenetic clusters into which it was placed using neighbor-joining analysis (Table 3). The 1 sequence that did not fall into a cluster, Equ1, matched to A. fumigatus using BLAST and fell into the A. fumigatus cluster without repeat bootstrapping. Upon increasing the bootstrap replicates to 1000, Equ1 fell out of the A. fumigatus cluster in the consensus tree. Bootstrap support values indicate high confidence (>90) for the separation of major clusters by species except for the branch points leading to the A. fumigatus (75) and A. felis (83) clusters (Supplemental Fig. 2). Furthermore, the majority (17/20) of culture results also correlated with the BLAST sequencing results and the phylogenetic clade placement. There were 3 samples from which Mucor sp was cultured, but the sequencing matched to either A. fumigatus or A. felis.
Aspergillus Sequences Comparing BLAST, Phylogenetic, and Ancillary Testing Results.a
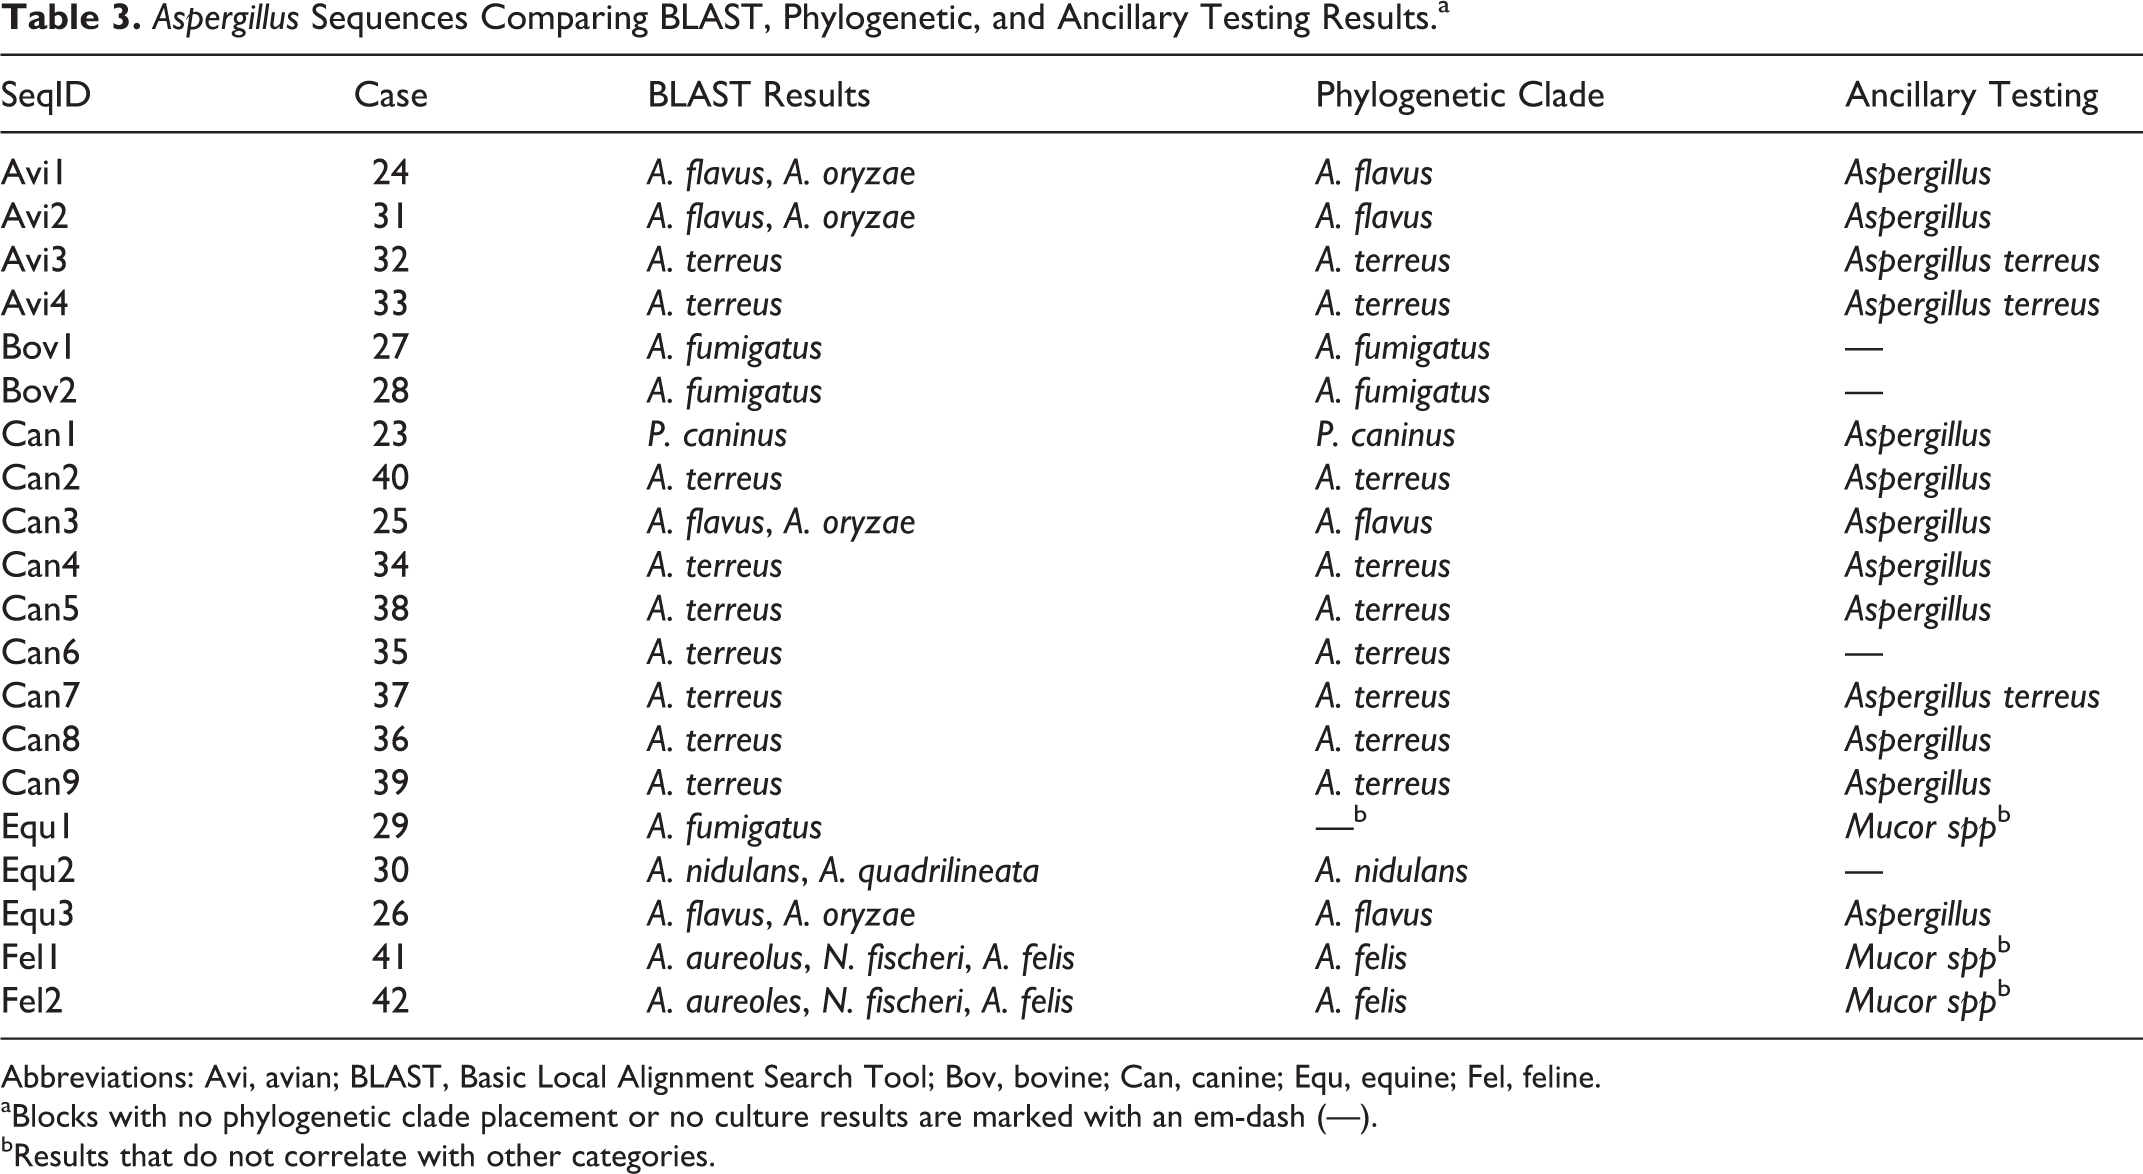
Abbreviations: Avi, avian; BLAST, Basic Local Alignment Search Tool; Bov, bovine; Can, canine; Equ, equine; Fel, feline.
aBlocks with no phylogenetic clade placement or no culture results are marked with an em-dash (—).
bResults that do not correlate with other categories.
Statistical analysis revealed no influence of host, tissue, or fungal type on PCR results (positive/negative). Respiratory tract samples in this study were significantly associated with an increased likelihood of having more than 1 band on gel electrophoresis (P = .015), and skin samples were significantly associated with having poor-quality sequences (P = .002). Chi-square analysis further demonstrated that the abundance of fungal organisms observed histologically was correlated with the PCR result (positive/faint/negative), number of bands, and quality of sequence. Rare organisms observed histologically were associated with an increased likelihood of having faint bands (P = .0054) and poor-quality sequences (P = .0045). Tissues with abundant organisms were associated with an increased likelihood of having a strongly positive (P = .0367), single band (P = .0061). Overall, poor-quality sequences were more likely obtained from blocks that demonstrated multiple PCR product bands on electrophoresis (P = .0053) and from blocks with faint bands (P < .0001).
Discussion
The panfungal PCR diagnostic assay presented here had a sensitivity of 69.5%, calculated as the percentage of cases for which ITS-2 sequencing provided a fungal identification. This sensitivity correlates well with previous studies, which also amplified the ITS-2 region from DNA extracts of FFPE tissues and showed sensitivities of 53.8% 4 and 64.3%. 30 These 2 studies with similar sensitivities both targeted the ITS-2 regions but used other methods of DNA extraction. Our work demonstrated that this assay was successful in a wide variety of animal hosts, tissues, and fungi and, thus, is a valuable test when used in conjunction with histopathology for identification of fungal infections in animals. The results presented here also show that the MO BIO BiOstic FFPE Tissue DNA Isolation Kit was successful at isolating high-quality fungal DNA from FFPE animal tissues without requiring the use of lyticase. The time required for assay completion is approximately 3 days. The assay has the ability to identify fungi in FFPE specimens regardless of their transport temperature and, thus, in some cases may be superior to culture, although culture remains the gold standard.
Many fungi have characteristic histologic features, which can be used to identify fungi in typical presentations and representative sections. However, there are cases of atypical morphology, stemming from genotypic variation. 23 For example, some Cryptococcus cases have varying amounts of polysaccharide capsule and thus resemble yeasts of similar size, such as Candida or Blastomyces or one of the smaller yeasts such as Histoplasma or Candida. 20 Also, Candida has the ability to produce pseudohyphae and may even appear to be branching and, thus, could be confused with hyphae. 33 The present assay enabled sequencing of a variety of yeast from FFPE tissues including Blastomyces (3), Coccidioides (7), Cryptococcus (8), Histoplasma (16), and Malassezia (1). For 1 of the yeast cases, the histologic diagnosis could not be identified further than “yeast with narrow-based budding,” but sequencing was able to confirm the etiologic agent as Histoplasma sp.
There appears to be greater challenges in identifying hyphae compared to yeast, especially the hyaline septate molds that are indistinguishable from one another morphologically, including Fusarium and Scedosporium. 23 Even for Aspergillus species that have a characteristic branching angle, reports of misidentification include 1 study with 122 cases of Aspergillus identified based on histologic morphology, where only 83% had positive culture results for Aspergillus and the remaining culture results were positive for Scedosporium, Fusarium, Pseudallescheria, Phialophora, and Trichophyton. 31 Although pigmented fungi may appear to be a straightforward identification on hematoxylin and eosin–stained sections, there exists variability in the amount of melanin produced by a genotypic variant, and thus, they could be confused with other hyaline hyphae, and these fungi cannot be identified to the genus level. 23,28 The present assay was able to sequence a variety of hyphae including Arthroderma (3), Aspergillus (20), Chaetomium (1), Curvularia (4), Curvularia/Bipolaris (8), Penicillium (1), Pythium (1), Rhizopus (3), and Scedosporium/Pseudallescheria (2). Eleven of these could not be identified further than hyphae based on histopathology alone. Overall, there were 3 cases in this study where the fungi observed histologically were not pigmented, but the fungal sequence identified a phaeohyphomycoses, further supporting the variability in melanin production in these pigmented fungi (Fig. 3).
Statistical analyses demonstrated that this assay is equally successful for both yeast and hyphae. There was not any influence of the type of tissue from which the DNA was isolated on PCR results (positive/negative); however, lung samples were more likely to have multiple PCR product bands, and skin samples were more likely to yield poor-quality sequences. The skin and respiratory tracts are known to have resident microbiota, which might influence PCR performed on these samples. It is also possible that the method of sample collection, or postmortem handling of the tissues prior to embedding, could have introduced contamination. Another limitation of this assay is that sensitivity decreases when organisms are rarely observed. More sensitive sequencing techniques, such as next-generation sequencing, might have greater success in amplifying fungal DNA when there are rare organisms in the embedded tissue. However, these techniques are costly and not yet suitable for diagnostics.
There was variable ability of the assay to derive genus- and species-level resolution. The sequence analysis provided genus- and species-level resolution in 36% of all cases where they could not be distinguished based only on histologic morphology. For some genera, such as those belonging to the phaeohyphomycoses, the ITS-2 region was unable to distinguish between genera such as Curvularia, Bipolaris, and Alternaria. On the contrary, the ITS-2 sequence was sufficient to derive a genus-level identification for fungi such as Coccidioides, Cryptococcus, Penicillium, Rhizopus, Scedosporium, and the fungal-like Pythium. In other cases, species-level resolution was possible for Aspergillus, Blastomyces, Histoplasma, and Microsporum species. The ability to distinguish between as many as 6 different Aspergillus species prompted further phylogenetic analysis to confirm these results derived through BLAST. Bioinformatics literature discusses the limitations of BLAST to distinguish between taxa and promotes the superior ability of neighbor-joining analysis to do so. 34 Agreement of the BLAST results, neighbor-joining analysis, and culture (Table 3) demonstrates that this assay is indeed capable of reliably speciating Aspergillus. The ability to differentiate between species of fungal organisms has clinical relevance due to the documented differences in susceptibility to antifungal agents between fungal genera, species, 21,29 and even subspecies. 43 Taken in conjunction with the documented rise of fungal resistance to antifungal agents specifically in Aspergillus, 7 this tool may be extremely valuable for pathologists and clinicians treating these systemic mycoses.
It is interesting that 28 of 128 (21.9%) of all FFPE blocks returned sequences that were of poor quality, in spite of being purified from a strong band on the gel. Similar reports of ambiguous or poor-quality sequences were given in 1 of the original applications of this assay, 30 but this was not described in another more recent work. 36 Studies have shown through cloning that ITS sequence heterogeneity exists in some fungal genera including Fusarium 38 and even in strains of Rhizopus microsporus. 46 Most likely, there has not been an exhaustive investigation into which fungal genera, species, or strains possess this ITS sequence heterogeneity. We hypothesize that at least some of the “poor-quality” sequences in this study were the result of ITS sequence heterogeneity present in the genomes of fungi infecting those animal tissues. Statistical analysis revealed that poor-quality sequences were more common when there were rare organisms on the slide, multiple bands were present, or the bands were faint. These findings elucidate some of the limitations of this assay, and further molecular work such as cloning and sequencing and/or high-throughput sequencing might be used to identify fungi observed histologically when panfungal PCR with second-generation sequencing fails to identify an etiologic agent.
Another rarely reported finding 30 that was encountered in the present study was the presence of multiple bands in a sample identified with gel electrophoresis. Use of the IRBP PCR enabled confirmation of high-quality extracted DNA for these samples, and thus the presence of multiple bands is not likely due to fragmentation of the DNA. It is possible that these additional sequences were amplified from commensal or contaminating fungi present in the tissues. At least for the skin, 35 gastrointestinal tract, 18 and respiratory tract 15 tissues, recent next-generation sequencing studies have identified an enormous diversity of commensal fungi inhabiting these tissues. Although these commensal fungi are rarely seen histologically, their DNA could still be present in the tissues and amplified with this assay, possibly producing a false positive result. An additional possibility that could explain the presence of multiple bands is variation in the copy number of the ITS coding region, 9,32 which is present as tandem repeats in some species of fungi. 25,26 Another recent application of this assay on tropical mycoses 19 found that some of the amplified fungal ITS-2 sequences were not consistent with the histologic findings on those blocks. That study suggested that the amplified fungal DNA came from environmental contamination of the blocks. Although this is possible, it is also possible that commensal fungal DNA was amplified, as hypothesized here. This limitation indicates that the PCR and sequencing results provided by this assay need to be interpreted in the context of fungal morphology observed histologically.
In summary, this assay has been improved through reduction in cost and time, and it has been validated for a variety of animal hosts and fungal pathogens that commonly infect animals. Although some limitations still exist for the assay, it could provide a diagnosis when morphology based on histologic examination alone could not, and when fresh tissues were not available for fungal culture. Having a quick and accurate diagnosis enables the correct selection of antifungal therapeutics. Accurate identification of fungal infections in animals will enhance epidemiologic studies of current and emerging fungal threats not only to animals but to humans as well. Further development of genus- and species-specific PCR could help to resolve fungal identification for instances when the ITS region possesses sequence heterogeneity within species or when the ITS region is homogeneous across genera.
Footnotes
Acknowledgements
We thank Dr Xiaorong Lin, Department of Biology, Texas A&M University, for providing purified fungal genomic DNA, and Anna Blick, Department of Veterinary Pathobiology, Texas A&M University, for assistance with phylogenetic analysis.
Declaration of Conflicting Interests
The author(s) declared no potential conflicts of interest with respect to the research, authorship, and/or publication of this article.
Funding
The author(s) received no financial support for the research, authorship, and/or publication of this article.
References
Supplementary Material
Please find the following supplemental material available below.
For Open Access articles published under a Creative Commons License, all supplemental material carries the same license as the article it is associated with.
For non-Open Access articles published, all supplemental material carries a non-exclusive license, and permission requests for re-use of supplemental material or any part of supplemental material shall be sent directly to the copyright owner as specified in the copyright notice associated with the article.