
Abstract
Although the equine distal phalanx and hoof lamellae are biomechanically and physiologically integrated, bony changes in the distal phalanx are poorly described in laminitis. The aims of this study were (1) to establish a laminitis grading scheme that can be applied to the wide spectrum of lesions seen in naturally occurring cases and (2) to measure and describe changes in the distal phalanx associated with laminitis using micro–computed tomography (micro-CT) and histology. Thirty-six laminitic and normal feet from 15 performance and nonperformance horses were evaluated. A laminitis grading scheme based on radiographic, gross, histopathologic, and temporal parameters was developed. Laminitis severity grades generated by this scheme correlated well with clinical severity and coincided with decreased distal phalanx bone volume and density as measured by micro-CT. Laminitic hoof wall changes included progressive ventral rotation and distal displacement of the distal phalanx with increased thickness of the stratum internum–corium tissues with lamellar wedge formation. Histologically, there was epidermal lamellar necrosis with basement membrane separation and dysplastic regeneration, including acanthosis and hyperkeratosis, corresponding to the lamellar wedge. The changes detected by micro-CT corresponded to microscopic findings in the bone, including osteoclastic osteolysis of trabecular and osteonal bone with medullary inflammation and fibrosis. Bone changes were identified in horses with mild/early stages of laminitis as well as severe/chronic stages. The authors conclude that distal phalangeal pathology is a quantifiable and significant component of laminitis pathology and may have important implications for early detection or therapeutic intervention of equine laminitis.
Keywords
The structural integrity of the highly specialized and complex elements composing the equine foot—including the epidermal and dermal lamellae, bone, tendons, ligaments, and other connective tissues—is essential for suspension of the distal phalanx (DP) within the hoof capsule. The interface between the equine DP and inner hoof wall is unique in that the dorsal cortex of the DP is highly porous relative to the solar cortex or to the cortices of other bones in the appendicular skeleton. 39 These porosities correspond to perforating vascular channels that extend from the medullary spaces of the DP to supply the overlying lamellar tissues. 30,39 Thus, the unique interface of this specialized musculoskeletal unit provides a direct microanatomic integration between bone and epidermal/dermal lamellar tissues.
Laminitis is a disease affecting the epidermal and dermal lamellae of the inner hoof wall, which often progresses to a chronic phase. The chronic phase of laminitis is characterized by inadequate tissue healing and aberrant regenerative responses that result in lamellar hyperplasia and dysplasia, which correspond to the gross lesion of a lamellar wedge. 5,9,26 Horses with chronic laminitis and lamellar wedge formation often develop radiographically evident changes in the DP, such as bone remodeling and fractures along the solar margin, whereas in acute stages of laminitis, bone lesions are difficult to detect with routine imaging modalities. 2,30,34,42 Although magnetic resonance imaging of feet from horses with acute and chronic laminitis has identified evidence of DP bone remodeling and increased fluid within the medullary compartments (sometimes referred to as “bone marrow edema”), microarchitectural or cellular detail cannot be determined with this imaging modality. 2,36
Recent scientific studies of diseases involving osteolysis have begun to identify many molecular pathophysiologic links between bone and other body systems, including the integumentary, gastrointestinal, and nervous systems. 44,45 In humans, “bone marrow edema” has been observed in a broad spectrum of local and multisystemic conditions, including degenerative, inflammatory, infectious, endocrine, metabolic, and neoplastic processes, and it is associated with increased pain, a more rapid progression, or a worsening prognosis. 48 Moreover, bone remodeling with associated bone marrow inflammation, neovascularization, stromal cell activation, and edema was observed histologically in an archived set of acute and chronically laminitic equine feet, providing the impetus for the current study. 13 Although the remodeling changes described in laminitic feet suggested that a direct correlation might exist between lamellar epidermal/dermal lesions and DP lesions in equine laminitis, the stepwise progression and extent of laminitis-associated DP pathology had not been thoroughly characterized or systematically quantified. The current study was initiated to further investigate and characterize the potential role of DP lesions in the pathogenesis of laminitis.
Micro–computed tomography (micro-CT) has many advantages over conventional radiography, computed tomography, magnetic resonance imaging, or histomorphometry because it provides quantitative volumetric and morphometric measurements pertaining to bone microarchitecture and provides relatively expedient in situ stereologic information by generating detailed 3-dimensional image reconstructions. 4,19 Grading schemes published for experimentally induced models of laminitis—which are characterized by standardized induction stimulus, disease onset, and relatively early humane endpoint—are optimized to characterize pathology within focal regions of lamellae. 28,40,51 In preliminary studies, these schemes were found to be inadequate to characterize the severity or extent of hoof wall lesions observed in spontaneous cases of laminitis, which have inherent variation in lesion severity and distribution, disease duration, and extent of regeneration or wound healing (data not shown). Conversely, purely qualitative classifications of natural cases were not detailed enough to distinguish the more subtle lamellar pathology that occurs during the developmental and acute stages of laminitis, where gross or radiographic changes are not yet apparent. 18,25 –27,32 Therefore, to more accurately correlate lesions of the hoof wall with those of the DP in horses of different breed types, athletic uses, and clinical risk factors, we (1) developed a multiplicative, multimodal pathology grading scheme to provide a more comprehensive representation of hoof wall lesions that incorporates radiographic, gross, histopathologic, and temporal factors; (2) formulated a micro-CT protocol to objectively characterize and quantify microarchitectural changes in the DP; and (3) correlated lesions in the DP and hoof wall in spontaneous cases of laminitis.
Methods
Subjects
Thirty-six feet (front feet: n = 26, 72%; hind feet: n = 10, 28%) from 15 horses were collected at necropsy between September 2009 and January 2011 at the University of Pennsylvania, School of Veterinary Medicine, New Bolton Center (see Suppl. Table 1). Ages ranged from 1.5 to 22 years (mean, 7.3 years; median, 4 years) with 4 intact males, 7 geldings, and 4 females. Subjects were chosen on the basis of completeness and availability of historical data and the presence (n = 10) or absence (n = 5) of laminitis, as based on clinical history, active clinical signs, or radiographic evidence of DP displacement. Sample collection protocols were approved by the Institutional Animal Care and Use Committee of the University of Pennsylvania. Inclusion criteria for laminitis cases were exposure to ≥1 risk factors for laminitis and a clinical history of chronic (>72 hours) and/or active laminitis, defined by detection of ≥1 of the following clinical signs: Obel grade 1 (or greater) shifting weight lameness as diagnosed by a veterinarian, bounding digital pulses, persistent palpable hoof heat, clefting (palpable or visual depression) in the coronary region adjacent to the proximal hoof capsule, divergent hoof growth rings with concave dorsal hoof wall, and/or convex solar hoof capsule in the toe region. 38 Risk factors were confirmed at necropsy and included obesity/regional adiposity, pituitary pars intermedia dysfunction syndrome, visceral inflammatory disease, orthopedic inflammatory disease, or supporting limb overload.
The normal control group consisted of 5 horses with no clinical history or active signs of laminitis. Three of these did have risk factors for laminitis: supporting limb overload for <24 hours, postsurgical antimicrobial-associated colitis of 6 days duration, and obesity/regional adiposity.
Due to potential effects of athletic use or breed type on the architecture of the DP, horses were separated into 2 groups: (1) performance, or P (n = 9; 6 laminitis cases and 3 controls), defined as a horse currently involved in a regimented athletic training program for either racing or sport (eg, hunter/jumper, dressage, endurance, or driving activities), and (2) nonperformance, or NP (n = 6; 4 laminitis cases and 2 controls), defined as a horse that was not used for athletic activities or used only intermittently (eg, low-use “pleasure” horse). The P group (n = 9) comprised 7 Thoroughbreds, 1 Standardbred, and 1 Selle Français crossbred horse. The NP group (n = 6) comprised 2 Morgans, 1 Standardbred, 1 paint, and 2 crossbreds, including an American quarterhorse–Arabian cross, and a Thoroughbred-Welsh pony cross.
Each foot was analyzed separately because of the possibility of subclinical laminitis in feet that were presumed to be normal, as well as the potential variability in clinical signs and lesions among feet from horses exposed to risk factors for laminitis. Details pertaining to prior treatment or corrective shoeing were not evaluated, because this information was not available for all horses. Therefore, each foot was numbered based on the following: performance classification, the pathology grade (defined later), the unique identifying number of the horse (sequential order of necropsy), and the anatomic location of each foot examined per horse (left front foot, right front foot, left hind foot, right hind foot). Risk factors considered to influence all 4 feet equally were as follows: obesity and/or regional adiposity, defined by a body condition score ≥7 and/or cresty neck score ≥3; pituitary pars intermedia dysfunction, defined as having an antemortem clinical diagnosis with histologic confirmation of pituitary adenomatous hyperplasia or adenoma(s); and visceral inflammatory disease, including retained fetal membranes/metritis, pleuropneumonia, colitis, vasculitis, and sepsis. 6,16,31 Risk factors for laminitis deemed to influence select feet included supporting limb overload from severe sustained lameness in ≥1 limbs and orthopedic inflammatory disease, including cellulitis, inflammatory or septic arthritis/tenosynovitis, and osteomyelitis. Details pertaining to prior treatment or corrective shoeing were not evaluated, because this information was not available for all horses.
Tissue Retrieval: Radiographic and Gross Evaluation
Two biaxial parasagittal sections of each foot (approximately 1.5 and 2.0 cm thick) were made with a band saw (Suppl. Fig. S1). Because antemortem radiographs were not available for all specimens, nonweightbearing postmortem radiographs were taken of each 1.5-cm-thick parasagittal section (lateral-medial projection; 55kVP, 15 mA) prior to preparation for micro-CT imaging (Suppl. Fig. S2). Radiographic grades were based on absence (score = 1; Suppl. Fig. S2a) or presence (score = 2; Suppl. Fig. S2b) of radiographic changes consistent with laminitis, defined as changes in DP orientation relative to the external hoof wall or coronary band and/or changes in radiodensity or contour affecting the dorsal cortex or solar margin (Table 1). The intent of including this binary radiographic score was to separate mild, early laminitis lesions (often not radiographically apparent) from severe, advanced laminitis lesions (often associated with radiographic lesions in the DP). 34,42
Multimodal Laminitis Grading Scheme Including Radiographic, Gross and Histologic Criteria.
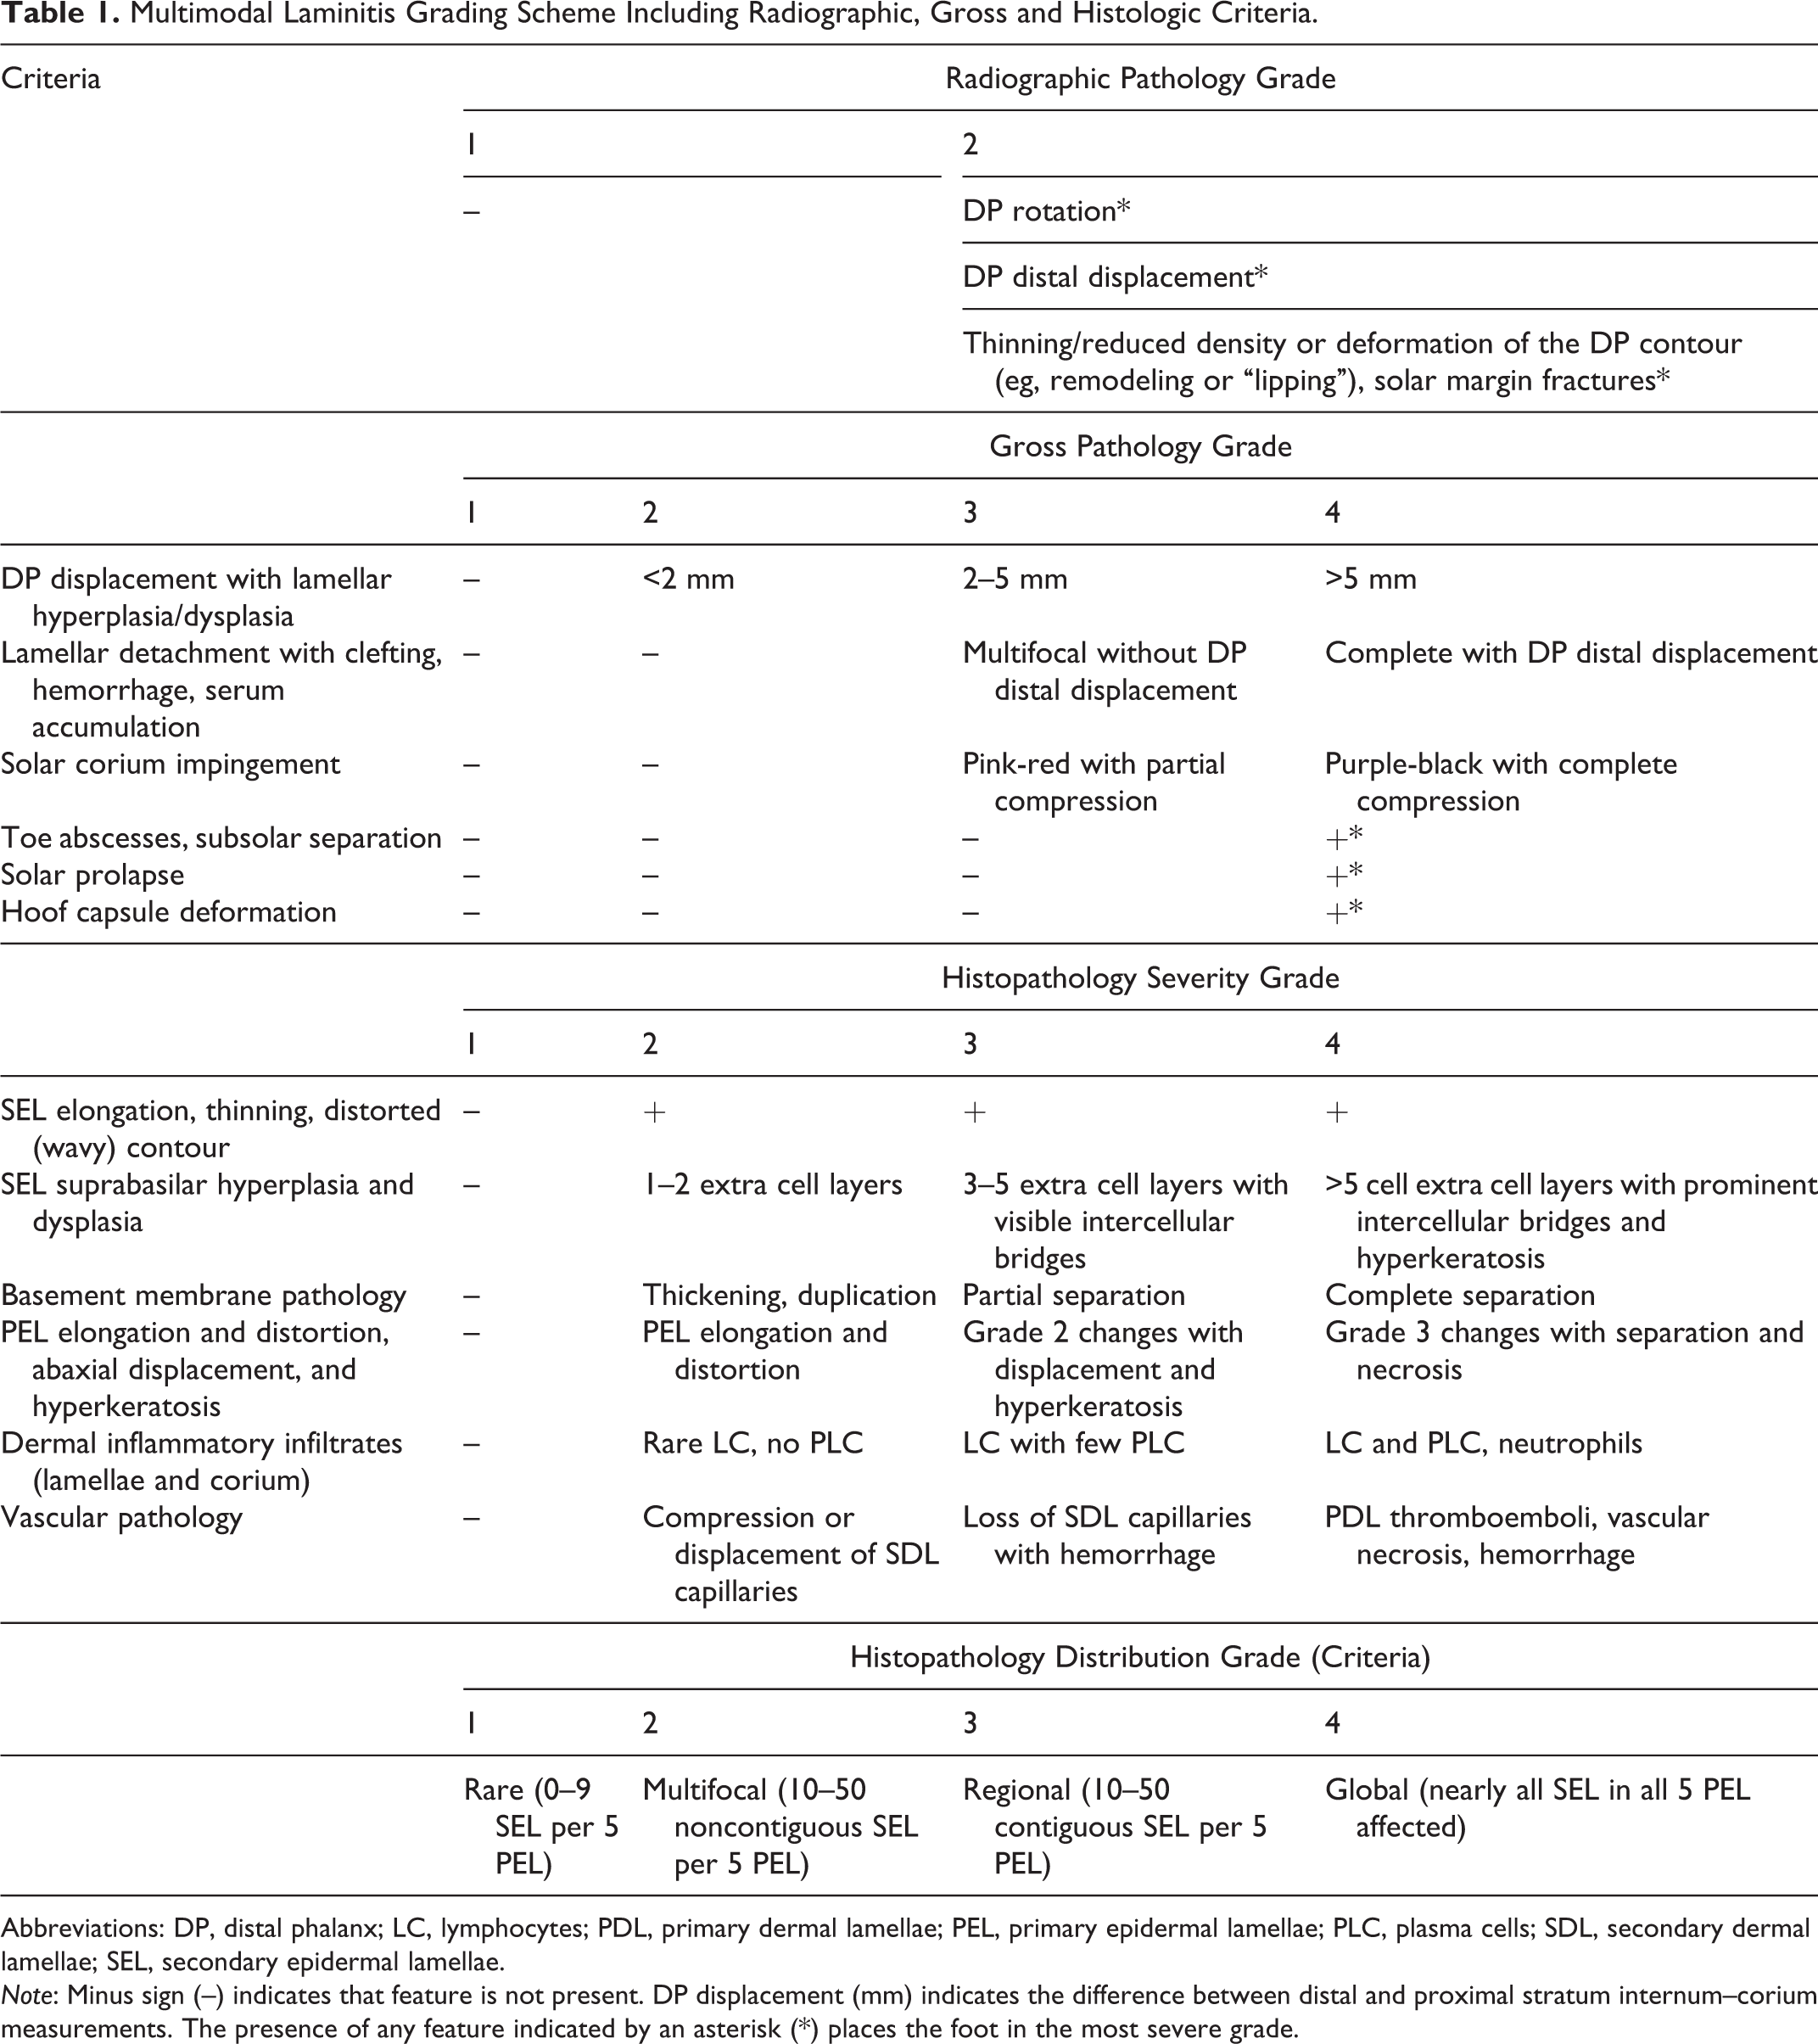
Abbreviations: DP, distal phalanx; LC, lymphocytes; PDL, primary dermal lamellae; PEL, primary epidermal lamellae; PLC, plasma cells; SDL, secondary dermal lamellae; SEL, secondary epidermal lamellae.
Note: Minus sign (–) indicates that feature is not present. DP displacement (mm) indicates the difference between distal and proximal stratum internum–corium measurements. The presence of any feature indicated by an asterisk (*) places the foot in the most severe grade.
The 2.0-cm-thick section was photographed and graded for gross lesions (1 = none, 2 = mild, 3 = moderate, 4 = severe) based on DP rotation and distal displacement, lamellar hyperkeratosis/dyskeratosis (ie, lamellar wedge formation), separation and necrosis of lamellae or solar corium, subsolar (toe) abscesses, and hoof capsule deformation (Table 1). 10,14,26 The degree of DP displacement was measured on parasagittal sections and defined as the distance between the dorsal surface of the DP and the inner limits of the stratum medium, referred to as stratum internum–corium measurement (SICM). DP displacement in laminitic cases was identified as a distal SICM that was ≥2 mm greater than proximal SICM. SICM measurements were recorded for proximal, middle, and distal thirds of the hoof wall and averaged for a mean SICM value.
Lamellar tissues were harvested from the thicker parasagittal section as described. 7 Transverse sections of tissue were dissected from proximal, middle, and distal thirds of the hoof capsule that included approximately 2 mm of the inner nonpigmented portion of the stratum medium (hoof wall), epidermal/dermal lamellae, and the corium dermis up to, but not including, the dorsal surface of the DP (Suppl. Fig. S3). All tissues were fixed in 10% formalin for no more than 24 hours and then transferred to 70% ethanol.
Lamellar Histopathology and Generation of Predictor Variables
Routine histopathology and scoring were performed on 10% formalin-fixed, paraffin-embedded lamellar tissues stained with hematoxylin and eosin and periodic acid–Schiff reaction. The pathologist was blinded to the case history, gross lesions, and radiographic findings. Three sections of lamellae (approximately 1 cm wide) from the proximal, middle, and distal thirds of the hoof wall were evaluated (Suppl. Fig. S3). Mean primary epidermal lamellar length was the average of 5 randomly selected lamellae in the middle section (Table 1). A histopathology severity grade, (1 = normal/minimal, 2 = mild, 3 = moderate, 4 = severe) and a histopathologic distribution grade (1 = normal/focal, 2 = multifocal, 3 = regional, 4 = global) were determined for each proximal, middle, and distal section and averaged to obtain the histopathology severity and histopathologic distribution grades for the foot. The histopathologic severity grade was based on secondary epidermal lamella (SEL) elongation, thinning, and contour distortion; SEL suprabasilar hyperplasia and dysplasia; basement membrane thickening, duplication, and separation; primary epidermal lamellar elongation and distortion; abaxial displacement, hyperkeratosis, and distortion of the keratinized axes; corium and lamellar dermal inflammation; and vascular pathology (Table 1). 12,18,33,40 Rare or focal minimal distortions of SEL without evidence of necrosis or basement membrane separation (TPG-DUR < 10) were included within the normal P1/NP1 groups, and based on the clinical histories of the feet, these minimal lesions were likely clinically insignificant and thus considered variations of normal. 47 To further distinguish between acute, subacute, and chronic lesions, a score for duration of disease was given to each foot according to the clinical history (1 = 0–5 days, 2 = 6–14 days, 3 = 15–30 days, 4 = 30 or more days).
Total pathology grade (TPG) was generated by multiplying the grades for radiographic signs (1–2), gross severity (1–4), histologic severity (1–4), and histologic distribution (1–4). TPG with duration factor (TPG-DUR) was generated by multiplying TPG by the duration grade (1–4; Suppl. Table 1). These multiplicative grading schemes allowed us to incorporate the spectra and extent of lesion severity observed in spontaneous cases of laminitis, with variable presentations and diverse risk factors, and to separately consider duration of disease as an additional factor in the context of radiographic, gross, and histologic findings. Similar multiplicative formulas have been reported for the evaluation of experimental and clinical osteoarthritis and cancer pathology assessment. 3,23,41 This scheme also improved our ability to distinguish mild and early lesions from severe, advanced lesions (data not shown).
Data obtained from the multiplicative grading scheme (TPG-DUR; Suppl. Table 1) stratified into 5 laminitis severity subgroups. Feet from P horses stratified into 3 groups: P1 (normal or minimal pathology; TPG-DUR < 10), P2 (acute-subacute, mild subclinical pathology; 10 ≤ TPG-DUR < 100), or P3 (chronic, moderate-severe, clinically evident pathology; TPG-DUR ≥ 100). In NP horses, all but 1 foot stratified into either the NP1 group (normal; TPG-DUR < 10) or the NP3 group (severe/chronic; TPG-DUR ≥ 100). This 1 hind foot came from a NP horse with pituitary pars intermedia dysfunction and severe laminitis in the front feet of 3 months’ duration. Because this foot had very mild histologic lesions (group NP1, horse No. 6, left hind foot: TPG = 6, TPG-DUR = 24) that were not considerably different from other feet in the NP1 group, it was assigned to NP1. This resulted in the lack of a “subclinical” NP2 group for feet from NP horses for this study.
Microcomputed Tomography and Bone Histopathology
Due to size constraints of the micro-CT system, DPs were obliquely subsectioned into proximal and distal portions with a water-cooled diamond band saw (model C-40; Gryphon Corporation, Sylmar, CA, USA) for separate scanning and analysis (Suppl. Fig. S4). DP subsections were placed into a 50-mL conical tube partially filled with solidified 2% agarose gel solution to maintain proper orientation and then loaded into the micro-CT system (vivaCT 40; Scanco Medical AG, Brüettisellen, Switzerland). Subsections were imaged at 25-µm voxels for a total of 50 slices at a beam intensity of 70 kV/0.18 mA. Raw measurements, measurement evaluation (slice-wise evaluation, 2- and 3-dimensional morphometry), and image documentation were performed using a computer interface program (VIII.3) and operating software (OpenVMS/ DECwindows Motif). Raw scans of DP subsections performed in the dorsal-palmar plane were reformatted to an orthogonal axis to obtain images in the parasagittal plane (Fig. 1, left). For each distal and proximal DP subsection, contour lines delineating the region of interest for compact and trabecular bone compartments were drawn for the given range of scanned sections (slices) at 10-slice intervals utilizing a computer mouse integrated with computer design software; computer interpolated contours for slices in between the manually drawn contours were utilized and manually recontoured, if necessary (Fig. 1, right). Different global threshold parameters (360/245 with sigma = 0.8 and support level = 1) were optimized for detecting equine DP compact/trabecular bone, respectively, and were applied to micro-CT analyses.
4,19
Bone within each DP subsection, including total bone (combined compact and trabecular bone) and separate compact and trabecular bone compartments, was quantitatively analyzed for standard 3-dimensional volumetric/morphometric indices (Suppl. Table 3). Indices included the following: total volume fraction (mm3), defined as the volume of the entire region of interest (bone and medullary spaced combined); bone volume (mm3), defined as the volume of the region segmented as bone; bone volume fraction (unitless), defined as the ratio of the segmented bone fraction to the total volume of the region of interest; mean mineral (hydroxyapatite) density of the total volume (mgHA/mm3), defined as the average density of mineralized tissue of the entire region of interest; mean mineral (hydroxyapatite) density of bone volume (mgHA/mm3), defined as the average density of mineralized tissue of the bone volume; connectivity density (1/mm3), defined as a measure of the degree of trabeculae connectivity normalized to the total volume; structure model index (unitless), a measure of the change of the shape and orientation of trabeculae; trabeculae number (1/mm), defined as a measure of the average number of trabeculae per unit length; trabeculae thickness (mm), defined as the mean thickness of trabeculae as determined by 3-dimensional morphometrics; and trabecular spacing (mm), defined as the mean distance or separation between trabeculae.
4
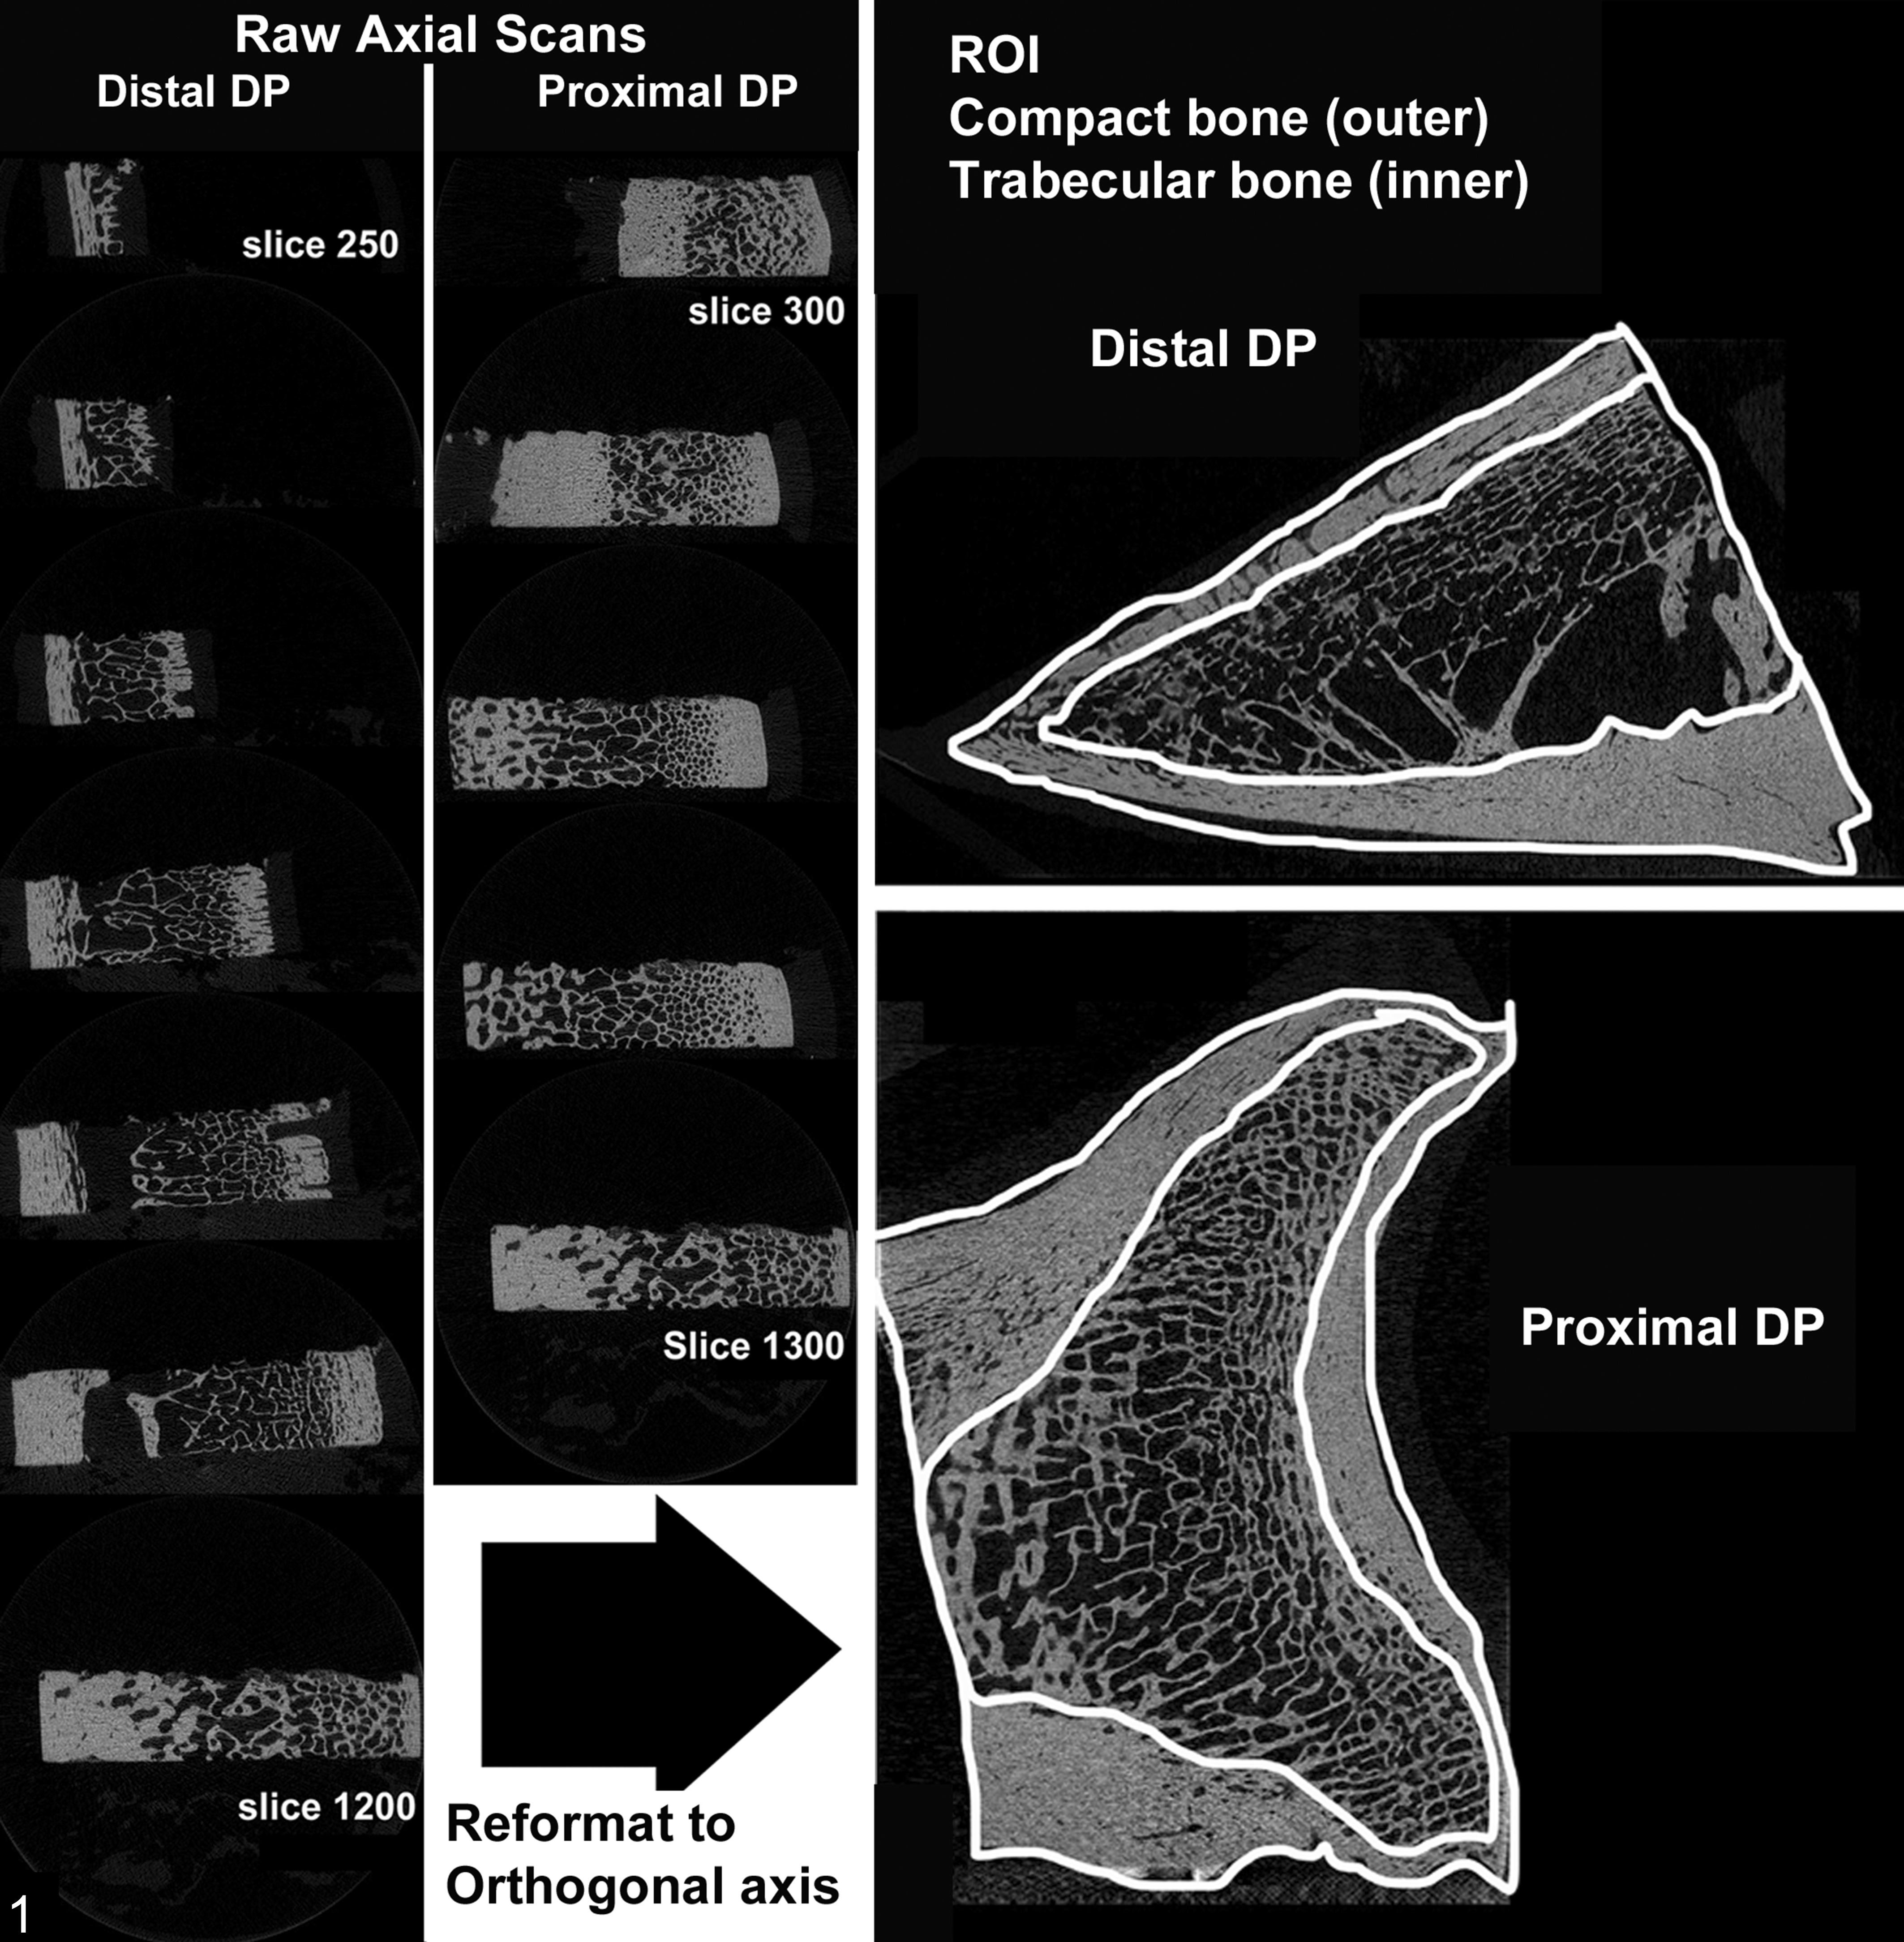
Micro–computed tomography protocol, distal phalanx (DP), horse. Raw axial scans for each subsection of DP were made in the frontal plane (left). These initial scanned images were later reformatted to an orthogonal axis prior to manual delineation of contour lines for outer compact and inner trabecular bone compartments defining regions of interest (ROI) for micro–computed tomography analyses (right).
Following micro-CT analysis, formalin-fixed subsections of each DP were decalcified in an aerated solution of 15% formic acid that was changed every 2 days until the bone could be sagittally sectioned with a microtome blade. Sections were rinsed for 1 hour in running cold tap water prior to routine processing, paraffin embedding, microtomy at 6-µm thickness, and staining with hematoxylin and eosin. Proximal and distal subsections of the DP were evaluated in a blinded fashion. Due to the large size of the sections, qualitative evaluations were performed within a region of bone standardized for all sections that consistently demonstrated the most evident changes (data not shown). The region included a 2-cm2 area that was centered on the junction of the middle to distal thirds of the distal DP subsection. Histologic features were scored as follows: 0, not present; 1, mild; 2, moderate; 3, severe (Suppl. Table 1). These features included osteoclastic osteolysis, defined as presence of multinucleate osteoclast cells either directly adjacent to bone or within resorption lacunae; reactive osteoproliferation, defined as presence of increased numbers of plump polygonal osteoblasts directly abutting eosinophilic seams of osteoid and/or incorporated into hypercellular, disorganized proliferation of woven bone; medullary inflammation, defined as increased numbers of inflammatory cells, including lymphocytes, plasma cells, or neutrophils; medullary fibrosis, defined as replacement of normal adipose tissue by a dense collagenous stroma with embedded spindle cells; and vascular sclerosis, defined as intimal, medial, or adventitial thickening of the vascular wall by increased number of spindle cells embedded within a myxoid or collagenous matrix.
Data Analysis
Statistical analysis was performed using STATA11.2 (StataCorp LP, College Station, Texas, USA). Because of the novelty of the investigation, the relatively small sample size, and the nature of the distribution of the observations to be examined, all statistical tests were backed up by detecting outlier influence on any results and by exploring the need for normality, for observation homogeneity (of variance), and for observation independence. Therefore, the results from routine statistical methods based on conservative tests were compared with (1) those that were robust; (2) those that were against outliers (robust regression methods), against nonnormality (nonparametric methods), and against inhomogeneity of variance (statistical tests not imposing an assumption of uniform variance; eg, means comparisons with Satterthwaite correction); and (3) those that had lack of independence by reference to repeated measures regression methods.
For investigation of the association among categorical exposure variables (eg, stratification groups) on interval pathology outcomes, a 1-way analysis of variance was performed in conjunction with the Bartlett test for equal variance and with the Bonferroni post hoc test modification, to preserve the type 1 error rate. A P value of .05 was used to assess the statistical significance of all tests for either associations or differences.
Results
Clinical–Pathologic Correlations
Historical, clinical, pathologic, and micro-CT data are presented in Supplemental Tables 1 and 2. Significant differences (P < .05) in age (P: 3.6 ± 1.5 years; NP: 11.3 ± 6.9 years) and sex distribution were present between the P and NP horses (Suppl. Table 3). Risk factors for laminitis were unequally distributed among the P and NP horses: NP horses had metabolic/endocrinopathic risk factors, while risk factors in P horses were mainly supporting limb overload and visceral or orthopaedic inflammatory disease (Suppl. Table 3).
The assignment of stratification groups, prompted by the clustering of historical factors and pathology grades among different feet, were designated as P1, P2, and P3 for P horses and NP1 and NP3 for NP horses (Table 2). The P1 and NP1 stratification groups, assigned to 15 feet from 8 horses (42% of 36 feet analyzed), represented no gross radiographic or histologic manifestations of laminitis (Figs. 2, 3). The P2 stratification group, assigned to 8 feet from 5 P horses, represented mild acute or subclinical laminitis. Hoof wall changes were often not radiographically apparent, with no or mild gross changes characterized by <2-mm DP displacement with mildly increased mean SICM (Fig. 4) and mild primary epidermal lamellar elongation and distortion (Fig. 5). Of these 8 feet, 2 (25%) were from horses with a much shorter duration and clinical severity of laminitis than other laminitis cases (Table 2). The other 6 (75%) had no history of laminitis, but there were ≥1 risk factors for laminitis, including visceral inflammatory disease, orthopedic inflammatory disease, and/or supporting limb overload. Although 2 of 8 P2 feet (25%) were grossly normal, 6 of 8 P2 feet (75%) had mild-moderate gross lesions. Only 1 foot (13%) had radiographic evidence of laminitis observed in the unweighted parasagittal section. The P3 and NP3 stratification groups were assigned to 13 feet from 8 horses (36% of 36 feet analyzed) and represented severe, clinically overt, and long-standing laminitis that was radiographically apparent. Lesions included severe rotation and displacement of the DP with complete lamellar detachment and impingement of the sole, as well as lamellar wedge formation with lamellar hyperkeratosis, marked primary epidermal lamellar displacement, elongation, and distortion (Figs. 6–9).
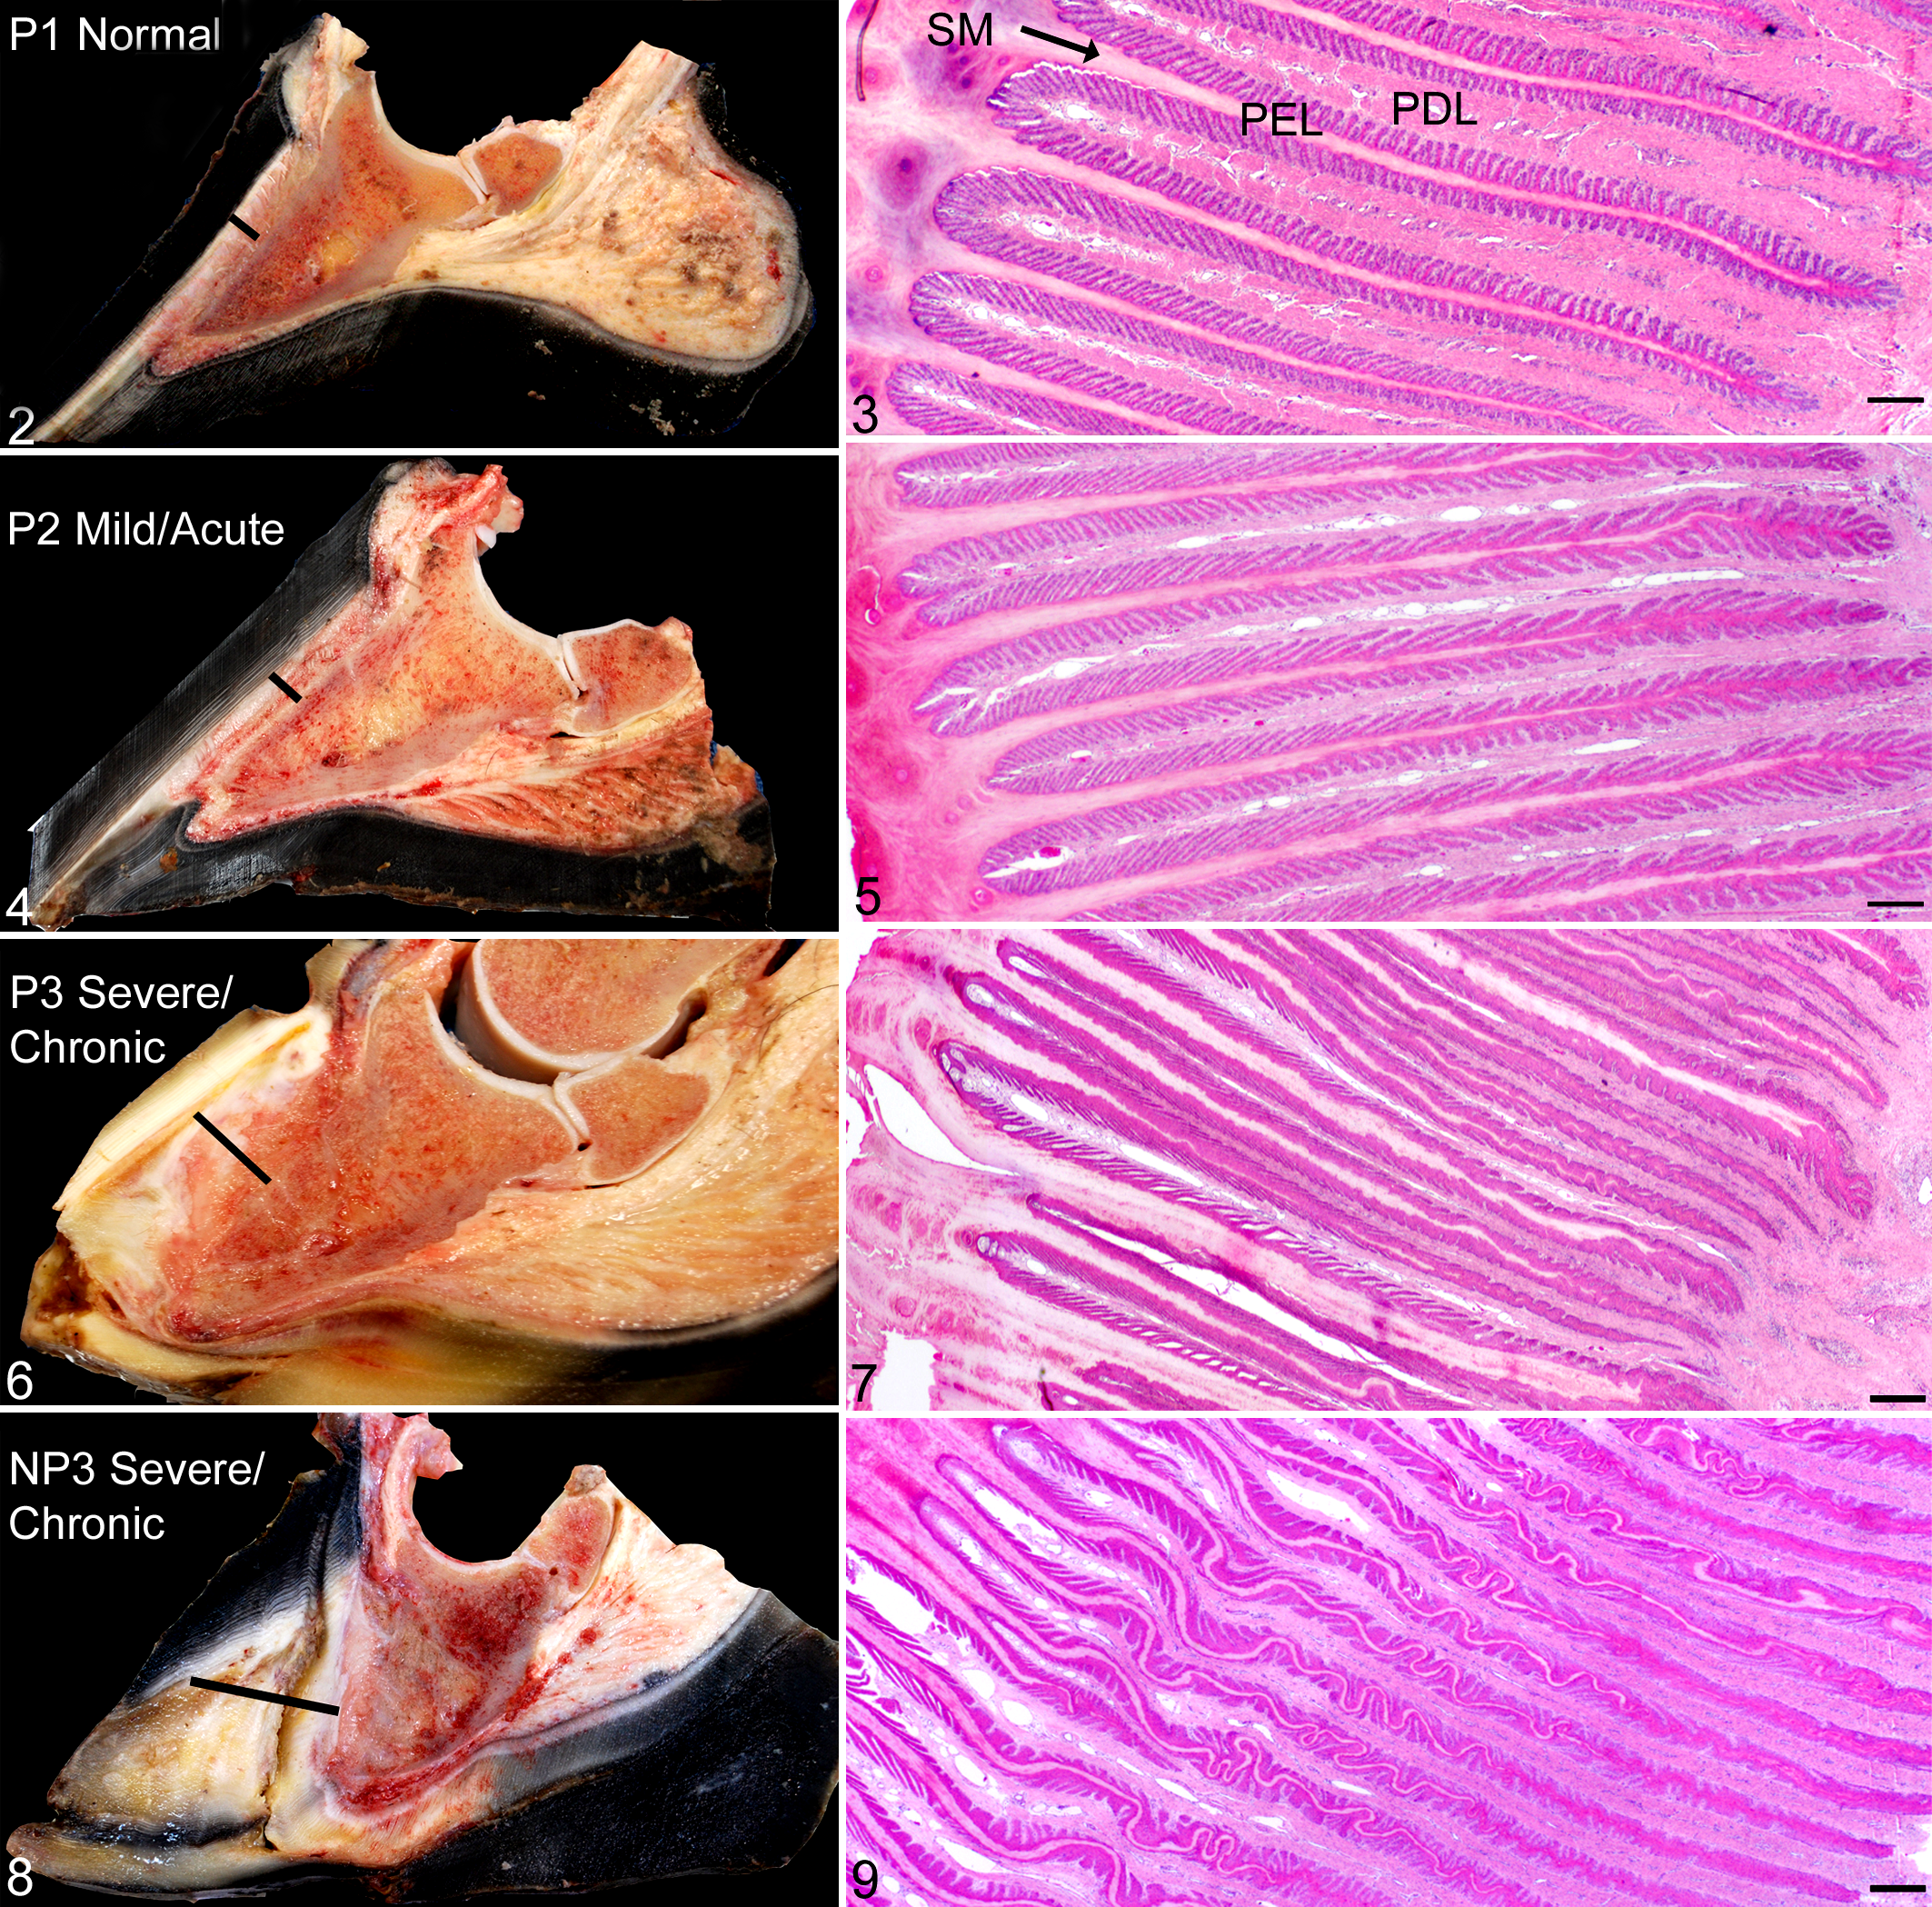
Digit and lamellae of the hoof, equine.
Pathology Data by Stratification Groups.
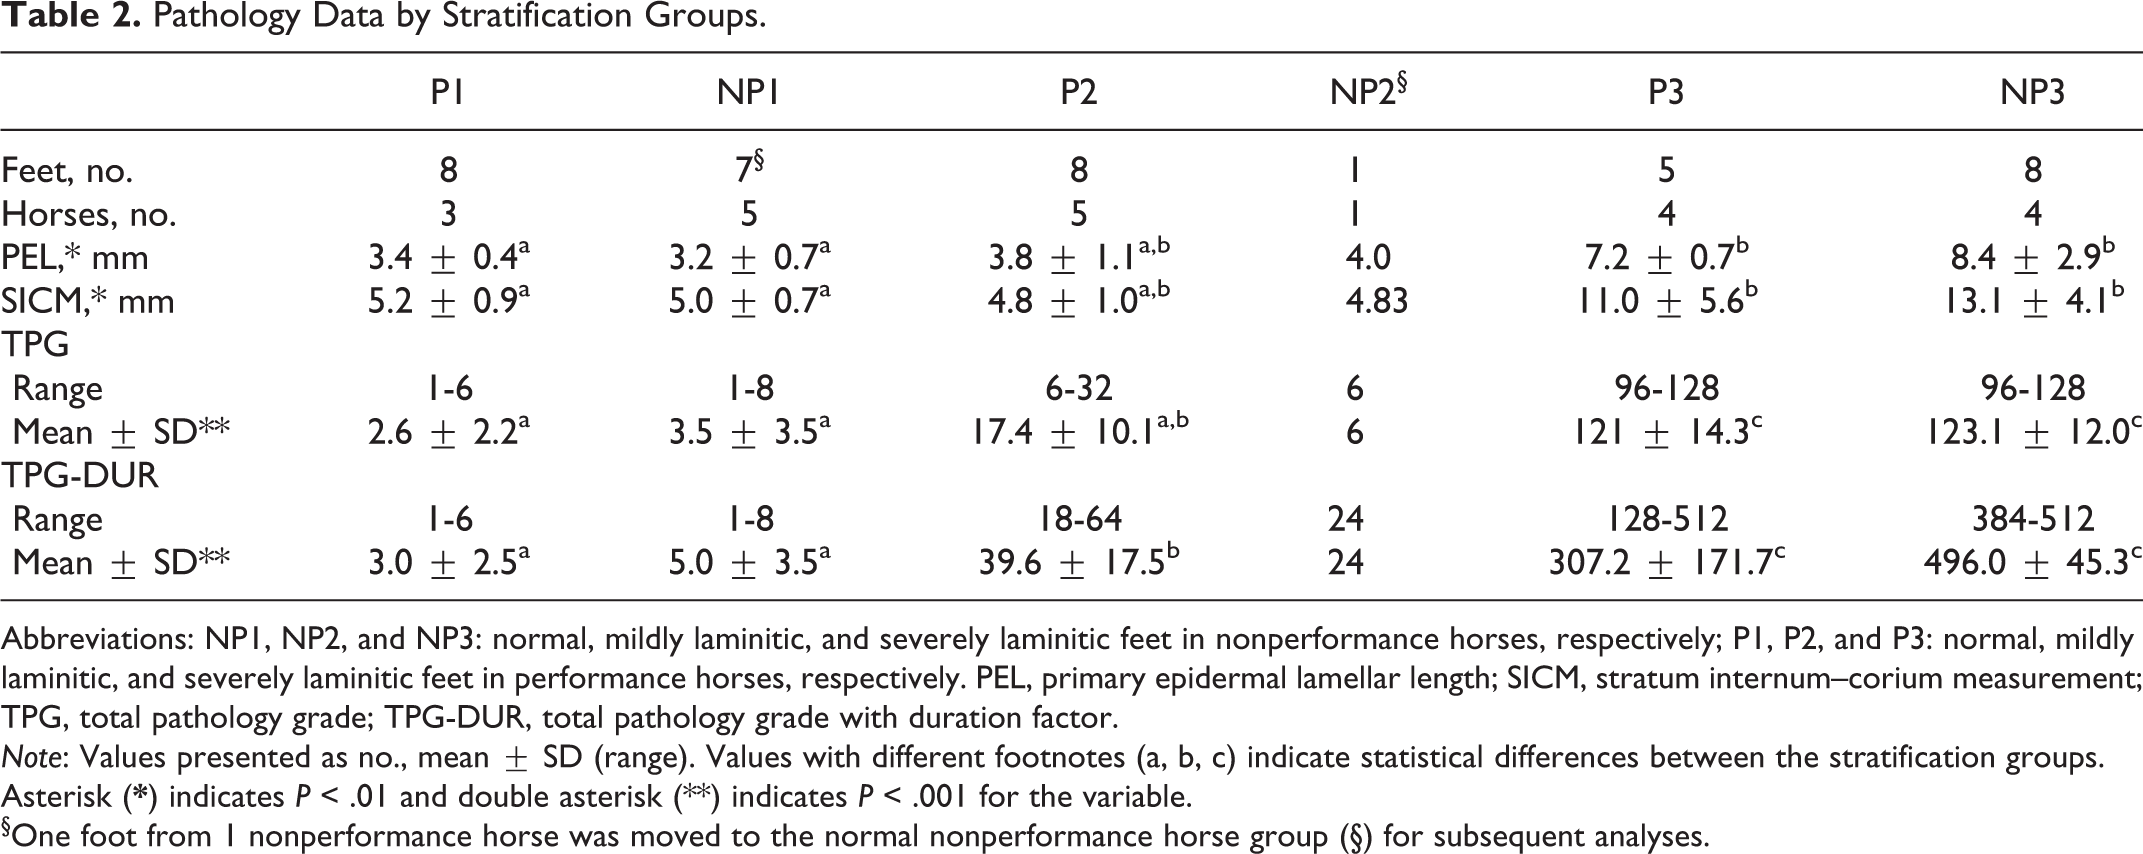
Abbreviations: NP1, NP2, and NP3: normal, mildly laminitic, and severely laminitic feet in nonperformance horses, respectively; P1, P2, and P3: normal, mildly laminitic, and severely laminitic feet in performance horses, respectively. PEL, primary epidermal lamellar length; SICM, stratum internum–corium measurement; TPG, total pathology grade; TPG-DUR, total pathology grade with duration factor.
Note: Values presented as no., mean ± SD (range). Values with different footnotes (a, b, c) indicate statistical differences between the stratification groups. Asterisk (
§One foot from 1 nonperformance horse was moved to the normal nonperformance horse group (§) for subsequent analyses.
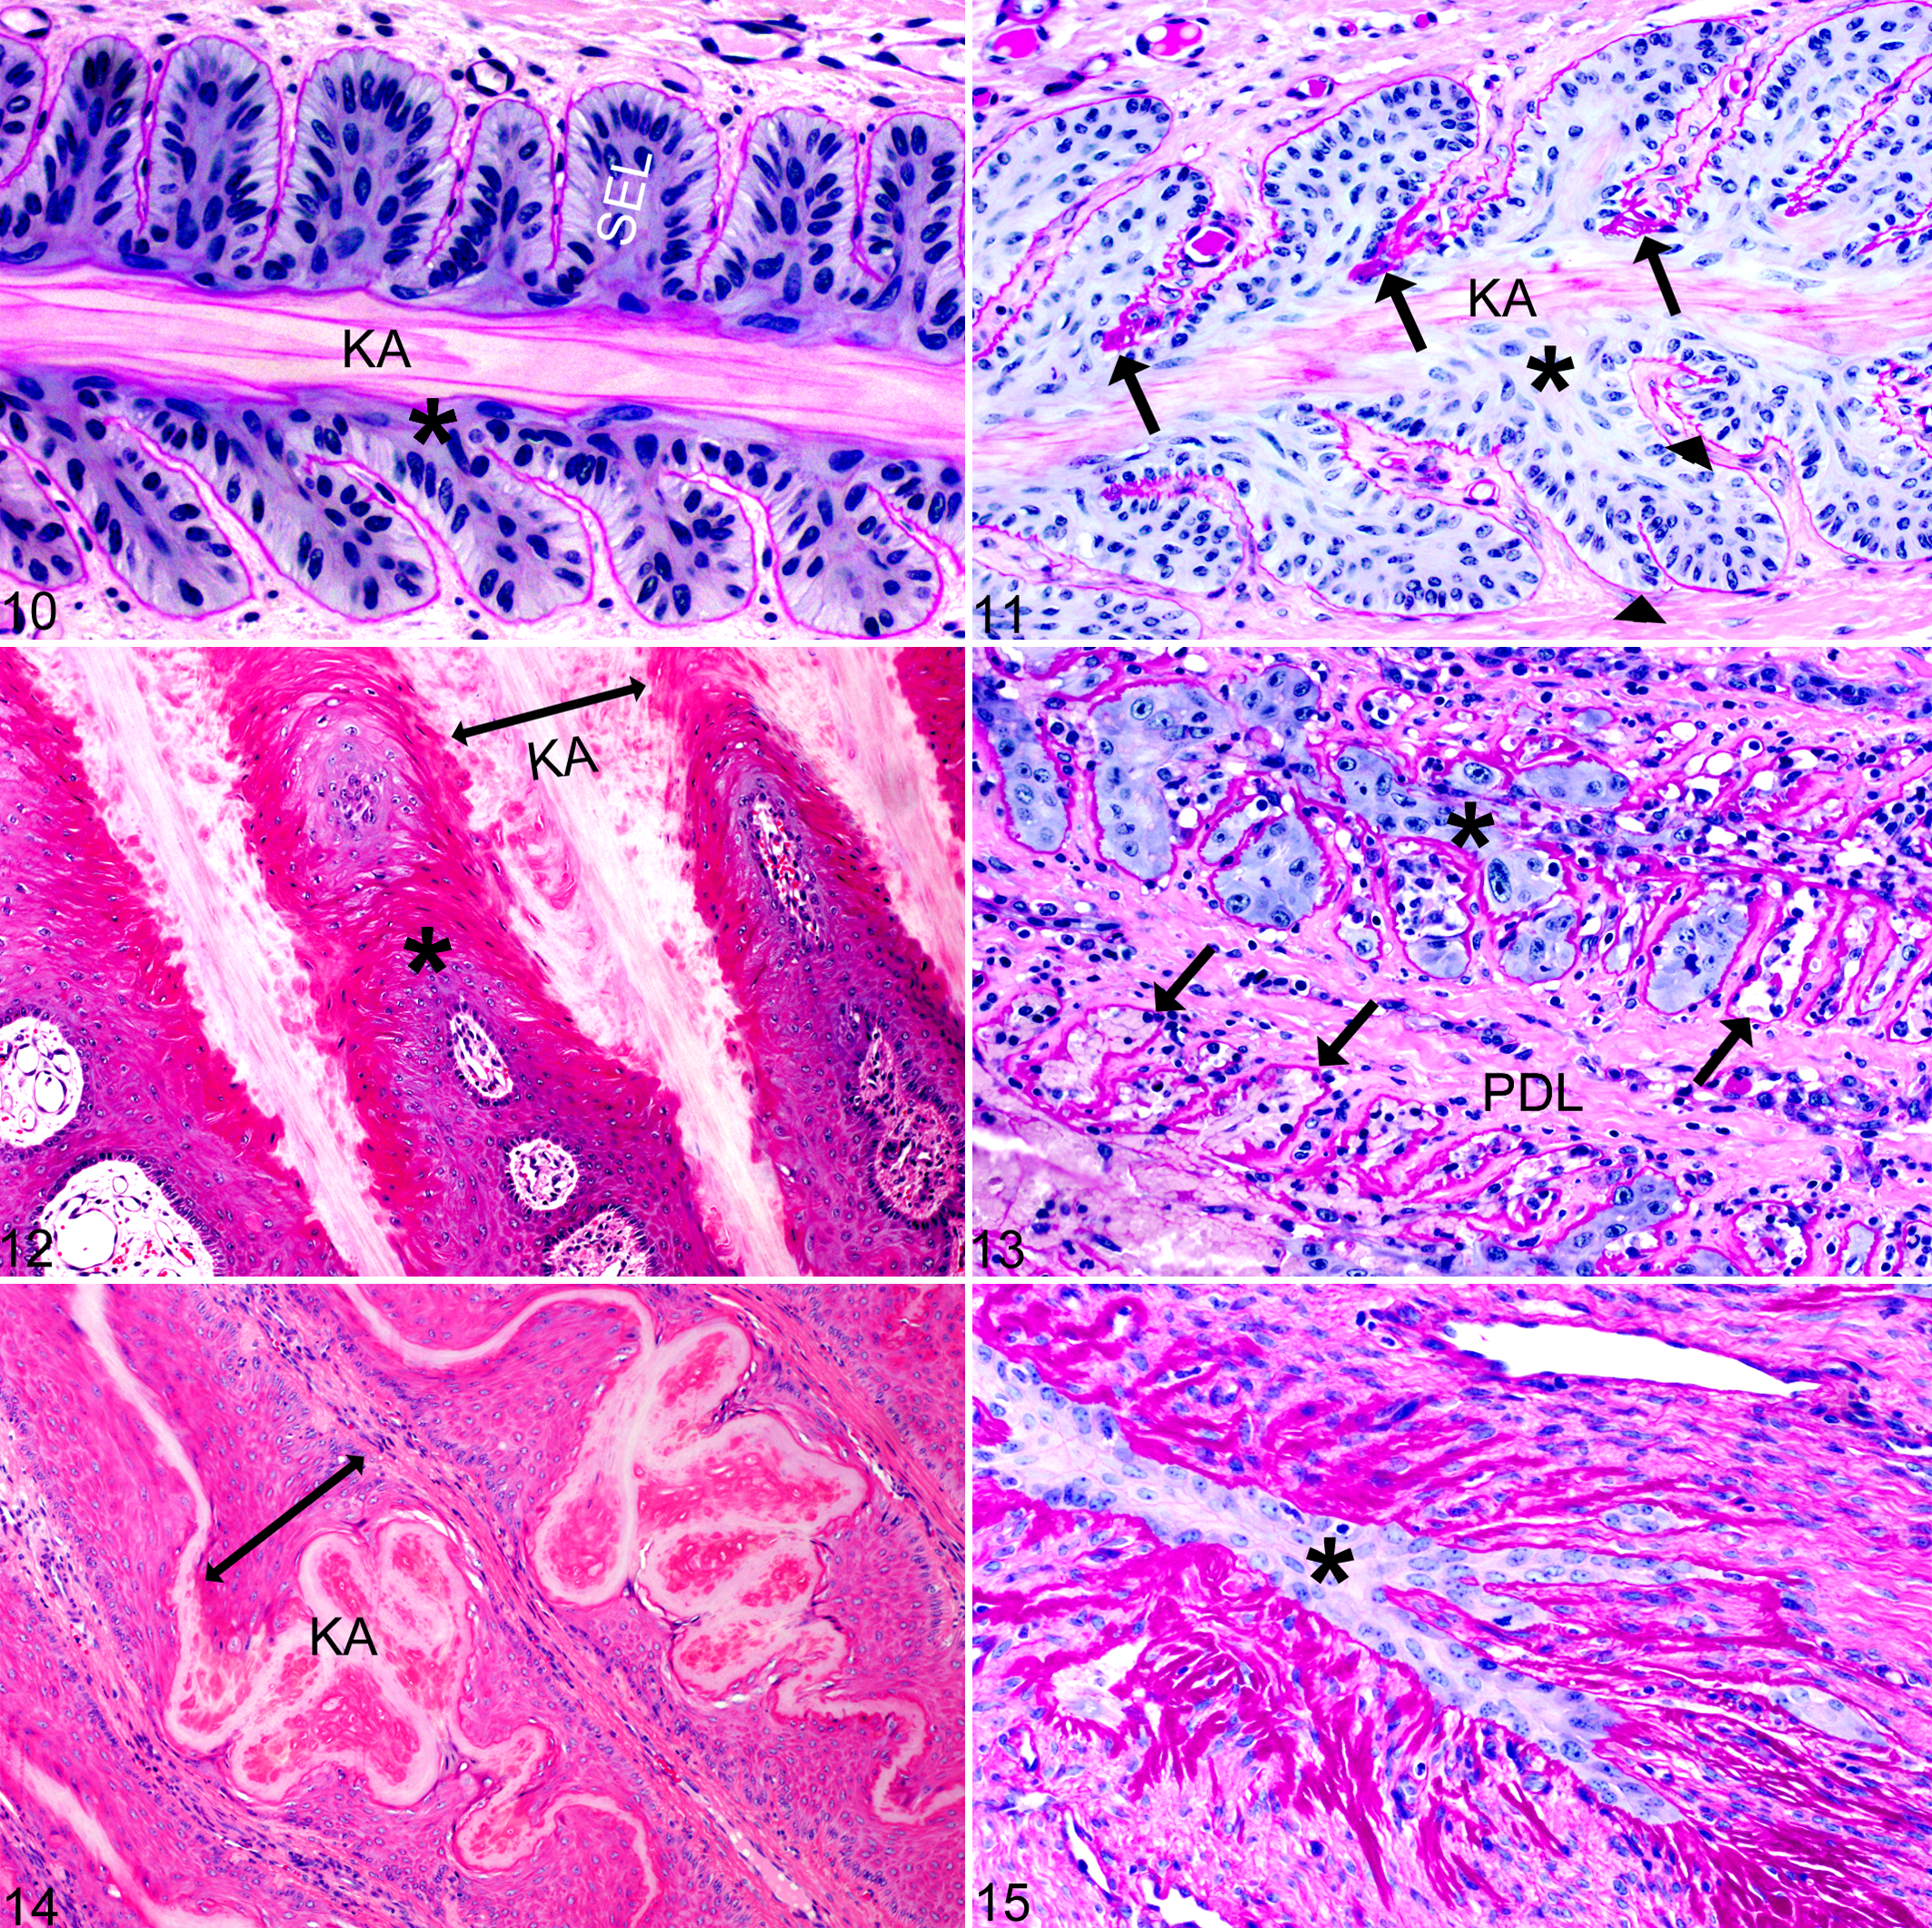
Histologically (Figs. 10–15), as compared to normal P1 feet (Fig. 10), lamellae in P2 feet showed SEL elongation and thinning or aberrant SEL contours with duplication/splitting of the basement membrane, expansion of the suprabasilar layers (1–5 extra layers), and wavy distortion of the keratinized axes (Fig. 11). P3/NP3 feet had severe, global lamellar separation and abaxial displacement of the keratinized axes with pockets of hemorrhage, serum, and cellular debris that merged with hyperkeratotic plaques produced from dysplastic lamellae (Figs. 7, 9, 12). In the abaxial region of primary epidermal lamellae, there was marked lamellar dysplasia with severe SEL blunting and loss, acanthosis, hyperkeratosis, and merging of the keratinized axes, creating residual islands of primary dermal lamellae (PDL; Fig. 12). Axial regions of lamellae (Fig. 13) often showed active SEL necrosis with complete separation from the basement membrane and perivascular neutrophilic to lymphoplasmacytic inflammation of PDL and deep corium. Empty remnants of basement membrane contained either eosinophilic proteinaceous fluid with cell debris and inflammatory cells or dysplastic (regenerating) keratinocytes with disorganized large bizarre nuclei containing large nucleoli (Fig. 13). In other regions, there was severe distortion of the keratinized axes with elongated, thinned, or severely blunted SEL that had >5 extra layers of suprabasilar cells having prominent intercellular bridges (Fig. 14). Occasionally, only thin strands of dysplastic lamellar keratinocytes surrounded by collapsed finger-like projections of basement membrane remnants replaced axial portions of lamellae (Fig. 15).
Lamellae of the hoof, equine.
Statistically significant differences in mean SICM and primary epidermal lamellar length were found between stratification groups P1/NP1 and P3/NP3 but not between P2 and P1/NP1 or P3/NP3. Despite the small sample size, significant differences for SICM and primary epidermal lamellar measurements between the normal P1 and NP1 feet were not found. TPGs with and without the duration factor (TPG vs TPG-DUR) were statistically different between stratification groups P1/NP1 and P3/NP3 but not between P2 and P1/NP1 or P3/NP3. Although loge transformation of the TPG could discern statistically significant differences between the P2 and P3/NP3, only loge transformation of TPG-DUR could discern differences between P1/NP1 and P2, as well as P2 and P3/NP3 (Suppl. Fig. S5).
Pathological Bone Volumetric/Morphometric and Histopathologic Correlations
TPG-DUR reflects both the TPG and the clinical duration of disease. Linear regression analysis performed for each loge (ln)–transformed micro-CT parameter (outcome variable) with the ln(TPG-DUR) (exposure variable) for each foot showed significant negative linear correlation (P < .05) between lnTPG-DUR and the following outcome variables: total bone volume (mm3; Fig. 16a); compact bone volume (mm3; Fig. 17a); trabecular bone volume (mm3; Fig. 18a); trabecular connectivity density (1/mm3; Fig. 19a); total volume (mm3) DP compact bone volume fraction (unit = 1); DP trabecular bone compartment volume (mm3); DP total bone volume fraction (unit = 1); mean mineral (hydroxyapatite) density of the compact bone compartment (mgHA/cm3); and structure model index (unit = 1) of the trabecular bone compartment (Suppl. Table 2).
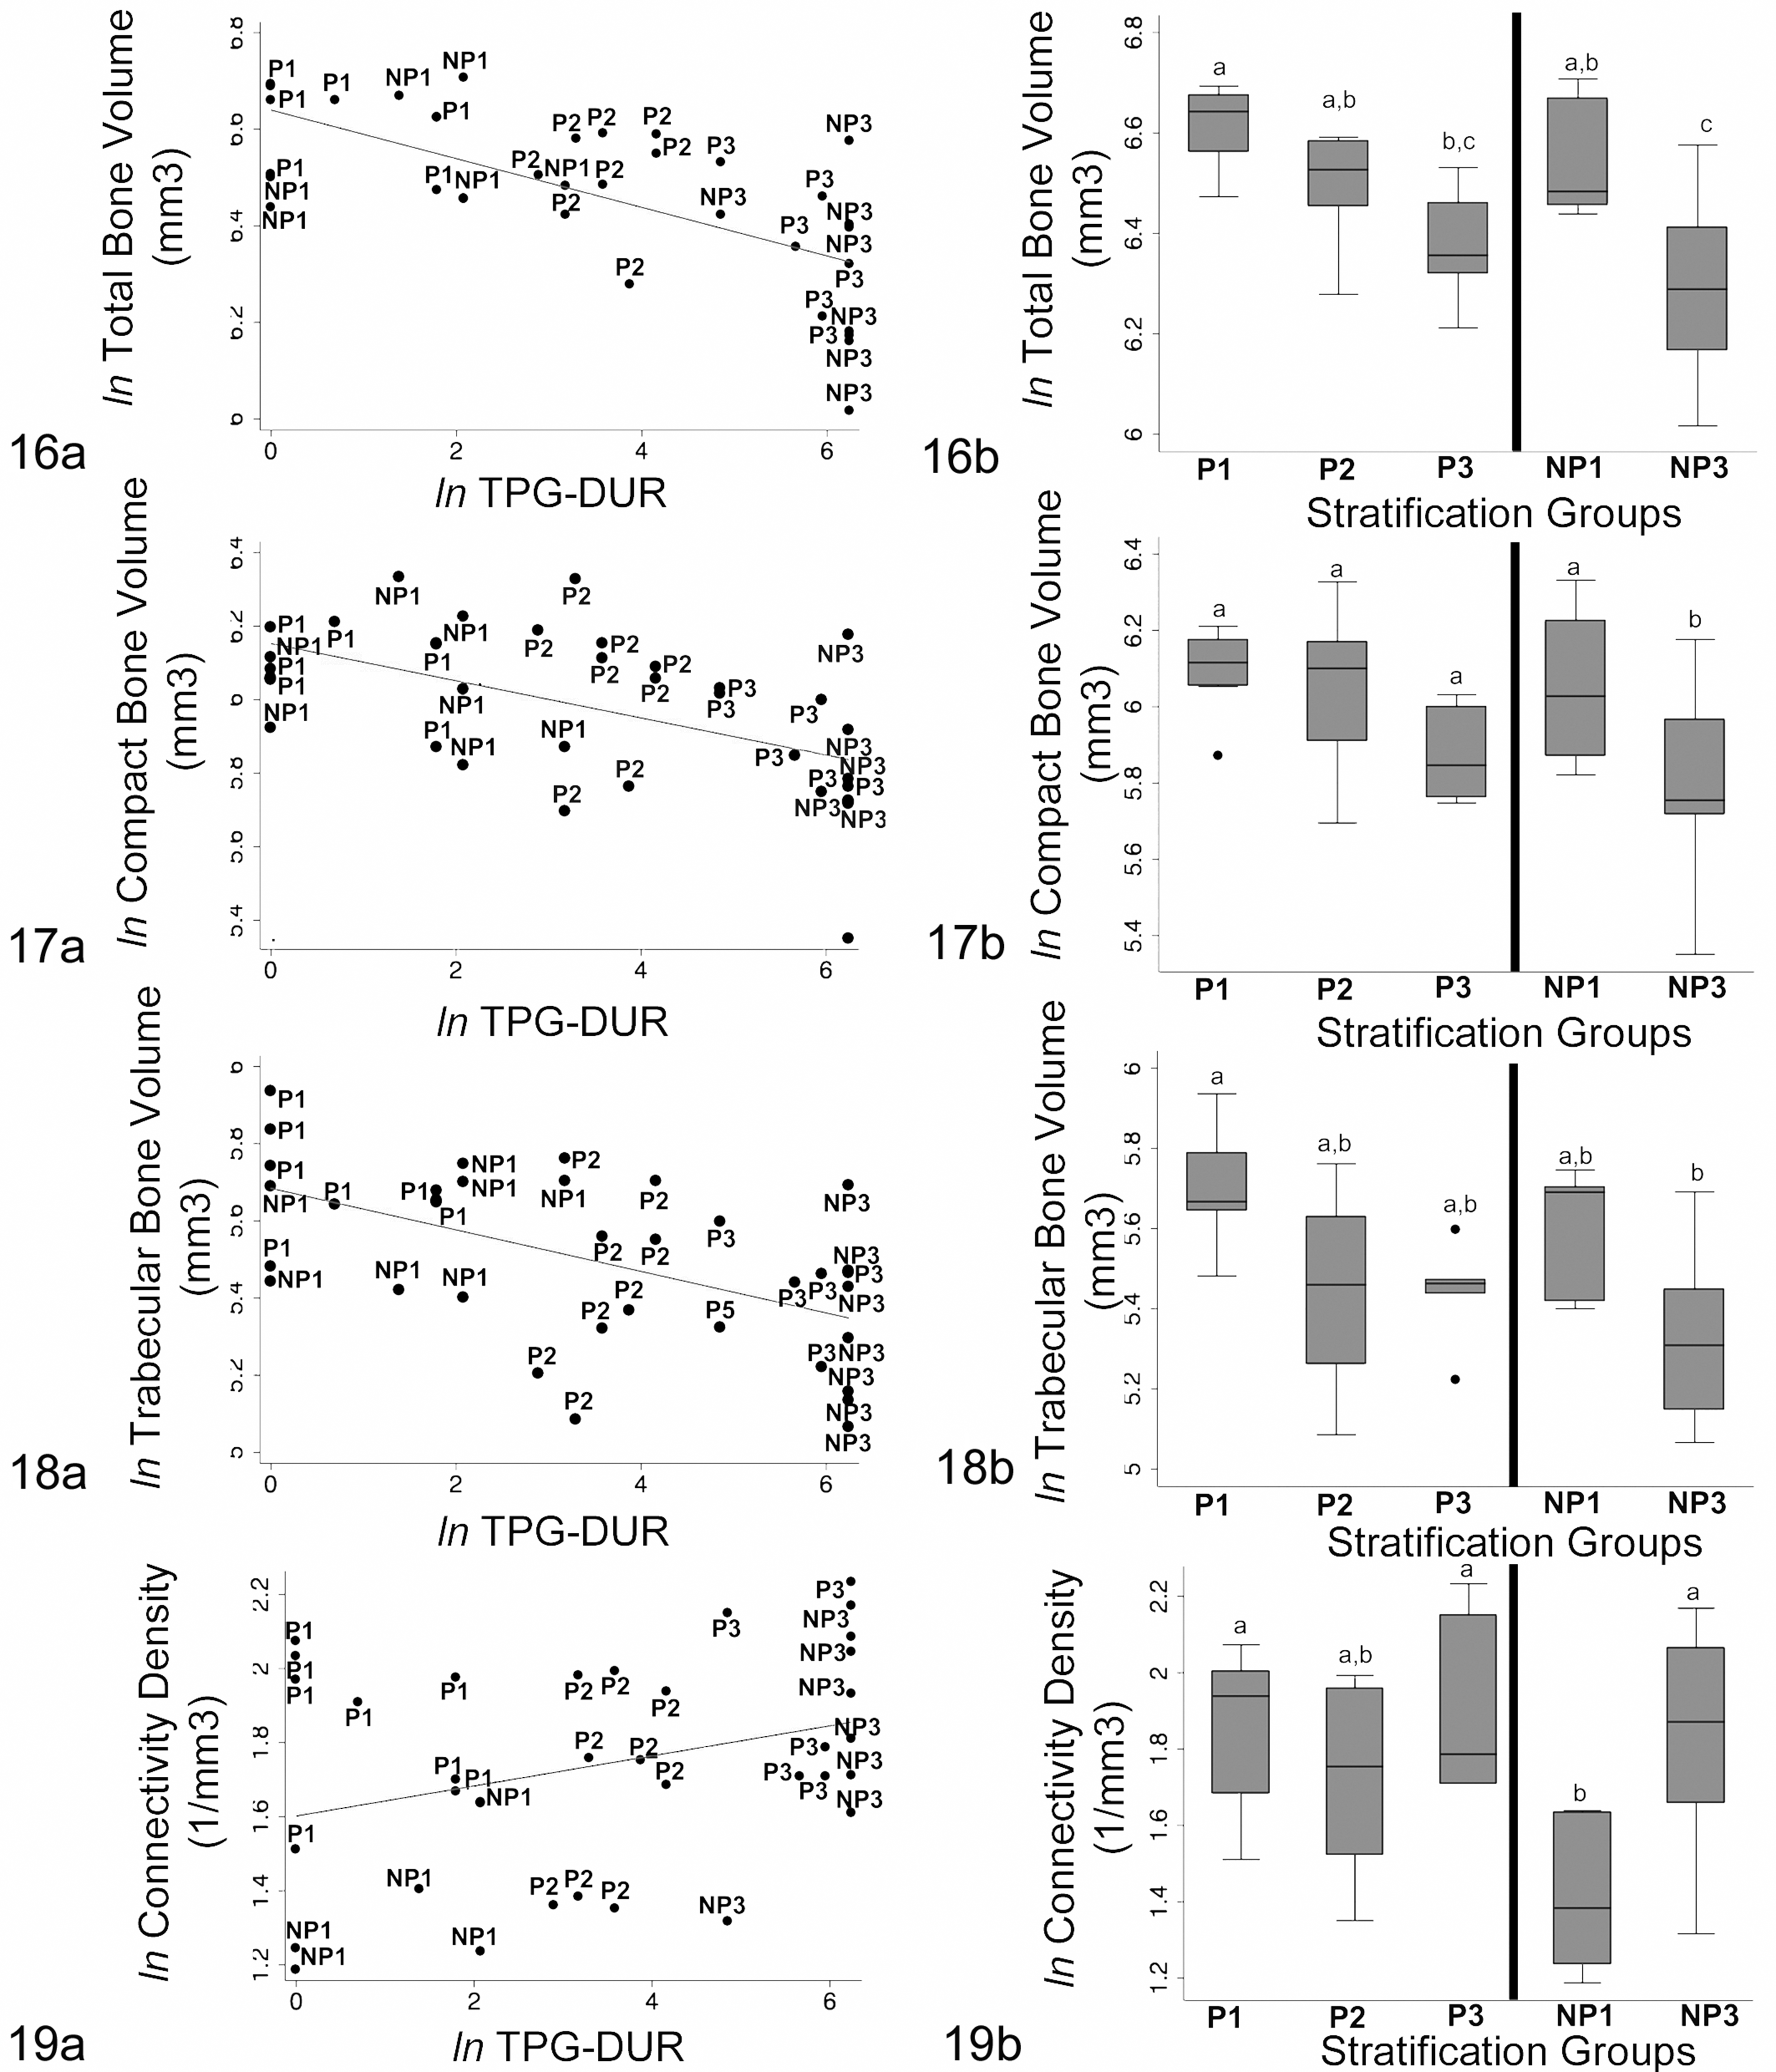
Distribution and correlation of micro–computed tomography bone measurements with total pathology grade with duration factor (TPG-DUR) and stratification groups.
There was also a trend for trabecular bone connectivity density and average structure model index to increase with laminitis severity.
As identified by 1-way analysis of variance with Bonferroni post hoc tests, progressive decreases in total, compact, and trabecular bone volumes correlated with stratification groups (P1/NP1, P2, and P3/NP3). The most discerning differences were between normal (P1/NP1) and moderately to severely laminitic feet (P3, NP3); however, incremental changes were observed with mild acute laminitis (P2; Figs. 16b–18b). A progressive increase in connectivity density between P1/NP1 and P3/NP3 groups was also identified; however, there was considerable overlap among the stratification groups of P animals (Fig. 19b).
Comparisons of bone volumetric/morphometric data between normal (TPG-DUR < 10) front and hind feet and between performance types (P vs NP) showed statistically significant differences (P < .05) in only a few parameters (Suppl. Fig. S6). In normal feet, mean mineral density of trabecular bone was less in the hind than front feet, with a narrower interquartile range. Mean density of trabecular bone was significantly lower in normal hind feet from P vs NP horses, but differences between performance groups were not observed for the front feet. Total bone volume and the trabecular bone connectivity density were significantly higher in the front feet of P horses as compared to NP horses. Similarly, trabecular connectivity density trended higher in the hind feet of P horses, but the difference was not statistically significant.
Micro-CT 3-dimensional reconstructions revealed a spectrum of architectural changes in DP samples that corresponded to progressive histologic changes in decalcified sections of DPs and correlated to the progression of laminitis (Figs. 20a–23a). Histologically, these changes included remodeling, thinning, and increased porosity of predominantly the middle to distal dorsal cortex with increased size of the vascular channels and progressive cortical loss with trabeculation (Figs. 21b–23b). Increased porosity of the solar cortices with enlargement of osteonal canals was also present (Figs. 21c–23c). Although DP lesions were radiographically apparent in severe/chronic laminitis (P3 and NP3 groups), micro-CT and histology revealed changes that were not radiographically apparent in mild/acute (P2) laminitic feet (Figs. 16–31; Suppl. Fig. S7). At higher magnification, histologic differences between nonlaminitic feet (P1/NP1; Fig. 24) and laminitic feet (P2, P3/NP3; Figs. 25–31) included loss of medullary adipose tissue with edema and stromal cell proliferation (Fig. 25); vascular engorgement and activated multinucleate osteoclasts within medullary spaces, directly adjacent to bone surfaces or within resorption lacunae (Fig. 26); medullary inflammation, including lymphocytes, macrophages, and occasional neutrophils (Fig. 27); severe osteolysis with fragmentation of trabecular and osteonal bone and replacement by densely cellular and inflamed fibrous connective tissue (Fig. 28); and remodeling of blood vessels characterized by severely thickened walls by medial/intimal fibromyxoid stromal proliferation and/or periadventitial fibrosis (Fig. 29).
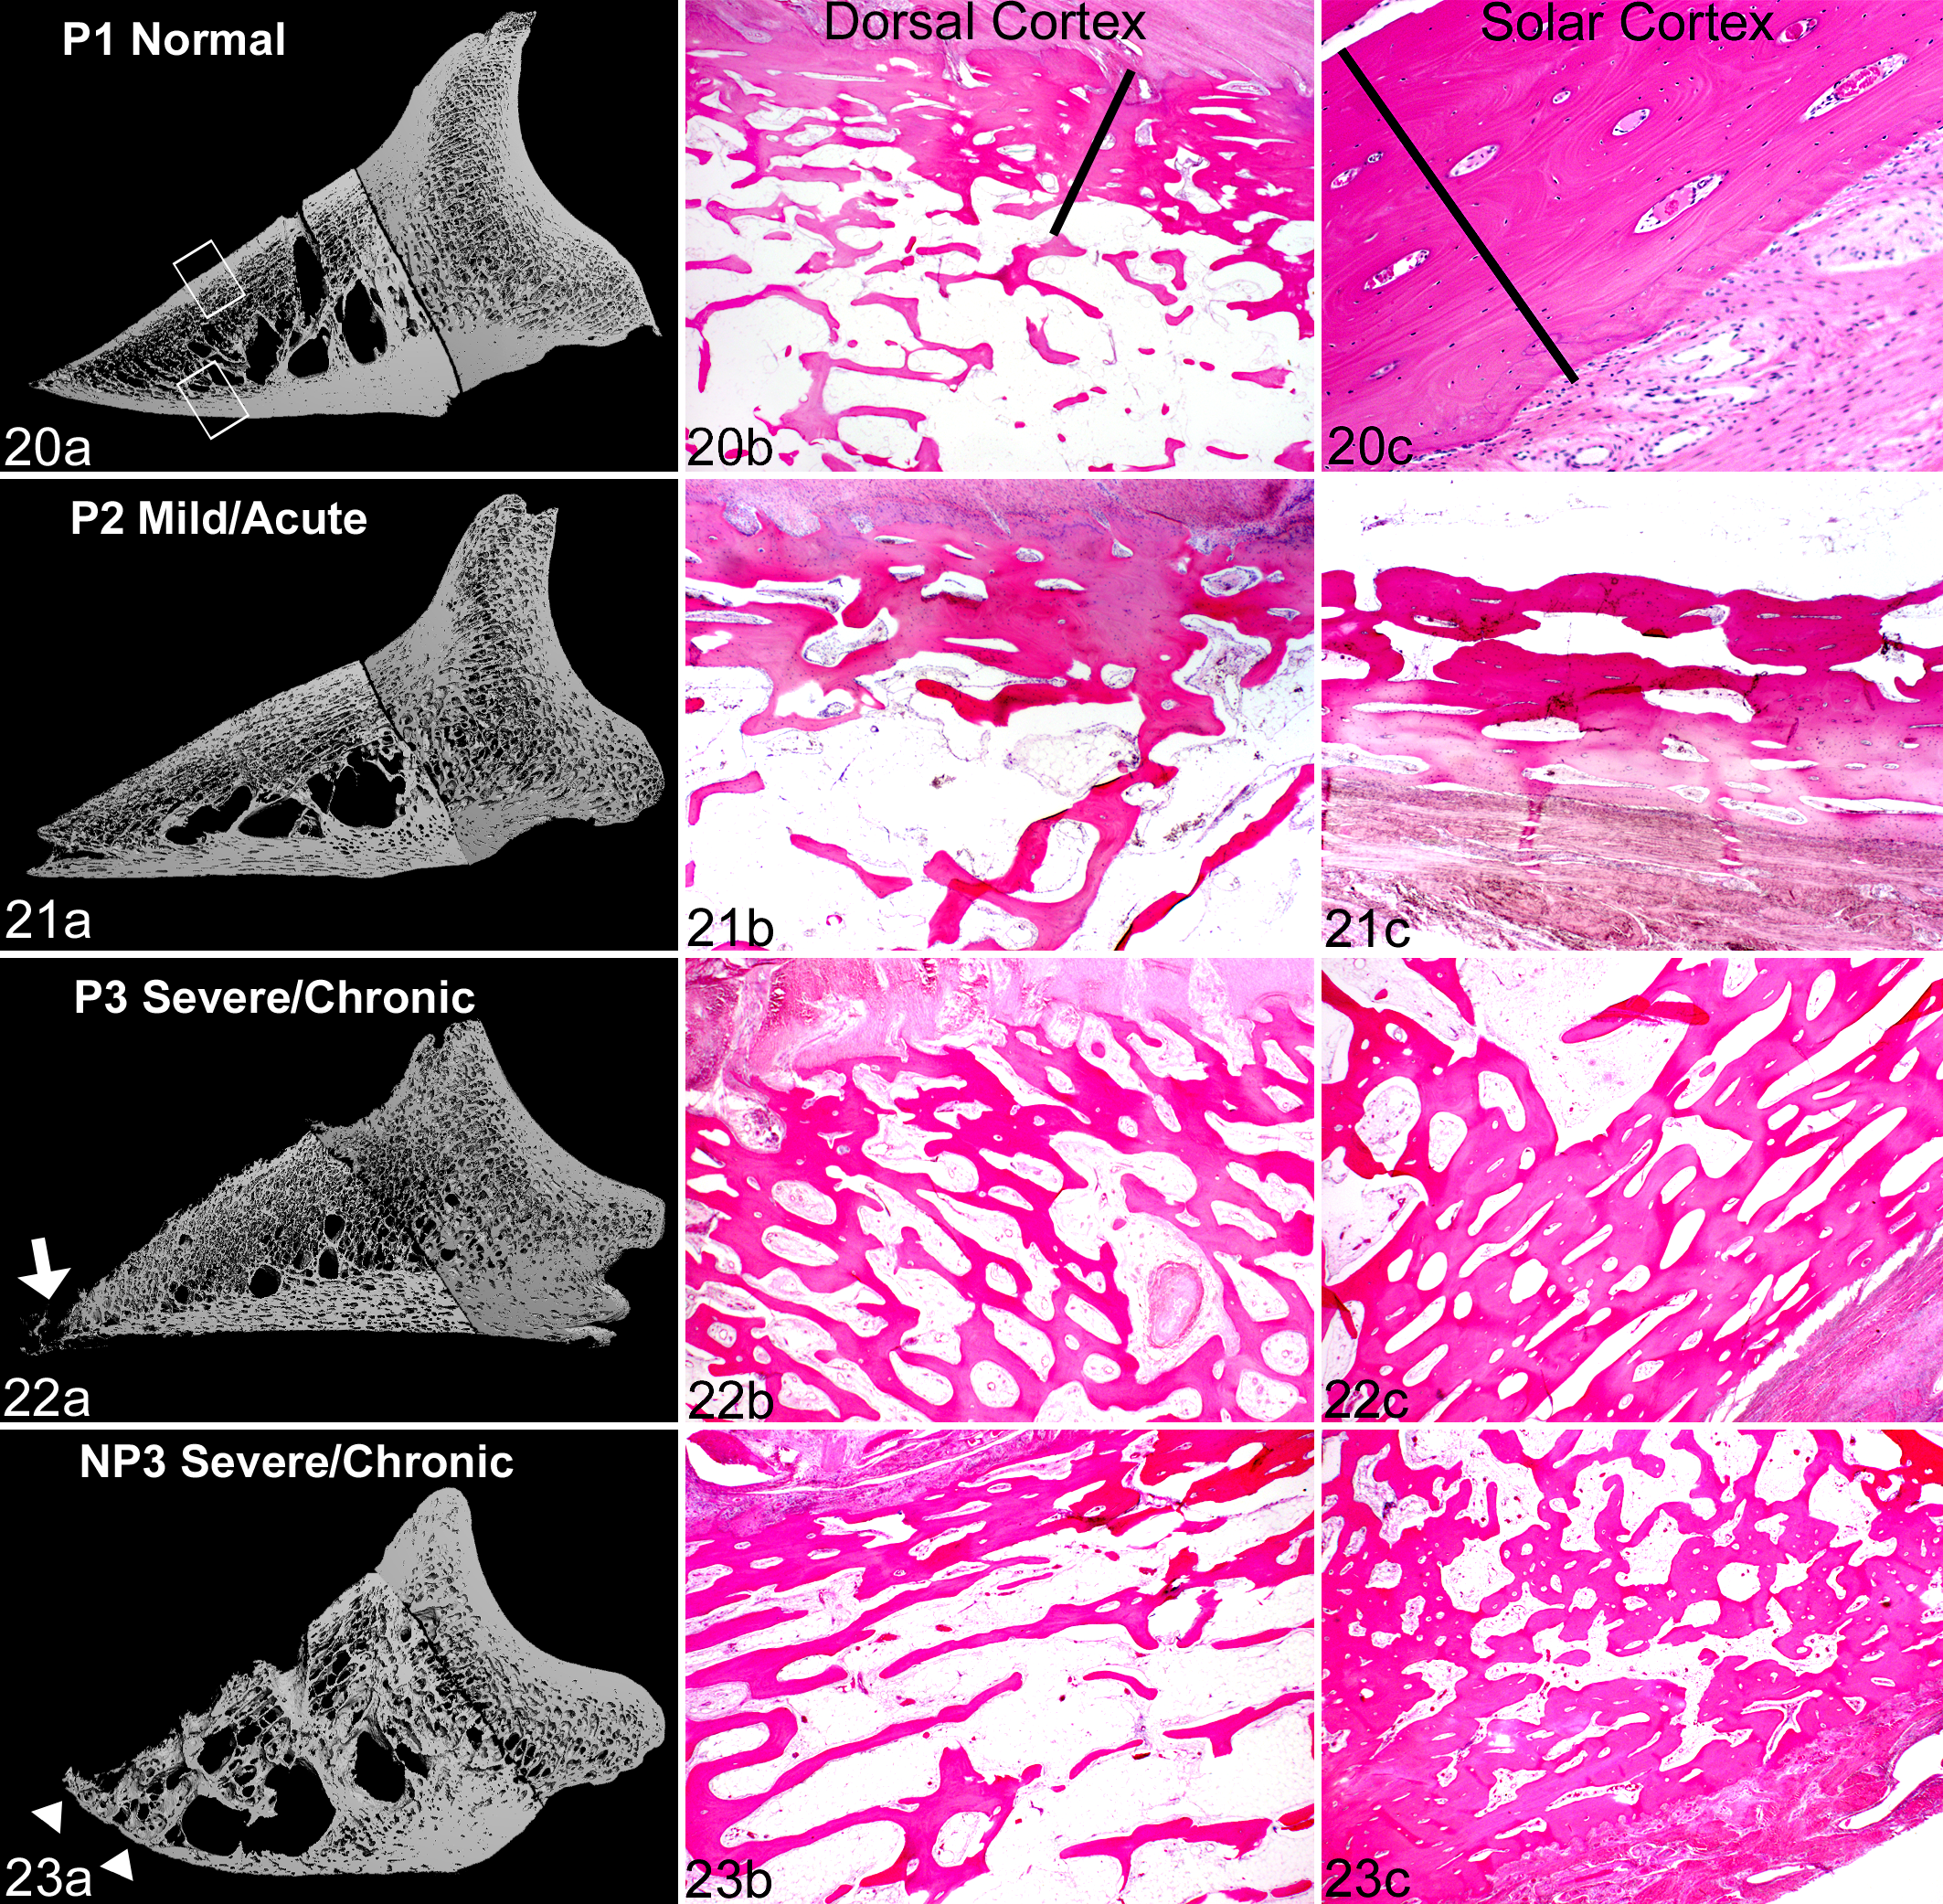
Distal phalanx, horse. For each group of laminitis: (a) the 3-dimensional image composites generated by micro–computed tomography (micro-CT), with the corresponding decalcified histologic sections of bone from (b) the dorsal cortex and (c) the solar cortex. NP, nonperformance horse; P, performance horse.
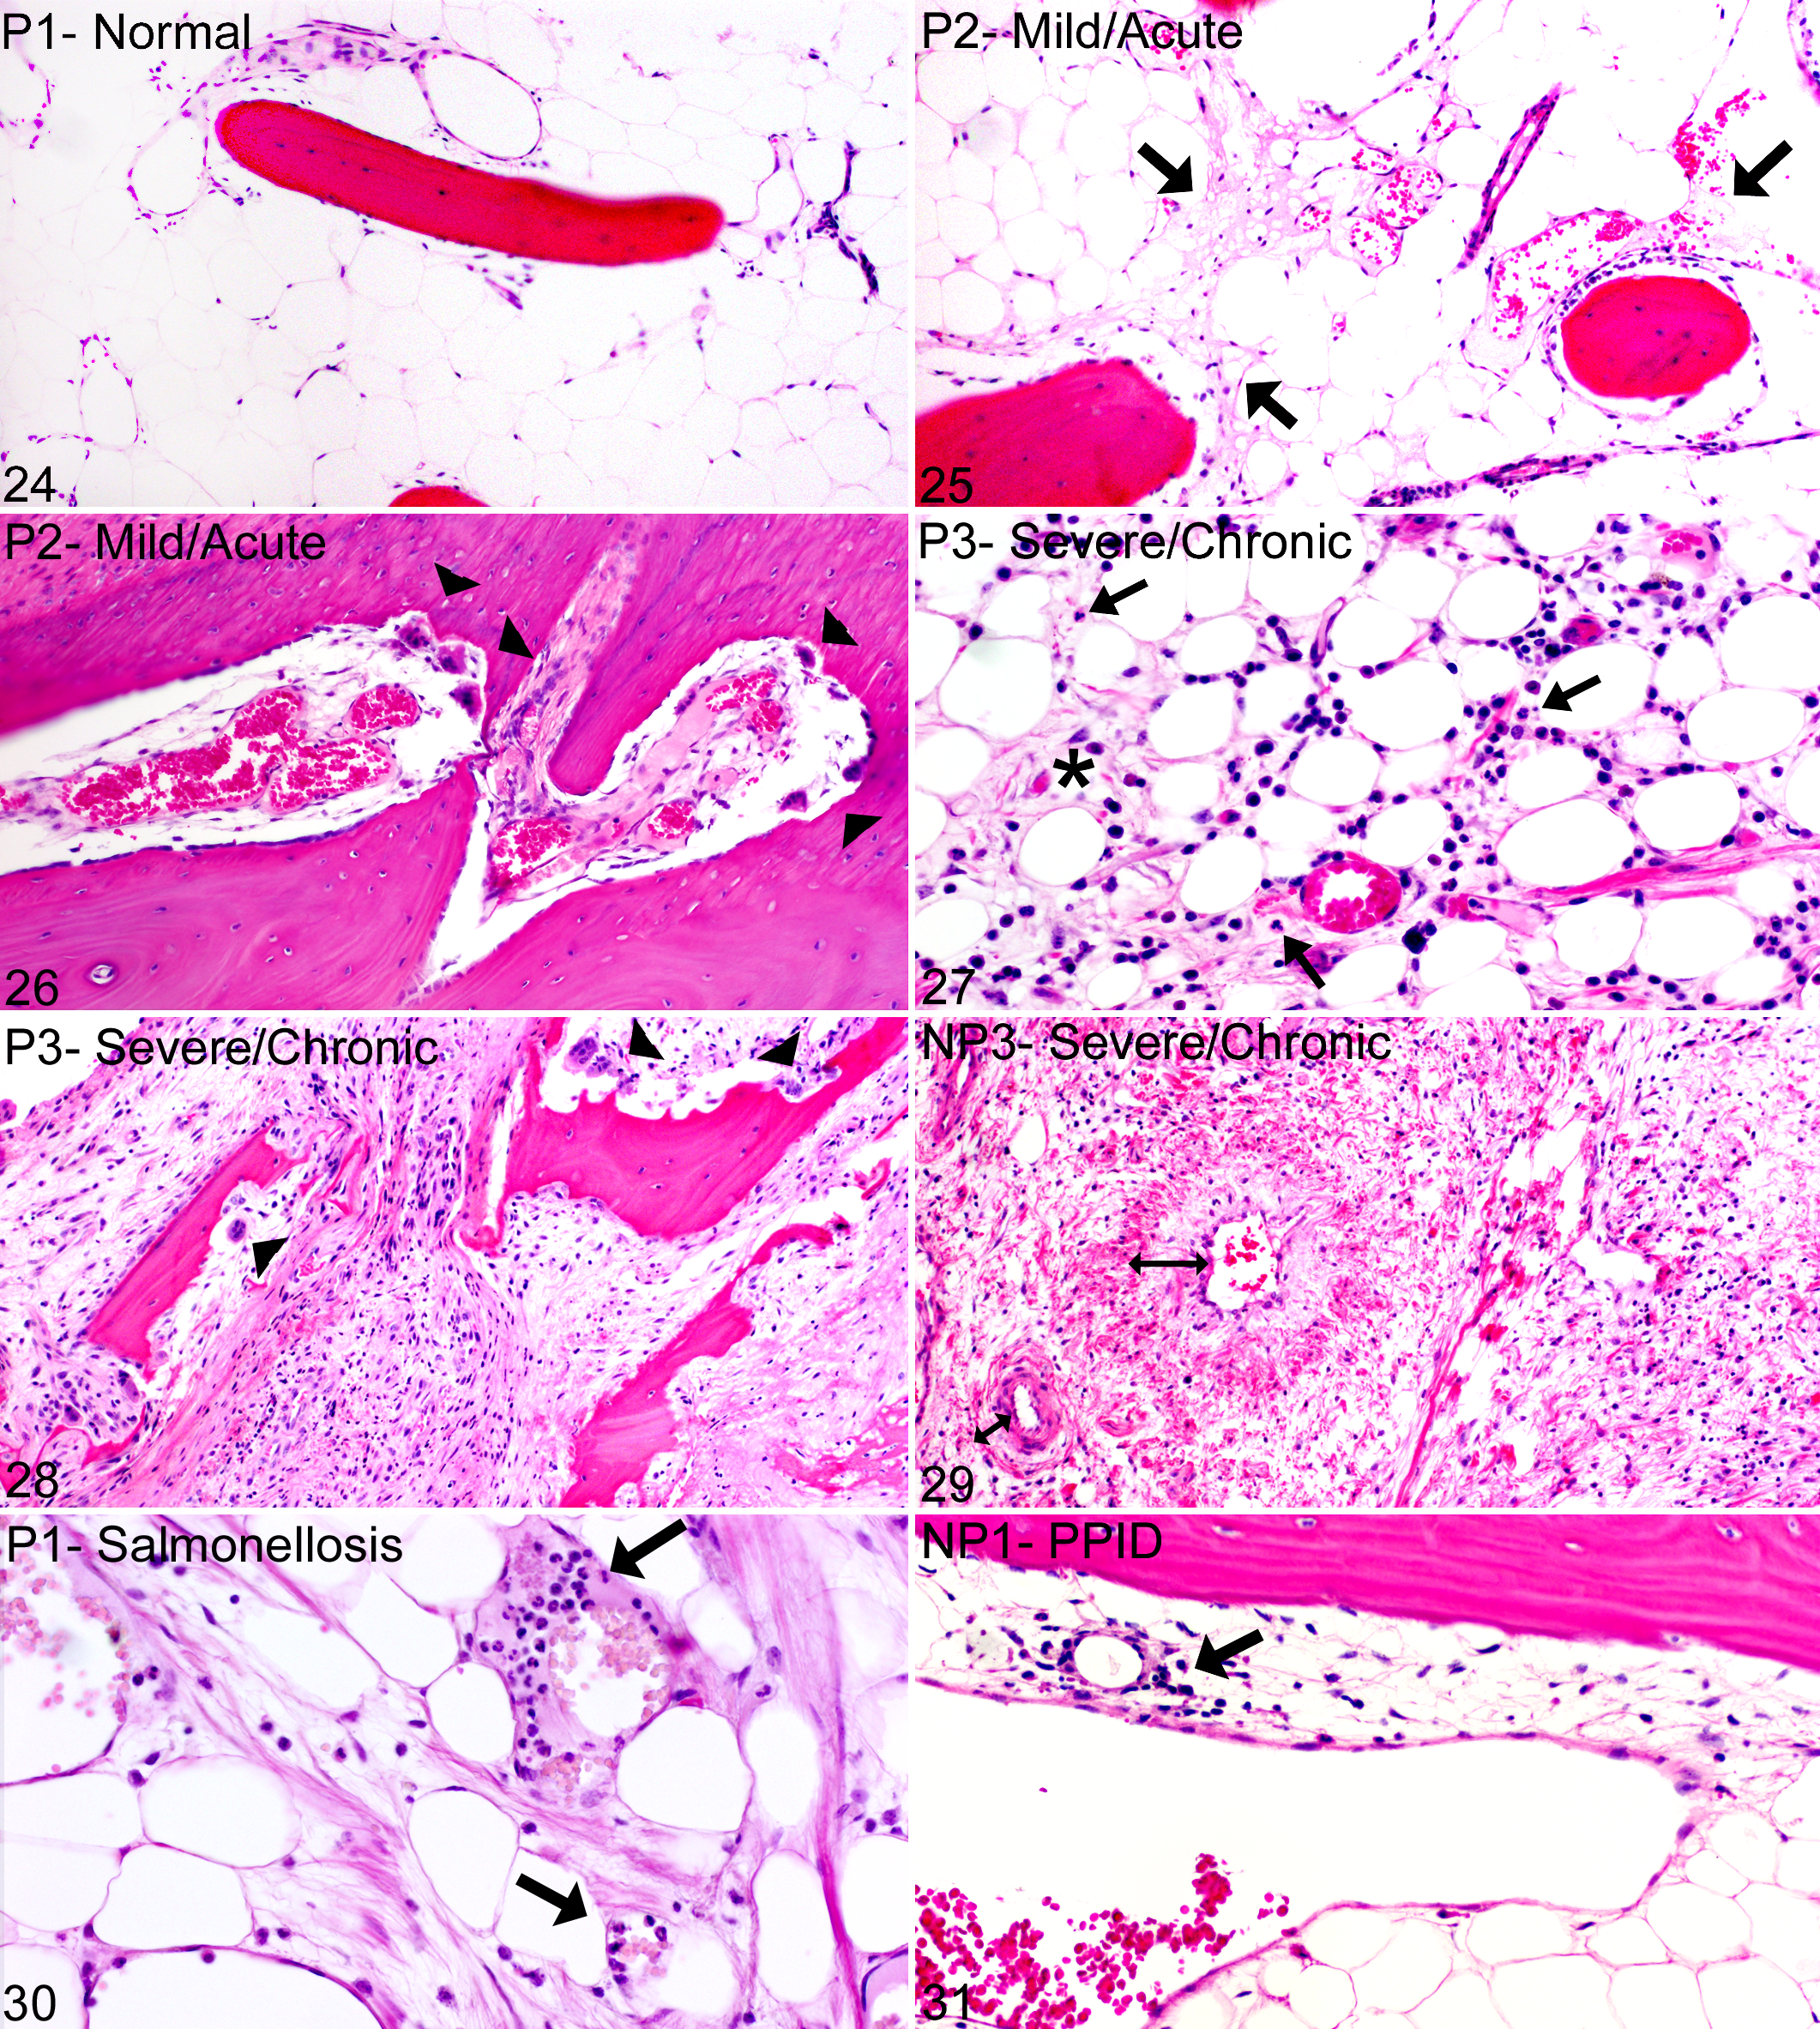
Medullary cavities of bone, distal phalanges, horse. NP, nonperformance horse; P, performance horse. Hematoxylin and eosin.
Inflammatory as well as sclerosing medullary and vascular lesions also extended into the perforating vascular channels of the dorsal cortex (not shown).
The histologic changes to the bone and medullary cavities described above were present in all 21 laminitic feet (P2, P3, and NP3 groups) but only 2 of 13 normal feet (P1, NP1). Of those 2 normal feet, 1 was from a P horse with a 7-day history of Salmonella colitis and minimal histologic lamellar lesions (TPG = 3, TPG-DUR = 6), in which the DP histologically showed moderate osteoclastic osteolysis with remodeling of vascular channels, medullary inflammation, and hyperemia with increased circulating neutrophils despite negligible lamellar changes (Fig. 30). These histologic changes in the bone corresponded with more prominent micro-CT changes in DP architecture as compared to other feet within the P1 stratification group (Suppl. Fig. S7; group P1, horse No. 1, right front foot). The second normal foot with histologic bone changes was a hind foot from a NP horse with pituitary pars intermedia dysfunction and a 3-month history of severe laminitis in the front feet. This hind foot had mild histologic lamellar lesions (TPG = 6, TPG-DUR = 24). Although there was mild multifocal lymphocyte infiltration and stromal cell proliferation in the medullary spaces (Fig. 31), there was no relative increase in osteoclast numbers, active bone formation, or medullary vascular changes (Suppl. Table 1, foot NP1-6 left hind), and micro-CT bone geometry was normal (Suppl. Fig. S7, group NP1, horse No. 6, left hind foot).
Discussion
This study investigated the relationships between lamellar and DP lesions in equine laminitis. The objective was to evaluate architectural changes in the equine DP using micro-CT and to correlate these changes with hoof wall lesions associated with the progression of laminitis. This required (1) development of a semiquantitative, multiplicative grading scheme to characterize laminitis lesions in different stages of disease; (2) development of a micro-CT protocol to quantify alterations in DP bone mass and geometry; and (3) correlation of the volumetric/morphometric alterations detected by micro-CT with histologic changes in the DP and progressive severity of laminitis. The selection criteria and grading scheme were intended to incorporate diverse clinical histories, laminitis risk factors, and hoof wall changes affecting separate feet within the context of the individual animal. The application of stratification groups, representing natural clustering of pathology grades, was performed to convey clinical relevancy to the grading scheme. The lesions observed in mild acute and severe chronic laminitis cases from this study were comparable to lesions reported for oligofructose induction at 7-day duration and natural cases of endocrinopathic laminitis. 22,51 Architectural changes in the DP are progressive and detectable by micro-CT and histology in mild/early stages as well as severe/chronic stages of laminitis.
The most discerning quantitative changes in the DP bone in horses with laminitis pertained to total, compact, and trabecular bone, indicating a relative loss in osteoblastic bone formation, a relative gain in osteoclastic bone resorption, or a combination of the two. 8 Compared to the normal feet, decalcified histologic sections of laminitic feet showed changes consistent with osteolysis/bone remodeling, medullary edema, inflammation, stromal cell proliferation, vascular remodeling, and perivascular fibrosis (Figs. 29–33; Suppl. Table 1). Given the complexity and variability in the pathogenesis and progression of laminitis, the bone remodeling in the distal phalanges associated with laminitis may reflect a response to a variety of factors: local or systemic inflammation, local or systemic vascular disease, abnormal mechanical loading/unloading of the DP, peripheral or central neuropathology, and alterations associated with metabolic/endocrine diseases.
The findings in feet classified as P2 suggest that DP lesions occur early in the progression of laminitis. In some feet classified as P2, structural alterations in the dorsal portions of the DP were relatively more pronounced than alterations in the lamellae and corium of the hoof wall of the same animal. Despite the presence of lamellar and DP lesions in the P2 group, these feet had no radiographic indications or clinical history of laminitis, and gross changes were mild (6 of 8) or not present (2 of 8). Most of the P2 feet were harvested from horses that had either a severe systemic inflammatory disease or obvious signs of laminitis in other feet, with risk factors including visceral or orthopedic inflammatory disease and/or supporting limb overload. In these P2 feet, necrosis and distortion of lamellar structures had a multifocal to regional histologic distribution, and most histologic sections of DP showed moderate to marked osteolysis with osteoclast activation, medullary inflammation, and early vascular/perivascular fibrosis. These findings suggest that mild lamellar injury can occur with maintenance of the overall structural integrity of the suspensory apparatus of the DP and may remain clinically silent. 17,24 But given the close apposition of the DP and lamellar tissues and contribution of lamellar blood flow via the perforating vascular channels, occult remodeling and inflammation of the DP could affect blood flow to the lamellae via these channels. Systemic and local inflammatory risk factors—such as visceral inflammation (colitis, pleuropneumonia, metritis), systemic inflammation (vasculitis, endotoxemia), or local inflammation (cellulitis, septic arthritis, osteomyelitis, or severe orthopedic trauma)—could induce local or systemic bone remodeling with associated medullary inflammation. Potentially, these bone lesions could exacerbate or precede the development of more severe pathologic stages of laminitis (eg, global necrosis, complete lamellar separation, and biomechanical failure).
Several pathways and mediators of pathologic osteolysis identified in human and animal models could apply to the bone lesions identified in these laminitic horses. Receptor activator of nuclear factor kappa-β ligand, an osteoclast activator and differentiation factor, can be secreted by immune cells, bone marrow stromal cells, or even epidermal keratinocytes through neurogenic, vasoactive, and inflammatory pathways. 29,35,37,50 In a mouse model of psoriatic arthritis, the inflammatory marker calprotectin (S100a8/S100a9) is highly expressed in the hyperplastic/acanthotic epidermis of inflamed digits that also have distal phalangeal enthesitis and deforming osteoclastic osteolysis. 54,55 Interestingly, in the early stages of a carbohydrate overload induction model of laminitis, calprotectin expression by lamellar keratinocytes is increased and consistently present at the onset of lameness. 15 In addition to proinflammatory factors, neuropathic changes in the digital nerve and eighth cervical dorsal root ganglia have been identified in horses with chronic laminitis. 21 In murine animal models, neuropathic pain has been directly correlated with osteoclastic osteolysis involving cellular and neurochemical changes within the spinal cord, as well as local stimulation of sensory fibers within the bone microenvironment from cytokines, growth factors, acid release, angiogenesis, or microfractures. 20,49,53 Both osteolysis and neuropathic pain can be ameliorated by the administration of molecules that inhibit osteoclast activation, such as bisphosphonates and osteoprotegerin. 20,52 The pathologic changes identified in the distal phalanges from laminitic feet in this study suggest that there may be an association among epidermal/dermal inflammation, bone remodeling, and pain in the development and progression of equine laminitis. If so, further understanding of laminitis-associated bone remodeling pathways could provide novel molecular targets for early detection or therapeutic intervention.
This study is subject to several potential biases or confounding factors. The types of horses composing our study population may differ from those of other equine hospitals, although this is mitigated by the diversity of cases included. The findings were based on samples from dorsal midsagittal sections, and it is unknown if differing changes might occur in other sections or if variation in sampling these parasagittal sections might alter the results. The findings were based on relatively small sample sizes considering the variation in athletic use, age, sex distribution, breed type, clinical risk factors, and duration of disease. Horses in the NP group were significantly older and exhibited a wider range of ages (11.3 ± 6.9 years) than horses in the P group (3.6 years ± 1.5 years).
Literature pertaining to human studies and laboratory animal models demonstrates significant differences in bone parameters associated with type and degree of athletic activity, as well as certain endocrine/metabolic disease conditions, such as postmenopausal osteoporosis and diabetes mellitus. 1,11,43,46 To date, it is unknown if age-related osteoporosis occurs in the horse and whether the equine DP would be affected given its different inherent architectural and functional properties as compared to a more typical long bone.
Another potential confounder pertains to our methods of micro-CT image acquisition and evaluation. Due to micro-CT size constraints, we were limited in the volume of bone that could be analyzed, and to normalize for volume, the thinnest section of bone harvested from the sample set limited the total number of slices analyzed for all other bones. However, the statistical analyses determined that although bone volumetric and morphometric variability clearly exists among the samples, the variability was evenly distributed among stratification groups.
This study used a semiquantitative, multiplicative grading scheme to characterize laminitis lesions at different stages of disease and a novel micro-CT protocol to quantify alterations in distal phalangeal bone mass and geometry. These approaches permitted correlation of volumetric/morphometric alterations with histologic changes in the DP and examination of these bony changes in specimens with differing severity of laminitis. The pathology grades—incorporating radiographic, gross, histopathologic, and temporal factors—correlated well with clinical severity and progression of laminitis. Furthermore, these changes coincided with progressive microarchitectural alterations of the DP, suggesting that changes within the DP may play a role in both early and later stages of laminitis.
These findings of pathologic changes in the DP of horses with laminitis have several implications. The DP changes might in the future allow earlier or more sensitive diagnosis of laminitis by diagnostic imaging or by measurement in serum of bone-derived biomarkers of laminitis. If the changes in the DP do indeed lead to or exacerbate changes in the lamellae, then these findings may suggest novel opportunities for therapy. Finally, these findings may lead to a more comprehensive understanding of the relationships between the lamellae and the underlying bone in the pathogenesis of equine laminitis.
Conclusions
The results of this study support the hypothesis that the equine DP is a dynamic structure, potentially influenced by physiologic and pathologic biomechanical forces, local or systemic inflammatory diseases, or endocrine/metabolic states associated with laminitis. The close anatomic proximity, common blood supply, or activation of effector molecules shared between lamellar tissues and the DP may influence the initiation, progression, overall severity, or painfulness of laminitis. Given the complex tissue interfaces within the equine foot, changes in the DP may represent a component of laminitis that is perhaps more than just “skin deep.”
Footnotes
Acknowledgements
We are grateful to Susan Megee, Rebecca Carter, Renata Linardi, Dave Lorom, Ralph Conti, Dave Harris, Nigel Watson, and Sue Lindborg for contributions to tissue retrieval for this study. We also thank Dawn Gray-Earle and John Saroukos for their excellent microtomy skills. We would like to acknowledge Jill Beech, Darko Stefanovski, and Ray Sweeney for their thoughtful contributions in reviewing this manuscript.
Declaration of Conflicting Interests
The author(s) declared no potential conflicts of interest with respect to the research, authorship, and/or publication of this article.
Funding
The author(s) disclosed receipt of the following financial support for the research, authorship, and/or publication of this article: Bernice Barbour Foundation Inc (0048.42008 to H.L.G.-H.) and the University of Pennsylvania Fund for Laminitis Research. D. M. was supported by a fellowship from Merial and the National Institutes of Health (T35 RR07065).
References
Supplementary Material
Please find the following supplemental material available below.
For Open Access articles published under a Creative Commons License, all supplemental material carries the same license as the article it is associated with.
For non-Open Access articles published, all supplemental material carries a non-exclusive license, and permission requests for re-use of supplemental material or any part of supplemental material shall be sent directly to the copyright owner as specified in the copyright notice associated with the article.