
Abstract
Detecting calves that are persistently infected with bovine viral diarrhea virus (BVDV) is essential to disease prevention. Immunohistochemistry (IHC) performed on formalin-fixed, paraffin-embedded ear-notch samples is commonly used for surveillance detection of BVDV antigens. However, due to the low percentage of positive samples in most submissions, the current workflow often entails considerable time reviewing negative results. Herein we aimed to utilize digital pathology and whole-slide imaging, coupled with advanced image analysis software, to enhance the efficiency of positive IHC detection in surveillance. Despite some challenges encountered during the implementation phase, the benefits of the reduced potential for human error and significant time savings for technicians and pathologists are evident. The screening of 518 slides, containing 2,884 ear notches, reached 97.4% sensitivity and 89.4% specificity compared to the gold standard of direct human assessment. The time taken for the personnel to operate the software and organize results was significantly shorter than the time needed for technicians and pathologists to manually examine the slides. Future refinements in software integration, staining protocols, and QC measures promise to further optimize this approach.
Infection by bovine viral diarrhea virus (BVDV; Flaviviridae, Pestivirus) affects cattle and other ruminants globally and leads to significant economic losses due to illness, reproductive losses, and reduced milk production. 7 BVDV infection in cattle can range from subclinical to severe disease involving multiple organ systems. It is responsible for reproductive diseases such as fertilization failure, embryonic death, fetal mummification, and stillbirth, or birth of weak calves, calves with congenital defects, and immunotolerant persistently infected (PI) calves. 6 Fetal infection outcomes depend on the gestational period; PI calves result when susceptible cows or heifers are infected at 45–125 d gestation. 7 Cattle that are PI with BVDV become immunotolerant to the virus and act as the primary reservoir of the virus. Maintaining a high and persistent viremia, PI calves can transmit the virus to susceptible cattle throughout their lifetime.6,7 The transmission potential of PI calves is substantial, with 70–100% of nonvaccinated susceptible calves showing seroconversion after exposure to PI calves. 2
The laboratory detection of BVDV plays a vital role in effectively managing and preventing infections. 1 Once BVDV is introduced into the herd, it is crucial to identify and remove PI animals. Several laboratory techniques, such as immunohistochemistry (IHC), antigen ELISA, immunofluorescence, and reverse-transcription PCR assays have been developed to identify BVDV PI animals.1,7 Among those methods, IHC performed on formalin-fixed, paraffin-embedded ear-notch samples is a widely employed, highly specific method for detecting BVDV antigens and plays an important role in BVDV surveillance and identification of PI calves.1,5 Positive IHC signals can be detected in epidermal keratinocytes, hair follicle epithelium, hair matrix cells of the hair bulb, dermal papillae, and the adnexa surrounding hair follicles. 5
The Iowa State University Veterinary Diagnostic Laboratory (Ames, IA, USA) receives >24,000 ear notches annually for BVDV PI animal testing and screening, which results in the creation of ~4,300 tissue blocks and slides as each tissue block contains multiple ear-notch samples. By implementing automated IHC platforms, the laboratory can complete the assay and report the results within 48 h of receiving the specimens. However, manually examining IHC slides containing up to 7 ear notches per slide and determining positivity on multiple slides per case is time consuming and repetitive for pathologists and technicians. Furthermore, the low percentage of positive PI calves in a herd 3 means that technicians and pathologists spend considerable time reviewing negative results. Finding a solution to streamline the analysis of negative results will be beneficial in optimizing the efficiency of the laboratory’s operations.
The traditional glass slide–based pathology field has been revolutionized by digital pathology and whole-slide imaging (WSI), which captures high-resolution images of entire tissue samples and enables pathologists to access digital slides remotely. Additionally, WSI enables the use of computer algorithms and artificial intelligence for automated image analysis, providing a powerful tool for enhancing research processes.4,8 We aimed to utilize digital image analysis software in conjunction with WSI to streamline the process of BVDV IHC slide evaluation. We aimed to improve the efficiency of the IHC interpretation process and enable laboratory personnel to focus on more critical tasks and the confirmation of suspected positive samples flagged by image analysis.
We obtained 518 whole-slide scanned BVDV IHC images containing 1–7 ear notches and a positive control ear notch per glass histology slide, with 2,884 ear notches for the analysis. All slides were digitized using a real-time automatic focusing scanner (Aperio GT 450; Leica) with default settings at a magnification of 400× (image resolution: 0.26 μm/pixel). The file format was standard pyramid-tiled TIFF with JPEG image compression. The image analysis platform (HALO v.3.4.2986.230; Indica Labs) was used to detect BVDV immunopositivity in the squamous epidermis and epithelium of hair follicles in ear-notch specimens. Area quantification module v.2.3.1 within the software was used. A minimum tissue OD value was set to a lower value of 0.0075 to detect tissue and exclude the glass region. Considering that each slide contained a positive control (PC) ear notch, we created an annotation file with 2 rectangles delineating the subject ear notches and the PC ear notch (Fig. 1). This enabled us to distinguish the results of the actual ear notches from the positive control. The annotation file with 2 rectangles can be applied and imported to each slide and adjusted manually if the size and location do not fit.
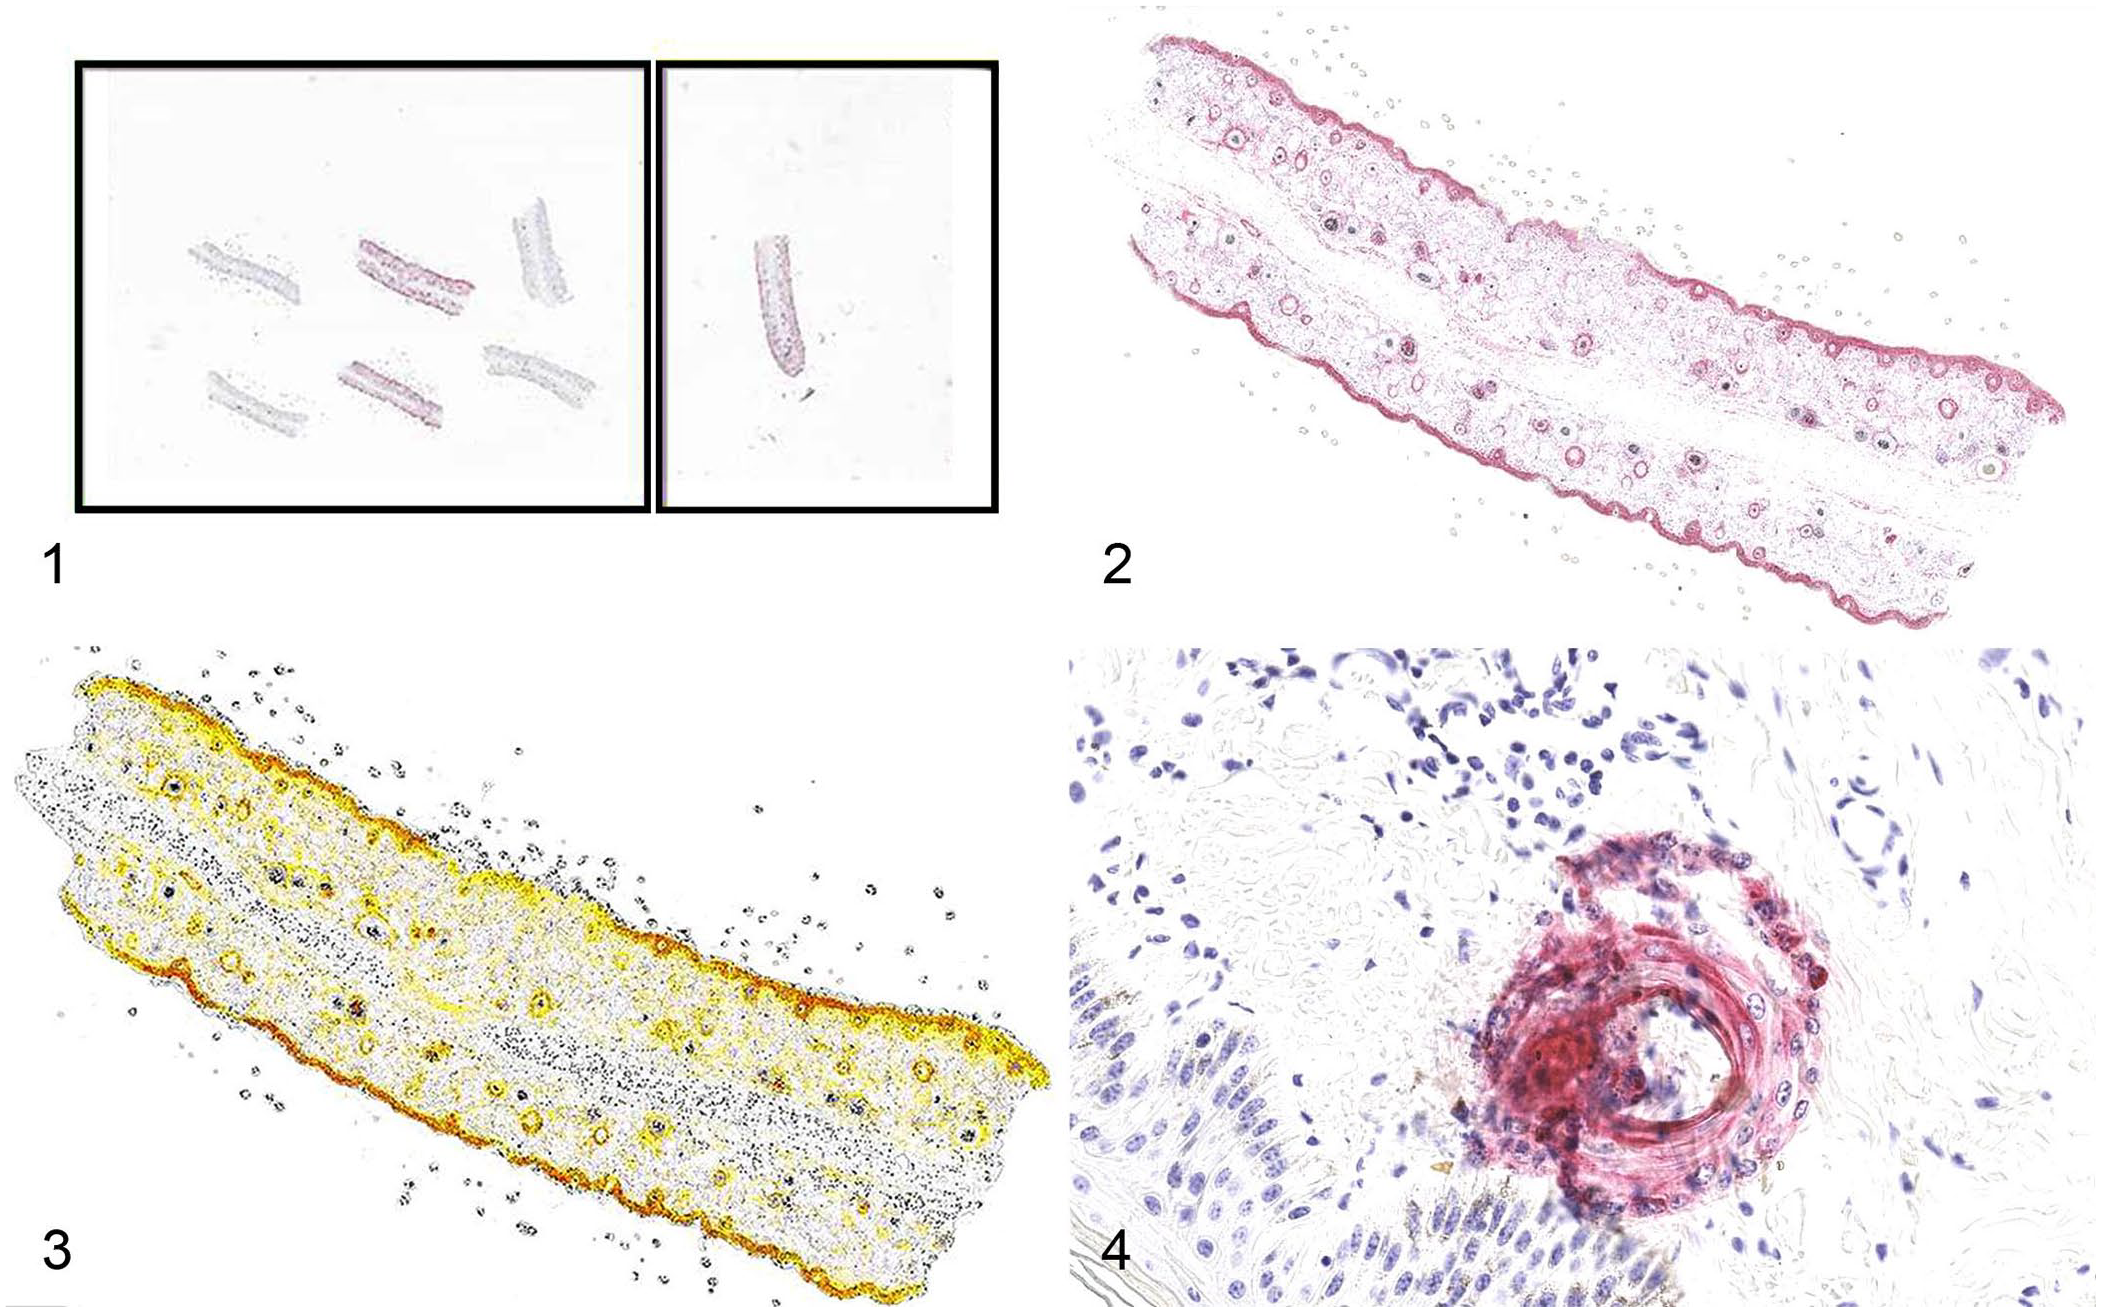
Representative images of the bovine viral diarrhea virus digital image analysis workflow.
Baseline reference colors were established for the positive chromogen signal (red) and nuclear hematoxylin (blue) by choosing an image area in which red and blue were represented accurately. The output image was selected to display the markup of the stain of interest (red chromogen), and the real-time tuning options were used to assess the accuracy of the reference color setup. The color of melanin (dark brown) was excluded to enhance the accuracy of identification of positivity. By adjusting the thresholds for weak, moderate, and strong positive labeling, the software could quantify staining intensity separately (Figs. 2, 3). After adjusting the settings and optimizing the algorithms, the optimal algorithm was chosen, saved, and applied to all images. The analyzed results were exported to an Excel spreadsheet, and the labeling was listed as a percentage of the tissue analyzed on each slide. We established the threshold at 10% below the lowest positive case value observed in our trial runs, which included 1,284 ear notches and 221 slides. A value of >0.00017% positivity for strong labeling was considered positive for the slide, and we used the options of conditional formatting and highlighting cells greater than this value in the Excel spreadsheet to examine higher values more easily.
Following the implementation of the optimized algorithm, the digital image software screening of 518 slides, containing 2,884 ear notches (Table 1), performed with 97.4% sensitivity and 89.4% specificity compared to the gold standard of direct human assessment (Table 2). The level of agreement through a Cohen kappa between using HALO digital image analysis and direct human assessment was 0.546 (moderate agreement).
Results of using HALO digital image analysis and human assessment for detection of bovine viral diarrhea virus in immunohistochemistry slides.
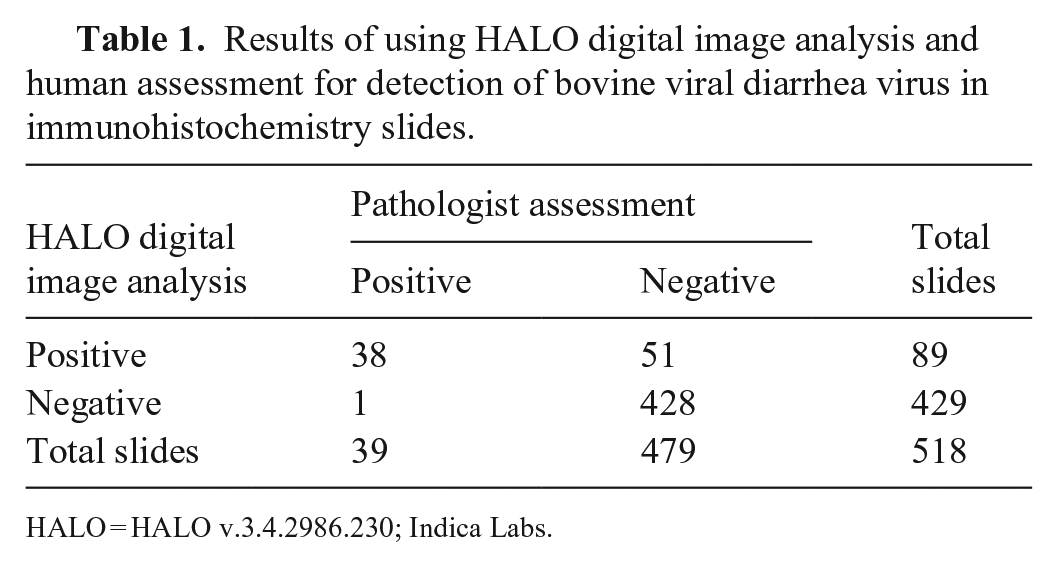
HALO = HALO v.3.4.2986.230; Indica Labs.
Sensitivity, specificity, predictive values, and level of agreement between HALO digital image analysis and human assessment for detection of bovine viral diarrhea virus in immunohistochemistry slides.
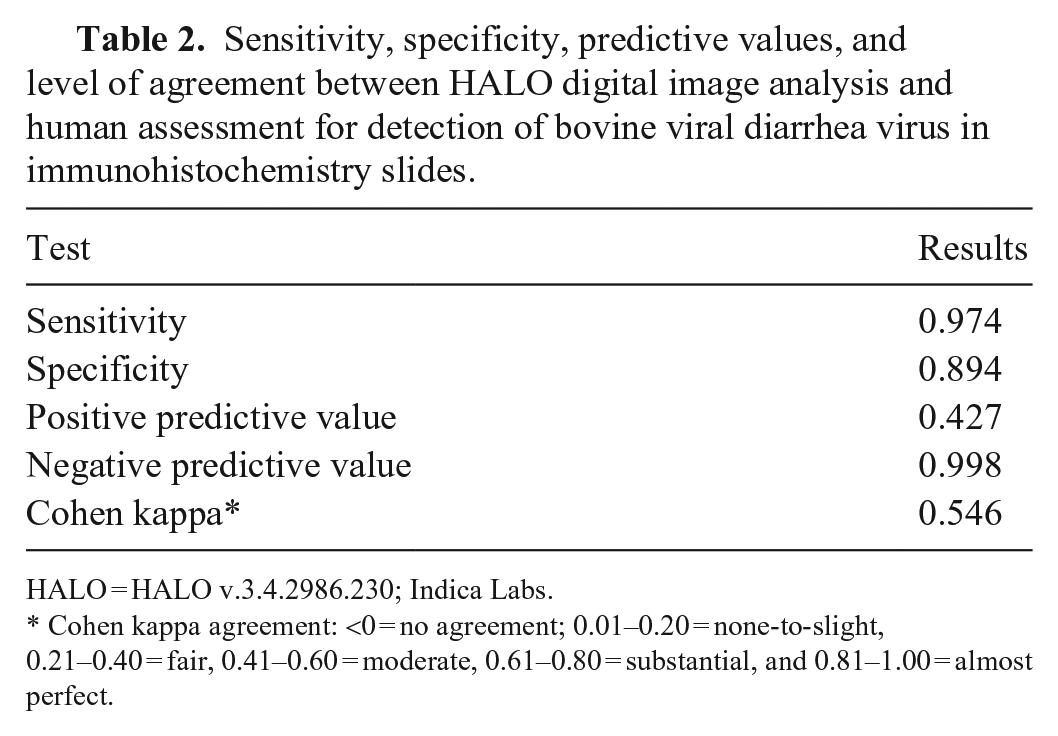
HALO = HALO v.3.4.2986.230; Indica Labs.
Cohen kappa agreement: <0 = no agreement; 0.01–0.20 = none-to-slight, 0.21–0.40 = fair, 0.41–0.60 = moderate, 0.61–0.80 = substantial, and 0.81–1.00 = almost perfect.
The efficiency of reading each glass slide by a technician and a pathologist varies, depending on the complexity and number of suspected positive ear notches. On the other hand, automated digital image analysis software normally uses a series of mathematical algorithms based on color, texture, and/or context to process images and segment picture elements, thereby potentially promoting a less subjective, more efficient, and more accurate interpretation. The software image analysis was able to detect subtle regions of positivity that could potentially be overlooked during routine screening by pathologists and technicians. The relatively lower specificity and moderate agreement between human assessment and software are due to the software’s ability to catch subtle color differences. The larger number of false-positive cases resulted from nonspecific staining of tissue fragments with the red chromogen, keratin debris sloughing from positive controls into the test area (Fig. 4), stain droplets, folded tissues picking up the red chromogen, or necrotic hair follicles trapping stains. Although false-positive cases can be flagged for review by technicians and pathologists, it is more important to avoid false-negatives than to eliminate all false-positives. The sensitivity was 100% during our trial runs and dropped to 97.4% in the main analysis after one slide did not pass the threshold we originally set. To address this issue, we may lower the threshold further to avoid missing any suspected cases but also need to consider the impact of increasing false-positive results.
We conducted a prospective analysis to compare time utilization by pathologists and technicians, and the utilization of operating image analysis. The time spent by a person importing images to the software, initiating the analysis, and organizing results was significantly less than the time required for technicians and pathologists to read the slides (p < 0.01, Wilcoxon matched-pairs signed rank test, n = 20 pairs, x̄ = 7.2 and 27 min, respectively). When dealing with a larger volume of slides, using digital analysis will be valuable, which will save time and enable personnel to perform other essential duties. For example, the above case with 20 slides required 80 min of technician time for visual screening of the slides; WSI of the same slides required only 10 min of technician time to operate the image analysis software and organize the results. However, using software analysis may not be worthwhile for cases of <10 slides, given that human assessment may finish reading slides within 30 min, depending on the complexity of the cases.
During the implementation of the digital image analysis software for IHC analysis, we encountered several procedural challenges that warrant further optimization. The initial lack of direct linkage between barcode-generated file names and the actual accession numbers necessitated extensive manual re-naming to reflect the results in a computer spreadsheet. All file names generated by the image analysis software consisted of random characters and numbers, which would greatly impede accurate recordkeeping. Automating the file-naming process to map to the accession numbers could increase efficiency and reduce the potential for human error. Additionally, assessing tissue QC becomes more challenging when using digital image analysis to screen slides. Adequate IHC stain depends on the presence of enough intact and non-autolyzed epidermis on each slide. Manual examination of the IHC slides allows us to evaluate tissue quality concurrently when assessing the level of staining. In contrast, digital image analysis algorithms heavily rely on color and may effectively reflect tissue quality. Developing a method to ensure the use of a valid sample for the digital analysis screening test is warranted. Similarly, optimizing staining quality may be necessary to prevent reduced specificity due to tissue debris, tissue artifacts, and nonspecific staining. If staining consistency changes significantly, the same setting may not fit every case and slide. Consistent staining quality from the same automated staining machine is important in this workflow. Periodic quality checks and appropriate adjustments based on recent images will still be needed for QA.
Although importing slide annotations was useful for delineating untested and positive control regions, manual verification of proper annotation alignment was still required, adding steps to the workflow. A potential solution is to preview the image with the annotations in preview mode, which does not require opening each individual file. We have proposed the integration to the software company, which could streamline the annotation validation process. Finally, the significant storage space of images and image analysis data should be considered and will require a management plan for periodic removal of image data after completion of the analysis. Better solutions for such hardware limitations are warranted and will likely come with time as digital pathology and WSI continue to advance in the veterinary diagnostic space.
Several veterinary diagnostic laboratories have implemented PCR screening of ear-notch pools for accessions containing numerous animal samples to help improve workflow and then subject samples within positive pools to IHC for confirmation of PI status. While this also reduces the number of slides reviewed by a pathologist and may reduce cost, it adds at least one day to total turnaround time for the process and increases the amount of physical manipulation of individual ear-notch samples. The digital image analysis process that we tested allows for efficient screening of all animal samples using an IHC assay with high diagnostic specificity. The use of digital image analysis software in conjunction with WSI is a promising solution for increasing efficiency and partially automating the BVDV IHC surveillance process.
Footnotes
Declaration of conflicting interests
The authors declared no potential conflicts of interest with respect to the research, authorship, and/or publication of this article.
Funding
The authors received no financial support for the research, authorship, and/or publication of this article.