
Abstract
Flow cytometry is a highly sensitive and specific method for simultaneous analysis of multiple parameters of individual cells in a suspension. It has a range of applications in veterinary medicine, and it is increasingly used in veterinary oncology as more species-specific antibodies are generated and cross-reactivity of antibodies is characterized. Two major applications in veterinary oncology are (1) immunophenotyping with a panel of fluorescently labeled antibodies to assess expression of cell markers and (2) determination of the DNA content of cells with fluorescent dyes that bind nucleic acids. The diagnostic and prognostic value of classifying round cell tumors of animals—especially, lymphocyte proliferations—remains to be fully determined, but studies to date have indicated benefit to patient management. Similarly, determining the proliferating fraction of tumors through DNA analysis remains to be standardized and validated in veterinary oncology but shows promise as an adjunct to morphologic tumor classification. This article reviews technical aspects of flow cytometry, availability of antibodies suitable for studies in domestic animals, and applications in veterinary oncology with emphasis on characterization of round cell tumors.
Keywords
Flow cytometry (FC) is a technique for qualitative and quantitative assessment of multiple parameters of individual cells or particles in complex cell suspensions. The technology is an integral component of research in the life sciences (particularly, immunology) and a common element of diagnostic and prognostic investigations in human oncology (specifically, hemato-oncology). 61,73,88 FC is being increasingly integrated into veterinary oncology and immunology for similar purposes. This article summarizes technical aspects of FC and the availability of reagents for domestic animal species; it also reviews the diverse applications of FC in veterinary oncology and the practical approaches to quality control. Detailed reviews on applications of FC, quality control, fluorescence compensation, and approaches to data and statistical analysis are available in several recent textbooks. 46,61,69
Flow Cytometric Technology
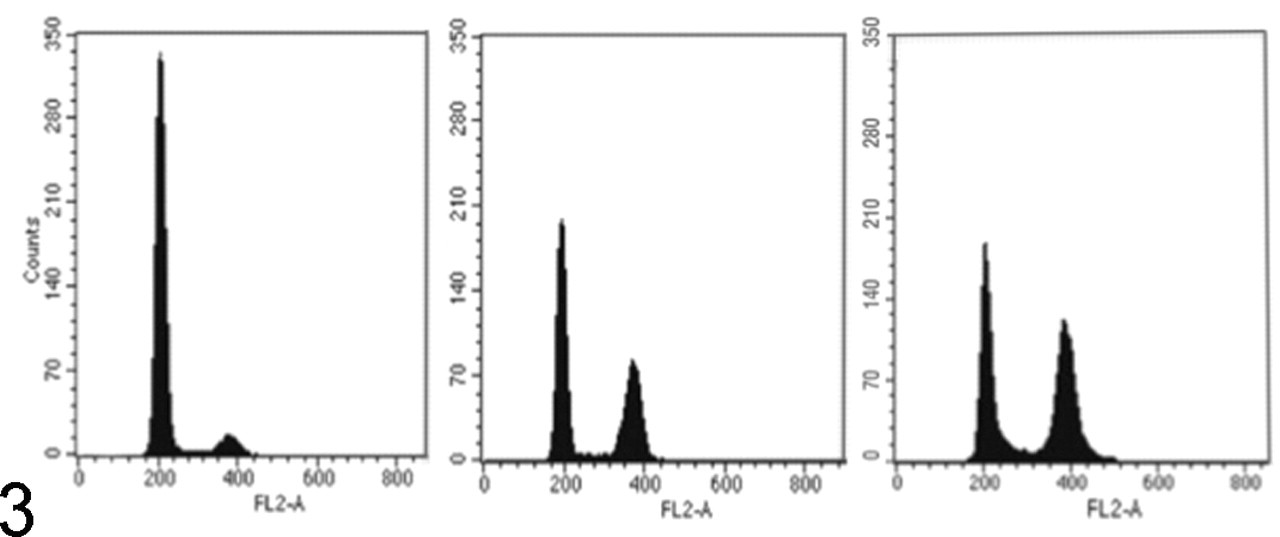
Flow cytometers capture light scatter properties and light emitted by individual cells that innately fluoresce or that are labeled with fluorescent antibodies or probes and then exposed to light. 38,69 The basic principles of a flow cytometer are that (1) cells or particles in single file in a fluid medium are interrogated by light, either from an arc lamp or from one or several lasers of defined wavelength, and (2) light scatter and emission signals are captured. Thus, by necessity, specimens suitable for FC have to be sampled as a fluid (blood, bone marrow, or body fluids) or be transformed from a solid tissue into a cell suspension through digestion of extracellular matrix by proteases or through physical/chemical disruption of cellular adhesion by mincing, filtration, or chelation. The test cell suspension is then ejected into the center of a sheath fluid (Fig. 1 ), which comprises the support medium carrying cells through the cytometer. The sheath fluid circulates under pressure and is generally composed of a buffered saline solution suitable for mammalian cells. Cells join the sheath fluid in the flow cell and, through fluid mechanical design for achieving laminar flow, are placed in the center of the moving fluid stream, narrowed to single file, evenly spaced, and uniformly illuminated as they are exposed to the light beam. Physical factors influencing this process include the size, orientation, and concentration of cells or particles; the width of the orifice of the flow cell; the velocity of both the injected sample and the sheath fluid; the diameter of the center of the moving stream containing cells of interest relative to that of the sheath fluid; and many others. Cells being illuminated at the analysis point scatter light or, if labeled with suitable fluorescent probes, emit light at specific wavelengths. These optical signals are captured by photodetectors and converted from photons to electrical impulses by photodiodes (that have limited signal amplification) or photomultiplier tubes, which increase the electron output per photon input (Fig. 1). The first photodiode capturing low-angle forward scatter (FSC, usually at 0.5°) sits in the path of the light beam and is partially obscured by a metal strip to capture only light that has been diffracted at low angles (Fig. 2 ). Thus, FSC reflects not only the size or volume of cells but also their refractive index and membrane properties. The light beam is further partitioned toward other photodetectors through dichroic mirrors that partly reflect and transmit light (Fig. 1). One photodetector is placed to capture light scattered by cells at high angle (usually 90°), also termed side scatter (SSC) or orthogonal scatter (Fig. 2). SSC is proportional to the internal complexity and surface texture of cells, as readily illustrated by higher SSC resulting from granulocytes than lymphocytes. Additional photodetectors are equipped with filters that capture specific wavelengths, such as green light emission and yellow-orange light emission, measured as fluorescence 1 and fluorescence 2, respectively, by some types of cytometer. Commonly used fluorochromes, such as fluorescein isothiocyanate (FITC) and phycoerythrin (PE), absorb light at wavelengths of 488 nm and emit light at approximately 500 and 575 nm, respectively, which can be individually captured through use of appropriate bandpass filters (Table 1 ). However, most light captured at narrow wavelength width is relatively weak and requires amplification by photomultiplier tubes to generate a useful signal. 46
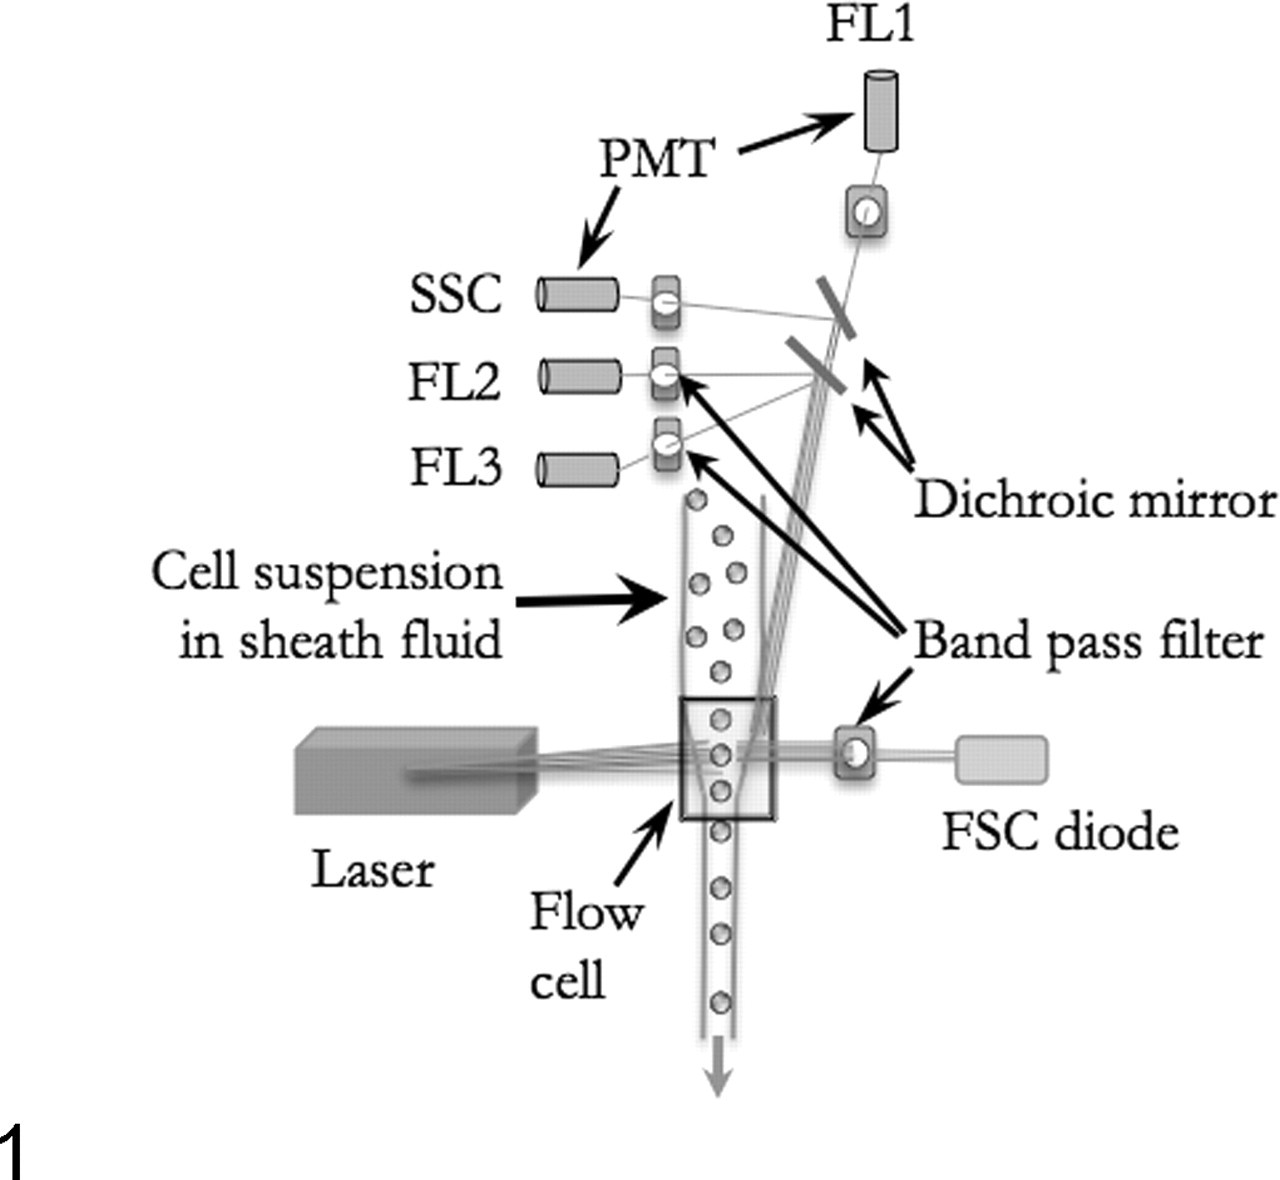
The basic components of a flow cytometer. Cells in suspension are focused into laminar flow and interrogated as single cells by one or several laser beams. Light scatter properties or emitted fluorescence of cells are collected at low angle (forward scatter [FSC]) and high angle (side scatter [SSC]). Bandpass filters transmit light of specific wavelengths, whereas dichroic mirrors partition the light beam according to wavelength. Diodes convert detected light (photons) to an electrical signal (electrons), whereas photomultiplier tubes (PMT) amplify weak light signals during conversion. Photons emitted by fluorochromes are detected at specific wavelengths (fluorescence [FL] 1, 2, 3).
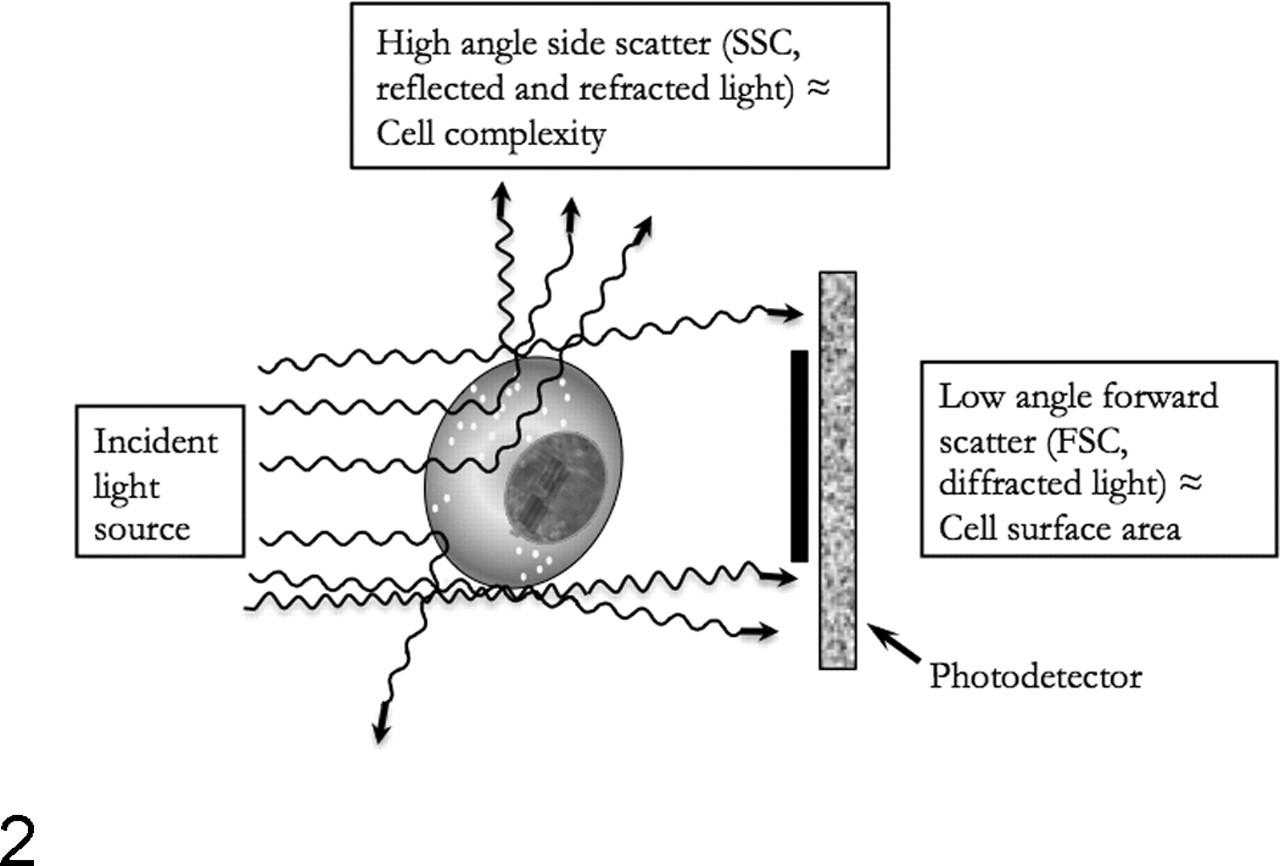
Light detected at low-angle forward scatter (about 0.5°) is proportional to the cross-sectional area and refractive index of a cell and therefore also related to cell volume. Light scattered at high-angle side scatter (about 90°) reflects internal complexity and surface texture of a cell, such that granulocytes have higher side scatter than lymphocytes.
Fluorochromes commonly used in flow cytometers equipped with a 488-nm laser.
a Fluorescence 1, 2, and 3, respectively.
Electrical signals generated from photons are either directly captured on a linear scale, as typical for FSC and SSC, or amplified on a linear or logarithmic scale. Signals are proportional to light intensity and converted from analog to digital to assign intensity values. Signal analysis is multifactorial; it depends on factors such as the type of signal amplification and the number of channels into which the light intensity range is divided. Thus, although a numerical readout is generated for light intensity, in most instances, the value is relative, dependent on parameters adjusted by the user, and incomparable between instruments and between experiments. 69 Flow cytometers with sorting capacity allow segregation of individual cells with distinct light scatter and fluorescent properties from complex cell mixtures for subsequent study. With precaution and appropriate temperature and aerosol control, sorted cells can be maintained as highly viable and sterile for subsequent culture, RNA extraction, or, in the case of sorted sperm, fertilization. 70
Cell Preparation
Cells suitable for FC include those originating from blood, body fluids, and solid tissues that can be processed into single-cell suspension. As with other samples, the preanalytic quality of the specimen greatly affects the quality of the data generated during flow cytometric analysis. Samples should have sufficient cells for the anticipated analysis, should be free of clots and contaminants, and should be handled to maximize viability and minimize artifact. To preserve cell integrity and antigenic expression, samples for FC have to be fresh; 48 hours is generally considered the maximal storage time for retaining adequate viability and antigen expression. 52,53,60,61 Cell viability may be prolonged by storage in cold tissue culture media or in buffers containing EDTA and a protein source such as fetal bovine serum or plasma. 31 Methods have been described for preserving the cytologic features of canine leukocytes for up to 48 hours; whether this applies to accurate maintenance of antigenic integrity has yet to be determined. 5,28,31 Samples from neoplastic tissues with high cell turnover, such as some types of lymphoma, may be more prone to disintegration before 48 hours and should probably be analyzed within 24 hours of collection. If cells for FC are derived from solid tissues, then concurrent and corresponding cytospin preparations, smears, and/or tissue sections for cytologic, histopathologic, and immunohistochemical (IHC) analysis should be prepared to correlate microscopic with cytometric findings, as best performed from whole tissues submitted to the laboratory where samples can then be allocated and prepared for the different analyses.
Although the size and light scatter properties of red blood cells (RBC) differ from those of leukocytes, RBC need to be removed before analysis (because RBC outnumber leukocytes by about 1000-fold in blood). they need to be removed before analysis. Osmotic lysis of RBC with water, ammonium chloride, or other buffers is more likely than density gradient methods to preserve leukocytes in their native state. 61 Density centrifugation methods selectively concentrate leukocytes of a particular buoyant density but will exclude some normal, as well as immature or abnormal, leukocytes. 60 Blood collected into EDTA is ideal for FC because it is suitable for subsequent RBC lysis, FC, and concurrent hematologic analysis. Avian or reptilian blood anticoagulated with heparin is also appropriate, although removal of nucleated RBC by gradient centrifugation is necessary. 42 Samples such as cerebrospinal fluid, cavity effusions, and fine-needle aspirates of lymph nodes and other tissues placed into buffered solutions can be analyzed directly or with minimal cell processing. 21,31 However, sample cellularity should be confirmed through manual or automated counting or estimated from established methods, such as the size of the needle and the number of needle aspirates applied.
Antibody Staining
Once a sample containing sufficient viable cells has been procured, it should be stained with antibodies or analyzed for DNA content without delay. As the first step, cells are usually washed or incubated with a buffer containing serum to block nonspecific antibody binding sites on cells. The block may consist of serum from the species as the cells to be interrogated, but for practical and economic reasons, bovine or equine source serum is often used. Blocking nonspecific binding is particularly relevant to indirect antibody staining protocols; in this case, serum from the same species as the secondary antibody is ideal. Next, cells are divided into aliquots for negative and positive controls and for staining with experimental reagents. Negative control samples may be cells without any added antibody, cells with just fluorochrome-linked secondary antibody, or cells with fluorescent antibody directed to an epitope not expressed on the cell population to be examined. Positive control samples include use of an appropriate dilution of an antibody known to bind to at least some cells in the sample analyzed. Which negative and positive control preparations will be used or whether additional controls are required depends on the type of cells, the antibody isotype, the number of antibody/fluorochrome combinations, the cytometric assay (ie, whether it has been optimized or is being established de novo), and the preference of the operator. FC is prone to spurious signals that may result from autofluorescence of cells, lack of antibody titration, nonspecific antibody binding, interactions of different fluorochromes, lack of instrument optimization, and many other factors. 37 There is considerable potential for erroneous signals and artifact in FC, which underlies the importance of ensuring quality instrument performance, use of appropriate and sufficient control reagents and samples, and periodic verification of results by alternate methods. Protocols for instrument calibration and quality control/assurance should be established for each laboratory; detailed information on factors to consider is available elsewhere. 12,62,69 Even with relatively “simple” one- or 2-color FC experiments, it is often necessary to verify that the signal detected by the cytometer corresponds to an antigen–antibody or substrate–ligand interaction at the appropriate cellular location. Examination of cytospin preparations from experimental samples by fluorescent microscopy or immunocytochemistry is a common and useful confirmatory method.
Antibody incubations are generally performed at 4°C for 15 to 30 minutes to minimize capping and antigen shedding. As in all experiments involving antibodies, their optimal concentration needs to be determined by titration, and if antibody combinations are applied, these need to be optimized in concert. Antibodies may be conjugated directly to fluorochromes (direct staining), which reduces incubation steps and potential for nonspecific binding, or they may be used in a 2-step procedure (indirect staining) with sequential application of a primary antibody, removal of unbound antibody, and application of a secondary fluorescent antibody. In veterinary medicine, the choice of which antibody format to use is often limited by availability of directly conjugated antibodies. Conjugation kits for antibodies are available but may not be economic for individual laboratories purchasing commercial monoclonal antibodies. Efforts to minimize time and labor in preparing samples for routine FC in a diagnostic hematopathology laboratory may warrant conjugation of antibodies, especially if large volumes of antibody are available, such as those from hybridoma supernatants. Overall cost, sensitivity, specificity, and nature and type of sample all factor into determining the most appropriate immunophenotyping protocol. Immunophenotyping of hemolymphatic cells pertains to use of a panel of antibodies directed to cell surface or cluster of differentiation (CD) antigens to characterize cells that appear microscopically similar. 73
Intracellular staining of antigens is often employed for detection of cytokines or cytoplasmic antigens but is more laborious than cell surface antigen detection and more prone to artifact. 66 To allow antibodies access to intracellular antigens, the cells have to be fixed and permeabilized. Fixation with formaldehyde derivatives changes epitope recognition by antibodies, alters the light scatter properties of the cell, and increases antibody binding to nonspecific targets and dead cells. 46 Hence, additional negative and positive control samples are required, and verification of the cellular origin of the fluorescent signal may become essential. Only directly conjugated antibodies are suitable for intracellular antigen detection, but staining of surface antigens by a direct or indirect method is feasible, followed by fixation/permeabilization and subsequent intracellular staining.
Fluorochromes in common usage in diagnostic laboratories are those excitable at 488 nm, which is the output of the argon laser in the first widely used benchtop cytometer, the FACScan from Becton Dickinson. This instrument has 3 fixed-wavelength filters (530, 575, and 675 nm) suitable for capture of emission from FITC, Alexa Fluor 488, PE, peridinin chlorophyll protein, and other dyes (Table 1). FITC and PE remain widely used fluorochromes, but many other dyes excitable at 488 nm are available with greater photostability, such as recently developed quantum dot nanocrystals (Qdot, Invitrogen), which are nanometer-scale semiconductor particles with greater light emission and stability than that of conventional fluorochromes. Because cytometers equipped with additional lasers and filters are becoming increasingly common, a wider array of fluorochromes will become prevalent. Aside from cytometer hardware, fluorochrome choice is influenced by the relative abundance of the antigen of interest (PE yields a brighter signal relative to that of FITC on a per-molecule basis), the separation of emission wavelengths (to yield distinct signals), the nature and location of antigens to be labeled (with PE being a larger molecule than FITC, it may move less readily across permeabilized cell membranes), and others. 69 The choice of flow cytometer for a laboratory depends on the nature of the proposed experiments and diagnostic assays, the number of concurrent fluorochromes to be assayed, the state and wavelengths of lasers in the instrument, the adjustability of signal detection and processing, the level of expertise available for operation, the service accessibility, and the available funds. Small benchtop cytometers that are highly automated with relatively few adjustable parameters are becoming increasingly available at lower prices, thereby enabling a greater number of laboratories to consider adding flow cytometric immunophenotyping to their repertoire of diagnostic tests.
DNA and RNA analysis
In addition to detecting proteins with fluorescent probes and antibodies, FC measures and characterizes DNA and RNA. Flow cytometric nucleic acid analysis is used to characterize DNA or RNA synthesis, cell cycle stages, apoptosis, necrosis, and individual chromosomes. In oncology, DNA analysis can serve as an adjunct to estimate the proliferating tumor fraction or aneudiploid states, which may relate to prognosis of tumors. In contrast to fluorochromes linked to antibodies, nucleic acid dyes significantly fluoresce only when bound to their target; thus, washing off excess stain is not required before analysis in cytometers. A range of nucleic acid stains is available, with choice influenced by excitation and emission wavelength, compatibility with cytometer hardware, cell membrane penetration, and nucleotide specificity. For example, propidium iodide and some monomeric cyanine dyes, such as YO-PRO and TO-PRO, are excluded by viable cells and excitable by argon 488-nm lasers but bind to double-stranded DNA and RNA, necessitating concurrent use of RNase if wishing to assess only DNA. Owing to compatibility with argon lasers, propidium iodide is the most widely used nucleic acid stain, and its exclusion by viable cells allows distinction of necrosis from early apoptosis. 68,71 Acridine orange is also excitable at 488 nm; it is cell permeant; and it emits red fluorescence if bound to nonhelical nucleic acids (eg, RNA or denatured DNA) and green fluorescence if bound to helical DNA. 36 Hence, acridine orange may be used for examining the relationship of RNA content to cell cycle or DNA degradation. Hoechst dyes and chromomycin A3 are excitable by ultraviolet lasers and preferentially bind to AT or GC nucleotides, respectively, which may assist with distinguishing chromosomes and regions enriched in either nucleotide combination. Impermeant nucleic acid dyes are useful for exclusion of nonviable cells from analysis. 68 For example, 7-amino-actinomycin is excitable by 488-nm lasers and emits at 655 nm, which is distinct from FITC and PE; therefore, 7-amino-actinomycin can be easily incorporated into cell preparations to indicate integrity of the cells being analyzed. 70
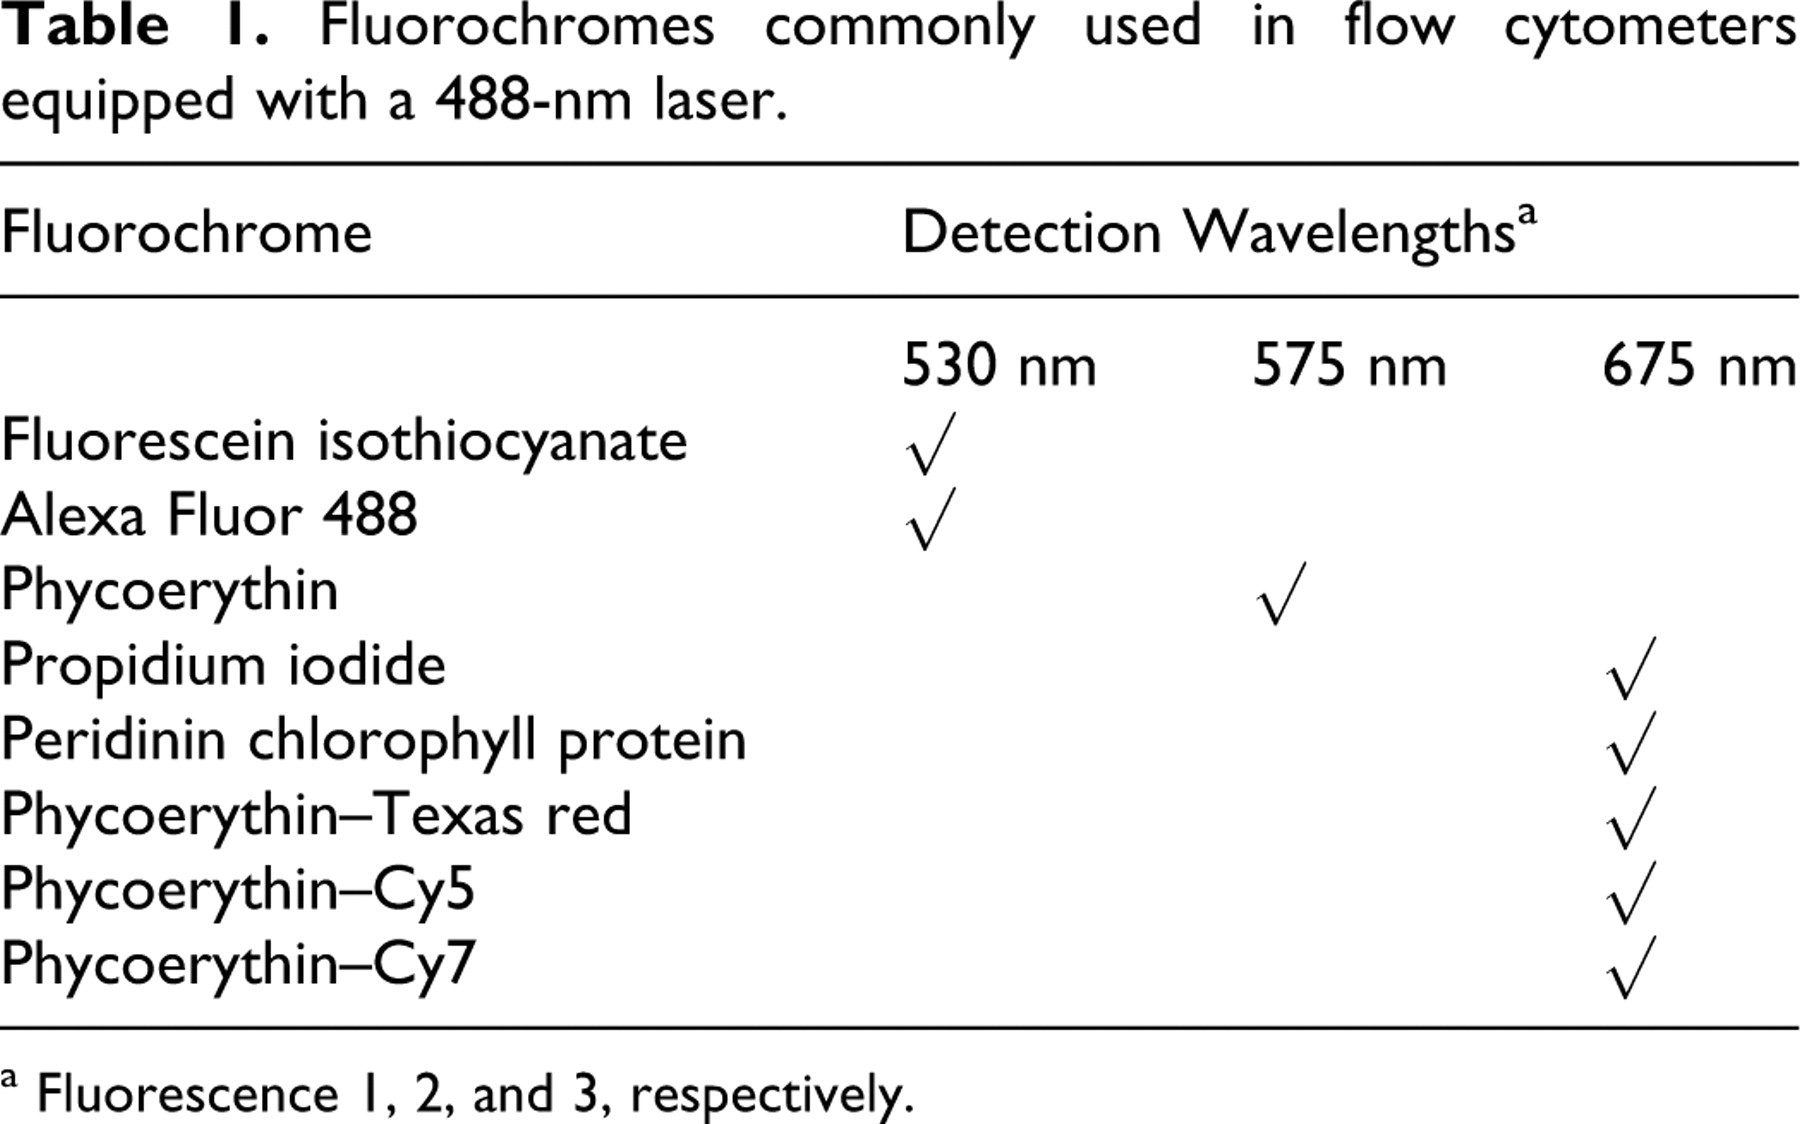
Cells of an organism have a consistent amount of nuclear DNA unless they undergo meiosis, mitosis, or apoptosis. This amount of DNA reflects the diploid (2C) state in somatic cells. Cell populations containing nuclei with increased or decreased DNA content (aneuploid) are commonly observed in tumors and, in many instances, reflect malignant properties of the tumor (Fig. 3 ). More than 20 years ago, Hedley established cytometric quantification of DNA in nuclei purified from formalin-fixed and paraffin-embedded tissues, 33 which subsequently enabled many retrospective correlations of tumor histopathology, treatment, and outcome using stored specimens. An important quality control for cytometric DNA analysis pertains to the coefficient of variation obtained for diploid DNA peaks. Because a uniform amount of DNA per cell should yield consistent fluorescent signals and, therefore, narrow peaks, wide coefficients of variation may result from nuclear degradation, variations in the laser beam, uneven sample staining, poor sample flow, or truly aneuploid cells with an abnormal amount of DNA. Therefore, obtaining sharp and narrow peaks in control samples is essential for sensitive identification of nuclei with slightly more or less DNA (Fig. 3). It is also essential to remember that fluorescence reflects total DNA per nucleus, which is generally unaltered by translocations, insertions, or deletions. Biologically, the latter changes may be highly significant and detectable by cytogenetic analysis, but unless the total DNA content changes by more than approximately 5%, these are not detected by FC.
Dog; cells stained with propidium iodide and analyzed in a flow cytometer. Left: Benign splenic tissue consists of 94% cells with diploid DNA content (peak 1) and 6% cells with approximately tetraploid DNA content (peak 2). Middle: Splenic histiocytic sarcoma consists of 49% diploid nuclei (peak 1), 5% DNA-synthesizing nuclei (area between peak 1 and 2), and 46% approximately tetraploid nuclei (peak 2). Right: Lymphoblastic T-cell lymphoma consists of 43% diploid nuclei, 8% DNA-synthesizing nuclei, 44% approximately tetraploid nuclei, and 5% nuclei with more than tetraploid DNA content. FL2-A, fluorescence 2 area.
For in vitro assessment of the cell cycle, it is often desirable to quantify the proportion of cells in each diploid (G0/G1) stage with a 2C complement of DNA, the S phase with an intermediate amount of DNA, and the G2/M phase, where DNA synthesis has been completed to the tetraploid (4C) stage. 36 Flow cytometric determination of DNA synthesis correlates with measuring the incorporation of radioactive tritiated thymidine into newly synthesized DNA, but it yields information about cells relative to control samples, not absolute numbers. Furthermore, as with most flow cytometric analyses, deciding where one histogram peak ends and the next one begins can be subjective and can greatly influence the results. Clumped nuclei analyzed in a cytometer will generate exactly twice or thrice the fluorescence of a single nucleus, which may therefore give erroneous results that must be excluded by initial analysis of signal height versus width to distinguish clumped cells from hyperdiploid cells. Once analysis focuses on single cells, various software algorithms can be applied to estimate the proportion of cells in each phase and hyperdiploid state. 18 Differences in the DNA content between a sample and the corresponding control tissue may indicate acquisition of numeric chromosomal errors.
Data Analysis
Once cells are labeled with fluorochromes, they can be immediately run through the flow cytometer (fresh) or preserved with formaldehyde- or alcohol-based fixatives (fixed) for delayed analysis. Cells that are fixed have different light scatter properties and reduced fluorochrome emission; therefore, most investigators prefer analysis of fresh samples. 50,69 However, consistent cell analysis is more important than analysis of fresh versus fixed samples. Cells permeabilized for intracellular antibody staining are also fixed and therefore differ from unfixed cells in terms of light scatter. Quality control and assurance procedures pertaining to instrument calibration, appropriate fluorochrome detection, and use of standards are beyond the scope of this article but are important considerations described elsewhere. 11,51
In FC, researchers usually measure 2 light scatter parameters and at least one fluorescent parameter of more than 10,000 cells; as such, efficient data handling is a large component of maximizing the utility of the technology. Most cytometry systems store data in FC standard format, with all information about a particular sample suitable for analysis through a variety of software. Hence, if a sample is prepared with 2 different fluorochromes and 50,000 cells are analyzed, the uncensored “list mode” data file will contain a numeric value for FSC, SSC, and each fluorochrome of every one of these 50,000 cells. Clearly, the data volume generated from FC is sizable, but having the original and complete data set available is important to allow repeat analysis by users and manuscript reviewers with different software. Typically, data are initially displayed in 2-dimensional plots of FSC versus SSC (Fig. 4 ), as dot, density, or contour plots. In blood samples, where the RBC have been lysed, this configuration separates lymphocytes, monocytes, and granulocytes into relatively distinct clouds, with monocytes typically being the least homogeneous cell population. Selecting regions of cells with distinct features then allows specific (gated) analysis of a population of cells, such as fluorescence expressed on lymphocytes (Fig. 4A). The highly visual nature of flow cytometric interpretation becomes apparent when examining cytograms, given that cell populations with different light scatter properties may be readily apparent before analysis of fluorescence (Fig. 4B and 4C). Cytograms to examine cell fluorescence may be set to display FSC or SSC versus fluorescence or, alternately, fluorescence in one channel versus fluorescence in another channel, depending largely on the nature of the antigen being examined (variable expression on different leukocytes or restricted expression on one type of leukocyte) and the preference of the operator. Histograms are useful to assess data distribution for statistical evaluation of a single parameter.
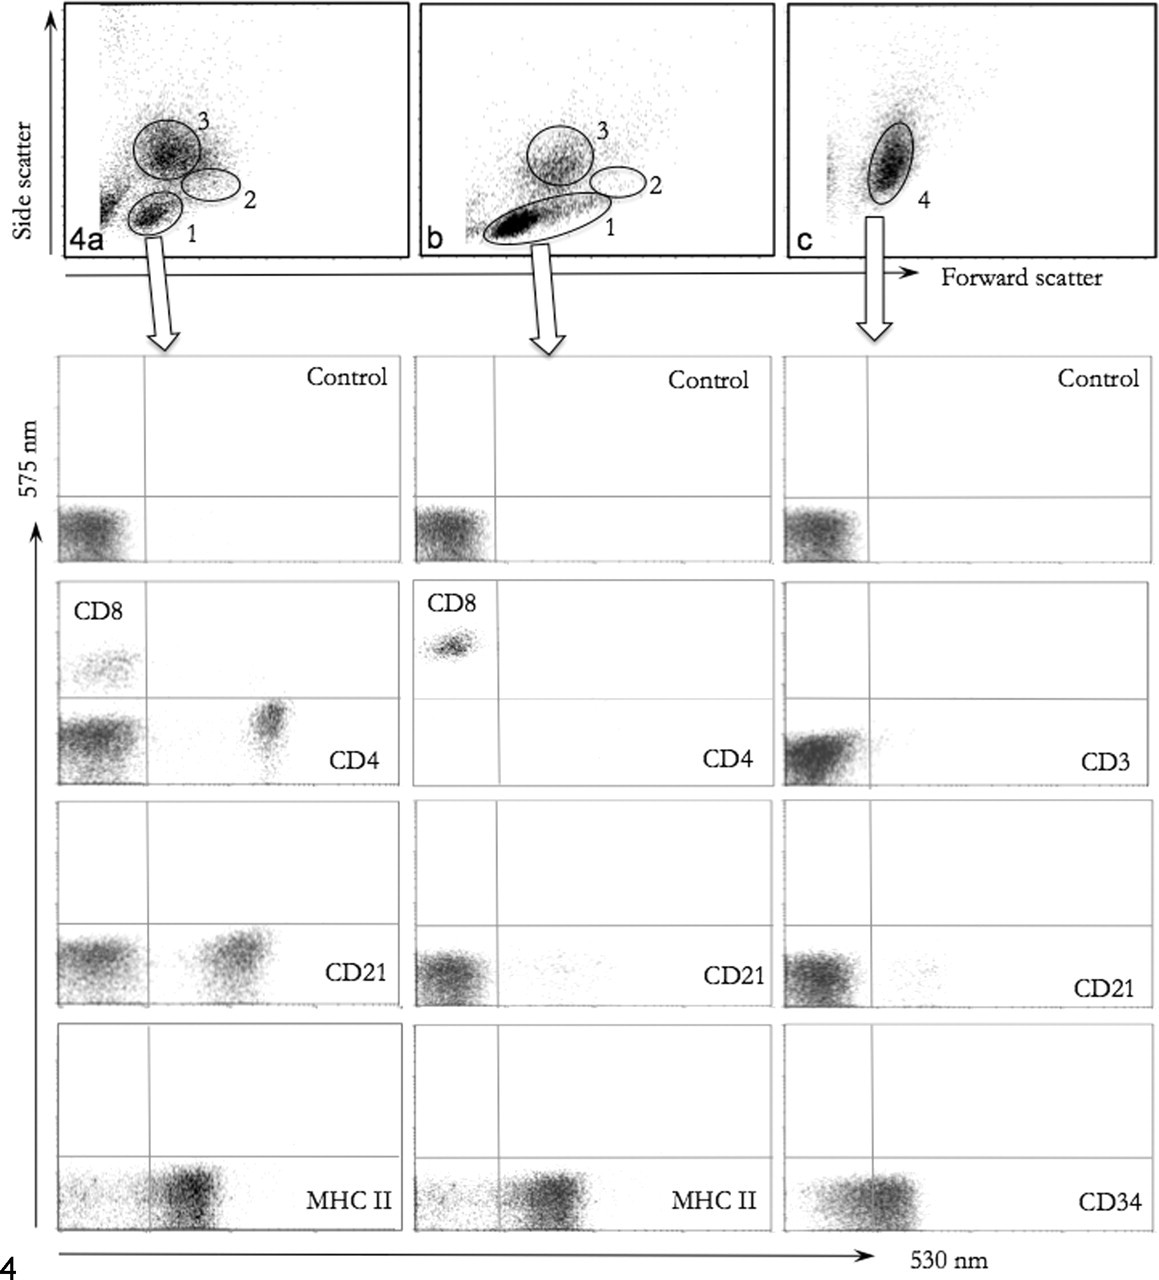
Dog; blood samples analyzed in a flow cytometer; red blood cells have been lysed. A, control dog; leukocytes form clouds of cells with low side scatter and low forward scatter (1 = lymphocytes), intermediate side scatter and higher forward scatter (2 = monocytes), and high side scatter (3 = granulocytes). Within gate 1, mutually exclusive staining is recognized for CD4 and CD8 (expressed on T lymphocytes; CD4+ cells outnumber CD8+ cells in health); CD21+ B lymphocytes comprise 20 to 30% of lymphocytes; and most lymphocytes express MHC II. B, dog, chronic lymphocytic leukemia (35,600 leukocytes/µl). The lymphocyte cloud (1) contains a greater number of cells relative to monocytes (2) and granulocytes (3) and has a tail of cells with higher forward scatter. The cells in the lymphocyte gate are uniformly CD8+ and most express MHC II. There is lymphocytopenia of CD4+ and CD21+cells. C, dog, acute leukemia, undifferentiated (25,200 leukocytes/µl). There is a uniform population of cells with relatively high side scatter and intermediate forward scatter (4) and with absence of typical lymphocyte and granulocyte populations. The cells do not express antigens of differentiated lymphocytes, but approximately 70% express CD34, a marker of early hematopoietic cells.
Compensation corrects for fluorescence emission spectral overlap, whereby the wavelength of light emitted by one fluorochrome or by the autofluorescence of cells spills into the bandpass filter of another fluorochrome. 69 This is a common occurrence, even with just 2 fluorochromes, and compensation becomes increasingly important and complex with greater numbers of fluorochromes. 78 Most analysis software allows for emission overlap to be compensated subsequent to data collection, but with older cytometers, such as the FACScan, manual adjustment to the electronic circuitry during data acquisition will facilitate subsequent offline data analysis. Proper compensation is a topic of extensive debate among cytometrists. 49 From a practical perspective, if only 2 or 3 concurrent fluorochromes are being assessed, sufficient compensation usually comes in the form of including samples with each fluorochrome by itself or samples with multiple fluorochromes expressed on mutually exclusive populations (eg, CD4 and CD8 on blood lymphocytes).
Data analysis for routine panels involving multiple aliquots with, maximally, 2 concurrent fluorochromes may be fairly simple, if the relative expression of an antigen is designated just as absent, dim, or bright. For example, typical canine diffuse B-cell lymphomas are composed of large lymphocytes that lack expression of T-cell antigens, such as CD3, CD4, CD8, T-cell receptor αβ and γδ (αβ-TCR and γδ-TCR), fluoresce dim for CD18, and fluoresce bright for CD21, major histocompatibility (MHC) class II, and others. 31 But precise quantification of the expression of antigens on cells gated through multiple parameters requires more complex analytic approaches. The limitations of linear and logarithmic data presentation and analysis have recently been explored, and novel approaches are now often incorporating biexponential (“logicle”) data display to provide more detail on properties of cells in dim regions of logarithmic scales. 35 Owing to the numerous permutations of data collection and analysis in FC, it is now a common requirement for publication to indicate the instrument and software used, the scale for data presented in plots, the strategy or algorithm employed for gating, the cell frequency, and how fluorescence intensity was determined. 49
Veterinary Applications
In veterinary research, measurement of cell fluorescence may be employed for immunophenotyping, ploidy analysis, functional cell assays, or determination of transfection efficiency with genes encoding fluorescent proteins. 6,20,44,59 In oncology, FC is most often applied in hematopathology, 61 as facilitated by specimens in usually fluid format and for which numeric parameters associated with health or benignity are established. Efforts in 2000 10 and 2006 88 to establish consensus for immunophenotypic characterization of human hemolymphoid neoplasms identified an optimal 2-step process consisting, first, of a panel for lineage evaluation (B lymphocytes, T lymphocytes, natural killer (NK) cells, myelomonocytic cells, plasma cells) and, second, a panel for more specific classification, with each panel comprising between 4 and 22 antibodies, depending on the lineage. Such extensive panels are often prohibitive in veterinary oncology because of cost and limited reagents. Nevertheless, generation and validation of monoclonal antibodies reactive with animal antigens is steadily expanding, and there is a growing body of knowledge concerning lineage-specific CD marker expression 74 and DNA content of animal tumors. 16
Lymphoproliferative Disease
Lymphoma is usually suspected from clinical signs and laboratory data and confirmed by cytopathologic and/or histopathologic evaluation. Only architecturally diffuse lymphomas lacking admixture of large numbers of benign lymphocytes are amenable to cytologic diagnosis, restricting this diagnostic approach mostly to canine lymphoma. Once a diagnosis of lymphoma has been established, samples aspirated from enlarged lymph nodes or other masses may be placed in a suitable buffer (typically, saline with a small amount of serum and EDTA), stained with fluorescent antibodies, and analyzed in a flow cytometer to classify the type of lymphoma. 29 –31 We must emphasize, however, that flow cytometric analysis should never replace diagnosis based on cytopathologic or histopathologic tumor features; rather, flow cytometric analysis should assist with classification of the type of lymphoma. Because immunophenotypic characterization of lymphocytes aspirated from tumors precludes architectural information about the tissue, only samples composed predominantly of neoplastic lymphocytes should be assessed. In other words, if the lymphoma comprises only a few presumed neoplastic lymphocytes and numerous benign lymphocytes, such as T-cell-rich B-cell lymphoma, 54 flow cytometric distinction of neoplastic lymphocytes from benign lymphocytes would be challenging or impossible. Because of the dedicated effort of a few individuals, monoclonal antibodies available to characterize lymphocytes in small animals are relatively extensive, 7,17,57 and hemolymphatic neoplasms characterized with panels including up to 32 antibodies have been described. 1,2 However, many of the available antibodies recognize antigens only in non-formalin-fixed cell preparations or frozen sections. Studies evaluating lymphoma in dogs by FC have generally confirmed the predominance of one type of B-cell lymphoma and identified a variety of T-cell phenotypes. 30 Exceptions include certain breeds, such as Boxers 47 and Spitz- and Shi Tzu–related breeds 56 whereby IHC predominance of T-cell-origin, rather than B-cell-origin, lymphoma was shown. A diffuse large cell lymphoma corresponding to an immunoblastic subtype by World Health Organization criteria 80,81 is the most common B-cell-origin lymphoma in dogs and is characterized by expression of surface antigens CD1, CD21, CD45RA, CD90, and MHC class II. 31,80 Canine T-cell lymphomas are more varied in immunophenotype and characterized by expression of various combinations of T-cell antigens CD3, CD4, CD8, and αβ-TCR or γδ-TCR. Analysis of T-cell lymphomas in Boxers correlated immunophenotypes with morphologic features. 47 The hypercalcemia characteristic of T-cell-origin lymphoma in dogs is most frequently associated with expression of CD4 and αβ-TCR antigens. Flow cytometric comparison of benign and malignant canine lymphocytes identified relative downregulation of CD18 and CD45 on neoplastic cells, potentially limiting their use as universal leukocyte markers. 15,30 These findings corroborate that CD18 detection in formalin-fixed round cell tumors suggests histiocytic or granulocytic origin rather than lymphocytic origin.
Antibodies that have been identified as being prone to nonspecific binding in animal cells include clone HM57, raised against an intracellular epitope of the alpha chain of CD79 and widely employed to identify B lymphocytes. This antibody has great value for reactivity in formalin-fixed tissues across a range of species but is prone to nonspecific binding to nuclei of lymphoid and nonlymphoid cells (unpublished observations). Such nonspecific interaction may occur in flow cytometric unfixed cell preparations where only a fluorescent signal is detected but the source of the signal is not apparent (Fig. 5 ). Subsequent immunocytochemical evaluation of ostensibly concurrent expression of T-cell (CD3) and B-cell (CD79α) antigens was consistent with T-cell origin and nonspecific nuclear binding of antibody HM57 (Fig. 6 ). Other B-cell-specific antibodies reactive with formalin-exposed epitopes in dogs are directed against CD20, 40 CD22, 22 and Pax5, 87 but because their target epitopes are located intracellularly, use in FC requires caution. Monoclonal antibody BLA.36 was raised against antigens expressed on Hodgkin lymphoma cells, 39 and it has been applied to detect B cells in animal samples. However, reactivity of the antibody is not specific for canine 58 or equine B or T lymphocytes. 54 For FC, antibodies directed against extracellular epitopes, such as clone CA2.1D6, are more useful for identification of B cells. 22
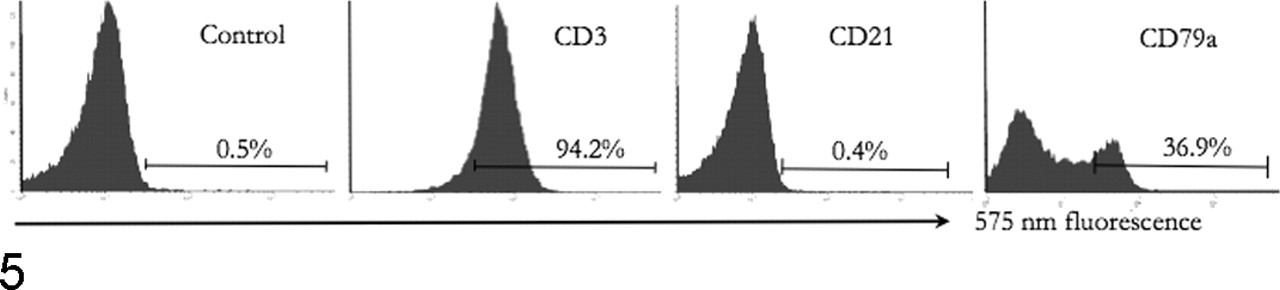
Dog; flow cytometric analysis of lymph node aspirate. Most cells are CD3+ and CD21–. Staining of permeabilized cells with CD79α–phycoerythrin antibody suggests that 36.9% of cells are positive.
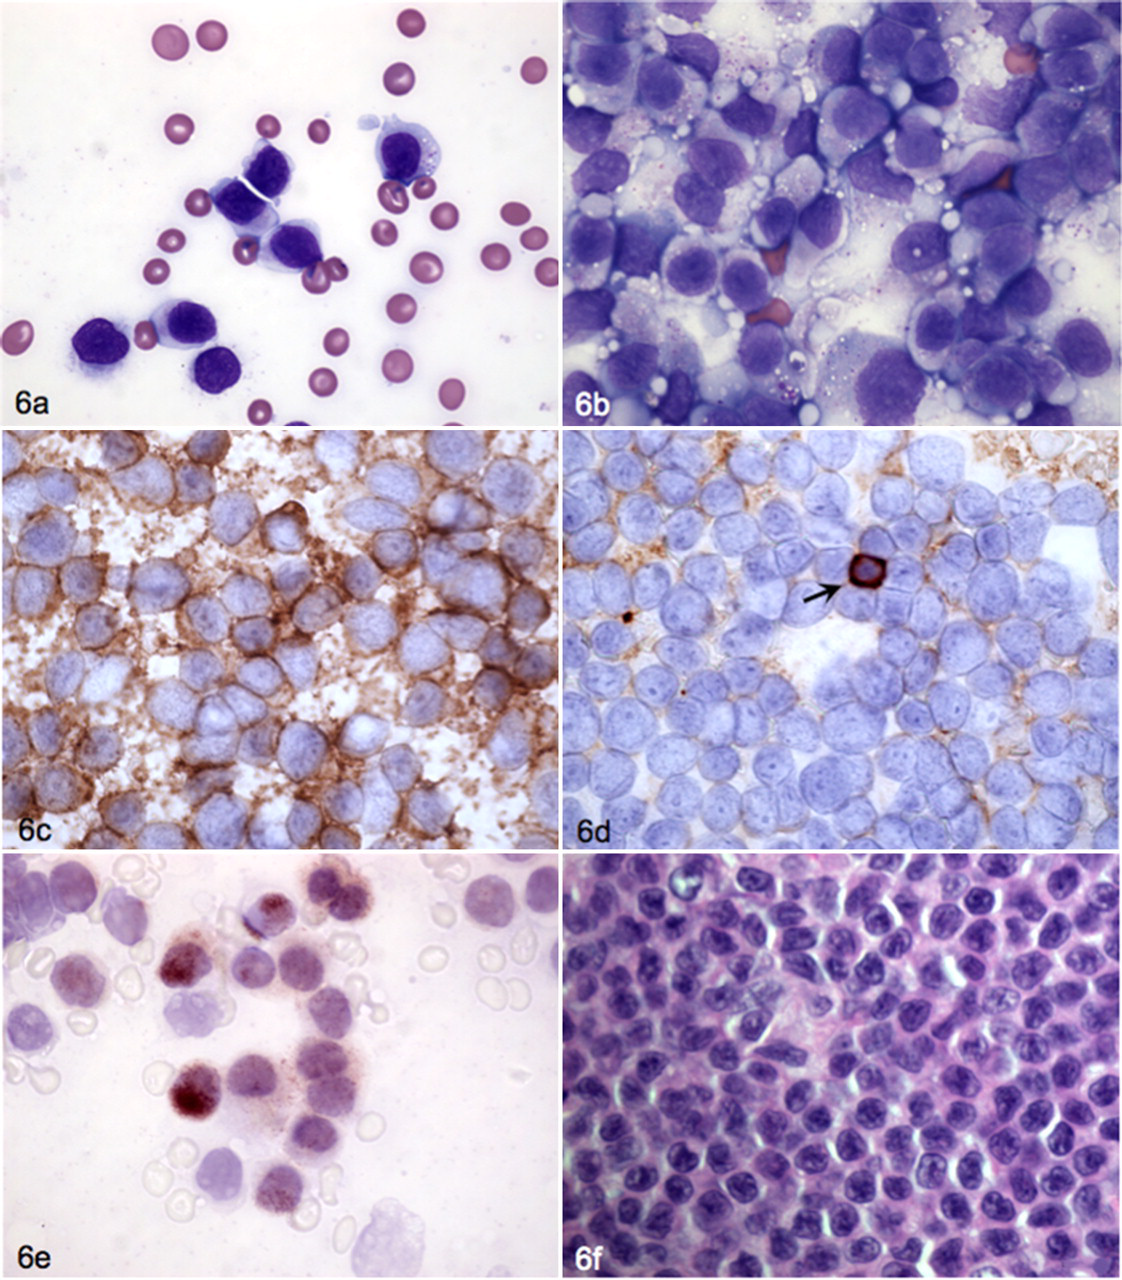
Same dog as in Figure 5; blood and lymph node samples. A, blood smear from a dog with a CD3+, CD8+, T-cell receptor αβ+ nodal lymphoma. The blood smear shows a monomorphic lymphocytosis indicating concurrent leukemia. Wright stain. B, similar cells with fine cytoplasmic azurophilic granules compose the majority of cells in a lymph node aspirate. Wright stain. C, lymph node cells uniformly positive for cytoplasmic CD3. Immunochemistry with Nova red chromogen. D, immunocytochemistry for CD21 shows that the majority of cells are negative except for a single small lymphocyte (arrow). Immunochemistry with Nova red chromogen. E, immunocytochemical staining for CD79α indicates strong nonspecific nuclear and faint cytoplasmic staining. Immunochemistry with Nova red chromogen. F, on histopathology, the tumor consists of a diffuse sheet of medium-size lymphocytes with round to oval nuclei and a moderate amount of cytoplasm. HE.
Lymphocyte-rich thymomas and small cell thymic lymphomas may appear cytologically similar but warrant different therapy; hence, their distinction is important and may be facilitated by FC. Identification by FC of mediastinal mass aspirates containing ≥ 10% lymphocytes coexpressing CD4 and CD8 was reported to correlate with a histologic diagnosis of thymoma, whereas thymic lymphomas expressed either CD4/CD8 or B-cell antigens. 43 However, the number of cases evaluated was modest, and because coexpression of CD4 and CD8 has been reported in lymphomas, flow cytometric results should be interpreted in conjunction with morphologic tumor evaluation. 25 FC has facilitated better understanding of the site of origin for some lymphomas. For example, in cats, benign intestinal intraepithelial lymphocytes consist mostly of CD3+ T cells, with a large proportion of lymphocytes expressing the CD8αα homodimer rather than the CD8αβ heterodimer, which is more common among blood lymphocytes. 63 Another small proportion of intraepithelial lymphocytes are CD4+ and CD3+/CD11d+ lymphocytes. 64 Feline intestinal lymphoma of large granular lymphocyte (LGL) morphology is a cytologically distinct entity with frequent circulating neoplastic cells and a poor prognosis. 64 Most of these intestinal-origin LGL-type lymphomas express CD3 and the CD8αα homodimer, consistent with intraepithelial lymphoid origin. In addition, expression of the intestinal leukointegrin αE (CD103) on tumor and leukemic cells supports intestinal origin of this lymphoma. In the dog, the majority of intraepithelial intestinal lymphocytes are also CD3+ T cells with an overabundance of CD8+ lymphocytes relative to CD4+ lymphocytes and up to 35% of lymphocytes expressing the γδ-TCR. 72 Canine hepatosplenic lymphoma is a rare and aggressive form of lymphoma composed of γδ-TCR+ lymphocytes coexpressing the leukointegrin αDβ2 (CD11d), which in health is most highly expressed on splenic red pulp lymphocytes and macrophages. Hence, hepatosplenic lymphoma has been considered to arise from this splenic location. 29
A more common lymphoproliferative condition of dogs is chronic lymphocytic leukemia, 54% of which are reported to have LGL morphology. 82 This indolent neoplasm characteristically occurs in older dogs and is associated with splenomegaly but minimal bone marrow involvement. Comprehensive flow cytometric assessment has determined that the majority of chronic lymphocytic leukemia in dogs expresses CD8 and αDβ2, with more frequent coexpression of the αβ-TCR than the γδ-TCR. 82 Dog lymphocytes expressing CD3, CD8, low levels of CD5, and the αβ-TCR may have functional properties akin to NK cells in other species. 45 However, NK-like cells are heterogeneous in humans and mice, and additional lymphocyte types with NK-like properties will likely be discovered in dogs. 45 Available antibodies for horse lymphocyte antigens are more limited, but flow cytometric investigation of neoplastic effusions in a limited number of cases indicated CD4+ T-cell predominance, in agreement with IHC CD3 expression among intestinal and multicentric lymphomas. 54 Changes in the proportions of blood lymphocytes were also identified in horses with cutaneous lymphoma, but the masses consisted of a mixture of CD4+ and CD8+ T lymphocytes. 19 Reagents to immunophenotype bovine lymphocytes are relatively abundant and have been applied to investigation of bovine leukemia virus–induced lymphoproliferation. 4 A proportion of cattle infected with bovine leukemia virus develop persistent lymphocytosis, which is composed of CD5+ and surface immunoglobulin M+ polyclonal lymphocytes, whereas solid tumors express CD5, surface immunoglobulin M, MHC class II, and only a single light-chain type. 89
Myeloproliferative Disease
Acute leukemia composed of undifferentiated blast cells with one or several prominent nucleoli but lacking morphologic features of a specific cell lineage remains a disease with a uniformly poor prognosis in animals. 79,80,83 Traditional methods for assigning lineage are cytochemical reactivity and/or ultrastructural evaluation, but such assays require technical expertise and equipment not widely available, are difficult to quantify, and are subjective in interpretation. Classification of acute leukemia into myelocytic, megakaryocytic, erythrocytic, monocytic, lymphocytic, or undifferentiated type has merit for understanding unique aspects of the pathogenesis; it may offer prognostic information; and it may eventually direct rational therapy. 79 Although flow cytometric characterization also requires technical expertise and equipment not yet widely available, its unique strength lies in assessment of multiple features of a large number of cells by relatively objective criteria. State-of-the-art characterization of acute leukemia in humans consists of cytogenetic, molecular genetic, immunophenotypic assays and, increasingly, gene expression profiling. 76,84 FC can have a substantial role in refining the morphologic diagnosis of acute leukemia in animals until validated molecular assays become more available. Neoplastic cells from acute myeloid and lymphoid leukemia commonly express the hematopoietic stem cell marker CD34, which can be identified in dogs with specific antibodies. 82,83,86 Detection of this antigen on neoplastic cells facilitates distinction of acute leukemia from stage V lymphoma with neoplastic lymphocytosis, but it does not classify the type of leukemia. 75 Accordingly, expression of CD34 by leukemic cells in dogs implies significantly shorter survival than does leukemia of CD34-negative cells. 86 Concurrent detection of lineage-specific antigens (eg, myeloperoxidase; high in granulocytes, low in monocytes) and expression of neutrophil-specific antigen (NSA, granulocytes); CD14 or MAC387 (monocytes); and CD41, CD61, CD62P, or von Willebrand factor (megakaryocytes) permits classification of acute leukemia. 2,15,30,85
The utility of FC was recently and clearly illustrated by characterization of an unusual round cell leukemia in a dog, with a panel of 27 antibodies and 5 additional antibodies to intracellular antigens by immunocytochemistry or IHC. 1 Dendritic cell origin could be confidently ascribed because of the constellation of CD1, CD11c, CD80, and CD86 expression on the neoplastic leukocytes. Lymphoid origin could be ruled out by absence of CD3, CD4, CD8, CD20, CD21, CD79a, and TCR antigens and granulocytic origin, by lack of myeloperoxidase, CD4, and 11b expression. A similarly comprehensive immunophenotypic panel allowed confident diagnosis of acute megakaryoblastic leukemia in a dog. 2 However, at this time, the body of knowledge concerning animal leukemia—specifically, acute leukemia—largely consists of individual case reports with variably detailed characterization and a few larger studies lacking response to therapy and survival information. To arrive at a better understanding of the epidemiology, natural history, and response to therapy of leukemia in animals, broader panels of lineage-specific antibodies are required as applied in standardized immunophenotyping assays and correlated with treatment and outcome.
Tumor DNA Content
Flow cytometric DNA analysis is independent of antibodies, and the possibility of analyzing cell suspensions from formalin-fixed, paraffin-embedded tissues conveniently enables the use of archived materials. 3,8,14,27,48 In theory, a high proportion of cells containing asymmetric DNA content (aneuploid) should reflect gross genetic abnormalities of a tumor, and an increased proportion of cells synthesizing DNA should reflect rapid growth. 32 Accordingly, aneuploid cells have been identified in canine mast cell tumors, 3 melanomas, 8 transitional cell carcinomas, 13,14 plasma cell tumors, 27 hemangiopericytomas, 41 prostatic carcinomas, 48 osteosarcomas, 26 mammary tumors, 65 lymphomas, 77 and feline mammary gland tumors. 55 In 3 studies, aneuploidy was present in 31% of mast cell tumors, 79% of transitional cell tumors, and 27% of hemangiopericytomas, 3,14,41 although correlation with survival was nonsignificant in each study. Possible reasons for limited prognostic significance of aneuploidy include admixture of multiple nonneoplastic cells in analysis, tumor heterogeneity, and tumor necrosis. 32 Benign tumors and hyperplastic or inflammatory lesions should have diploid DNA content, 26 whereas multinucleated cells (eg, giant cells in granulomatous inflammation, megakaryocytes, and regenerating or hyperplastic tissues with numerous mitotic cells) may have polyploid cells 9 and necrotic or apoptotic cells have hypodiploid DNA content. Inclusion of such cells in tumor DNA analysis obscures detection of aneuploid cells. 32 Prognostic value of DNA analysis has been reported for canine oral melanomas, 8 mammary tumors, 34 and osteosarcomas. 26
Other Applications in Veterinary Oncology
FC has been used to assess expression of cell surface or intracellular antigens uniquely expressed in neoplastic cells or predictive of tumor behavior. For example, assessment of suspensions of canine osteosarcoma cells identified that the chemokine receptor CXCR4 is uniquely expressed on primary, but not metastatic, tumors. 23 Similarly, the protein product of the tropomyosin-related kinase A proto-oncogene was detected by FC on osteosarcoma cells, and presence implied resistance to apoptosis. 24 A flow cytometric assay was designed to detect multidrug resistance-associated protein 1 and P-glycoprotein on canine lymphocytes and to concurrently evaluate retention of cytoplasmic fluorescent label. 67 Such assays may be useful in the context of assessing the response of tumors to chemotherapy.
In summary, FC is a highly useful technique for classifying hemolymphoid tumors. With increasing availability of antibodies and affordable cytometers, it is poised to become a component of many veterinary hematology laboratories. Applications in other areas of veterinary oncology remain to be fully explored.
Footnotes
The authors declared that they had no conflicts of interests with respect to their authorship or the publication of this article.
The authors declared that they received no financial support for their research and/or authorship of this article.