
Abstract
Objective
Although humans are widely exposed to polycyclic aromatic hydrocarbons, current evidence on the association between urinary polycyclic aromatic hydrocarbon metabolites and sleeping troubles remains limited. Herein, we aimed to investigate the effects of urinary polycyclic aromatic hydrocarbon metabolites on sleep-related issues.
Methods
This retrospective cross-sectional study analyzed data from 3262 adults (≥20 years) enrolled in the National Health and Nutrition Examination Survey cycles (2005–2006, 2007–2008, and 2011–2012). The association between urinary polycyclic aromatic hydrocarbon metabolites and sleeping troubles was assessed using 11 distinct machine learning algorithms. Subsequently, network toxicology was conducted to identify critical protein targets, which were subsequently validated through molecular docking analyses.
Results
Both the Random Forest and CatBoost algorithms exhibited superior performance, identifying four key pollutants: 1-hydroxypyrene, 2-hydroxyfluorene, 3-hydroxyfluorene, and 3-hydroxyphenanthrene. Molecular docking analysis further revealed that the critical targets through which polycyclic aromatic hydrocarbons influence sleep include androgen receptor, B-cell lymphoma, nuclear receptor subfamily 3 group C member 1, and transient receptor potential vanilloid 1.
Conclusions
Our findings revealed an association between environmentally relevant polycyclic aromatic hydrocarbon metabolites and sleep disturbances. We also explored the underlying mechanisms using network toxicology. Our findings provide a foundation for in vivo validation in preclinical animal models and the development of sleep interventions targeting polycyclic aromatic hydrocarbons.
Keywords
Introduction
Sleep is essential for maintaining overall health and enhancing quality of life. However, sleep-related issues have become more prevalent with social development and increasing psychological stress. 1 Research has shown that approximately 14.5% of American adults experience sleep-related issues. These issues include difficulty falling asleep, short sleep duration, poor sleep quality, and daytime fatigue. 2 Additionally, sleep disorders can increase the risk of various conditions, including type 2 diabetes, heart disease, dementia, depression, and premature death.3–7 Multiple factors contribute to sleep disorders. For example, chronic pain and hormonal imbalances can disrupt the ability to maintain uninterrupted sleep, whereas mental health conditions, such as anxiety and depression, are well-documented triggers of insomnia.4,8,9 Additionally, behavioral factors such as shift work or nonstandard work schedules can disrupt the natural biological clock, resulting in reduced sleep duration and efficiency. 10 Environmental pollution and related characteristics, including air pollution and passive smoking, have also emerged as significant factors influencing sleep quality. Additional factors include high concentrations of heavy metals and noise pollution.11–14 Several studies have investigated how these environmental factors adversely affect sleep quality by altering physiological and psychological processes.
Polycyclic aromatic hydrocarbons (PAHs) are widespread environmental pollutants found at high concentrations in the environment. They mainly originate from vehicle emissions, waste burning, petroleum refining, and the incomplete burning of fossil fuels or coal. 15 PAHs contain two or more fused benzene rings, making them chemically stable and highly adsorptive to particulate matter. This characteristic enables PAHs to enter the human body via multiple routes, including ingestion, skin absorption, and inhalation. Once inside the body, PAHs are metabolized into hydroxylated metabolites, which are subsequently excreted in the urine. Therefore, measuring urinary hydroxylated PAH metabolites is a reliable method for assessing internal PAH exposure. 16 PAHs are well-documented for their carcinogenicity, mutagenicity, and neurotoxicity, and prolonged exposure may pose serious health risks to humans. 17 Moreover, emerging evidence suggests a strong association between elevated PAH levels and an increased incidence of sleep disorders.18,19
Guided by the principles of network biology and network pharmacology, the traditional “drug–target–disease” model has evolved into a “drug–target–adverse effect” framework. This change has transformed conventional pharmacological databases into specialized toxicological databases, leading to the emergence of network toxicology. Accordingly, researchers have shifted from studying disease mechanisms to investigating adverse reactions, enabling more accurate understanding and prediction of substance toxicity. 20 Network toxicology has introduced new approaches to understanding the mechanisms of diseases caused by toxic substances. It has been successfully applied in various environmental diseases to uncover novel mechanisms and identify potential therapeutic targets. Previous studies have employed network toxicology to elucidate the mechanistic effects of bisphenol A exposure on psoriasis pathogenesis. 21 Similarly, this approach has been applied to systematically investigate the pathophysiological mechanisms underlying triclosan-associated ischemic stroke development. 22 Moreover, network toxicology integrates environmental exposure data with gene expression and biomarker profiles, which can be used to identify the molecular mechanisms by which pollutants affect sleep quality and reveal the combined effects of multiple contaminants.23,24 Several studies have combined network analysis with machine learning algorithms, as they offer high accuracy in predicting novel molecular targets and pathway interactions.25,26
Despite these technological advancements, the complex molecular mechanisms underlying PAH-induced sleep disturbances remain largely unknown. However, integrated computational approaches have not been fully applied to investigate these mechanisms. An integrated approach combining network toxicology analysis, machine learning, and molecular docking is a promising strategy to comprehensively elucidate these mechanisms. In this study, we aimed to screen key PAHs associated with sleep disturbances using machine learning models. We also aimed to identify critical protein targets involved in PAH-induced sleep disturbances using network toxicology. Additionally, we investigated the mechanisms by which these pollutants induce sleep disorders. Systematic molecular docking analyses were performed to validate the predicted molecular interactions. Overall, the findings of our study may pave the way for the development of targeted therapies for environment-related insomnia in clinical practice.
Materials and methods
Study population
The National Health and Nutrition Examination Survey (NHANES) is a nationally representative, continuous, multistage survey designed to assess the nutritional status and health of the noninstitutionalized population of the United States. 27 In this retrospective cross-sectional study, we used data from three survey cycles (2005–2006, 2007–2008, and 2011–2012) based on the availability of sleep-related indicators. The survey protocol was approved by the Institutional Review Board of the National Center for Health Statistics (NCHS), and written informed consent was obtained from all participants prior to data collection. NHANES was conducted in accordance with the Declaration of Helsinki (1975, as revised in 2024). The present study was a secondary analysis of deidentified, publicly available NHANES public-use data; therefore, no additional ethical approval was required from the Ethics and Human Participants Committee of Hangzhou TCM Hospital Affiliated to Zhejiang Chinese Medical University. All data were deidentified prior to analysis, and no identifiable information is presented in this manuscript. The reporting of this study conforms to the Strengthening the Reporting of Observational Studies in Epidemiology (STROBE) guidelines. 28
Data from the demographic, questionnaire, examination, and laboratory components across the three selected survey cycles were merged using the unique participant identifier (SEQN) following NHANES analytic guidance. From an initial pool of 30,255 NHANES participants, the following exclusion criteria were applied: (a) age <20 years during the survey period; (b) missing urinary PAH metabolite measurements; (c) incomplete demographic information; and (d) missing covariate data. Consequently, the final analytical sample comprised 3262 participants. The data were categorized as continuous and categorical variables. Categorical variables were expressed as proportions (%), whereas continuous variables were presented as mean ± SD. Statistical tests were employed to assess significant intergroup differences. An unpaired student’s t-test was used for normally distributed data, Kruskal–Wallis test for skewed distributions, and chi-square test for categorical variables.
Exposure assessment
Urine specimens were maintained at −20°C under refrigerated conditions to ensure biomarker stability. Analytical procedures for quantifying urinary PAH metabolites followed the standardized NHANES laboratory protocols. Gas chromatography coupled with tandem mass spectrometry (GC–MS/MS) was used to quantify nine metabolites, including 1-hydroxynaphthalene, 1-hydroxyphenanthrene, 1-hydroxypyrene, 2-hydroxyfluorene, 2-hydroxynaphthalene, 2-hydroxyphenanthrene, 3-hydroxyfluorene, 3-hydroxyphenanthrene, and 9-hydroxyfluorene. Approximately 90% of the measured metabolite concentrations exceeded the limit of detection (LOD). For values below LOD, we applied the common practice of imputing LOD/√2. To account for variability in urine dilution, all metabolite concentrations were normalized by creatinine adjustment. Particularly, the concentration (ng/L) of each PAH metabolite was divided by the corresponding creatinine level (mg/dL) and multiplied by 100 to yield standardized values expressed as nanograms of metabolites per gram of creatinine (ng/g). 29
Outcome variable
Trouble sleeping was assessed by asking participants whether they had ever informed a doctor about difficulty sleeping. Participants responded with either “yes” or “no.” If the response was affirmative, the participant was considered to have trouble sleeping. 3
Covariates
Covariates were selected a priori as potential confounders based on the literature and biological plausibility.19,30 Demographic characteristics, including sex, age, and race, were assessed using self-reported questionnaires. Body mass index (BMI) was determined by dividing the weight of participants (in kg) by their height in meters squared (kg/m2). Marital status was categorized into three groups: married, unmarried, or divorced. Education level was assessed using the question “What is the highest grade or level of school (you have/Simple person has) completed or the highest degree (you have/s/he has) received?” Responses were categorized as follows: less than 9th grade; 9–11th grade, including 12th grade with no diploma; high school graduate; General Educational Development (test) (GED) or equivalent; some college or Associate of Arts (AA) degree; and college graduate or above. Participants were also asked questions regarding their smoking history and alcohol consumption patterns, including the following questions: “Have you smoked at least 100 cigarettes in your entire life?” and “In any one year, have you had at least 12 drinks of any type of alcoholic beverage?” Responses were recorded as yes or no. The diagnosis of conditions, including diabetes, hypertension, and depression, was assessed by asking participants questions such as, “Has a doctor ever told you that you have diabetes?” and “Have you ever been told that you have high blood pressure?” Depression was assessed using the Patient Health Questionnaire-9 (PHQ-9), which provides a score, with values exceeding 4 indicating probable depression. PHQ9 included items such as “little or no interest in doing things;” “feeling down, depressed, or hopeless;” “trouble sleeping or sleeping too much;” “feeling tired or having little energy;” “poor appetite or overeating;” “feeling bad about oneself;” “trouble concentrating on things;” “moving or speaking slowly or too fast;” and having thoughts such as “I would be better off dead.” Physiological measurements were conducted at the mobile examination center, where standardized protocols were used to assess blood pressure parameters. Biochemical analyses were performed on venous blood samples to quantify plasma glucose, triglycerides, total cholesterol, and uric acid levels using automated enzymatic methods. Detailed laboratory procedures are available at https://www.cdc.gov/nchs/nhanes. Hemodynamic evaluation included calculation of mean arterial pressure using the standard formula: diastolic blood pressure + (systolic blood pressure − diastolic blood pressure)/3. Metabolic status was assessed using the triglyceride–glucose index (TyG), computed as follows: ln (fasting triglycerides (mg/dL) × fasting glucose (mg/dL)/2).
Selection of features
Feature selection is a critical step in building predictive models. The Boruta method helps determine key features by analyzing the importance scores of original features versus artificially generated “shadow features.” Specifically, the algorithm calculates importance scores (often represented as Z-scores) for each real feature using Random Forest (RF) modeling and simultaneously creating shadow features by shuffling the original data. A feature is deemed important when its importance score consistently exceeds the highest score among all shadow features over multiple iterations. 31
Performance of multiple machine learning models
After feature selection, 11 machine learning algorithms, including CatBoost, decision tree, LightGBM, logistic regression, least absolute shrinkage and selection operator (LASSO), naive Bayes, neural network, RF, gradient boosting machine (GBM), support vector machine (SVM), and XGBoost, were used for model development. All models were trained and evaluated using the same set of predictors to ensure fair comparison across algorithms. The dataset was randomly divided into a training set (70%) and an independent test set (30%) using stratified sampling to preserve the outcome distribution. Records with missing values in any of the selected variables were excluded prior to modeling (complete-case analysis); therefore, no missing data remained in the analytic dataset. Multicollinearity among predictors was assessed using correlation diagnostics (pairwise correlation matrix). The training set was used for model selection and hyperparameter tuning. Hyperparameter tuning was conducted using 10-fold cross-validation in the training set, with the area under the receiver operating characteristic curve (AUC) as the primary optimization metric. Permutation importance was used to quantify variable importance.
For the RF model, we used the ranger engine within the caret framework and applied repeated stratified 10-fold cross-validation (5 repeats) to improve robustness and mitigate overfitting. Key complexity-related hyperparameters were tuned, including the number of trees, maximum tree depth, subsampling fraction, mtry, split rule, and minimum node size. The final tuned models were refit on the full training set and evaluated on the independent test set. Model performance was comprehensively assessed using discrimination (receiver operating characteristic (ROC)/AUC with 95% confidence intervals), calibration curves, and decision curve analysis (DCA). All analyses were performed in R software (version 4.4.0).
Network toxicology
Target genes of trouble sleeping
Genes associated with trouble sleeping were identified by referring to three major databases: the National Center for Biotechnology Information (NCBI) (https://www.ncbi.nlm.nih.gov/), GeneCards (https://www.genecards.org/), and the Therapeutic Target Database (TTD) (http://db.idrblab.net/ttd/), 32 using the keyword “trouble sleeping.” The initial search yielded 57 genes from the NCBI database, 6181 from GeneCards, and 27 from TTD. After removing duplicate entries, a final set of 6195 unique genes was compiled for further analysis.
Target genes of PAHs
The key PAHs identified through machine learning were selected (1-hydroxypyrene, 2-hydroxyfluorene, 3-hydroxyfluorene, and 3-hydroxyphenanthrene), and their structural data files were downloaded from the NCBI database. Target prediction was performed using the SwissTargetPrediction database (http://www.swisstargetprediction.ch/). 32 After removing duplicates, the predicted targets were intersected with genes associated with trouble sleeping, yielding potential targets through which PAHs may contribute to sleep disturbances.
Protein–protein interaction (PPI)
To construct a PPI network, the overlapping genes were uploaded to the STRING database (http://string-db.org/cgi/input.pl) with the organism specified as Homo sapiens. The resulting interaction data were exported in tab-separated value (TSV) format. Subsequently, Cytoscape software was used to visualize and analyze the network relationships.
Gene ontology and pathway-enrichment analysis
Functional enrichment analysis was performed using the ClueGO plugin within Cytoscape to conduct Gene Ontology and Kyoto Encyclopedia of Genes and Genomes (KEGG) pathway analyses of shared targets. The analysis was restricted to human (Homo sapiens) data, and only terms demonstrating statistical significance (P-value < 0.05) were considered for subsequent analyses.
Molecular docking
We performed molecular docking simulations to validate the potential binding interactions between the key target proteins and principal PAH compounds. Three-dimensional protein structures were acquired from the Research Collaboratory for Structural Bioinformatics (RCSB) Protein Data Bank (https://www.rcsb.org/) and processed using PyMOL and AutoDock Tools 1.5.6. During preparation, structural refinement was achieved as follows: (a) eliminating co-crystallized ligands and water molecules; (b) addition of hydrogen atoms; (c) optimization of side chains; and (d) calculation of charged. The chemical structures of the major PAHs were retrieved from the NCBI database and energetically minimized using Chem3D software. Both protein and ligand structures were converted to the PDBQT format for docking compatibility. Virtual screening was conducted using AutoDock Vina, with subsequent visualization and analysis of binding conformations using Discovery Studio 2019.
Results
General characteristics
The mean age of the 3262 participants included in the study was 48.886 ± 17.642 years, and the cohort comprised 1686 males and 1576 females. Participants who reported trouble sleeping exhibited significantly higher urinary levels of PAHs than those without such issues. In addition, 729 participants were classified as having depression. The group with trouble sleeping (mean age: 51.174 ± 16.017 years) was significantly older than the group without such issues (mean age: 48.018 ± 18.026 years). Significant differences were also observed between the two groups in terms of cholesterol, family income-to-poverty ratio (FIRP), annual family income, education level, drinking status, race, uric acid levels, and total protein (Table S1).
Feature selection
The feature selection results obtained using the Boruta algorithm are presented in Figure 1. A total of 22 variables demonstrated the strongest associations with trouble sleeping, including depression, hypertension status, 2-hydroxyfluorene (ng/g creatinine), age, 1-hydroxypyrene (ng/g creatinine), 3-hydroxyfluorene (ng/g creatinine), 1-hydroxyphenanthrene (ng/g creatinine), 2-hydroxyphenanthrene (ng/g creatinine), 3-hydroxyphenanthrene (ng/g creatinine), 9-hydroxyfluorene (ng/g creatinine), TyG, race, glucose, triglycerides (mg/dL), diabetes, 2-hydroxynaphthalene (ng/g creatinine), BMI, marital status, uric acid, sex, smoking, and FIRP (Figure 2(a)). Among these, five PAH metabolites showed strong associations, as shown in Figure 2(b): 1-hydroxypyrene (ng/g creatinine), 2-hydroxyfluorene (ng/g creatinine), 2-hydroxynaphthalene (ng/g creatinine), 2-hydroxyphenanthrene (ng/g creatinine), and 3-hydroxyfluorene (ng/g creatinine).

Boruta feature selection results identifying confirmed, tentative, and rejected predictors.

Predictors selected after Boruta screening. (a) Confirmed important features and (b) ranking of relevant features by importance.
Model performance comparison
We developed 11 distinct machine learning models to predict the likelihood of sleep disturbance. Predictive performance was evaluated using ROC analysis, calibration curves, and DCA in both the training and test datasets (Figure 3). In the training set (Figure 3(a)), the RF model showed the highest discrimination (AUC = 0.999), followed by CatBoost (AUC = 0.940), SVM (AUC = 0.937), LightGBM (AUC =0.894), XGBoost (AUC = 0.752), GBM (AUC = 0.728), LASSO (AUC = 0.722), naive Bayes (AUC = 0.695), logistic regression (AUC = 0.647), neural network (AUC =0.646), and decision tree (AUC = 0.643). Calibration and DCA curves for the training set are shown in Figure 3(b) and (c).

Predictive performance of 11 machine learning models. (a) ROC curves in the training set; (b) calibration curves in the training set; (c) decision curve analysis (DCA) in the training set; (d) ROC curves in the test set; (e) calibration curves in the test set; and (f) DCA in the test set. ROC: receiver operating characteristic.
In the test set (Figure 3(d)), XGBoost achieved the highest discrimination (AUC = 0.752), followed by LASSO (AUC = 0.721), CatBoost (AUC = 0.719), GBM (AUC = 0.709), RF (AUC = 0.708), LightGBM (AUC = 0.692), naive Bayes (AUC = 0.686), SVM (AUC = 0.682), decision tree (AUC = 0.644), logistic regression (AUC = 0.634), and neural network (AUC = 0.617). Calibration and DCA results in the test set (Figure 3(e) and (f)) were used to assess overall clinical utility beyond discrimination. Although XGBoost had the highest test-set AUC, we performed SHapley Additive exPlanations (SHAP) interpretation primarily on RF and CatBoost because these models provided more stable and clinically interpretable explanations and showed a more balanced overall performance when calibration and DCA were jointly considered.
Variable importance
We employed SHAP to identify critical influencing factors at the dataset level and determine the importance of each variable. To improve interpretability, SHAP was used to quantify how each feature contributed to the predicted probability of trouble sleeping at both the population level (global importance) and the individual level (local explanations). Based on SHAP feature importance bar plots generated from both the RF and CatBoost models, we could intuitively identify which variables played significant roles. The SHAP beeswarm plots illustrate the relative importance of each variable and their positive or negative impacts on the predictive outcomes of the RF and CatBoost models. In these plots, positive SHAP values indicate features pushing predictions toward a higher likelihood of trouble sleeping, whereas negative SHAP values indicate features pushing predictions toward a lower likelihood.
Among the 15 key factors shown in Figure 4(a), FIRP had the most significant effect on outcomes, with lower SHAP values contributing to the alleviation of sleep disorders. Notably, the distribution of SHAP values for FIRP suggests a consistent direction of effect at the model level, with lower FIRP values tending to reduce the predicted risk of trouble sleeping. In the RF model, the top-ranking PAH metabolites by SHAP importance included 2-hydroxyfluorene, 9-hydroxyfluorene, 3-hydroxyphenanthrene, 1-hydroxypyrene, 3-hydroxyfluorene, and 1-hydroxyphenanthrene (Figure 4(b)). Although model-specific rankings differed, the PAH-related signal was stable across models, supporting the robustness of the PAH predictors identified by SHAP.
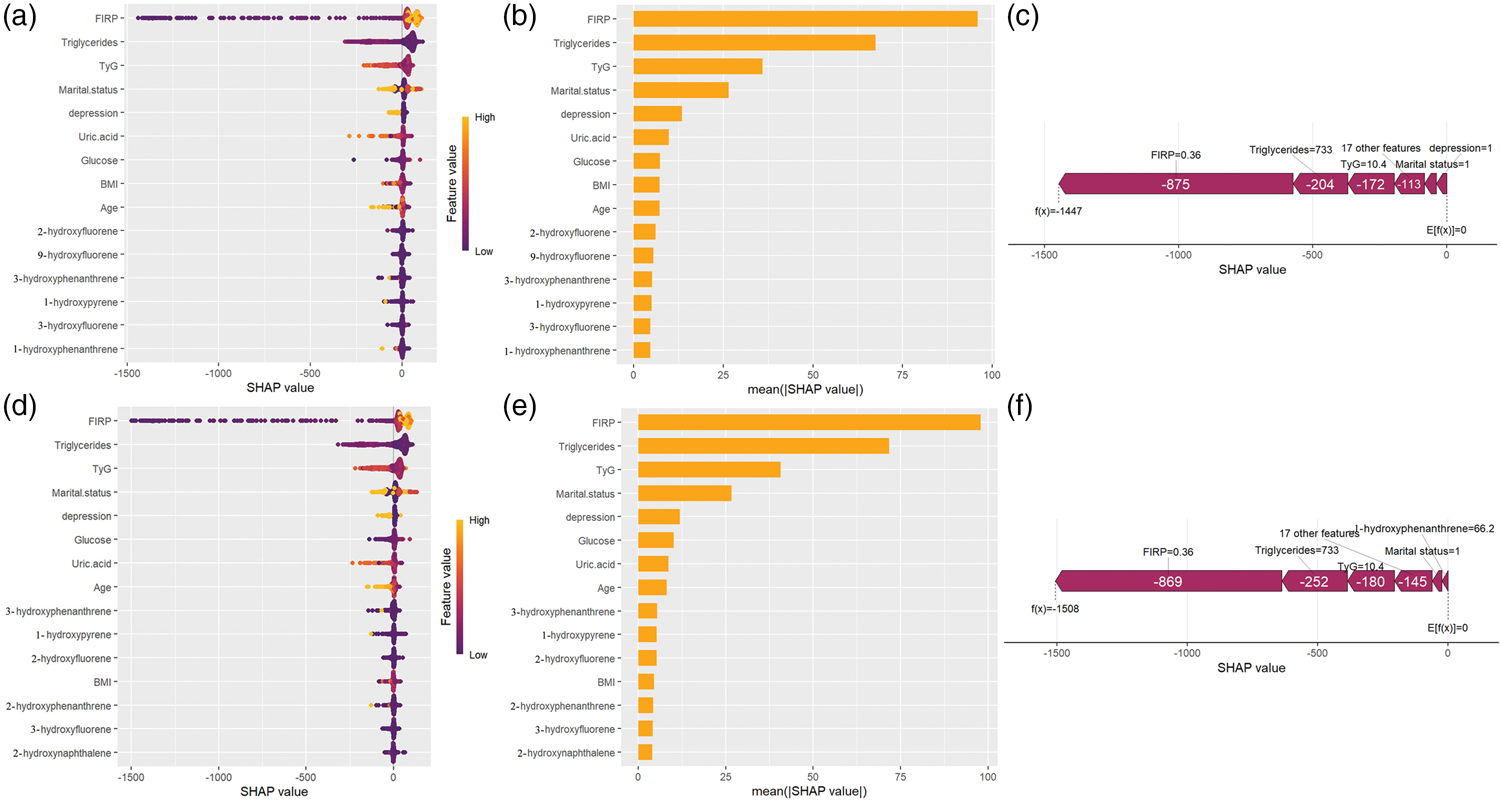
SHAP analyses and feature importance of the RF and CatBoost models. (a) SHAP analyses of the RF model; (b) feature importance based on the RF model; (c) SHAP value analysis of single-sample full features in the RF model; (d) SHAP analyses of the CatBoost model; (e) feature importance based on the CatBoost model; and (f) SHAP value analysis of single-sample full features in the CatBoost model. SHAP: SHapley Additive exPlanations; RF: Random Forest.
Figure 4(c) presents a SHAP analysis conducted on a randomly selected participant to identify instance-level influencing factors and reveal individual heterogeneity. E(f(x)) represents the expected predicted value for all samples. Purple sections indicate features that negatively affected the predicted values for trouble sleeping. Figure 4(c) demonstrates that the predicted value for this sample, f(x), was −1447, which was significantly lower than E(f(x)), suggesting that the individual experienced less trouble sleeping compared to the average. According to the SHAP interpretation, the primary factors contributing to this lower prediction were variables such as FIRP, TyG, triglycerides, and marital status. This example illustrates that multiple factors jointly shift individual predictions, highlighting heterogeneity in how metabolic and demographic variables combine with PAH-related predictors at the individual level.
The CatBoost algorithm identified FIRP as having the most substantial impact on outcomes, with lower SHAP values of FIRP contributing to the mitigation of sleep disorders (Figure 4(d)). The SHAP values for each feature in the CatBoost model are shown in Figure 4(e), and the top-ranking PAH metabolites by SHAP importance included 3-hydroxyphenanthrene, 1-hydroxypyrene, 2-hydroxyfluorene, 2-hydroxyphenanthrene, 3-hydroxyfluorene, and 2-hydroxynaphthalene (Figure 4(e)). The predicted value f(x) was −1508, as presented in Figure 4(f), which was lower than E(f(x)), indicating that the individual experienced less trouble sleeping compared to the overall population. This prediction was primarily influenced by variables such as FIRP, TyG, triglycerides, and marital status.
The intersection of the significant features derived from both the CatBoost and RF algorithms is illustrated in Figure 5, which reveals 13 common factors: FIRP, triglycerides, TyG, marital status, depression, glucose, uric acid, age, 3-hydroxyphenanthrene, 1-hydroxypyrene, 2-hydroxyfluorene, BMI, and 3-hydroxyfluorene. Notably, four PAH metabolites were consistently identified as major predictors across both models: 2-hydroxyfluorene, 3-hydroxyfluorene, 1-hydroxypyrene, and 3-hydroxyphenanthrene. The relationship between SHAP values and feature levels is depicted in Figure 5(a), where all feature values exhibit fluctuating trends. The interaction effects between different features are presented in Figure 5(b). Taken together, the SHAP dependence and interaction plots suggest that PAH-related predictors may act in concert with metabolic factors (e.g. TyG and triglycerides), supporting a multifactorial risk profile rather than a single-driver effect.

SHAP dependence and interaction analyses of key features. (a) SHAP dependence trends of hub features and (b) feature interaction effects. SHAP: SHapley Additive exPlanations.
The potential targets for PAH-induced trouble sleeping and PPI network
A total of 223 potential targets of PAHs were identified using the SwissTargetPrediction database, whereas 6195 targets associated with sleep disorders were retrieved from NCBI, GeneCards, and TTD. To improve disease relevance, GeneCards-derived targets were filtered using a relevance score >0.5. Through cross-referencing, 76 overlapping targets linking PAHs to sleep disturbances were identified (Figure 6(b)). Using the STRING database, a preliminary PPI network was constructed with the 76 candidate genes (minimum required interaction score set; see Supplementary Methods Table S1). The resulting network (Figure 6) consisted of 75 nodes and 1449 edges, exhibiting an average node degree of 38.6 and a local clustering coefficient of 0.777. In this visualization, node size corresponds to the degree value (larger nodes indicate higher degrees), whereas edge thickness reflects the combination score (thicker edges represent stronger interactions). Nodes denote proteins, and edges represent their interactions. Key proteins with high degree values were identified as central players in the network. The top ten proteins, ranked by degree, were AKT1, nuclear receptor subfamily 3 group C member 1 (NR3C1), ESR1, CASP3, GSK3B, apoptosis regulator Bcl-2 (BCL2), MAOA, MMP9, androgen receptor (AR), and MAOB (Figure 7).

Overlap analyses. (a) Venn diagram of common important features identified by RF and CatBoost and (b) venn diagram of overlapping targets between PAH-related targets and trouble sleeping–related targets. RF: Random Forest; PAH: polycyclic aromatic hydrocarbon.

Protein–protein interaction (PPI) network of the overlapping targets.
Enrichment analysis of potential targets of PAH-induced trouble sleeping
Gene Ontology enrichment analysis identified 2013 functional terms, categorized into 1877 biological processes, 24 cellular components, and 112 molecular functions (Figure 8(a) to (c)). Biological process analysis revealed that PAH-induced sleep disturbances were primarily associated with factors including neurotransmitter level regulation, monoamine transport, response to alkaloids, amyloid-beta response, and organic hydroxyl compound transport. Cellular component analysis indicated enrichment of presynaptic membrane components, membrane rafts, membrane microdomains, and synaptic membrane integral components. Molecular function analysis highlighted the key roles of catecholamine binding, monooxygenase activity, nitric oxide synthase activity, and G protein-coupled amine receptor activity. These diverse biological functions help explain how a single exposure can influence multiple pathways and provide a foundation for identifying active compounds and signaling pathways.

Functional enrichment analyses of overlapping targets. (a) Biological process (BP); (b) cellular component (CC); (c) molecular function (MF); and (d) KEGG pathway enrichment. KEGG: Kyoto Encyclopedia of Genes and Genomes.
KEGG pathway analysis identified 132 relevant pathways, with the most significant pathways (based on P-values) displayed in Figure 8(d). Key pathways included neuroactive ligand–receptor interactions, dopaminergic synapses, tyrosine metabolism, and serotonergic synapses, suggesting their critical involvement in PAH-related trouble sleeping.
Molecular docking
To verify the network toxicology predictions and elucidate the mechanistic basis of PAH-induced sleep disturbances, molecular docking simulations were conducted between 1-hydroxypyrene, 2-hydroxyfluorene, 3-hydroxyfluorene, and 3-hydroxyphenanthrene and the key targets AR, BCL2, NR3C1, and transient receptor potential cation channel subfamily V member 1 (TRPV1). Binding affinity, quantified by binding energy, served as a key parameter for assessing molecular interactions, with lower values indicating more stable ligand–receptor complexes.
Using a threshold of ≤−5.0 kcal/mol for significant binding, 33 PAH-target pairs exhibited favorable binding energies (Table S3), confirming strong interactions between the PAHs and hub targets. These findings support the reliability of the predictive model. The docked conformations are illustrated in Figure 9, and the detailed binding sites and interaction patterns are presented in Figures 10 and 11. The docking search space (grid box center coordinates and dimensions) for each target is provided in Table S4. The analysis revealed that hydrogen bonds, van der Waals forces, and Pi–alkyl interactions were the primary contributors to these molecular associations.

Representative docking conformations of key PAH metabolites with hub targets. PAH: polycyclic aromatic hydrocarbon.

Predicted binding sites of key PAH metabolites with hub targets. PAH: polycyclic aromatic hydrocarbon.

Predicted ligand–target interaction patterns (2 D interaction diagrams) for key PAH metabolites and hub targets. 2D: two-dimensional; PAH: polycyclic aromatic hydrocarbon.
Discussion
In this investigation, we applied the Boruta algorithm for robust feature selection of variables associated with sleep disturbance and used interpretable machine learning approaches to characterize the associations between urinary PAH metabolites and sleep-related complaints. Our comprehensive analytical framework addressed dataset complexity through advanced ensemble methods. RF model demonstrated high apparent discrimination in the training set, whereas test-set performance was moderate (testing AUC = 0.708). In comparison, the CatBoost algorithm yielded competitive results (training AUC = 0.940; testing AUC = 0.719). To enhance model interpretability, we incorporated SHAP value analysis, which helped prioritize key PAH-related predictors for hypothesis generation. This dual analytical approach not only improved model transparency but also established valuable directions for future mechanistic studies. Overall, our findings are broadly consistent with the emerging literature linking PAH exposure to adverse sleep-related outcomes and extend prior work by integrating predictive modeling with network-based mechanistic exploration. By combining machine learning and network toxicology, this study further advances the existing literature by prioritizing key urinary hydroxylated PAH metabolites associated with trouble sleeping and generating testable mechanistic hypotheses.
As a sophisticated artificial intelligence discipline, machine learning employs advanced computational algorithms to discern and classify complex patterns within heterogeneous datasets, thereby enhancing predictive decision-making capabilities. Despite demonstrating significant analytical power, the inherent opacity of machine learning decision-making processes and interpretability challenges pose substantial barriers to clinical implementation. 34 In this study, we used existing NHANES data by integrating demographic, biochemical, and questionnaire information into predictive models without additional data collection. 35 We trained and validated multiple machine learning algorithms, focusing on individual urinary PAH metabolite concentrations, and followed a tiered analytical approach consistent with NHANES protocols to screen for sleep disturbances. We compared 11 machine learning algorithms incorporating 22 predictive variables and applied SHAP value analysis to the RF and CatBoost models to describe how individual predictors contributed to the model outputs, providing a more interpretable summary of the observed associations.
Across the RF and CatBoost models, SHAP consistently identified 1-hydroxypyrene, 2-hydroxyfluorene, 3-hydroxyfluorene, and 3-hydroxyphenanthrene as the most stable PAH-related predictors associated with trouble sleeping. Using network toxicology approaches, we investigated potential biological pathways and molecular targets, including AR, BCL2, NR3C1, and TRPV1, that may plausibly link PAH exposure to sleep-related disturbances, providing exploratory evidence for possible mechanisms to guide future study. Notably, TRPV1, a nonselective cation channel belonging to the vanilloid transient receptor potential (TRP) family, is extensively expressed in the hypothalamic and brainstem regions that regulate fundamental physiological processes. Originally characterized as the receptor for capsaicin (the active component in chili pepper), TRPV1 demonstrates high calcium permeability and plays a crucial role in various neurophysiological functions. 36 Electrophysiological investigations have revealed that TRPV1 channels regulate synaptic transmission through two distinct mechanisms: facilitating excitatory neurotransmitter release in hypothalamic circuits and modulating the frequency of both excitatory and inhibitory postsynaptic currents in the brainstem regions. Furthermore, these studies have identified TRPV1-mediated regulation of preautonomic neuronal activity within key brain areas involved in homeostatic control. 37 Functioning as a ligand-gated, nonselective cation channel, TRPV1 is widely distributed throughout the neuroimmune axis and exerts diverse physiological effects by modulating both neuronal and nonneuronal cellular activity. Emerging evidence indicates that functional TRPV1 is expressed in glial populations, particularly microglia and astrocytes, which contribute ti immune responses by releasing inflammatory mediators involving TRPV1. Chronic inflammatory states establish a self-perpetuating cycle of neuroinflammation, potentially aggravating neurological pathologies. 38 Notably, inflammatory markers are frequently elevated in populations with sleep disorders and correlate with sleep quality metrics. 39 Accumulating evidence suggests that sleep disturbances may exacerbate inflammation-related pathologies. 40
As a member of the nuclear receptor superfamily, which includes estrogen, glucocorticoid, and thyroid hormone receptors, AR undergoes structural reorganization upon binding to androgens, such as testosterone and dihydrotestosterone (DHT), thereby altering its interactions with cellular components. This nuclear translocation enables AR to modulate gene networks that control proliferation, differentiation, and metabolic processes. Notably, hypothalamic regions exhibit higher AR mRNA expression than the cortical and hippocampal areas. 41 Androgen–AR signaling influences hypothalamic–pituitary–adrenal (HPA) axis regulation, and overactivation may cause cortisol dysregulation and circadian disruption. This pathway potentially modulates sleep architecture through gamma-aminobutyric acid (GABA)/glutamate neuronal circuits, with both deficient (aging/hypogonadism) and excessive (polycystic ovary syndrome (PCOS)) androgen activity correlating with sleep abnormalities, manifesting as rapid eye movement (REM) reduction and insomnia, respectively. These clinical observations are consistent with a possible bidirectional relationship between AR signaling and sleep disorders, although the precise mechanisms require further investigation.
NR3C1 (glucocorticoid receptor (GR)) was also identified as a hub target in the PPI network, underscoring its central role in HPA-axis regulation. HPA-axis activity and circadian cortisol dynamics are closely linked to sleep–wake regulation, and chronic insomnia has been associated with sustained activation of this stress system.42,43 Given that endocrine-disrupting chemicals can interfere with GR signaling, we hypothesize that key hydroxylated PAH metabolites may perturb GR-mediated feedback and downstream transcriptional programs, thereby promoting a hyperarousal state and increasing susceptibility to sleep complaints. This hypothesis warrants further validation in longitudinal and experimental settings. 44
Enrichment analysis revealed significant associations between trouble sleeping and several pathways, including neuroactive ligand–receptor interactions, dopaminergic synapses, tyrosine metabolism, serotonergic synapses, and cholinergic synapses. The neuroactive ligand–receptor interaction pathway include more than 300 genes encoding neuroreceptors and their ligands, which collectively regulate various neurobiological processes through molecular signaling mechanisms. 45 Neuronal activity is significantly modulated by ligand–receptor binding interactions. 46 Midbrain dopaminergic pathways projecting to the striatum play pivotal roles in multiple brain functions, 47 and dopaminergic synaptic signaling is critically involved in neurotransmitter coordination, memory consolidation, and synaptic plasticity. 48 Cholinergic neurotransmission has been implicated in the regulation of REM sleep and wakefulness. 49 Weiss et al. 50 demonstrated that the thermogenetic activation of cholinergic neurons in Drosophila almost completely suppresses sleep, followed by compensatory rebound sleep, suggesting their role in sleep homeostasis maintenance. Studies in both Drosophila and rodents indicate that cholinergic neuronal activity increases with prolonged wakefulness. Elevated cholinergic activity may have driven the observed increase in Bruchpilot (BRP) levels following sleep deprivation. Given the role of acetylcholine (ACh) as the primary excitatory neurotransmitter in the central brain of Drosophila, these findings are consistent with reports of increased cortical excitability in sleep-deprived humans and rodents. Tyrosine metabolism is a crucial biological process that is frequently dysregulated in various chronic diseases. 51 As a central component of nitrogen metabolism, tyrosine exhibits both glucogenic and ketogenic properties and plays a key role in catabolic processes. Its metabolic network interconnects energy, lipid, and carbohydrate metabolism through multiple intermediates, thereby offering new perspectives for studying metabolic reprogramming. Abnormalities in tyrosine metabolism may influence cell-cycle regulation, with metabolic disturbances serving as biomarkers for various pathological conditions. PAHs may interact with or perturb these pathways, providing a plausible but as yet unconfirmed link to altered sleep regulation.
Although this study offers valuable insights, it has several methodological limitations. First, the observational and cross-sectional nature of NHANES precludes establishing temporal ordering and definitive causal inference. Consequently, our findings should be interpreted as associations and hypothesis-generating evidence rather than causality. Second, sleep disturbance was assessed using a single self-reported NHANES item, which may introduce misclassification and lacks clinical detail (e.g. severity, duration, or objective sleep measures). In addition, depressive symptoms were measured using the PHQ-9, which includes a sleep-related item. Therefore, some construct overlap between depression symptom reporting and sleep complaints is possible and should be considered when interpreting the results. Third, although SHAP analysis enhanced interpretability by quantifying feature contributions, it may not fully capture complex, higher-order interactions, and the mechanistic implications remain exploratory. Finally, despite adjustment for multiple demographic, clinical, and lifestyle covariates, residual confounding due to unmeasured or imperfectly measured factors cannot be excluded. Future studies using prospective or longitudinal designs are warranted to confirm these associations and elucidate underlying mechanisms.
Conclusion
This retrospective cross-sectional NHANES analysis suggests that several urinary hydroxylated PAH metabolites, including 1-hydroxypyrene, 2-hydroxyfluorene, 3-hydroxyfluorene, and 3-hydroxyphenanthrene, may be associated with self-reported trouble sleeping in adults. By integrating machine learning, network toxicology, and molecular docking, we generated testable mechanistic hypotheses. This approach highlighted AR, BCL2, NR3C1, and TRPV1 as candidate targets. These findings are hypothesis-generating and should be validated in longitudinal studies and experimental models.
Supplemental Material
sj-pdf-1-imr-10.1177_03000605261429208 - Supplemental material for Association between urinary polycyclic aromatic hydrocarbon metabolites and sleep disturbances: A cross-sectional study integrating machine learning and network toxicology
Supplemental material, sj-pdf-1-imr-10.1177_03000605261429208 for Association between urinary polycyclic aromatic hydrocarbon metabolites and sleep disturbances: A cross-sectional study integrating machine learning and network toxicology by Yiren Bao, Bo Liang, Yankai Dong and Rui Wang in Journal of International Medical Research
Footnotes
Acknowledgments
The authors appreciate Yuhai Shou (University of Pennsylvania) for his expert assistance in preparing this manuscript.
Author contributions
Yiren Bao: Writing - original draft, Writing - review and editing, Visualization, Methodology, Data curation. Bo Liang: Writing - original draft, Writing - review and editing, Data curation. Yankai Dong: Writing - original draft, Validation, Methodology, Data curation, Conceptualization. Rui Wang: Writing - review and editing, Methodology, Conceptualization.
Declaration of competing interest
The authors declare no competing interests.
Data availability
Data will be made available on request.
Funding
This research did not receive any specific grant from funding agencies in the public, commercial, or not-for-profit sectors.
Supplemental material
Supplemental material for this article is available online.
References
Supplementary Material
Please find the following supplemental material available below.
For Open Access articles published under a Creative Commons License, all supplemental material carries the same license as the article it is associated with.
For non-Open Access articles published, all supplemental material carries a non-exclusive license, and permission requests for re-use of supplemental material or any part of supplemental material shall be sent directly to the copyright owner as specified in the copyright notice associated with the article.