
Abstract
Background:
The development of multidrug resistant strains of extended-spectrum β-lactamase-producing Escherichia coli has become a global problem; therefore, the discovery of new antibacterial agents is the only available solution.
Objective:
To improve and propose new compounds with antibacterial activity, the three-dimensional quantitative structure–activity relationship and molecular docking studies were carried out on Aztreonam analogs as E. coli inhibitors in DNA gyrase B
Method:
This study’s 3D-Quantitative structure–activity relationship model was created using on the Comparative Molecular Field Analysis and the Comparative Molecular Similarity Indices Analysis. Using the Comparative Molecular Field Analysis (Q2 = 0.73; R2 = 0.82), excellent predictability was achieved, and the best Comparative Molecular Similarity Indices Analysis model (Q2 = 0.88; R2 = 0.9). The generated model’s ability to predict outcomes was assessed through external validation using a test set compound and an applicability domain technique. In this study, the steric, electrostatic, and hydrogen bond acceptor fields played a key role in antibacterial activity.
Results:
The results of the molecular docking revealed that the newly generated compound A6 has the highest binding affinity with DNA gyrase B. It forms 10 hydrogen bonds with amino acid residues of Asn104, Asn274, Asn132, Ser70, Ser237, Thr105, Glu273, and 2 salt bridges with amino acid residues of Ser70 and Glu273 and one pi–pi interacting with Gys271 amino acid residue in the binding site of 5G1, and this result was validated by a new assessment method. We created some novel, highly effective DNA gyrase B inhibitors based on the earlier findings, and the most accurate model predicted their inhibitory actions. The ADMET characteristics and pharmacological similarity of these novel inhibitors were also examined.
Conclusion:
These findings would be very beneficial in guiding the optimization process for the identification of novel drugs that can address the issue of multiple drug resistance.
Introduction
In the medical field, treating bacterial infections is becoming the most difficult endeavor. Gram-negative bacteria, specifically Escherichia coli, pose a serious risk to global public health because of their high level of antibiotic resistance.1,2 In the past 20 years, there has been a 10-fold increase in the global community’s prevalence of bacteria that produce extended-spectrum β-lactamases (ESBL) E. coli among healthy individuals: from 2.6% in 2001–2005 to 26.4% in 2016–2020. 3 Due to their ability to increase patient risk of morbidity and death in the intensive care unit (ICU), these bacteria are of great clinical concern in hospitals.4,5
The bacterial enzyme DNA gyrase B is not present in humans, making it a viable target for treating diseases associated with E. coli.6,7 GyrA and GyrB are the two heterodimeric subunits that makeup gyrase. According to Bush et al., 8 the inhibitor molecules cause oxidative damage, bind the gyrase DNA complex, and stop DNA replication from causing cell death.
Β-lactam antibiotics are among the most popular drug classes; they are usually safe and efficient, but their effectiveness against Gram-negative organisms has decreased due to resistance developed by bacterial enzymes that produce β-lactamase. 9 The first drug of the novel class of β-lactam antibiotics known as monobactams is Aztreonam. According to Brogden and Heel, 10 it does not affect Gram-positive bacteria and is selectively active against aerobic Gram-negative bacteria.
Aztreonam analogs have independently shown antibacterial action. Numerous compounds with Aztreonam scaffolds have been tested for antibacterial activity and shown to be effective. According to F. Reck et al., 9 Aztreonam scaffolds within the same structure may even increase the activity that each of them individually demonstrated.
Technological advancements in drug design require advanced experimental and computational techniques. These days, the approaches or procedures used in drug design are crucial for predicting biological profiles, finding hits, producing leads, and expediting the process of turning leads into viable therapeutic candidates. When designing medications and agrochemicals, docking techniques and quantitative structure–activity relationship (QSAR) have proven to be useful prediction tools. To create a trustworthy statistical model for forecasting novel chemical substances’ activity, QSAR methods have been used in research spanning decades to develop the relationship between the properties of chemical substances and their biological activities.11,12 The collected experimental values must come from trustworthy experiments, as the developed model is dependent upon the biological activity profile of the substances utilized in the model-building process. Therefore, in this investigation, 45 variants of Aztreonam were employed to construct the QSAR model (27), which was produced through the use of field-based Comparative Molecular Field Analysis (CoMFA) and Comparative Molecular Similarity Indices Analysis (CoMSIA). In the present research, modern approaches for drug discovery have been utilized, including 3D-QSAR, molecular docking as well as ADMET research of Aztreonam analogs as E. coli inhibitors, and the overall workflow for this study is shown in Figure 1.
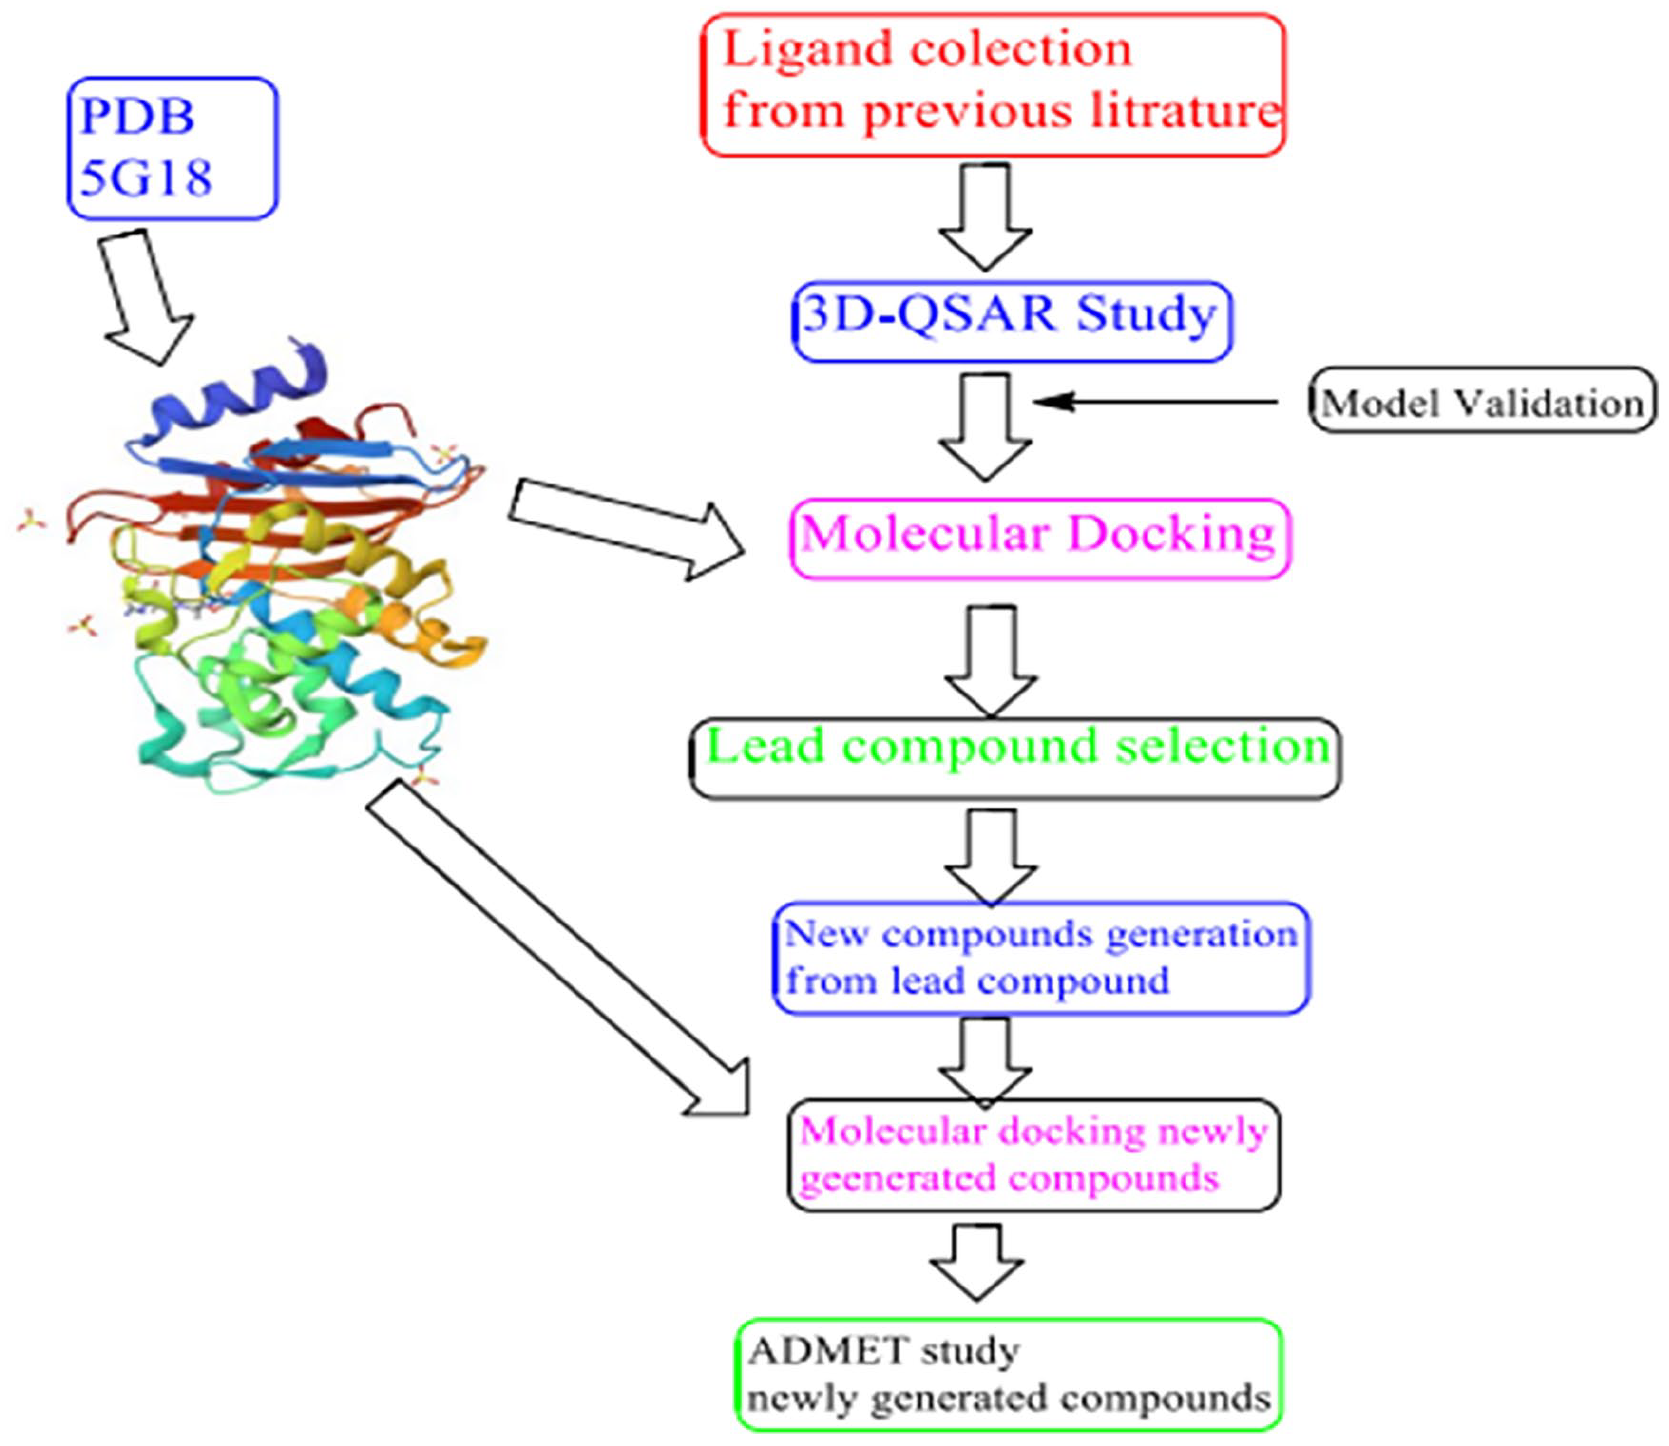
Overall work flow 3D-QSAR, molecular docking, and ADMETstudies of aztreonam analogues as E. colis inhibitors.
Materials and methods
Experimental dataset and structure contraction
For 3D-QSAR, ADMT, and molecular model purposes, 45 data sets of Aztreonam derivatives (Figure 2) were used, and they have been shown to have strong and specific inhibitory activity against the Gram-negative bacterium E. coli were gathered from published research. 9 The previous value of the minimum inhibitory concentration (MIC) activity was expressed in µg/ml. The data on antibacterial activity were expressed as MIC against E. coli. MIC was transformed to pMIC by taking log (1/MIC) by using ChemMaster software (https://crescentsilico.wordpress.com/chemmaster/), and in all later models created, the pMIC values served as the dependent variable. Table 1 displays the pMIC values.

Aztreonam analogues.
Aztreonam analogues studied and their observed and predicted antibacterial activity.

*= test set.
Molecular alignment and minimization
Compound molecular alignment is a crucial stage in building 3D-QSAR models, 15 and it was conducted by Using Maestro Schrodinger software. The ligand-based alignment technique used in this study involves isolating a template molecule first, and then all data set molecules were minimized by using the standardized Tripos force field. Lastly superimposing all data set molecules on selected template compound as shown in Figure 3.

Superposition and alignment of the 45 studied compounds using AZT2 as a template.
3D-QSAR model
Field-based studies utilizing the 3D-QSAR (CoMFA and CoMSIA) model were carried out utilizing Maestro Schrodinger software version (v12.8; Schrodinger 2023, New York, NY, USA).16,17 The compound activities and descriptors were imported into the Maestro spreadsheet to create the field-based 3D-QSAR model using the Maestro software. The software arbitrarily divided the dataset into two sets, by designating 70% of the data sets (32 compounds) as the training sets for developing the models and 30% of the data sets (13 compounds) as the test sets for evaluating the effectiveness of the developed models.18,19
Field-based CoMSIA 3D-QSAR model, utilizing a Gaussian function, the similarity indices were calculated. The hydrophobic, steric, electrostatic, H-bond donor, and H-bond acceptor fields were among the similarity index descriptors. Steric and electrostatic fields were incorporated into the CoMFA technique.14,18
3D-QSAR model validation and model analysis (PLS)
The partial least squares (PLS) method was used to create the 3D-QSAR model. PLS assesses a straight-line association between biological activity values and the CoMFA and CoMSIA descriptors by utilizing the maximum of N/5 PLS factor with three outliers (N = number of ligands in the training set). In PLS analysis which took as its most ideal model was distinguished by the high correlation coefficient (R2), high cross-validated Q2, lower SD, and lower RMSE value. To ensure the robustness of the QSAR model, a four-component model with good statistics was chosen to forecast the activity of test set molecules. 18
In silico ADMET and drug-likeness prediction
The physicochemical, pharmacokinetic, toxicity, and drug-likeness profiles of the compounds were estimated using ADMETlab 2.0 (absorption, distribution, metabolism, excretion, and toxicity) 20 and Swiss ADME http://www.swissadme.ch/index.php online software tools. The chemical structure of the compounds was submitted in the form of a canonical simplified molecular input line entry system (SMILE) to Swiss ADMELab2.0 software to predict the physicochemical, ADMET, and drug-likeness profile of the compounds, synthetic associability, and drug-likeness prediction like Lipinski.
Molecular docking
Through the use of a technique called molecular docking, one can determine the low-energy binding affinity of a molecule (ligand) in the receptor’s active site (protein). Essentially, the algorithms that perform molecular docking start by placing a tiny ligand at a specific binding site of the target protein. This ligand can provide several conformations. To quantify the binding energy and ultimately determine the optimal mode of binding, how the ligand and the protein are also evaluated using scoring functions. 21
The glide docking module of Schrödinger suite 2023 version 1 (Schrödinger Inc., New York, NY, USA) was used for the molecular docking investigation of the drugs in this work. For the stages involved in protein and ligand preparation, the latter was carried out.
Protein preparation
The protein with antimicrobial properties was obtained from the Protein Data Bank (http://www.rcsb.org), (PDB: 5G18). 22 The E. coli gyrase B (GyrB) crystal structure bound with a natural product antibiotic (PDB: 5G18) was used as a template for the docking.23,24 After that, using the Maestro Schrödinger suite 2021 version 1, the protein was prepared using the protein preparation wizard. The protein was prepared by filling missing residues in the area around the binding site of protein (5G18), by assigning bond orders, establishing disulfide bonds, including any of the missing hydrogen atoms, and eliminating water molecules larger than 5 Å, and protein was minimized the by using OPLS3e force field.
Ligand preparation
The ligand compounds were prepared using the ligprep wizard in Maestro Schrödinger suites. 3D structures of active compounds for docking study were constructed using the sketch option in Maestro Schrodinger option in Maestro. Furthermore, energy minimization of the ligands was carried out, and minimizing macromolecular structures was used by the OPLS3e force field.
Preparation of grid generation and docking poses
To prepare and select the binding site for the docking, Glide was applied to generate a grid by selecting atoms of the bound ligand, aztreonam (AZR) in a 20 Å. The ligands’ protonation states were computed using a pH of 7.4 ± 1.0 as the basis, and they were subsequently docked following Glide extra precision (XP).25,26 The top dock score poses of the compounds were further analyzed and visually inspected using PyMOL version 2.5 ( Schrodinger,Inc., New York, NY, USA) to examine their detailed binding interaction.27,28
Results
Molecular alignment
Molecular structural alignment is crucial in determining the predictive capacity of built CoMSIA and CoMFA models. The result of molecular alignment of all the dataset compounds was conducted using Maestro Schrodinger software and presented in Figure 3. Compound AZT2 (most active) was used as a template molecule, and all the dataset compounds were superimposed on it.
CoMSIA and CoMFA models
Results of the CoMSIA and CoMFA models observed (pMIC50) and predicted activity of aztreonam analogs are presented in Table 1. The PLS statistical results of built models are also available in Table 2. According to Table 2, the PLS result displays that the CoMSIA and CoMFA models exhibit high R2 values of 0.90 and 0.82, respectively, and F values of 90.1 and 84.3, respectively, small standard error SD values of 0.029 and 0.454, respectively, and the minor values of RMSE values of 0.27 and 0.32, respectively.
The PLS statistical results of CoMFA and CoMSIA models in different molecular field combinations.

SD: standard deviation of the regression; R2: value of R2 for the regression; R2 CV: cross-validated R2 value, computed from predictions obtained by a leave-N-out approach. The value of N is specified in the Build Field-Based Model Dialog Box.; R2 scramble: average value of R2 from a series of models built using scrambled activities. Measures the degree to which the molecular fields can fit meaningless data, and should be low. Stability: stability of the model predictions to changes in the training set composition. This statistic has a maximum value of 1 (meaning stable); F: variance ratio. Large values of F indicate a more statistically significant regression; P: Significance level of variance ratio. Smaller values indicate a greater degree of confidence; RMSE: root-mean-square error of the test set; Q2: value of Q2 for the predicted activities of the test set; Pearson-r: value of Pearson-r for the predicted activities of the test set.
The results of the external validation assessment conducted on the CoMSIA and CoMFA models are presented in Table 2. Externally validated methods, Leave-One-Out correlation coefficient (Q2 LOO) value (0.8859 and 0.72, respectively) for training tests, and Pearson-r values (0.64 and 0.63, respectively) for test set were used. Furthermore, a 58:42 ratio between the steric and electrostatic contributions was discovered, suggesting that steric interactions hold a significantly greater significance than electrostatic ones.
3D-QSAR contour map analysis
For the result of the CoMSIA/CoMFA contour map, we selected the most active compound, AZT2, as a reference for insight into different fields of the compound. The CoMSIA steric area, electrostatic, hydrophobic, hydrogen bond acceptor, and hydrogen bond donor contour maps as shown in Figure 4(a)–(e) respectively. The CoMFA steric and electrostatic contribution contour maps are illustrated in Figure 5(a) and (b).

CoMSIA contour maps analysis of AZT2 with 2 Å grid spacing (a) steric, green color indicates positive and yellow indicates negative contribution (b) electrostatic, blue color indicates positive and red color indicates negative contribution, (c) hydrophobic fields, yellow color indicates positive and white color indicates negative contribution, (d) hydrogen bond acceptor, red color indicates positive and magenta indicates negative contribution and (e) H-bond donor fields, purple color indicates positive and cyan color indicates negative contribution.

CoMFA contour maps analysis of AZT2 with 2 Å grid spacing (a) steric, green color indicates positive and yellow indicates negative contribution; and (b) electrostatic, blue color indicates positive and red color indicates negative contribution.
Moreover, a PLS analysis plot showing the correlation between predicted and experimental activities for training and test sets was obtained for both CoMSIA and CoMFA models, and it is available in Figure 6.
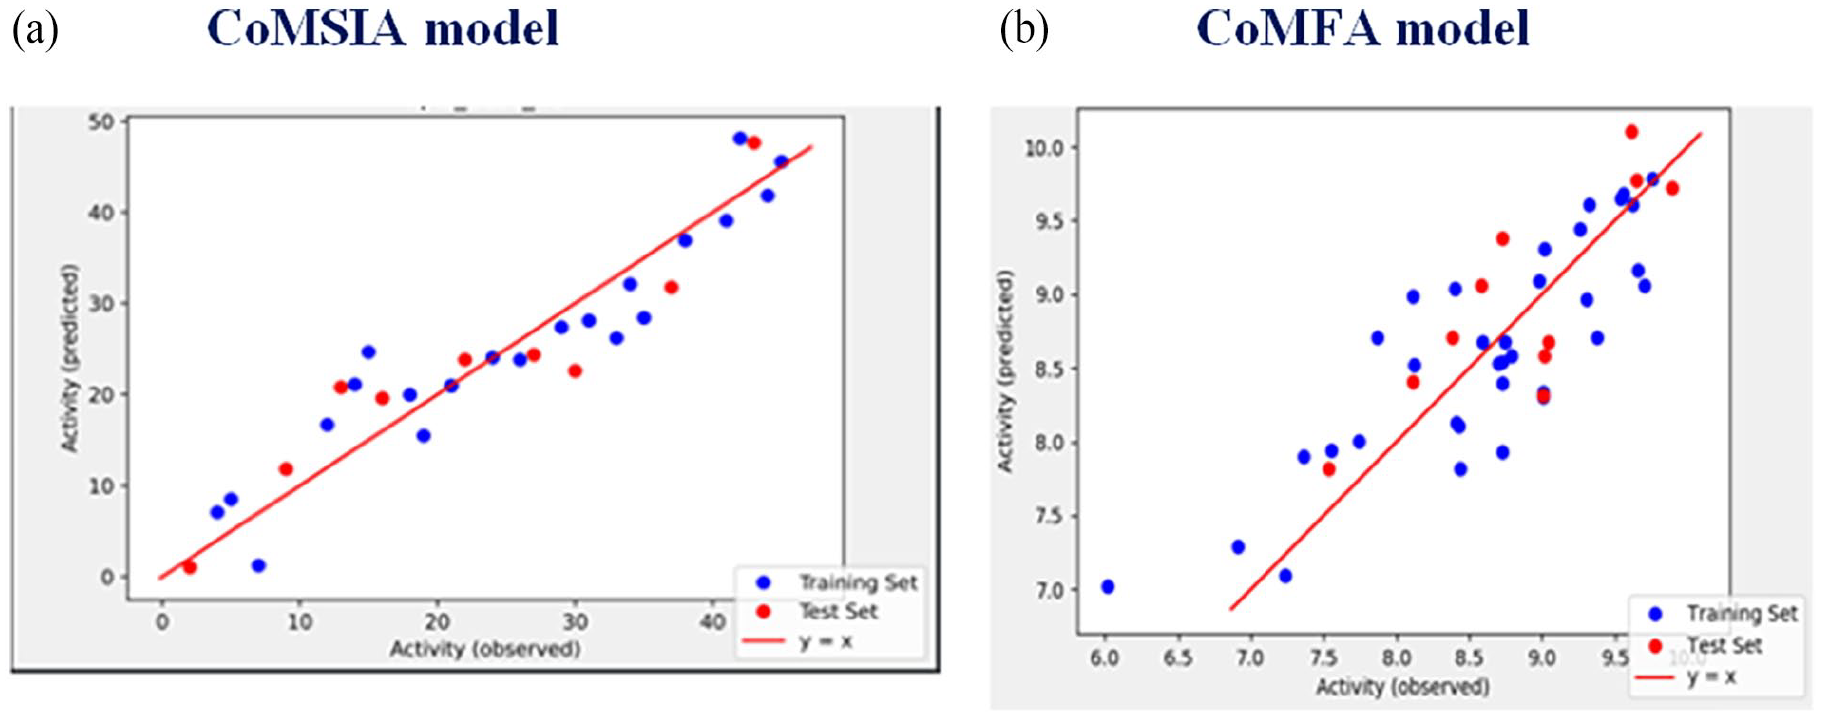
The predicted versus experimental PMIC50 values for 45 compounds model. (a) CoMSIA model; (b) CoMFA model. Filled blue circles color represent predictions for the training set; while filled red circle color represents predictions for the test set.
The correlations of predicted and observed pMIC values are displayed in Figure 6.
Design of new compounds
From aztreonam analogs, AZT 2 is the most active molecule in 3D-QSAR and molecular docking investigations. Using AZT 2 as a template, we created AZT 2 analogs (A1-7), and their activity was predicted using the CoMSIA/SEA model. Figure 7 and Table 3 list the new candidate compounds that have antibacterial action. A3 was the most active analog of AZT2.

Structures of newly designed molecules.
Predicted pMIC of newly designed compounds based on CoMFA and CoMSIA 3D-QSAR models.

ADMET prediction and drug-likeness of new compounds
The result of ADMET properties, drug-likeness, and toxicity study by utilizing ADMETlab 2.0 and Swiss ADME http://www.swissadme.ch/index.php online software tools conducted on Aztreonam (AZT2) and its derivatives A2–7 reported in Table 4.
Physicochemical, pharmacokinetic, and toxicity profile prediction of Aztreonam AZT2 and its derivatives (A1–7) carried out using ADMETlab 2.0 (1) software and SwissADME software.

Log P: partition coefficient; Log S: aqueous solubility, insoluble < −10 < poorly < −6 < moderately < −4 <soluble < −2 < very < 0 < highly; Log D: n-octanol/water distribution coefficients at pH = 7.4, 1-3 considered proper; MDCK: the unit of predicted MDCK permeability is cm/s. A compound is considered to have a high passive MDCK permeability for a Papp > 20 × 10−6 cm/s, medium permeability for 2−20 × 10−6 cm/s, low permeability for <2 × 10⁻⁶ cm/s; Pgp-sub Pgp-inhi: P-glycoprotein inhibitor, 0–0.3: excellent, 0.3–0.7: medium, 0.7–1.0(++): poor; BBB: blood–brain barrier, 0–0.3: excellent; 0.3–0.7: medium; 0.7–1.0 (++): poor; VD: volume distribution; CYP: cytochrome P450, category 0: Non-substrate/Non-inhibitor, category 1: substrate/inhibitor, the probability of being substrate/inhibitor, within the range of 0 to 1; CL: clearance of a drug, 0–0.3: excellent, 0.3–0.7: medium, 0.7–1.0 (++): poor; hERG: human ether-a-go-go related gene, 0–0.3: excellent, 0.3–0.7: medium, 0.7–1.0 (++): poor; AMES: a test for mutagenicity, 0–0.3: excellent, 0.3–0.7: medium, 0.7–1.0 (++): poor; DILI: drug-induced liver injury, 0–0.3: excellent, 0.3–0.7: medium, 0.7–1.0 (++): poor; Carcinogencity: empirical decision: 0–0.3: excellent (green); 0.3–0.7: medium (yellow); 0.7–1.0 (++): poor (red); HHT: the human hepatotoxicity, empirical decision: 0–0.3: excellent (green); 0.3–0.7: medium (yellow); 0.7–1.0 (++): poor (red); ROA: rat oral acute toxicity, empirical decision: 0–0.3: excellent (green); 0.3–0.7: medium (yellow); 0.7–1.0 (++): poor (red).
Molecular docking
The result of the molecular docking study was conducted between the target protein (PDB ID: 5G18), the reference compound (AZT), Aztreonam derivatives, and seven newly generated AZT2 derivatives(A1–7) by using Schrodinger Maestro docking software as shown in Figures 8–10.

(a) 2D docking poses showing interactions of compound AZT in the binding sites of DNA gyrase B 5G18, (b) 3D docking poses showing interactions of compound AZT in the binding sites of DNA gyrase B 5G18, (c) polar (hydrogen bond) binding interaction of JJ2 with PFK amino acid residues of ARG 203 and ASP199. (c) Surface representation showing AZT in the binding sites of DNA gyrase B 5G18 with lipophilicity coloring. White representing hydrophobic pockets and red representing hydrophilic pockets. AZT is shown in ball-stick model.

(a) 2D docking poses showing interactions of compound AZT2 in the binding sites of DNA gyrase B 5G18 and (b) 3D docking poses showing interactions of compound AZT2 in the binding sites of DNA gyrase B 5G18.

(a) 2D docking poses showing interactions of compound A6 in the binding sites of DNA gyrase B 5G18 and (b) 3D docking poses showing interactions of compound A6 in the binding sites of DNA gyrase B 5G18.
Discussion
CoMSIA and CoMFA study
One of the most important steps in creating 3D-QSAR models is molecular alignment. For this study, a ligand-based alignment technique was chosen, in which a template molecule (AZT2) is isolated first and then all other molecules are aligned over it. All the dataset structures are aligned to the template common substructure using Maestro Schrodinger software during the process. Figure 3 displays the overlay structures of the aligned data set.
The models created for a collection of 45 data sets of aztreonam derivatives have been used to calculate the predictive capacity of the CoMFA and CoMSIA models (Table 1). The most important statistics are the test set statistics that show how accurate the predictions are, such as the root mean square error (RMSE), Q2, and Pearson-r (Table 2). Stability is a marker of the model’s sensitivity to omission from the training set. As PLS was increased, the developed model’s stability showed promise. PLS overview displays that the CoMSIA model exhibits high R2 (0.90) and F (90.1) values, a small standard error SD (0.029). The F value could be used to determine the ratio of the observed activity variation to the model variance. A strong marker of the statistical significance of the regression is the large value of F (90.1). In addition, the data used to create the regression model are the most appropriate due to the high value of R2 (squared correlation coefficient) (0.90) and the minor values of RMSE (0.27) and SD of regression (0.029).
The model was also validated by the externally validated correlation coefficient (Q2). Since the Q2 Leave-One-Out (Q2 LOO) value (0.8859) was acquired by external validation by separating the data into training and group tests, it is more accurate and robust than the R2 value. Another crucial metric for illustrating the correlation between the test sets observed and expected activity is the Pearson-r value (0.64). This was also observed by Ugbe et al. 14 Accurate estimates of the test E. coli inhibitors had been made by the two models. The CoMFA and CoMSIA models were predicted to have R2 values of 0.84 and 0.90, respectively (Table 2).
According to the PLS summary, the CoMFA model has high R2 (0.82) and F (84.3) values, small estimation error SD (0.454), and the cross-validated determination coefficient Q2 (0.72) with four optimum number of components. Test sets are typically utilized for cross-checking and validating the QSAR model’s external prediction capability. The 13 test sets that were chosen at random underwent the same optimization and alignment processes as the training sets. The high R2 value (0.92) was obtained from the external validation, showing that the CoMFA model’s predictive capacity is acceptable. Furthermore, a 58:42 ratio between the steric and electrostatic contributions was discovered, suggesting that steric interactions hold a significantly greater significance than electrostatic ones.
3D-QSAR contour map analysis
Field-based QSAR is a technique for modeling the correlation between a collection of 3D characteristics of matched compounds (such as CoMFA and CoMSIA) and known activity values. 29 Field-based QSAR can infer the contribution of the ligand’s electrostatic, hydrophobic, and steric fields to biological activity or inactivity by starting with a group of connected ligands exhibiting recognized behaviors. 30 . We used the most active compound, AZT2, as a reference to create a CoMSIA/CoMFA contour map from which to show the data found in the best 3D-QSAR model. Two fields-based 3D QSAR styles are available for the model’s construction and testing: the first field makes use of the five Gaussian fields (CoMSIA) in the model, and the second, a force field that employs the model’s force-field electrostatic and steric field (CoMFA).
In the CoMSIA steric area, at this level, 80% of the contributions are represented by the green contour (sterically advantageous) and 20% by the yellow contour (sterically unfavorable). The red contour in the CoMSIA electrostatic field indicates a favorable electronegative charge and the blue contour (indicating electropositive charge favorable) corresponds to 80% and 20% of the level contribution, respectively. Similarly, in the CoMFA electrostatic field, the blue (electropositive charge favorable) and red (electronegative charge favorable) contours reflect 20% and 80% of the level contribution, respectively. CoMFA and CoMSIA contour maps were produced to streamline regions where the activity can be decreased or increased. CoMSIA contour maps are displayed in Figure 4(a)–(e).
Figure 4(a) displays the CoMSIA steric contribution contour map. Green contours around the NH2 and COOH positions of the lactamase group indicate that bulky groups in these positions can increase activity, while yellow contour around sulphonyl positions of the lactam group and small substitutions in these positions have decreased activities. Figure 4(b) displays the electrostatic contour map for the CoMSIA model. Bleu contour is near to position β-lactam ring which means that the substitution with electron-donating groups (-COONH2) would increase the activity. While red contours around the β-lactam ring can decrease the activity. This bulky electron-donating substitution group (-COONH2) selection is required in this region which indicates that improving biological activity. That can explain why compound AZT2 with the –COONH2 on the ortho position of the β-lactam ring is more active than the compound AZT1 with the same ortho position.
The CoMSIA hydrophobic contribution contour map is shown in Figure 4(c). Yellow contour around the β-lactam ring and two methyl groups near oxime functional groups indicate that hydrophobic groups may increase the activity, while the white contour around the amide position of the β-lactam ring and near the ester indicates that hydrophilic groups are favored. Figure 4(d) displays the hydrogen bond acceptor field contribution contour map in CoMSIA. Magenta contour around the oxygen atom near to sulfonamide positions of the β-lactam ring and position near oxime in the ester group explain that substituent with the ability to accept hydrogen bonds can boost activity, whereas the red contour covering the hydrogen atom exposed the significance of the hydrogen bonds donor group. Figure 4(e) is shown in the CoMSIA of the hydrogen bond donor contribution contour map. The activity would be enhanced by substituting a donor hydrogen bond at the COOH locations of the functional group that is closest to the oxime, as indicated by the cyan contour around these areas.
The CoMFA steric and electrostatic contribution contours map are illustrated in Figure 5(a) and (b). The steric contribution contour map is displayed in Figure 5(a) using green and yellow colors, whereas Figure 5(b) displays electrostatic interactions with red and blue contours. In the steric contribution contour map, bulky substituents are favored around green regions, while in yellow regions bulky substituents are unflavored. Moreover, in the electrostatic interactions contour map, blue regions indicate that nucleophilic groups are favored, while red regions are unflavored, this funding is supported by Edache et al., 31 reported in 2023.
The PLS analysis method demonstrated a linear correlation between the observed and predicted pMIC values. Predicted and observed pMIC values demonstrated the great predictive power of the models, as Figure 6 illustrates. Previous research published in 2022 by Ugbe et al. 14 coworkers provided evidence for this.
Design of new compounds
This study’s main goal is to build novel Aztreonam analogs that inhibit E. coli by using the structural properties of the most active molecule (AZT 2) as a guide for our extraction of recommendations from 3D-QSAR and molecular docking investigations. Seven Aztreonam derivatives were created in this study to enhance and suggest a novel antibacterial agent. The newly created molecules were matched to the database using AZT 2 as a template, and their activity was predicted using the CoMSIA/SEA model Figure 7 and Table 3 list the new candidate compounds that have antibacterial action.
ADMET prediction and drug-likeness of new compounds
Predicting pharmacokinetics and toxicity aids in optimizing the pharmacological characteristics of recently produced drugs. 15 Table 4 displays the in silico estimation of the pharmacokinetic and toxicity profiles of Aztreonam (AZT2) and its derivatives A2–7, utilizing ADMETlab 2.0 20 to estimate absorption, distribution, metabolism, excretion, and toxicity and Swiss ADME http://www.swissadme.ch/index.php online software tools.
Models based on field data (CoMSIA/SEA) anticipate nearly identical activities for all newly developed compounds. We thus employed the pharmacokinetic parameters ADMET and drug-likeness to confirm that the proposed compounds are effective medications. For in silico ADMET properties prediction, the ADME online tool was utilized. From Table 4, it is evident that Aztreonam (AZT2) and all the newly designed compounds (A2–7) exhibited better solubility (<−2 < very < 0 Log S) and partition coefficient (Log P) profile. For partially dissociated compounds (Log D), the partition coefficients fell within the optimal range.
In this study, we took MDCK and Pgp-inhibitor to evaluate the absorption profiles of newly designed compounds. Madin−Darby canine kidney cells (MDCK) has been developed as an in vitro model for permeability screening. Its apparent permeability coefficient, Papp is commonly regarded as the in vitro gold standard for determining how well substances are absorbed by the body. Pgp (P-glycoprotein) inhibitor is another parameter to measure the absorption of compounds. The P-glycoprotein is a membrane protein belonging to the superfamily of ATP-binding cassette (ABC) transporters. Given that it can detect several xenobiotic that are structurally distinct and appear to be unrelated, it is likely the most promiscuous efflux transporter. Notably, a large number of these xenobiotic are also substrates for CYP3A4. As evident in Table 4 almost all of the newly designed compounds have successfully passed the absorption pharmacokinetic evaluation parameters.
Distribution of newly designed compounds is evaluated by plasma protein binding (PPB). Drug pharmacodynamics behavior is strongly influenced by the binding of a drug to proteins in plasma, as PPB is one of the main routes of drug uptake and distribution. PPB has a direct impact on oral bioavailability since the process of a drug binding to serum proteins affects the drug’s free concentration.
The second parameter to evaluate the distribution of compounds was in blood–brain barrier (BBB). BBB crossing is necessary for drugs that act on the central nervous system (CNS) to get to their molecular target. In contrast, BBB penetration may be minimal or nonexistent for medications with a peripheral target to prevent CNS side effects and third parameter was volume distribution (VD). One crucial criterion to characterize the in vivo distribution of medications is VD, a theoretical idea that links the actual starting concentration in the bloodstream with the dose that was provided. Practically speaking, we may infer the distribution characteristics of an unknown molecule based on its VD value, including the conditions under which it binds to plasma proteins, the amount it distributes across bodily fluids, and the amount it absorbs into tissues. All of the newly designed compounds have successfully passed the distribution evaluation based on the above parameters.
Metabolism (CYP 2D6/3A4 inhibitor and 2D6/3A4 substrate) of the new compound is successfully passed, while excretion (CL and T1/2) was under normal value.
All of the compounds were anticipated to be nonmutagenic (AMES toxicity), noncarcinogenic, nonhuman hepatotoxic (H-HT), nonrat oral acute toxicity (ROA), and non-hERG inhibitors; nonetheless, they had a weak hepatotoxic profile. Promising projected pharmacokinetic and safety profiles were shown by the majority of the substances.
The newly designed compounds (A1-7), estimate the quantitative drug-likeness (QED), synthetic accessibility score (SA score), pfizer rule (rule of 5), and molecular docking as illustrated in Table 5. Each of these properties was chosen for its relevance in assessing the drug-likeness and synthetic feasibility of molecules, crucial factors in drug discovery and design. All newly generated compounds are acceptable for QED value, except compound A1, and compounds A4–7 accept the rule of five or pfizer rule, but compounds A1–3. These parameters are important as indicators of drug likeness. The newly designed compounds (A1–7) also predict their synthetic accessibility. All compounds synthetic accessibility scores were less than 5.00, and this indicated that they are easy laboratory synthesis. This funding is supported by previous research done by Fabian Audu Ugbe et al. 32 in 2023.
Drug likeness prediction of the newly design compounds (A1–7), their synthetic accessibility and molecular docking results.
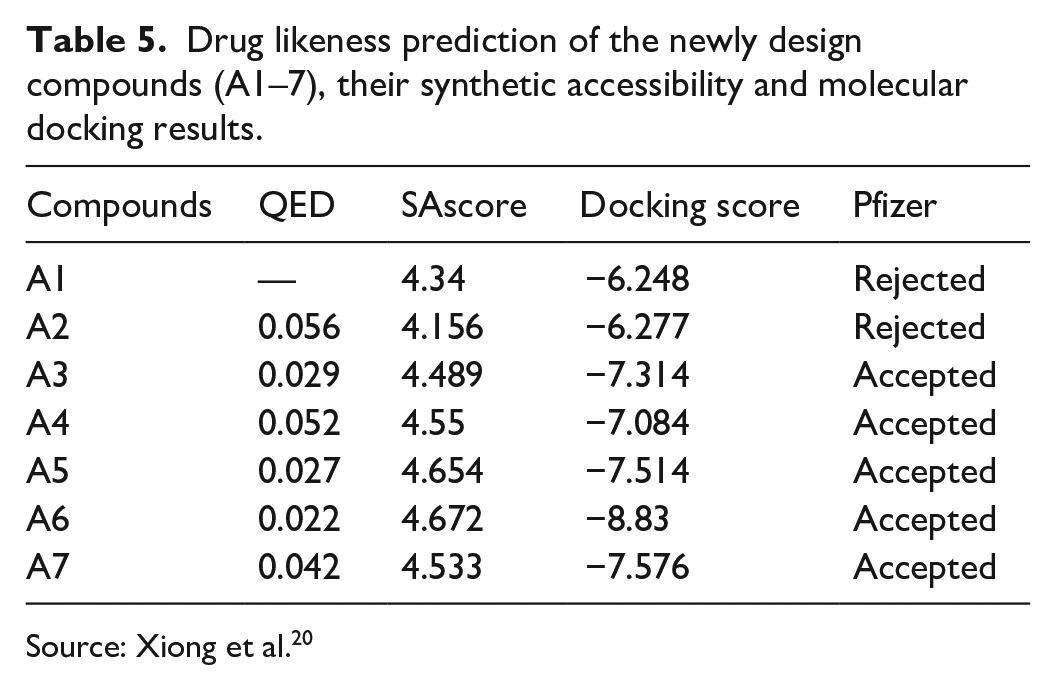
Source: Xiong et al. 20
Molecular docking study
A molecular docking study was conducted to get an additional understanding of the drug’s mechanism of action and their binding interaction, and it was done by using Schrodinger Maestro docking software. E. coli DNA GyrB has been proposed as the main binding target for antibacterial activity. 33 It had been reported that DNA supercoiling activity was inhibited by Aztreonam overlapping in the ATP binding site of GyrB. The crystal structure of E. coli DNA gyrase B linked to the natural product antibiotic AZT was used to conduct a molecular docking investigation of Aztreonam derivatives (PDB ID: 5G18) 22 as shown in Figure 8. The binding modes of AZT2 have the greatest binding affinity with DNA gyrase B as displayed in Figure 9. It forms 7 hydrogen bonds and 2 salt bridges with Asn104, Ser70, Ser237, Asn132, Thr235, Lys234, and Ser130 amino acid residues in the binding site of 5G18. The OH group at SOOHN of the monolactam portion of AZT 2 produces hydrogen bonds with the carbonyl oxygen side chain of Asn104, and the hydroxyl group at COOH of the thiazoline group forms hydrogen bonds with the carbonyl oxygen side chain of Thr235 and Ser30, respectively. The carbonyl oxygen at the monolactam moiety of AZT 2 and the carbonyl oxygen at the thiazoline portion form hydrogen bonds with the carbonyl oxygen side chain of Asn104 and Ser130, respectively. The NH at monolactam group forms hydrogen bonds with the carbonyl oxygen side chain of Ser237 and the N+H3 moiety forms hydrogen bonds with the carbonyl oxygen side chain of Ser70 and Ser237, respectively. Moreover, protonated (positively charged) nitrogen at monolactam moiety creates a salt bridge with a side chain of negatively charged hydroxyl group oxygen atoms, and the deprotonated (negatively charged) oxygen at COOH moiety creates a salt bridge with positively charged nitrogen atom at the side chain of Lys 234.
Furthermore, the newly generated compound A6 as shown in Figure 10 has highest binding affinity with DNA gyrase B. It forms 10 hydrogen bonds with amino acid residues of Asn104, Asn274, Asn132, Ser70, Ser237, Thr105, Glu273, and 2 salt bridges with amino acid residues of Ser70 and Glu273 and one pi-Alkyl connect with Gys271 residue of amino acid in the binding site of 5G18. In general, the root-mean-square deviation natural ligand (PDB: 5G18) and redocking compounds were 1.3195 and 1.0254, respectively.
Strengths and limitations of the study
The strength parts of this study was giving insight into the scientific knowledge for researcher toward 3D-QSAR, ADMT, and molecular docking studies of Aztreonam analogues as E. colis inhibitors. The limitation of this study was that it takes time to obtain acceptable chemical coverage for training and test set datasets, and deficient datasets impact the application domain and result of the models. Moreover, lengthy software setup periods, virus-ridden data, and unanticipated computer malfunctions can all result in the loss of work.
Conclusion
Using a set of Aztreonam derivatives with antibacterial potency against E. coli, the 3D-QSAR models for CoMFA and CoMSIA were created for this investigation. The models’ Q2 and R2 values show good statistical findings.
For the chemical test set, CoMFA and CoMSIA were found to have good predictive power, indicating that these models might be usefully applied to the prediction of pMIC50 values. Furthermore, the key locations that improve bioactivity and H-bond interactions were identified as steric, electrostatic, and hydrophobic based on the contour maps of the CoMFA/CoMSIA models.
A docking study was conducted to examine and determine the interactions of potential antibacterial agents in the DNA gyrase active site. AZT2 proved to be the most effective of these compounds, and the newly designed compound A6 has the highest binding and biological activity observed from these findings. These findings offered vital hints for creating brand-new E. coli inhibitors with highly anticipated strong potency. Based on the structure–activity relationship from the current investigation, a set of seven new derivatives was created. On these novel compounds, in silico analyses of their toxicity, distribution, metabolism, excretion, and absorption were performed to look into their activities by the standard. Five of the seven compounds that were produced are lead-like molecules with superior pharmacological characteristics than those of the research series. The knowledge gained from this investigation can also be applied to the development of strong E. coli DNA gyrase inhibitors.
Footnotes
Acknowledgements
The authors are thankful to the authorities of ACD labs, Maestro Schrödinger suite ADMETLab2.0, and PyMOL for providing free access to software and computer programs.
Authors’ contributions
Conceptualization: Melese Legesse Mitku. Data curation: Melese Legesse Mitku and Wudneh Simegn. Formal analysis: Melese Legesse Mitku and Gashaw Sisay Chanie. Funding acquisition: Melese Legesse Mitku and Abdulwase Mohammed Seid. Investigation: Melese Legesse Mitku and Yibeltal Yismaw Gela. Methodology: Melese Legesse Mitku, Assefa Kebade Mengesha and Mihret Melese. Project administration: Melese Legesse Mitku, Wudneh Simegn, and Alemante Tafese Beyna. Resources: Melese Legesse Mitku, Dereje Esubalew, and Wondim Ayenew. Software: Melese Legesse Mitku and Wudneh Simegn. Supervision: Melese Legesse Mitku, and Liknaw Workie Limenh. Validation: Melese Legesse Mitku and Gashaw Sisay Chanie. Visualization: Melese Legesse Mitku and Wudneh Simegn. Writing—original draft: Melese Legesse Mitku. Writing—review and editing: Melese Legesse Mitku, Wudneh Simegn and Liknaw Workie Limenh.
Data availability
All relevant data were included in the manuscript.
Declaration of conflicting interests
The author(s) declared no potential conflicts of interest with respect to the research, authorship, and/or publication of this article.
Funding
The author(s) received no financial support for the research, authorship, and/or publication of this article.
Ethics approval
Not applicable.
Informed consent
Not applicable.
Trial registration
Not applicable.