
Abstract
Background
Sepsis is the leading cause of mortality in critically ill cancer patients; however, traditional prognostic models fail to capture the complexity of their immune and physiological interactions.
Methods
This retrospective study analyzed electronic health records from the Medical Information Mart for Intensive Care IV database, including the records of patients with sepsis who had a documented history of cancer and were admitted to the intensive care unit. A two-step feature selection approach, combining least absolute shrinkage and selection operator regression and recursive feature elimination, was used to identify key prognostic variables. Eight machine learning algorithms, such as random forest and extreme gradient boosting, were trained and evaluated using five-fold cross-validation. Model performance was assessed using the area under the receiver operating characteristic curve value, Brier scores, sensitivity, and specificity. SHapley Additive exPlanations, Partial Dependence Plots, and break down algorithms were applied to enhance model interpretability.
Results
The final cohort included 3364 patients admitted to the intensive care unit. Nonsurvivors had significantly higher illness severity scores (Acute Physiology Score III and Sequential Organ Failure Assessment) than survivors (p < 0.001). Among the tested models, the random forest model demonstrated superior performance, achieving the highest area under the receiver operating characteristic curve value (0.78; 95% confidence interval: 0.76–0.80) and the lowest Brier score (0.15), indicating strong predictive accuracy.
Conclusions
This study developed machine learning models for predicting in-hospital mortality in sepsis patients with a history of cancer, leveraging the Medical Information Mart for Intensive Care IV database for comprehensive risk assessment.
Introduction
Sepsis, a life-threatening organ dysfunction caused by a dysregulated host response to infection, is associated with high morbidity and mortality and is one of the most common admission diagnoses in critically ill cancer patients admitted to intensive care units (ICUs).1–3 Immune suppression from underlying malignancies and cancer-related treatments often predisposes cancer patients to sepsis. 4 Emerging evidence indicates that immune dysfunction, characterized by hyperinflammation and immunosuppression, drives sepsis progression, causing early organ damage. Moreover, in patients with severe immune dysfunction, fatal complications may occur in the later stages. 5 Patients with a history of cancer are estimated to have a 10-fold higher risk of developing sepsis than those without a history of cancer. 6 Recent observational studies under ICU settings have revealed that 15%–20% of patients with sepsis have underlying hematologic or solid malignancies. 7 Given the high mortality rate in cancer patients with sepsis, prognosis assessment requires refined criteria that incorporate not only robust clinical practices but also data-driven predictive models for early identification, personalized diagnosis, and timely multidisciplinary interventions to improve survival outcomes. 8
Traditional prognostic assessment methods based on single indices or scoring systems (e.g. Sequential Organ Failure Assessment (SOFA) score) often do not fully reflect the multifactorial nature of sepsis in cancer patients, where intricate interactions between physiological and immune parameters contribute to disease progression. The lack of multi-feature integration further limits the development of comprehensive and precise prognostic models tailored to this patient population. Moreover, empirical evidence regarding mortality outcomes and prognostic factors in critically ill cancer patients with sepsis remains scarce, particularly following the adoption of the Sepsis-3 criteria. 9 Although several prognostic models have recently been developed for sepsis patients with cancer, their utility for early risk stratification remains limited.10,11 This is primarily because these models incorporate variables collected after admission or during the course of treatment—such as the duration of antibiotic therapy and vasopressor use—which are not typically available at the time of ICU admission. Moreover, these studies rely on traditional statistical methods such as logistic regression, which may not fully capture the complexity and heterogeneity of the patient population, thereby limiting their predictive performance.
To overcome the limitations of traditional methods, recent studies have shifted toward machine learning (ML) approaches.12–15 In critical care medicine, where disease progression is influenced by multiple interacting factors, ML has been widely applied in diagnostic and prognostic modeling.16–18 However, despite the existence of multiple scoring models for predicting sepsis severity and mortality in geriatric populations, studies developing prognostic models specifically for in-hospital mortality in cancer patients with sepsis remain limited.19–22 The Medical Information Mart for Intensive Care (MIMIC) database is a vast, openly accessible repository containing de-identified health data from thousands of patients treated in ICUs at Beth Israel Deaconess Medical Center from 2001 to 2019. 23 The extensive clinical data from the MIMIC database provide robust and reliable support for predicting the prognostic risks in patients with sepsis complicated by tumors. Utilizing the expansive clinical data from the MIMIC database, this study aimed to identify sepsis patients with concomitant tumors and elucidate the risk factors associated with in-hospital mortality, thereby addressing a critical research gap in the prognostic modeling for this complex patient cohort.
Methods
Research cohorts
This retrospective study analyzed the electronic health record (EHR) data from the MIMIC-IV database, which comprises comprehensive clinical data of patients admitted to the ICU. The inclusion criteria were as follows: (a) patients aged ≥18 years admitted to the ICU with sepsis as a primary or secondary diagnosis, defined according to the Sepsis-3 criteria; (b) those with a documented cancer diagnosis (either active or in remission); 3 and (c) patients with complete clinical data, including physiological and laboratory measurements within the first 24 h post-admission. The cohort was randomly stratified into training and validation sets (7:3 ratio), with a balanced distribution of clinical characteristics and outcomes between the two groups. Approval to use data from the MIMIC-IV database was obtained (certification no.: 48533840). As the data were de-identified, the need for informed consent was waived. The methods in this study were conducted in accordance with the Helsinki Declaration of 1975, as revised in 2024. The reporting of this study conforms to the Strengthening the Reporting of Observational studies in Epidemiology (STROBE) guidelines. 24
Clinical variables
The primary outcome measure was ICU mortality. Clinical variables were categorized as follows: (a) demographics: age, sex, height, and weight (kg); (b) vital signs: heart rate (beats/min), respiratory rate (breaths/min), temperature (°C), systolic blood pressure (SBP; mmHg), diastolic blood pressure (DBP; mmHg), and mean arterial pressure (mmHg); (c) laboratory parameters: pulse oximetric oxygen saturation (SpO2; %), hematocrit (%), hemoglobin (g/dL), platelet count (×109/L), white blood cell count (×109/L), albumin (g/dL), anion gap (mmol/L), bicarbonate (mmol/L), blood urea nitrogen (BUN; mg/dL), calcium (mg/dL), chloride (mmol/L), creatinine (mg/dL), glucose (mg/dL), sodium (mmol/L), potassium (mmol/L), international normalized ratio, prothrombin time (s), partial thromboplastin time (s), alanine aminotransferase (ALT; U/L), aspartate aminotransferase (U/L), alkaline phosphatase (ALP; U/L), and total bilirubin (mg/dL); (d) scoring systems: Glasgow Coma Scale (GCS), SOFA, and Acute Physiology Score III (APSIII); (e) comorbidities: myocardial infarction, congestive heart failure, peripheral vascular disease, cerebrovascular diseases, dementia, chronic obstructive pulmonary disease (COPD), rheumatic disease, peptic ulcer disease, diabetes, paraplegia, renal disease, and acquired immunodeficiency syndrome (AIDS). Variables with >25% missing values were excluded. For the remaining variables, multiple imputation was applied using predictive mean matching.
Development of ML models
To develop ML models for predicting the prognosis of ICU-admitted sepsis patients with cancer, the study followed a structured workflow encompassing feature selection, model training, hyperparameter optimization, and performance evaluation. During variable selection, a two-step approach was used to identify the most relevant predictors. First, least absolute shrinkage and selection operator (LASSO) regression was applied to the training dataset to perform preliminary feature selection by shrinking the less important coefficients to zero. Then, recursive feature elimination (RFE) was applied using the features retained by LASSO to identify the optimal combination of variables. RFE iteratively eliminated the less important features based on model performance, ensuring a parsimonious feature set. Model training and hyperparameter optimization were performed using the training set. Five-fold cross-validation was employed to divide the training set into five subsets, with each subset serving as a validation fold once, while the remaining four subsets were used for training. During this process, hyperparameters were optimized using grid search to identify the configuration that maximized model performance. The study implemented a diverse set of eight ML algorithms: linear discriminant analysis (LDA), quadratic discriminant analysis (QDA), naive Bayes, k-nearest neighbors (KNN), decision tree (DT), random forest (RF), XGBoost, and support vector machine (SVM). Model evaluation was conducted on the validation set using metrics such as the area under the receiver operating characteristic curve (AUC; to assess discrimination); Brier scores (to evaluate calibration); and sensitivity, specificity, positive predictive value, and negative predictive value (to determine clinical utility).
Interpretability of ML models
To enhance ML model interpretability and understand the impact of each feature on predictions, interpretability methods were applied, including SHapley Additive exPlanations (SHAP), Partial Dependence Plots (PDPs), and break down algorithm. SHAP values were used to quantify the contribution of each feature to the model’s predictions, offering global and local interpretability. SHAP summary plots highlighted the most influential features across the dataset, while SHAP dependence plots provided insights into the relationship between specific features and the predicted outcomes. PDPs were employed to visualize the marginal effect of a feature on the predicted outcome while holding other features constant, allowing for a global understanding of nonlinear interactions. Break down algorithm was applied to analyze individual predictions by approximating the behavior of complex models locally with simpler interpretable models, such as linear regression. This provided a detailed explanation of the factors influencing predictions for individual patients, which could be particularly useful for clinical decision-making. Together, these interpretability techniques ensured that the models were not only accurate but also transparent and clinically meaningful.
Statistical analysis
Continuous data were presented as medians with interquartile ranges (IQRs), while categorical variables were reported as counts (percentages). Differences in clinical variables obtained from the EHR were assessed using the Wilcoxon rank-sum test for continuous variables and either the chi-square test or Fisher’s exact test for categorical variables. All analyses were conducted using R software (version 4.2.0).
Results
Research cohorts
The final study cohort comprised 3364 patients; their baseline characteristics are presented in Table 1. The inclusion flowchart is shown in Figure 1. Nonsurvivors were significantly older than survivors (median age: 70 vs. 68 years; p = 0.010) and demonstrated greater illness severity, as evidenced by higher APSIII and SOFA scores (p < 0.001). Compared with survivors, nonsurvivors exhibited higher heart rates, lower blood pressure levels, and more severe metabolic derangements and organ dysfunction, indicated by elevated BUN levels and decreased bicarbonate and albumin levels (all p < 0.001). The prevalence of COPD was significantly higher among nonsurvivors (31% vs. 27%; p = 0.011).
Baseline characteristics of sepsis patients with cancer.

SBP: systolic blood pressure; DBP: diastolic blood pressure; MBP: mean blood pressure; SpO2: pulse oximetric oxygen saturation; WBC: white blood cell; INR: international normalized ratio; PT: prothrombin time; PTT: partial thromboplastin time; ALT: alanine aminotransaminase; ALP: alkaline phosphatase; AST; aspartate transaminase; GCS: Glasgow Coma Scale, SOFA: Sequential Organ Failure Assessment; APSIII: Acute Physiology Score III; COPD: chronic obstructive pulmonary disease; AIDS: acquired immunodeficiency syndrome; ICU: intensive care unit.

Cohort flowchart.
Development of ML models
A two-step process was used for variable selection, combining LASSO and RFE to identify the most predictive and relevant features. First, LASSO was applied using the lambda.1se criterion (Figure 2(a) and (b)), which retained 14 variables, including clinical scores (APSIII and SOFA), comorbidities (cerebrovascular diseases, COPD, rheumatic diseases, paraplegia, and AIDS), vital signs (heart rate, SBP, respiratory rate, and SpO2), and laboratory or demographic features (weight and ALP). Subsequently, RFE was applied to further refine the best variable set, identifying an optimal combination of the following 11 features (Figure 2(c)): APSIII, SOFA, heart rate, respiratory rate, weight, SpO2, ALP, SBP, cerebrovascular diseases, AIDS, and COPD. These 11 variables were used for the development of models. The training and validation sets (Table 2) showed no significant differences in baseline characteristics. Among the models tested (Table 3), the RF model demonstrated superior performance, achieving the highest AUC (AUC = 0.78, 95% confidence interval (CI): 0.76–0.80), lowest Brier score (0.15), and highest recall (0.98, 95% CI: 0.98–1.00), indicating strong discriminative ability and sensitivity. LDA and SVM also exhibited strong predictive performance, with AUC values of 0.77 (95% CI: 0.76–0.78) and 0.76 (95% CI: 0.75–0.78), respectively. The RF model’s confusion matrix for the validation set is shown in Figure 3(a); the RF model maintained strong predictive discrimination with a validation AUC of 0.75 (Figure 3(b)). The results suggest that RF provides the most robust prognostic model for sepsis patients with cancer.

Results of variable selection.
Characteristics of the training and validation sets.

SBP: systolic blood pressure; SpO2: pulse oximetric oxygen saturation; ALP: alkaline phosphatase; APSIII: Acute Physiology Score III; SOFA: Sequential Organ Failure Assessment; AIDS: acquired immunodeficiency syndrome; COPD: chronic obstructive pulmonary disease.
Performance of machine learning models in the training set with five-fold cross-validation.
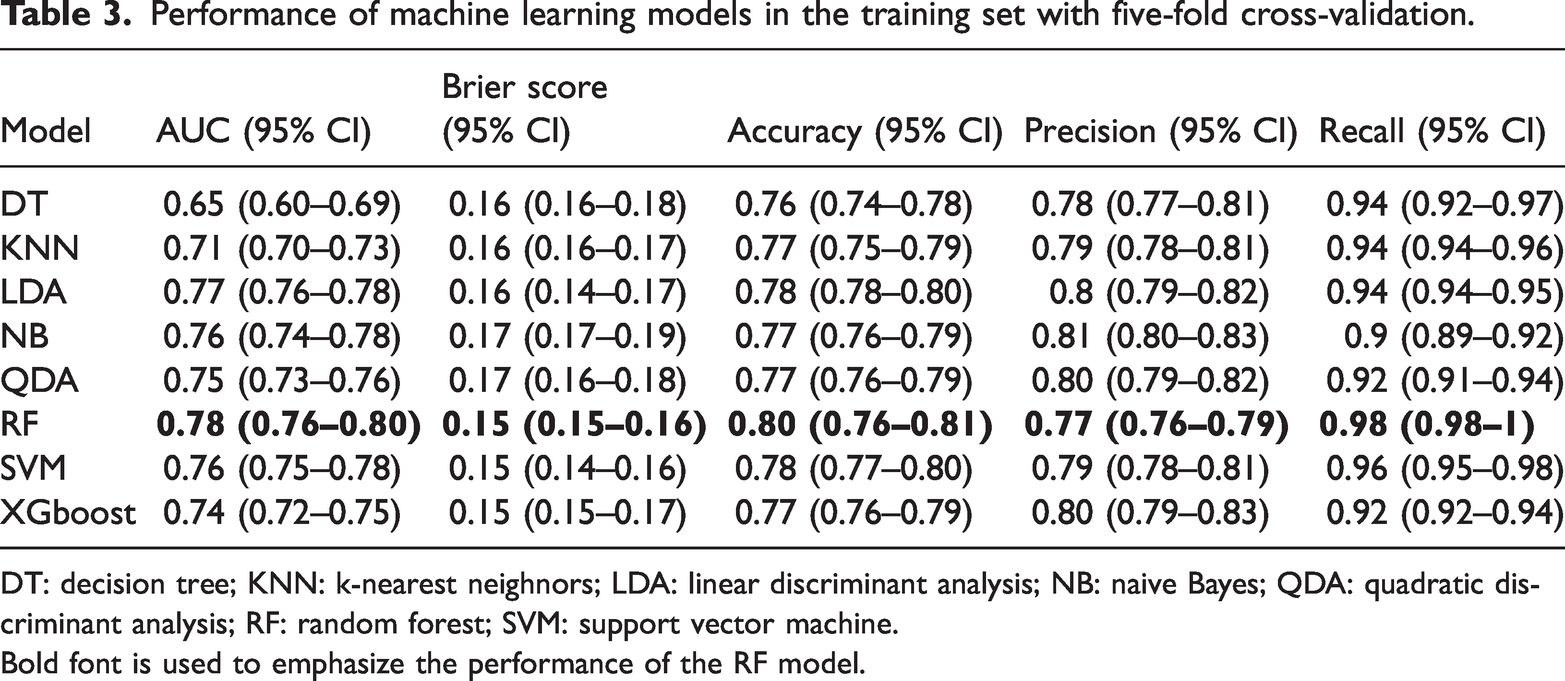
DT: decision tree; KNN: k-nearest neighnors; LDA: linear discriminant analysis; NB: naive Bayes; QDA: quadratic discriminant analysis; RF: random forest; SVM: support vector machine.
Bold font is used to emphasize the performance of the RF model.

Performance of the random forest model in the validation set.
Interpretability of ML models
To enhance the interpretability of the RF model, multiple explainability techniques were applied. The SHAP summary plot (Figure 4) illustrates the contribution of individual features to model predictions. The horizontal axis represents the SHAP value, which indicates the impact of a feature on the model’s prediction for a particular outcome. Positive values suggest that the feature increases the probability of the predicted outcome, while negative values indicate that it decreases the probability. The vertical axis lists the features considered by the model in order of their importance. APSIII appears to be the most influential feature, with a wide distribution of SHAP values, indicating that it had a significant effect on the model’s predictions. SpO2 also showed a considerable impact, exhibiting a trend where higher SpO2 values (red dots) tended to have a positive SHAP value, suggesting that increased SpO2 levels were associated with a higher probability of the predicted outcome.

SHAP summary plot for RF model. SHAP: SHapley Additive exPlanations; RF: random forest.
For instance-level explanations, break down plots (Figure 5) were generated, which decompose specific predictions into their feature contributions. Each plot illustrates the step-by-step changes in the predicted outcome as feature values are applied. In both plots, the analysis began with an intercept value of 0.24, representing the baseline prediction when no feature information was considered. Features were then added sequentially, with each feature contributing either positively or negatively to the final prediction. In this figure, the left plot demonstrates a scenario wherein multiple features collectively increase the model’s prediction. Features such as heart rate, respiratory rate, SpO2, and APSIII had notable positive contributions, resulting in a final predicted value of 0.672. In contrast, the right plot shows a case wherein several features reduce the prediction. Notably, the SOFA score had a substantial negative impact, leading to a final predicted value of 0.166. These visualizations help clarify how different combinations of clinical variables influence model output, offering insight into the decision-making process of the predictive algorithm.

Break down plots of instance explanation.
Additionally, PDPs (Figure 6) were used to visualize the marginal effect of each feature on the predicted probability of in-hospital mortality. PDPs help assess nonlinear relationships between key predictors and model outcomes, further improving model transparency. Regarding APSIII, the plot in the figure showed that higher APSIII scores were associated with an increased probability of mortality, indicating that the severity of illness strongly influences survival predictions. Regarding SpO2, lower SpO2 levels were correlated with a higher risk of mortality, highlighting the importance of maintaining adequate oxygen levels in patients. Regarding heart rate, an elevated heart rate was linked to a higher probability of mortality, suggesting cardiovascular stability as a critical factor in patient outcomes. Regarding respiratory rate, increased respiratory rates were associated with poorer outcomes, indicating the significance of respiratory function in predicting patient survival. Regarding SOFA, higher SOFA scores indicated greater organ dysfunction and were strongly correlated with an increased likelihood of mortality.

PDPs for variables in the RF model. PDPs: Partial Dependence Plots.
Discussion
In this study, ML models were developed to predict ICU mortality in cancer patients with sepsis. Among the eight models tested, the RF model demonstrated the best overall performance, achieving AUC values of 0.78 in the training set and 0.75 in the validation set. Additionally, the RF model’s high sensitivity (recall = 0.98) and strong calibration (Brier score = 0.15) indicate its utility in clinical risk stratification, particularly in minimizing missed diagnoses. These findings highlight the feasibility of integrating ML approaches into critical care settings to enhance early mortality prediction and improve personalized patient management.
Nomograms are predicated on the assumption of a linear relationship between variables. Thus, their applicability is limited in complex diseases with multiple factor interactions, such as tumor-related sepsis. However, the RF model has the advantage of being able to conduct risk assessments when dealing with large amounts of data or complex situations. It is more flexible, automatic, and accurate than nomograms. Furthermore, compared with conventional scoring systems, ML models encompass a broader range of clinical data, including laboratory parameters and comorbidities, thereby enhancing the precision of prediction. 25
To ensure the interpretability and clinical applicability of the models, we applied interpretability methods such as SHAP, PDP, and LIME. These methods provided clear insights into the role of each feature in the model’s predictions and its impact on patient outcomes. For example, SHAP values helped identify the most influential features, while PDPs revealed nonlinear relationships between the features and predicted outcomes. These results not only provide more information about patient prognosis but also enable more informed decisions, which help increase the clinical applicability of the model.
Combining the LASSO and RFE selection methods yielded 11 variables. Among them, APSIII, SpO2, heart rate, respiratory rate, and SOFA score demonstrated greater contribution than the other variables. APSIII is a scoring system based on 12 physiological parameters, such as heart rate and respiratory rate, which can help assess the severity of illness in critically ill patients and predict the mortality risk.1,26,27 Our interpretability analysis confirmed that higher APACHE III scores were strongly associated with an increased probability of mortality, aligning with established clinical evidence linking greater physiological derangement at admission to worse outcomes in sepsis. The SOFA score, a dynamic assessment of the severity of illness after ICU admission, indicates the degree of organ failure, which is consistent with the pathophysiological mechanisms of sepsis.28,29 Our SHAP value analysis further illustrated how increasing SOFA subscores, particularly in cardiovascular and renal domains, correspond to higher mortality risk, reinforcing its clinical relevance in this patient population. Previous studies have also shown that mortality in sepsis patients is associated with higher ASPIII and SOFA scores.30,31
Furthermore, higher heart and respiratory rates and low SpO2 levels are associated with an increased risk of mortality. 32 In the context of sepsis, these physiological changes often represent compensatory mechanisms aimed at maintaining cardiac output, blood pressure, and oxygen delivery in response to systemic inflammation and tissue hypoperfusion. These findings align closely with the characteristic clinical manifestations of circulatory and respiratory failure in sepsis. Our model’s ability to identify these parameters as important predictors supports its well-established role in early risk assessment. Timely recognition and management of abnormal vital signs—such as through targeted heart rate control, vasopressor therapy, or initiation of mechanical ventilation—are crucial for improving outcomes, especially in cancer patients who may have compromised physiological reserves.33,34
Another notable finding of the present study is that ALT had a large weighting factor in our model. ALT is commonly used in clinical practice to evaluate liver function. In case of liver dysfunction, the circulating ALP levels are elevated. 35 Sepsis-associated liver injury has been reported in up to 24.48% of patients with sepsis and leads to poor outcomes.36,37 ALP levels are frequently elevated in sepsis-induced liver dysfunction, and this elevation is hypothesized to be a consequence of both direct liver injury and systemic inflammation.38,39 The liver is not only a source of inflammatory mediators but also a target organ for the effects of inflammatory mediators. 40 Monitoring these biochemical markers is essential for the early detection and management of patients with sepsis. In addition, patients with tumors may have a higher risk of liver damage due to the complexity of their underlying disease and treatment. Meanwhile, both chemotherapeutic drugs and immunotherapy drugs may cause liver toxicity and further increase the burden on the liver. It is necessary for these patients to avoid using drugs that may aggravate liver damage and adjust chemotherapy or immunotherapy regimens in a timely manner.
This study has certain limitations that warrant consideration. First, although the cohort was divided into training and validation sets in a ratio of 7:3, external validation was not performed. Multicenter studies are required to further assess the generalizability of the model. Given that this study was based on retrospective data, potential selection bias and the influence of unmeasured confounding factors cannot be entirely ruled out. Additionally, the prediction model exhibited a relatively high false negative rate, which may be attributed to class imbalance and the use of a default classification threshold of 50%. Acquiring more positive samples or applying threshold optimization techniques could help improve the model’s predictive performance.
Footnotes
Acknowledgements
Not applicable.
Author contributions
Not applicable.
Consent to participate
Not applicable.
Consent for publication
Not applicable.
Data availability statement
The study data will be shared upon request to the corresponding author.
Declaration of conflicting interest
The authors declared no potential conflicts of interest with respect to the research, authorship, and publication of this article.
Ethical considerations
The Medical Information Mart for Intensive Care IV (MIMIC-IV) database was used, and the need for ethical approval was waived. The approval number is 48533840.
Funding
The research was funded by Jiangsu Province (Suqian) Hospital Research Project (ID: SY202407) and Jiangsu Province (Suqian) Hospital 136 Talent training plan (ID: 2307205101).