
Abstract
Background
Knee osteoarthritis is a debilitating disease with a complex pathogenesis. Synovitis, which refers to inflammation of the synovial membrane surrounding the joint, is believed to play an important role in the development and progression of knee osteoarthritis. To better understand the molecular mechanisms underlying knee osteoarthritis, we conducted a comprehensive analysis of gene expression in knee osteoarthritis synovium using machine learning.
Methods
Differentially expressed genes between knee osteoarthritis and control synovial tissues were analyzed using the GSE55235 dataset. We employed several machine learning algorithms, including least absolute shrinkage and selection operator and support vector machine–recursive feature elimination, to screen for key genes. Then, we validated the key genes using an external dataset (GSE51588) and an in vitro knee osteoarthritis animal model. CIBERSORT was used to compare immune cell infiltration levels between knee osteoarthritis and control synovial tissues and determine their relationship with the key genes. Finally, we performed a Connectivity Map analysis to screen for potential small-molecule compounds. Moreover, we conducted single-cell RNA sequencing analysis using knee joint tissues to annotate different subtypes of cells.
Results
A total of 930 differentially expressed genes were identified. Least absolute shrinkage and selection operator regression and support vector machine–recursive feature elimination identified FOSL2 and RHoBTB1 as key genes. The expression levels of both genes were further validated in the GSE51588 dataset as well as verified through an in vitro experiment involving a knee osteoarthritis mouse model. Multiple significant correlation pairs were found between the immune cell infiltration levels. We unveiled the genetic basis of knee osteoarthritis using genome-wide association study and specific signaling pathways through gene set enrichment analysis. The GeneCards database was used to obtain 3032 pathogenic genes associated with knee osteoarthritis, and we found that RHoBTB1 expression was significantly negatively correlated and FOSL2 expression was significantly positively correlated with interleukin-1β expression. We predicted several small-molecule compounds based on Connectivity Map analysis. Finally, single-cell RNA sequencing analysis revealed the expression levels of the two key genes in chondrocytes and tissue stem cells.
Conclusion
FOSL2 and RHoBTB1 may play key roles in the pathogenesis of knee osteoarthritis, exhibiting correlations with immune cell infiltration levels. These findings indicate that these genes have potential as therapeutic targets. However, further research and validation are necessary to confirm their exact roles and therapeutic potential in knee osteoarthritis.
Introduction
Knee osteoarthritis (KOA) is a degenerative joint disease that affects millions of individuals worldwide, with an increasing prevalence among aged populations.1,2 It is a multifactorial disease that is characterized by the progressive loss of articular cartilage, subchondral bone remodeling, and synovial inflammation. 3 The synovium, a specialized connective tissue layer that surrounds the joint cavity, plays a crucial role in KOA pathogenesis by contributing to inflammation and cartilage destruction.4,5 Although several risk factors for KOA, including aging, obesity, and joint injury, have been identified, its underlying molecular mechanisms remain largely unknown.
Recent advancements in molecular biology and next-generation sequencing technologies have facilitated the elucidation of the mechanisms underlying KOA pathogenesis based on the genetic basis and mRNA levels. 6 Transcriptomic profiling of the synovium has provided valuable insights into the genes and pathways involved in KOA. However, due to a limited sample size and the heterogeneity of KOA, reaching reliable conclusions using single-chip data can be challenging and may lead to a significant false positive rate, hindering the generation of accurate results.
To overcome these limitations, bioinformatics multi-chip joint analysis approaches have been developed to comprehensively analyze all gene sequencing chips related to disease tissue currently available in the Gene Expression Omnibus (GEO) database. This led to the identification of the differentially expressed genes (DEGs) associated with KOA onset and progression.7,8 Machine learning algorithms can be used to filter and select core genes while investigating the specific enrichment pathways and immune infiltration mechanisms associated with these genes. This approach enables the comprehensive investigation of the molecular mechanisms underlying KOA pathogenesis and can be used to identify novel biomarkers and therapeutic targets.
In this study, we aimed to identify synovial DEGs in KOA by analyzing publicly available datasets using machine learning algorithms. Furthermore, we conducted pathway and immune infiltration analyses to elucidate the specific molecular mechanisms involved in KOA pathogenesis. We also performed Connectivity Map (CMap) analysis to predict potential therapeutic drugs and conducted single-cell RNA sequencing (RNA-seq) to confirm the expression of the key genes in chondrocytes and tissue stem cells. Our findings may provide a deeper understanding of the molecular mechanisms underlying KOA and potential therapeutic targets for KOA treatment.
Material and methods
Ethical statement
This study was conducted in strict adherence to ethical principles and guidelines for both human and animal research. For the use of human data, all procedures were conducted in accordance with the 1964 Helsinki declaration and its later amendments or comparable ethical standards. The confidentiality and privacy of human participants were rigorously protected throughout the research process. All procedures involving animals were performed in full compliance with the ethics guidelines established by the Animal Ethics Committee of Jiangxi Zhonghong Boyuan Biotechnology Co., Ltd. The study protocol was reviewed and approved by the same committee (approval number: LL-202211150001). This research adheres to the EQUATOR Network guidelines for transparency and accuracy in health research reporting.
Data retrieval
The workflow of this study is illustrated in Figure 1. The reporting of this study conforms to ARRIVE 2.0 guidelines. 9 The Series Matrix File data of GSE55235 10 were obtained from the NCBI GEO public database using GPL96 as the annotation file. The dataset comprised data on 20 synovial membrane samples, including 10 control (postmortem joints/traumatic joint injury cases) and 10 disease samples (from patients with KOA). Additionally, the Series Matrix File data of GSE51588 11 were downloaded using GPL13497 as the annotation file. The dataset contained data on 50 samples, including 10 control and 40 disease samples. Furthermore, single-cell data from GSE176308, 12 which consisted of three samples with KOA, were retrieved for subsequent validation.
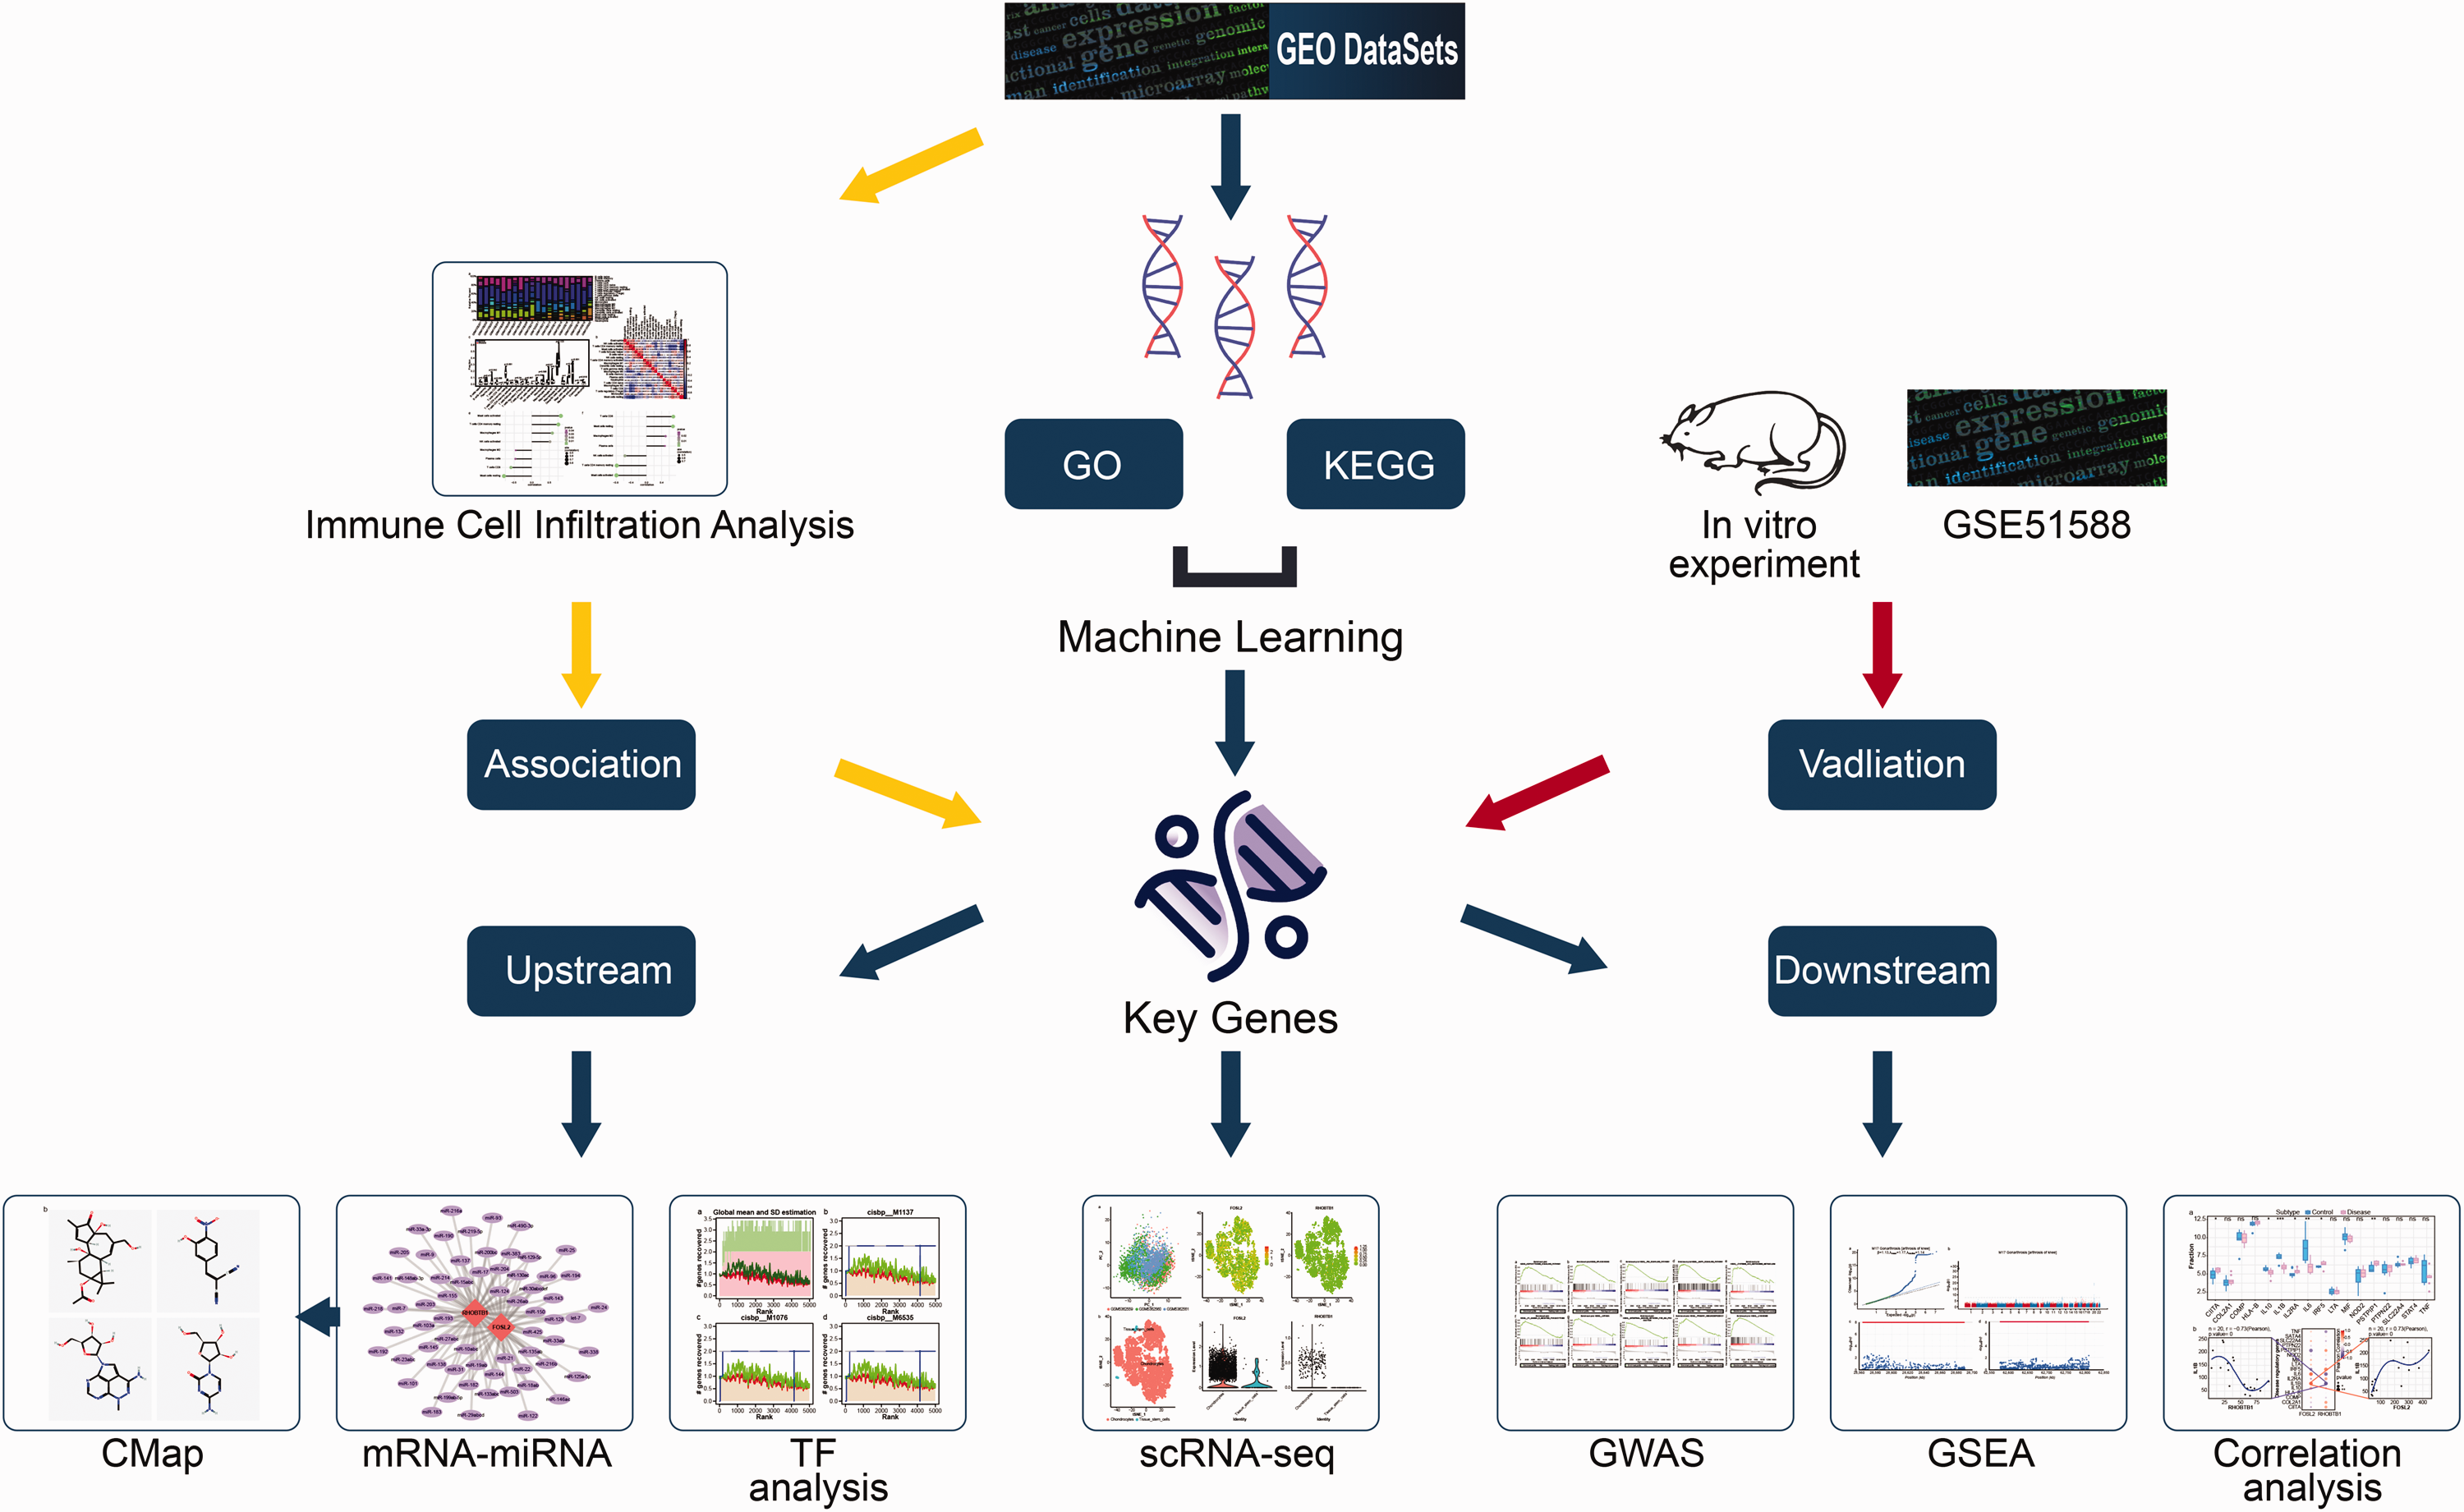
Flowchart of the analysis process. The figure shows the steps involved in performing the analysis, including data collection, DEG screening, functional analysis, feature gene selection, and validation of the key genes. CMap: Connectivity Map; DEG: differentially expressed genes; GO: Gene Ontology; GSEA: gene set enrichment analysis; KEGG: Kyoto Encyclopedia of Genes and Genomes; GWAS: genome-wide association study; LASSO: least absolute shrinkage and selection operator; scRNA-seq: single-cell RNA sequencing; TF: transcription factor.
GEO data inclusion criteria
The inclusion criteria were as follows: (a) studies focusing on KOA, particularly those with a minimum number of 10 samples in both case and control groups; (b) datasets with comprehensive gene expression profiling data from human tissues relevant to our study objectives; and (c) studies published within the past 10 years, ensuring contemporary relevance of the findings.
Exclusion criteria
The exclusion criteria were as follows: (a) studies with incomplete metadata or lack of relevant clinical information and (b) datasets with low sample quality or ambiguous experimental conditions.
Identification of DEGs and functional enrichment analysis
The ‘limma’ package was employed to identify DEGs between the control and disease groups in the GSE55235 dataset, utilizing the selection criteria of p-value <0.05 and |logFC| >1. 13 Functional annotation and visualization were performed using the Metascape database (www.metascape.org) for Gene Ontology and Kyoto Encyclopedia of Genes and Genomes pathway analyses of the DEGs. A minimum overlap of three DEGs between the control and disease groups and a significant threshold of p-value ≤0.01 were considered to indicate statistical significance.
Feature selection of key genes
Prior to feature selection, we conducted rigorous quality control and preprocessing of the raw data. This included removing low-quality samples, normalizing expression values, and removing batch effects. Specifically, we used the R package ‘limma’ for data normalization and applied the ComBat method to remove potential batch effects.
For feature selection, we employed a two-step approach combining least absolute shrinkage and selection operator (LASSO) regression and support vector machine–recursive feature elimination (SVM–RFE). 14 This combination allows us to leverage the strengths of both methods—LASSO’s ability to handle multicollinearity and perform feature selection as well as SVM–RFE’s capability to capture nonlinear relationships and rank features. LASSO regression was implemented using the R package ‘glmnet’ with binomial distribution for logistic regression. We set the alpha value to 1 for LASSO penalty and selected lambda using the one standard error criterion. We used 10-fold cross-validation for this method. Subsequently, SVM–RFE, a machine learning method based on SVMs, was used to further refine our feature selection. We used the ‘e1071’ R package through a linear kernel, with the cost parameter set to 1. This method iteratively removes feature vectors generated by SVM to establish an optimal SVM model, thereby identifying the most diagnostically valuable genes. To validate the significance of these key genes, we assessed their expression levels in an independent dataset, GSE176308. This step helps ensure the robustness and generalizability of our findings across different datasets.
Genome-wide association study (GWAS) analysis
The Gene Atlas database (http://geneatlas.roslin.ed.ac.uk/) is a vast repository that leverages the UK Biobank cohort to document correlations between hundreds of traits and millions of variants. This comprehensive database includes associations derived from a sample of 452,264 individuals and encompasses a total of 778 phenotypes and 30 million loci.
Immune cell infiltration analysis
The CIBERSORT method is a commonly used approach for assessing immune cell infiltration in the microenvironment by performing a deconvolution analysis of the expression matrix of immune cell subtypes based on the support vector regression principle. This method is based on 547 biomarkers that can distinguish 22 human immune cell phenotypes, which include T cells, B cells, plasma cells, and myeloid subgroups. In this study, we used the CIBERSORT algorithm to analyze patient data and estimate the relative proportions of 22 immune infiltrating cells. Additionally, we conducted a Spearman correlation analysis to investigate the relationship between gene expression levels and immune cell content.
Gene set enrichment analysis (GSEA)
In this study, we used the “c2.cp.kegg.v11.0.symbols” gene set of the Molecular Signature Database (MSigDB) as a reference set to compare the differential expression levels of genes in two sample groups using GSEA, a widely used method that employs predefined gene sets. 15 We determined the statistical significance of the results by performing 1000 permutations using a phenotype-based approach, with a significance threshold set at an false discovery rate (FDR) of <0.05 for enrichment analysis.
Prediction of transcription factors
We used the R package ‘RcisTarget’ to predict the transcription factors that regulate key genes. 16 ‘RcisTarget’ calculates the normalized enrichment score (NES) of the motifs based on the total number of motifs in the database. Additionally, we annotated the motifs based on their similarity to known motifs and gene sequences. We also calculated the area under the curve (AUC) for each motif–gene set pair to determine motif overexpression in the gene set. Finally, the NES of each motif was determined based on the distribution of the AUCs for all motifs in the gene set. We used the “rcistarget.hg19.motifdb.cisbpont.500 bp” database to rank gene–motif relationships and reduce redundancy.
Prediction of targeted therapeutic drugs
CMap is a gene expression profile database developed by the Broad Institute and is based on the modulation of gene expression. 17 It is mainly used to determine the functional connections between small-molecule compounds, genes, and disease states. The database includes gene expression data on 1309 small-molecule drugs applied to five human cell lines. The treatment conditions were diverse and included different drugs, concentrations, and treatment durations. In this study, we predicted targeted therapeutic drugs for KOA based on the DEGs.
Single-cell analysis
Raw single-cell RNA-seq data from GSE176308 were processed using the ‘Seurat’ package (version 4.1.0) in R. Quality control was performed by filtering out cells in which <200 genes were expressed as well as genes expressed in fewer than three cells. We removed cells with >10% mitochondrial genes to exclude low-quality or dying cells. Data normalization was performed using the “LogNormalize” method in Seurat, with a scale factor of 10,000. Variable features were identified using the “vst” method, selecting the top 2000 variable genes. To correct for potential batch effects, we used the “IntegrateData” function in Seurat, which employs canonical correlation analysis to identify common sources of variation between batches.
After normalization and batch correction, we performed principal component analysis (PCA) for initial dimensionality reduction. The first 30 principal components (PCs) were used for downstream analysis based on the elbow plot of standard deviations of PCs. Clustering was performed using the Louvain algorithm with a resolution of 0.5. For visualization, we used t‐distributed stochastic neighbor embedding (t-SNE) and uniform manifold approximation and projection (UMAP) algorithms, with perplexity set to 30 for t-SNE. Cell type annotation was performed using the ‘celldex’ package (version 1.4.0). We used the “HumanPrimaryCellAtlasData” as the reference dataset. Cell types were assigned based on the highest correlation score, with a minimum correlation threshold of 0.5. To identify marker genes for each cell subtype, we used the “FindAllMarkers” function in Seurat with the following parameters: (a) logfc.threshold = 1; (b) test.use = “wilcox”; (c) min.pct = 0.25; and only.pos = TRUE. Genes with an adjusted p-value of <0.05 were considered as significant markers.
In vivo experiment using the KOA mouse model
To establish a surgically induced KOA model, 10 male C57BL mice (10 weeks old) were used in each group. The animals were housed in a controlled environment, maintained at an ambient temperature of 22°C ± 2°C, with a relative humidity of 60% ± 5% and a light/dark cycle of 12/12 h. They were granted unrestricted access to food and water. We made every effort to minimize the number of animals used and reduce their suffering. The sample size was determined using power analysis to ensure statistical validity while using the minimum number of animals necessary.
Anterior cruciate ligament transection (ACLT) or sham surgery was performed under strict aseptic protocols. 18 Before the procedure, the animals were administered general anesthesia using 3% isoflurane, and their hind limbs were sterilized and shaved. Anesthesia was maintained with 3% isoflurane throughout the procedure. During the sham surgery, a medial capsular incision was made to sever the patellar tendon and expose the knee joint, which was then sutured. In contrast, the ACLT procedure involved opening the joint capsule and cutting the ACL using microscissors. After removing any tissue fragments by washing with saline, the incision was sealed. We used sodium pentobarbital for euthanasia, which was administered intraperitoneally at a dose of 150 mg/kg. Subsequently, we verified animal death by checking the absence of respiration and heartbeat. We continued to monitor the animals for at least 5 min after the last detectable heartbeat to ensure death. All animal care and experimental procedures were conducted in accordance with the “Guide for the Care and Use of Laboratory Animals, 8th Edition.” 19 mRNA quantification was performed using the medial tibial plateau joint tissue 6 weeks after surgery, and the mice were euthanized via the administration of an overdose of an anesthetic.
Reverse transcription–polymerase chain reaction (RT–PCR) validation of the key genes
RNA was obtained from the hind limbs of mice in the disease and control groups by immediately submerging them in liquid nitrogen followed by pulverization using a mortar and pestle. Total RNA from the knee joints was extracted using TRIzol reagent and was reverse transcribed to cDNA using SuperScript II reverse transcriptase. Real-time PCR was performed using the SYBR Green PCR Master Mix (Applied Biosystems, Life Technologies) on a Step One Plus Real-Time PCR System. The expression of the target genes was normalized to that of the reference gene β-actin, and the relative gene expression was calculated using the ΔΔCT method. These steps were replicated to ensure the accuracy and reliability of the results.
The primer sequences were as follows: FOSL2 (forward primer: 5′-ACGCTCACATCCCTACAGTC-3′, reverse primer: 5′-CGGATTCGACGCTTCTCCT-3′); RHoBTB1 (forward primer: 5′-ACAGTTCCAATGAGCGAGTC-3′, reverse primer: 5′-TTGCTGATAAGGAGGGTTGC-3′); β-actin (reference gene) (forward primer: 5′-GGCTGTATTCCCCTCCATCG-3′, reverse primer: 5′-CCAGTTGGTAACAATGCCATGT-3′)
Statistical analysis
The in vitro experiments were conducted with a minimum of five independent replicates. For measurement data presented as mean ± standard error of the mean, independent samples t-tests were performed. The correlation between variables was assessed using Spearman’s correlation test, with the Dunnett’s method applied for correction. The logistic regression algorithm was used to construct the predictive model. For gene expression analyses, we employed FDR control methods as described in the subsection “Gene set enrichment analysis (GSEA),” using an FDR <0.05 as the significance threshold. R software (version 4.0) was used for all statistical analyses. For tests other than those using FDR, a two-sided p-value of <0.05 was considered to indicate statistical significance.
Results
DEG screening and functional analysis
The GSE55235 dataset was downloaded from the GEO database, and the ‘limma’ package was employed to identify DEGs between disease and control samples. The selection criteria for DEGs were p-value <0.05 and |logFC| >1. In total, we identified 930 DEGs (507 upregulated genes and 423 downregulated genes) (Figure 2(a) and (b)). We also conducted a pathway analysis of these 930 DEGs. The results showed that the DEGs were mainly enriched in pathways related to inflammatory response, immune effector process, osteoclast differentiation, and ossification (Figure 2(c) and (d)).

DEG screening and data functional analysis. (a) Volcano plot of the DEGs. The green dots represent downregulated genes and red dots represent upregulated genes. (b) Heatmap of the differences in the expression of DEGs. Green color represents a low level of expression and red color represents a high level of expression. (c) GO analysis showing the enriched GO terms of the DEGs and (d) Kyoto Encyclopedia of Genes and Genomes pathway analysis showing the enriched pathways of the DEGs. DEG: differentially expressed genes; GO: Gene Ontology.
Identification of key genes
To further identify the key genes associated with KOA, we combined the feature selection algorithms LASSO regression and SVM–RFE to screen for 930 DEGs. LASSO regression identified 11 genes as key genes for KOA (Figure 3(a) and (b)). In addition, we used the SVM–RFE algorithm to determine the feature genes for KOA (Figure 3(c)). The top two genes with the highest accuracy were selected, and their intersection with the feature genes identified by LASSO regression yielded two common genes, namely, FOSL2 and RHoBTB1 (Figure 3(d)).

Selection of feature genes. (a) Adjustment of feature selection in LASSO. (b) The misclassification error in jackknife rate analysis. (c) SVM–RFE algorithm used for feature selection. (d) Venn diagram showing the characteristic genes identified by both LASSO and SVM–RFE algorithms and (e, f) The expression of FOSL2 and RHoBTB1 in knee osteoarthritis vs. control cohort in the GSE51588 dataset. LASSO: least absolute shrinkage and selection operator; SVM–RFE: support vector machine–recursive feature elimination.
To validate these two key genes, we downloaded the GSE51588 KOA-related dataset from the GEO public database. The results showed that the expression levels of both genes were consistent with those in GSE55235 (p < 0.05) (Figure 3(e) and (f)). The two key genes were subsequently used in our research.
Expression of key genes in an in vitro experiment
To verify the expression of FOSL2 and RHoBTB1 in KOA synovium, we established a KOA animal model and performed RT–PCR analysis. FOSL2 showed lower expression in the KOA model group than in the control group (t = 4.508, p < 0.001) (Figure 4(a)). The mRNA level of RHoBTB1 in the KOA model group increased significantly compared with that in the control group (t = −2.199, p = 0.041) (Figure 4(b)).

Validation of the key genes. (a, b) RT–PCR expression of FOSL2 and RHoBTB1 in the synovial membrane of knee osteoarthritis mice and control mice. All experiments were performed in triplicate, and data are expressed as mean ± SEM (*p-value <0.05; ns, no significance). RT–PCR: reverse transcription–polymerase chain reaction; SEM: standard error of the mean.
Analysis of the genetic basis of KOA
As shown in Figure 5(a), significant single nucleotide polymorphism (SNP) loci associated with KOA were identified using GWAS data. We described the key SNP loci distributed in the enriched regions by locating the GWAS data (Figure 5(b)). We also demonstrated the pathogenic regions of FOSL2 and RHoBTB1, which were located on chromosomes 2 and 10, respectively (Figure 5(c) and (d)).

GWAS analysis of the genetic basis of KOA. (a) The SNP loci associated with KOA identified using the GWAS data. (b) The key SNP loci distributed in the enriched regions and (c, d) The pathogenic regions of FOSL2 and RHoBTB1 located on chromosomes 2 and 10, respectively. GWAS: genome-wide association study; KOA: knee osteoarthritis; SNP: single nucleotide polymorphism.
Key genes and immune cell infiltration
Figure 6(a) shows the immune cell composition of each patient, and Figure 6(b) presents multiple significant correlation pairs between the immune cell infiltration levels. Patients with KOA showed higher levels of plasma cells, CD8 T cells, Tregs, and resting mast cells than control patients (Figure 6(c)). Additionally, our investigation revealed strong correlations between key genes and immune cells. Specifically, FOSL2 exhibited positive correlations with activated mast cells and resting CD4 memory T cells, whereas it showed negative correlations with resting mast cells and CD8 T cells (Figure 6(d)). In contrast, RHoBTB1 displayed positive correlations with CD8 T cells and resting mast cells, whereas it showed negative correlations with activated mast cells and resting CD4 memory T cells (Figure 6(e)).

Differences in the landscape of immune cell infiltration between KOA mice and control mice. (a) The relative immune cells in the patient samples from the GSE55235 dataset. (b) A heatmap showing the correlation between the infiltration of innate immune cells using CIBERSORT. (c) Violin plot showing the differences in immune cell infiltration levels between KOA mice and control mice. Control mice are marked in blue color, and KOA mice are marked in red color. A p-value of <0.05 was considered to indicate statistical significance and (d, e) Correlation between FOSL2 and RHoBTB1 and the infiltration level. KOA: knee osteoarthritis.
Specific signaling pathways associated with FOSL2 and RHoBTB1
GSEA revealed that FOSL2 was mainly enriched in signaling pathways involving adipocytokines, spliceosomes, p53, MAPK, and cysteine and methionine metabolism (Figure 7(a)–(e)). RHoBTB1 was primarily enriched in signaling pathways such as Fc gamma R-mediated phagocytosis, primary immunodeficiency, asthma, lysosome, and intestinal immune network for IgA production (Figure 7(f)–(j)).

Enrichment analysis of the pathways involving the key genes. (a–e) The high expression pathways of FOSL2. (f–j) The high expression pathways of RHoBTB1.
Regulatory network of transcription factors
Enrichment analysis was performed using the cumulative enrichment curves of transcription factors. The motif–transcription factor annotation analysis showed that the motif with the highest NES (4.23) was cisbp_M1137 (Figure 8). FOSL2 and RHoBTB1 were both enriched in this motif. The results also showed that the transcription factors MEIS1, MEIS2, MEIS3, PKNOX1, PKNOX2, TGIF1, TGIF2, TGIF2LX, and TGIF2LY were the main regulatory factors in the gene set. All enriched motifs and corresponding transcription factors for the key genes are presented in Supplementary Figure 1.

Transcriptional regulation analysis of FOSL2 and RHoBTB1.
Correlation between key genes and regulatory genes
Using the GeneCards database, we identified 3032 pathogenic genes associated with KOA and analyzed the expression levels of the top 20 genes. We found that CIITA, IL10, IL-1β, IL2RA, IL6, IRF5, and PSTPIP1 were differentially expressed between the disease and control groups (Figure 9(a)). Furthermore, we conducted a correlation analysis between these key genes and regulatory genes associated with KOA. We observed significant correlations between the expression levels of the key genes and several genes related to KOA. Notably, RHoBTB1 showed a significant negative correlation with IL-1β (Pearson r = −0.73), whereas FOSL2 showed a significant positive correlation with IL-1β (Pearson r = 0.73) (Figure 9(b)).

Correlation between the key genes and regulatory genes in GeneCards. (a) Expression levels of the top 20 differentially expressed genes between the disease and control groups and (b) Correlation analysis between FOSL2 and RHoBTB1 expression with that of IL-1β using the Pearson correlation coefficient.
Potential therapeutic drugs
We further conducted a reverse prediction of the microRNAs (miRNAs) of the two key genes using the mircode database and identified 64 miRNAs and 100 mRNA–miRNA pairs. We visualized the results using Cytoscape (Figure 10(a)). In addition, we used the CMap database to predict drugs that can be used to target the top 150 upregulated and downregulated genes. The results showed that the drug-induced expression profiles of prostratin, Tyrphostin_AG_126, triciribine, and azacitidine were significantly negatively correlated with the disease-induced expression profiles, indicating that these drugs can alleviate or even reverse the disease state (Figure 10(b)).
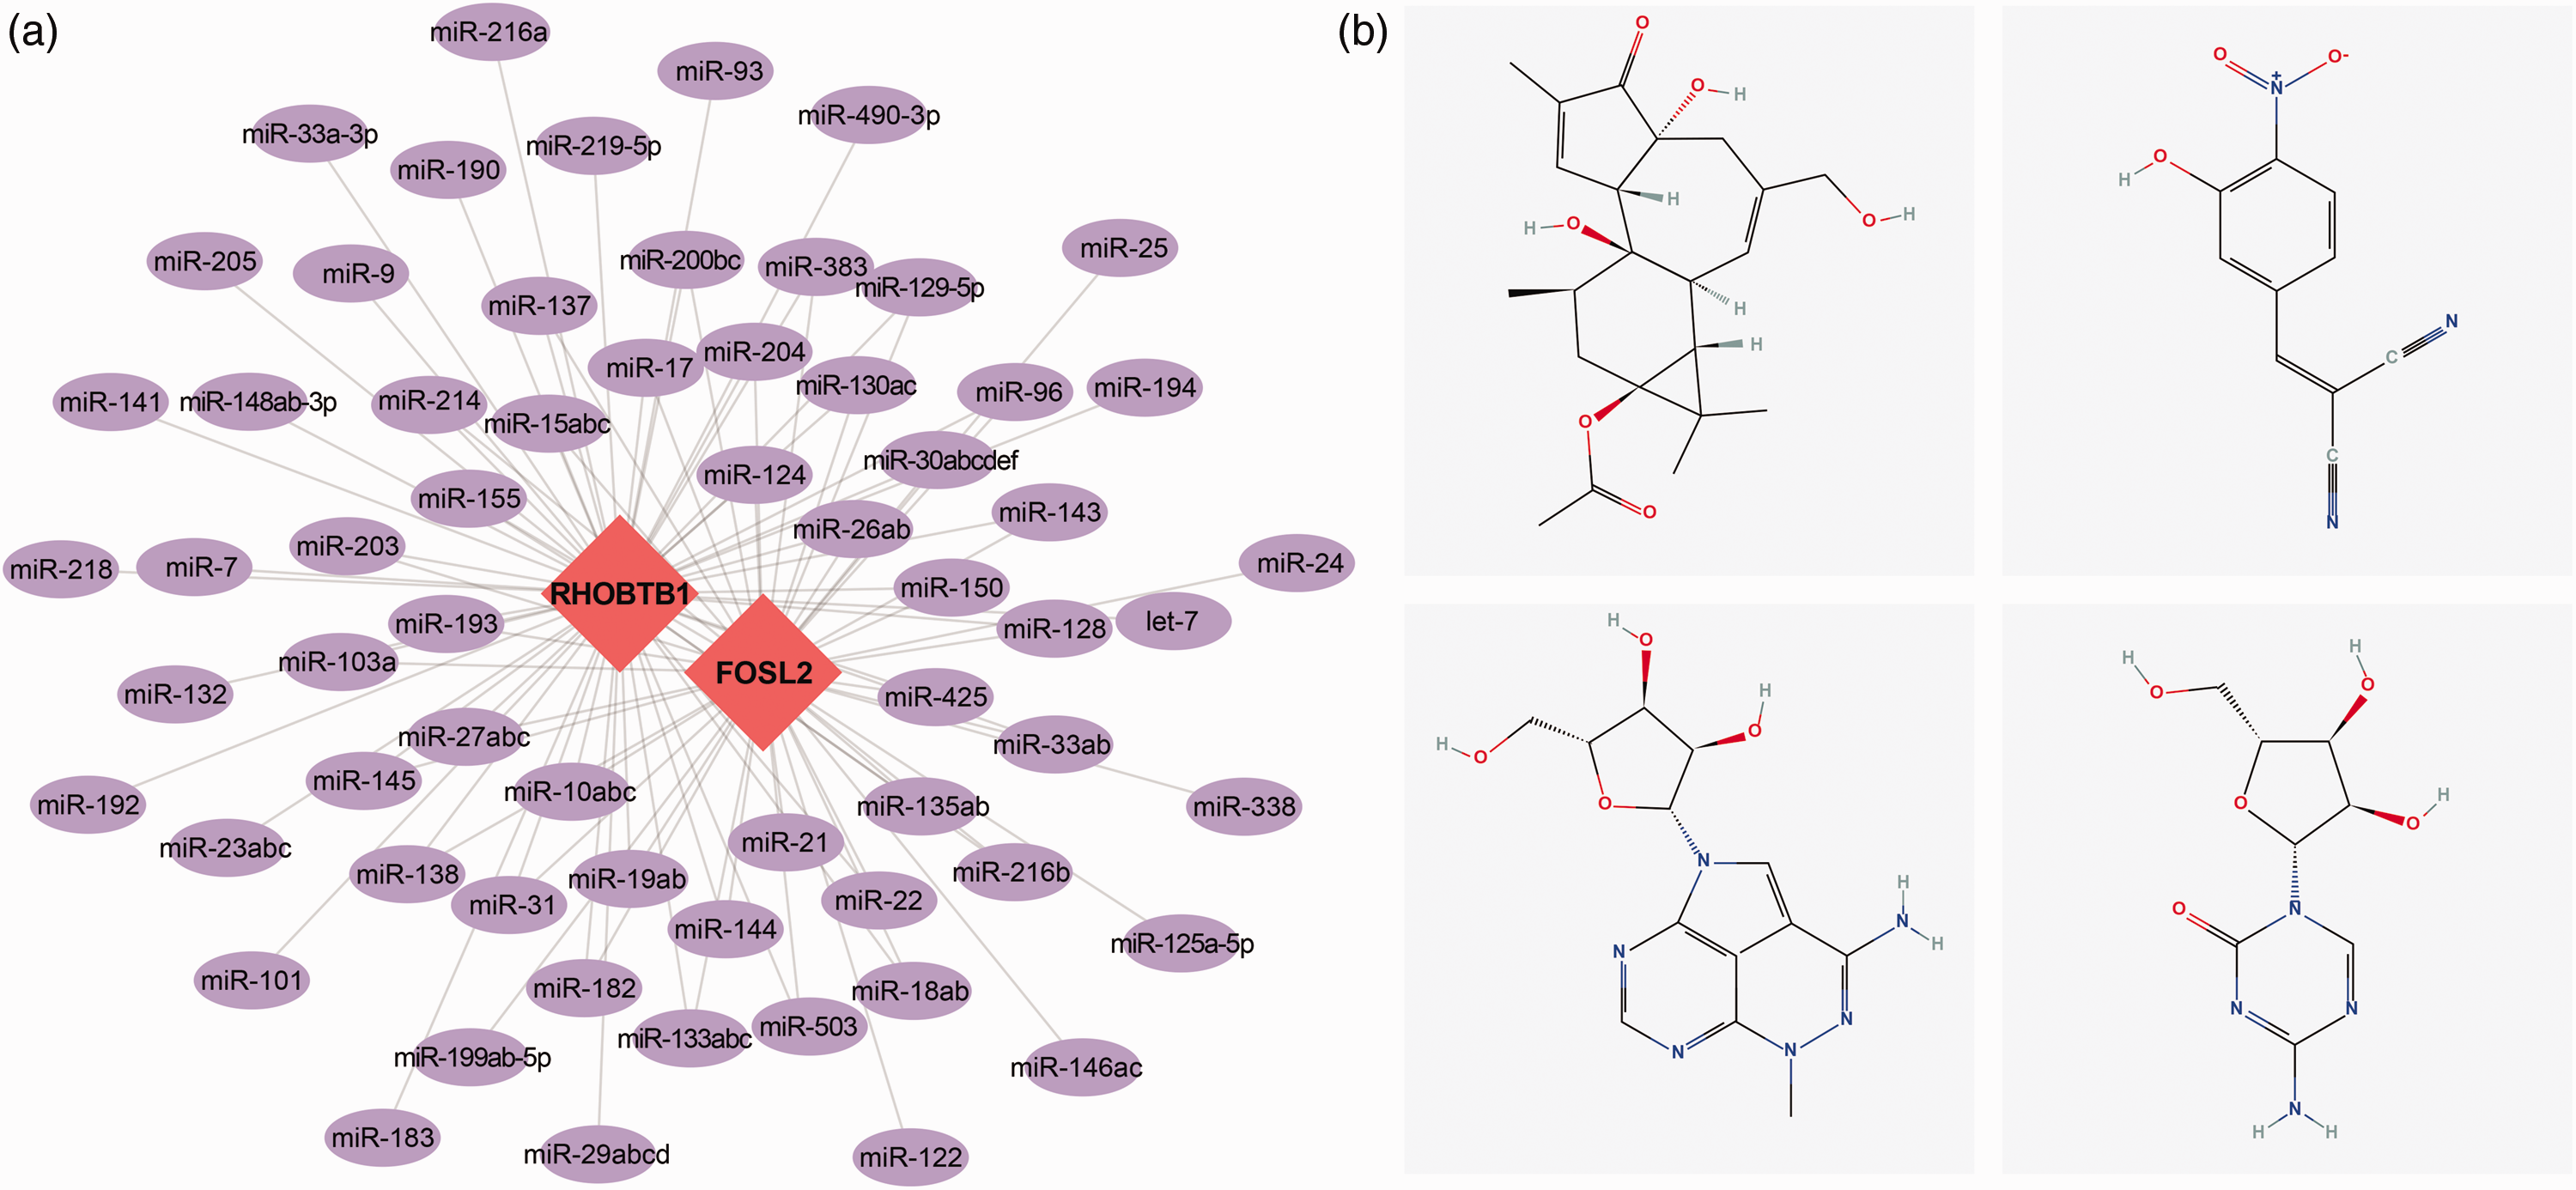
Potential therapeutic drugs. (a) Reverse prediction of microRNAs that can potentially target the key genes involved in KOA and (b) Potential therapeutic compounds corresponding to the key genes in KOA.
Expression of key genes in single-cell RNA-seq
We downloaded single-cell data from the GSE176308 dataset and performed PCA to identify potential batch effects between the samples. Our results indicated that the batch effects were not significant (Figure 11(a)). Using the t-SNE algorithm, we performed cell clustering and annotated each subtype using the “HumanPrimaryCellAtlasData” function of the ‘SingleR’ package in R software. All subtypes were annotated to the cell categories chondrocytes and tissue stem cells (Figure 11(b)). The expression levels of the two key genes, FOSL2 and RHoBTB1, in these two cell types are shown in Figure 11(c) and (d).

Expression of the key genes in single-cell RNA sequencing. (a) The use of PCA to identify potential batch effects between the samples. (b) Subtypes annotated to chondrocytes and tissue stem cells and (c, d) The expression levels of FOSL2 and RHoBTB1 in chondrocytes and tissue stem cells, respectively.
Discussion
Synovitis induces the emergence and advancement of joint disease symptoms and can have a detrimental impact on the overall quality of life of patients. 20 The pathogenesis of synovitis remains unclear and requires further research. In this study, we used a systems biology approach to identify key genes and regulatory pathways involved in the development of KOA synovium.
This study identified FOSL2 and RHoBTB1 as the key genes involved in the synovium of KOA through a comprehensive analysis that encompassed machine learning algorithms, functional enrichment analysis, validation through external datasets, and in vitro animal models. Our findings suggest that these genes play a crucial role in the pathogenesis of KOA, which may involve regulating the inflammatory response, immune effector process, osteoclast differentiation, and ossification pathways. Moreover, a correlation analysis of the key genes with immune cell infiltration levels revealed that FOSL2 and RHoBTB1 were associated with specific immune cell populations, highlighting their potential as therapeutic targets for KOA. Furthermore, our GWAS and GSEA analyses provided additional insights into the genetic and signaling pathways involved in KOA pathogenesis, whereas transcription factor prediction and CMap analysis revealed potential novel regulatory mechanisms and small-molecule compounds, respectively.
FOSL2 is a member of the Fos family and acts as a component of the AP-1 transcription complex. 20 It is a leucine-zipper transcription factor that is highly expressed in various organs, such as the ovaries, stomach, small intestine, large intestine, brain, lungs, and heart.21–26 RHoBTB1 is composed of a GTPase domain, two BTB (bric a brac, tramtrack, and broad complex) domains, a proline-rich domain, and a C-terminal domain. Its expression levels are high in skeletal muscles and placenta and moderately high in organs such as the stomach, kidneys, testis, adrenal gland, and uterus.27–30
The immunological microenvironment is a complex composition of immune-related fibroblasts, immune cells, extracellular matrix, various growth factors, inflammatory factors, and distinct physicochemical features, which can considerably affect disease diagnosis, clinical sensitivity, and survival outcomes. Although KOA is not inherently immune-driven, immune-related inflammatory dysregulation may amplify pathology in patients with KOA. Notably, RHoBTB1 showed a significant negative correlation with IL-1β, whereas FOSL2 showed a significant positive correlation with IL-1β. The analysis of the relationship between FOSL2 and RHoBTB1 and immune cell infiltration levels in the disease dataset confirmed that these two key genes are closely associated with immune cell infiltration levels and play essential roles in shaping the immunological microenvironment. However, the identified genes have not been directly proven to be responsible for the occurrence and progression of KOA. Further experimental studies are needed to elucidate potential causal relationships and the mechanistic roles of these genes in KOA pathogenesis.
Previous studies have demonstrated the involvement of FOSL2 in various developmental and immune processes, including macrophage differentiation, regulation of inflammatory cytokines, control of bone formation, and fibroblast activation.30–33 FOSL2 also plays a role in the differentiation of Tregs, Th17, and invariant natural killer T cells and has been implicated in the modulation of autoimmunity and inflammation. 20 Furthermore, several GWAS have highlighted an association between SNPs in the FOSL2 promoter region and autoimmune diseases such as Crohn’s disease and ulcerative colitis as well as conditions such as asthma and eczema.34–36 To the best of our knowledge, no prior studies have reported an association between RHoBTB1 and the synovium. These results have drawn attention to RHoBTB1 as a potential tumor suppressor gene due to its decreased expression in various human cancers. Moreover, RHoBTB1 has been linked to the pathogenesis of several human diseases. For example, it acts as a substrate adapter between the Cullin-3 RING ubiquitin ligase and phosphodiesterase 5 to mediate the protective effect exerted by peroxisome proliferator-activated receptor gamma (PPARγ) on vascular smooth muscle cells. 37 The mRNA level of RHoBTB1 has been reported to decrease in osteoclasts during bone resorption and in mononuclear cells in the peripheral blood of individuals with metabolic syndrome.38,39 In contrast, the mRNA level of RHoBTB1 has been found to be upregulated in cumulus cells in vitro in matured oocytes that successfully developed into blastocysts and in mononuclear cells in the peripheral blood of patients with locoregional breast cancer and chemotherapy-induced fatigue. 20 Therefore, exploring the downstream targets of PPARγ, including RHoBTB1, may help uncover novel antihypertensive targets that preserve the beneficial effects of PPARγ activation while avoiding the adverse effects of thiazolidinediones-mediated PPARγ activation. 40 Our findings suggest the potential immunological regulatory roles of FOSL2 and RHoBTB1 in KOA synovium.
The identification of FOSL2 and RHoBTB1 as key genes in KOA synovium opens up new avenues for potential therapeutic interventions. These genes could serve as targets for novel drug development or as biomarkers for disease progression and treatment response. For instance, modulating the expression or activity of these genes might help regulate the inflammatory response and immune cell infiltration in KOA synovium, potentially slowing disease progression or alleviating symptoms.
Limitations and future directions
Despite the comprehensive approach used in this study, several limitations should be acknowledged. First, the small sample size in our in vivo validation experiments may limit the generalizability of our findings. Although we used advanced machine learning techniques such as LASSO and SVM–RFE for feature selection to mitigate this issue, larger-scale studies are needed to confirm our results. Second, our reliance on publicly available datasets, while providing a wealth of data, may introduce biases or inconsistencies inherent to these datasets. Future studies should aim to validate these findings using prospectively collected, well-characterized cohorts.
Furthermore, the use of a mouse model for in vivo validation, necessitated by ethical constraints in obtaining normal human synovial tissue, may not fully recapitulate the human disease process. Species-specific differences in gene expression and regulation should be considered when interpreting these results. Additional research using human tissue samples, when ethically possible, would provide more direct translatable findings.
Conclusions
Our study suggests that FOSL2 and RHoBTB1 play potential roles in the pathogenesis of KOA, exhibiting correlations with immune cell infiltration. These findings, based on machine learning screening and preliminary in vivo validation, indicate that these genes have potential as therapeutic targets. However, further research and validation are necessary to confirm their exact roles and therapeutic potential in KOA.
Footnotes
Acknowledgements
We would like to thank Jiangxi Zhonghong Boyuan Biotechnology Co., Ltd for providing the animal laboratory for this study. We would like to specifically thank all the participants who volunteered for this research.
Author contributions
Kun Gao designed the study and revised the manuscript. Zhenyu Huang and Zhouwei Liao performed data analysis and in vivo experiments and drafted the manuscript. Yanfei Wang and Dayu Chen combined the data and performed analysis. All authors have read and approved the final manuscript.
Data availability statement
The data that support the findings of this study are available from the corresponding author upon reasonable request.
Declaration of conflicting interest
The authors declare that they have no conflict of interest.
Funding
This work was supported by grants from the program of the National Natural Science Foundation of China (82104884); Guangdong Basic and Applied Basic Research Foundation (2020A1515110559); and Sanming Project of Medicine in Shenzhen (No.SZZYSM202211004).
Supplementary material
Supplemental material for this article is available online.