
Abstract
In recent years, remarkable advancements in elucidating the intricate molecular underpinnings of type 2 diabetes mellitus (T2D) have been achieved. Insulin resistance (IR) has been unequivocally acknowledged as the driving pathogenetic mechanism of T2D, preceding disease onset by several years. Nonetheless, diagnostic tools for ascertaining IR are lacking in current clinical practice, representing a critical unmet need; use of the hyperinsulinemic-euglycemic glucose clamp, widely accepted as the gold standard method for evaluating IR at present, is cumbersome in a clinical setting. Thus, the development of well-validated, reliable, and affordable biomarkers of IR has attracted considerable attention from the research community. The biomarkers under investigation can be divided into two major categories: (1) indices or ratios, comprising parameters obtained from a basic or comprehensive metabolic panel and/or derived from anthropometric measurements, and (2) circulating molecules implicated in pathophysiological processes associated with IR. Furthermore, numerous novel biomarkers, including markers of β-cell dysfunction, radiographic quantification of excess visceral adipose tissue, T2D prediction models, certain microRNAs and metabolomic biomarkers, have also provided promising preliminary results. This narrative review aims to present current evidence pertaining to the most notable and exciting biomarkers of IR that are under rigorous evaluation.
Keywords
Introduction
Insulin is an endocrine peptide hormone secreted by pancreatic β-cells that binds to target-cell plasma membrane-bound receptors to orchestrate an integrated anabolic response to nutrient availability. 1 Insulin resistance (IR) is identified as the attenuated biological response to insulin stimulation of peripheral tissues, primarily liver, adipose, cardiac and skeletal muscle, so that a given concentration of insulin elicits a less-than-expected physiological effect. 2 IR has long been recognized as the pivotal etiologic component of type 2 diabetes mellitus (T2D) and metabolic syndrome (MetS). As the incidence of T2D and MetS are increasing at a staggering rate worldwide, being considered 21st-century pandemics by a large body of literature, deciphering the significance of IR has garnered considerable research interest.3,4
Recent clinical studies have shed more light on the fundamental role of IR in T2D disease pathogenesis. Prediabetes, characterized by disrupted glucose homeostasis that is not yet severe enough to meet T2D criteria and with pathophysiologic roots in IR, has an estimated duration of 7.8–9.8 years until, eventually, approximately 70% of patients progress to T2D. 5 In another line of evidence, individuals with IR are indicated to face a 5–10% annual risk of progressing to T2D. 6 Meanwhile, a randomized clinical trial (RCT) of 2 766 participants at increased risk of T2D showed that lifestyle intervention and metformin administration resulted in decreased incidence rates of T2D by 34% and 18%, respectively, compared with placebo, after a median follow-up period of 5.7 years, and the delay or prevention of T2D onset with these therapeutic strategies reportedly may persist for at least 10 years. 7 Furthermore, a meta-analysis comprising 12 RCTs evaluating the effect of lifestyle interventions and 9 RCTs evaluating the effect of oral antidiabetic therapy in the progression rate to T2D in participants with impaired glucose tolerance, revealed that the pooled effect of all forms of lifestyle interventions (diet and exercise) and the pooled effect of all antidiabetic agents led to a 49% and 30%, respectively, lower incidence of T2D in individuals with impaired glucose tolerance compared with placebo. 8
Considering the above, it may be reasonably concluded that T2D has a progressive nature, at the heart of which lies the presence of IR. Unfortunately, this well-established knowledge has yet to find its niche in clinical practice and be translated into benefit for individuals at risk of T2D, as current international guidelines continue to handle T2D as a binary entity, which is either ‘present’ or ‘absent’ based on test results. Furthermore, it is plausible to consider that the prolonged period of IR that precedes T2D development represents a critical ‘window period’ in which lifestyle and/or pharmacological interventions can be implemented, effectively decelerating or altogether halting the progression to T2D and its ensuing complications. Once T2D is established, therapeutic strategies may be less efficient, as long-term sustained regression from T2D to normoglycemia is considered a marginal event in the general population.9,10
While unequivocally accepted as the central culprit of T2D etiopathogenesis, IR is gradually becoming recognized as a multifaceted syndrome. Accruing evidence indicates that IR is associated with the emergence of multiple cardiometabolic disorders, including obesity, hypertension, atherogenic dyslipidemia, chronic low-grade inflammation, endothelial dysfunction, oxidative stress and a prothrombotic milieu.11–17 Through all of these pathophysiologic pathways, IR leads to accelerated atherosclerosis in the vasculature and, ultimately, an increased risk of cardiovascular disease (CVD), as evidenced by observational studies.18,19 Thus, as stated by Haffner et al. 20 in 1990, the clock starts ticking for cardiovascular complications long before clinical T2D is established.
Based on all the available evidence, it is appropriate to conclude that a diagnostic method allowing the early and accurate identification of IR would be an invaluable tool in the hands of the clinician. The hyperinsulinemic-euglycemic clamp is considered the gold standard method to assess insulin sensitivity at present, albeit remaining a poor candidate in real-world practice due to its expensive, laborious, and time-consuming character.21,22 Thus, well-validated, reliable, and affordable biomarkers of IR are urgently needed, and great leaps forward have been observed in this direction. The biomarkers of insulin sensitivity that are currently being evaluated can be divided into two broad categories: (1) indices or ratios that comprise parameters obtained from a basic or comprehensive metabolic panel (e.g., fasting glucose, fasting insulin, triglycerides [TG], and high-density lipoprotein cholesterol [HDL-C]), and/or anthropometric measurements (e.g., body mass index [BMI], waist circumference, and waist-to-height ratio), and (2) circulating biomarkers that reflect pathogenic processes associated with IR, which include a variety of systemic markers of inflammation and certain biologically active molecules secreted from adipose tissue, collectively known as adipokines. Furthermore, novel biomarkers of IR, including markers of β-cell dysfunction, radiographic quantification of excess visceral adipose tissue, T2D prediction models, and specific microRNAs (miRNAs) and metabolic biomarkers, have also provided encouraging results in preliminary trials, thereby warranting further research. In the present narrative review, the current scientific and clinical evidence pertaining to the most prominent biomarkers of insulin sensitivity that are under active investigation are presented and discussed.
Homeostasis model assessment for insulin resistance (HOMA–IR) index
The maintenance of glucose homeostasis is dependent upon a finely balanced dynamic interplay between insulin sensitivity, β-cell function, and insulin clearance; any disruption of this interplay leads to derangement of the equilibrium between glucose and insulin plasma values in the basal state. 23 When IR is present, a compensatory increase in pancreatic β-cell insulin production occurs, leading to hyperinsulinemia, so that euglycemia is maintained.24,25
Hyperinsulinemia may also exacerbate IR, often leading to a vicious cycle of IR and hyperinsulinemia, wherein both are results and drivers, which eventually culminates in β-cell failure. 26 Therefore, IR and hyperinsulinemia are closely linked and rarely exist in isolation in a nondiabetic population. 27 In light of this knowledge, many indices comprising circulating insulin and glucose levels have been formulated, with the Homeostasis Model Assessment for Insulin Resistance (HOMA-IR) index being the most renowned.
The HOMA-IR index was first described by Matthews et al. 28 in 1985, and is calculated according to the following equation: HOMA-IR index = (fasting insulin [mU/L] × fasting glucose [nmol/L]/22.5).
Although many cutoff points have been proposed for diagnosing different pathological entities, there has yet to be a scientific consensus regarding optimal cutoffs. For the identification of IR, cutoff points including 1.37, 1.6, 1.62, and 1.82 have been proposed.29–32 HOMA-IR reference values are generally indicated to differ considerably depending on age, gender, ethnic background, and the presence or absence of cardiometabolic risk factors, possibly due to the complexity of IR pathophysiology.33–36 Therefore, reference intervals should be identified from trials conducted within the population of interest, and the interpretation of HOMA-IR values may require a personalized approach.
Since its advent, the evaluation of HOMA-IR has attracted considerable research interest. Firstly, HOMA-IR presented a strong correlation with the results of the hyperinsulinemic-euglycemic clamp.37,38 These early findings were subsequently corroborated in observational studies. Most notably, in a prospective cohort study of 4 314 individuals younger than 65 years without T2D at baseline, 164 (3.8%) of the participants developed T2D during a mean follow-up period of 9.9 years. In this setting, values of HOMA-IR in the highest tertile (HOMA-IR ≥ 1.84) were robustly associated with new-onset T2D (Odds Ratio [OR] 1.86 [95% confidence interval {CI} 1.17, 2.96]) after adjustment for laboratory variables and BMI. 39 In another trial of 3 101 normoglycemic people aged 20–70 years, an increment of HOMA-IR by a standard deviation (SD) was associated with a 92% increased incidence of T2D, as well as with higher incidence of prediabetes of both impaired glucose tolerance (42%) and impaired fasting glucose (43%) subtypes, during a follow-up period of 6 years. 40
Meanwhile, in a prospective cohort study of 17 878 individuals without a history of T2D at baseline, 732 (4.1%) incident T2D cases were identified over a median follow-up period of 3.5 years. Values of HOMA-IR > 1.72 (highest quartile) were significantly associated with T2D risk (OR 4.23 [95% CI 3.35, 5.35]). 41 The largest prospective cohort study to date recruited 94 952 participants without T2D at baseline, of whom 6 484 (6.8%) developed incident T2D during a median follow-up period of 3.1 years. In this context, the highest quartile of HOMA-IR (HOMA-IR ≥ 2.06) was associated with a greater risk of T2D (Hazard Ratio [HR] 6.70 [95% CI 6.08, 7.39]) versus the lowest quartile (HOMA-IR ≤ 0.94). 42 Furthermore, a systematic review and meta-analysis of 19 studies, including a total of 161 032 participants, demonstrated that higher values of HOMA-IR were significantly associated with an increased risk of T2D (HR 1.87 [95% CI 1.40, 2.49]). 43
Apart from its association with IR and T2D, several studies have demonstrated a good diagnostic value of HOMA-IR as an early marker of metabolic dysfunction–associated steatotic liver disease (MASLD), which is regarded as the hepatic component of MetS.44,45 Moreover, elevated HOMA-IR values have been associated with an increased risk of CVD, chronic kidney disease, and increased carotid intima-media thickness.19,39,46–48 These findings align with the pioneer study of Després et al. 49 in 1996, which supported the concept that high fasting insulin concentrations may be an independent predictor of ischemic heart disease in men.27,49
A handful of indices that encompass glucose and/or insulin concentrations have been developed, and their association with IR is under thorough examination. 50 The McAuley index, the Quantitative Insulin Sensitivity Check Index, and the Insulin Sensitivity Index (ISI0,120) are only a few of the widely utilized IR measurements in clinical research (summarized in Table 1).40,50–54 Indicatively, the ISI0,120 is derived from a formula reported by Gutt et al. 54 in 2000 that incorporates both fasting and 2-h post-load glucose and insulin plasma levels derived from a 75 g oral glucose tolerance test. 54 In a prospective cohort study of 3 574 subjects without T2D at baseline, 343 (9.6%) incident T2D cases were diagnosed during a follow-up period ranging from 5 to 8 years. In this context, ISI0,120 yielded the highest prognostic value (unadjusted area under the receiver operator characteristic [AROC]: 78.5%) for new-onset T2D among the 19 indices included in the study, which was further enhanced after adjustment for age, gender, systolic blood pressure, HDL-C, and BMI (adjusted AROC: 81.6%). Indicatively, the predictive performance of HOMA-IR was significantly lower (unadjusted AROC: 62.8%, adjusted AROC: 76%). 55 However, further large-scale studies are needed to draw concrete conclusions regarding the determination of diagnostic accuracy for each index and identification of the best-performing index.
Equations of the indices of insulin sensitivity - resistance.

HOMA-IR, homeostasis model assessment for insulin resistance; QUICKI, quantitative insulin sensitivity check index; ISI0,120, insulin sensitivity index; TG, triglycerides; HDL-C, high-density lipoprotein cholesterol; MetS-IR, metabolic score for insulin resistance; SPISE, single-point insulin sensitivity estimator; LAP, lipid accumulation product; VAI, visceral adiposity index; TyG, triglyceride-glucose; BMI, body mass index; WC, waist circumference; WHtR, waist-to-height ratio; Exp, exponential function; OGTT, oral glucose tolerance test.
Although the HOMA-IR index was among the first biomarkers proposed for the detection of IR and has been extensively assessed in epidemiological studies for more than 35 years, having provided satisfactory and consistent results in most studies, some important disadvantages of this biomarker should also be taken into consideration. As stated earlier, the HOMA-IR reference values are influenced by numerous factors, including age, gender, ethnicity, and cardiovascular parameters, making interpretation of the results a challenging endeavor for physicians in clinical practice.33–36 Meanwhile, the measurement of fasting insulin concentration involves costly procedures, complex methodologies, and elaborated sample management and storage, and is not readily available in all laboratories. 56 Furthermore, the absence of a standardized method for insulin measurement is considered an important caveat of HOMA-IR. 57 The coefficient of variation for HOMA-IR varies considerably (up to 23.2% in one study) depending upon the type of insulin assay used, and hence the reported results are not comparable between studies, making only qualitative comparisons possible.58–60 In addition, the underlying biological variability in fasting insulin levels, arising from the combination of its short serum half-life, the known cyclicity of insulin secretion, and the rapid responsiveness to changes in hormonal and metabolic milieu, represents another major drawback of the HOMA-IR. This may partially be overcome by calculating the average fasting insulin concentration of two or more baseline samples, at the expense of making the procedure more invasive and less cost-effective.61,62 Consequently, these disadvantages pose critical limitations on the applicability of the HOMA-IR index as a biomarker of IR in current clinical practice, providing rationale and grounds for cautious optimism regarding its potential future diagnostic application in this context.
Triglycerides to HDL-C (TG/HDL-C) ratio
Since the first evidence of a potential causal relationship between IR and impaired plasma lipid profile approximately 55 years ago, IR is now well-established to result in a cluster of lipid abnormalities, known as atherogenic diabetic dyslipidemia: (1) hypertriglyceridemia, (2) decreased circulating HDL-C values, and (3) elevation of small-dense low-density lipoprotein cholesterol (sdLDL-C) particles, which are highly atherogenic.63–66 Frequently, diabetic dyslipidemia precedes T2D onset by several years, suggesting that the aberrant lipid metabolism may be an early event in the progression to T2D.67–70 Utilizing this knowledge, the TG/HDL-C ratio has emerged as a valuable indicator of IR.
As with the HOMA-IR index, the optimal TG/HDL-C ratio cutoff point for detecting IR remains elusive. In certain trials, cutoff points of 2 and 3 have been found to provide the best diagnostic efficiency for identifying IR, and hence it makes sense to consider that the ideal cutoff point for TG/HDL-C ratio would be between 2 and 3.71–73 It is also suggested that a single cutoff point may not be appropriate across diverse ethnic origins, while the effect of genetic and environmental influences on serum lipid levels pose an additional barrier in the interpretation of the results. 73
The potential association between TG/HDL-C ratio and IR was first reported by McLaughlin et al. 74 in 2003, spurring intense interest in assessing its efficiency as a marker of IR, MetS, and other pathologic conditions. The primary objective of that cross-sectional study, comprising 258 overweight volunteers (BMI ≥ 25 kg/m2) with no previous diagnosis of T2D or hypertension, was to assess the diagnostic performance of metabolic markers, including TG/HDL-C ratio, in detecting IR based on a modification of the insulin suppression test. According to the data analysis and interpretation, TG/HDL-C ratios ≥ 3.0 in overweight individuals might serve as a valuable tool (AROC: 0.781, sensitivity: 64%, specificity: 68%) for identifying IR.74,75
Several trials have provided plentiful data that support using the TG/HDL-C ratio as a reliable predictor of IR and T2D development.76–85 Most interestingly, in a prospective cohort study of 8 655 participants without T2D at baseline, 1 437 (16.6%) developed T2D during the 12-year follow-up period. The highest TG/HDL-C ratio quartile (TG/HDL-C ratio ≥ 4.6) was revealed to be associated with an increased incidence of T2D (HR 2.54 [95% CI 2.14, 3.02]) compared with the lowest quartile (TG/HDL-C ratio ≤ 2.0) after adjusting for HOMA-IR and C-reactive protein (CRP). 83 Similar results were obtained from a retrospective study of 80 693 nondiabetic subjects aged between 40 and 79 years. Within a median follow-up period of 5.9 years, 4 093 (5.1%) incident cases of T2D were recorded (either prescription of an antidiabetic agent or fasting glucose ≥ 126 mg/dl), and elevated TG/HDL-C ratio was positively associated with T2D (Area Under the Curve [AUC]: 0.604). However, its predictive power was inferior to that of fasting glucose (AUC: 0.708). 84 Last but not least, the largest-scale trial of TG/HDL-C thus far was conducted in a retrospective manner and included 120 613 nondiabetic participants. After a mean follow-up duration of 6.0 years, 6 080 (5%) incident cases of T2D were ascertained, and TG/HDL-C ratio ≥ 2.1 was substantially linked to the risk of incident T2D (AUC: 0.679) at 10 years, outperforming the prognostic accuracy of TG (TG ≥ 106 mg/dL, AUC: 0.672), HDL-C (HDL-C ≤ 54 mg/dL, AUC: 0.638) and low-density lipoprotein cholesterol (LDL-C) serum levels (LDL-C ≥ 124 mg/dL, AUC: 0.609). 85
TG/HDL-C ratio appears to be an appealing marker of IR, as it offers a handful of advantages. To begin with, TG and HDL-C levels are affordable and accessible laboratory tests that are more commonly assessed than serum insulin concentration for CVD risk stratification. Furthermore, its calculation is relatively simple compared with other indices. Beyond these features, the TG/HDL-C ratio has also emerged as an independent predictor of IR according to current evidence, not being affected by confounding factors.83,86,87 Increased TG/HDL-C ratio has also been positively correlated with the presence of sdLDL-C phenotype, with increased risk for MetS, coronary artery disease, peripheral arterial disease, cerebrovascular disease, and long-term all-cause mortality.75,88–91
Apart from the TG/HDL-C ratio, other substitute IR indices that use TG and/or HDL-C plasma levels in conjunction with other laboratory and/or anthropometric parameters have been formulated. The Metabolic Score for Insulin Resistance (MetS-IR), the Single-Point Insulin Sensitivity Estimator (SPISE) index, the Lipid Accumulation Product (LAP) index, and the Visceral Adiposity Index (VAI) are four characteristic examples that have provided positive results in serving as surrogate markers of IR (Table 1).92–96 In a cross-sectional study of 631 subjects with a diverse range of glucose tolerance and insulin sensitivity, the correlation of TG/HDL-C ratio, TyG index, LAP index and VAI with the results of hyperinsulinemic-euglycemic clamp was evaluated, and revealed that the LAP index was a more reliable discriminator of IR (AUC: 0.728) versus the TG/HDL-C ratio (AUC: 0.693), the TyG index (AUC: 0.688), and the VAI (AUC: 0.688) across different glucose tolerance categories. 97 However, high-quality evidence from large prospective cohort studies is needed to draw more definitive and reliable conclusions.
Triglyceride-glucose (TyG) index
Hypertriglyceridemia is one of the hallmarks of atherogenic diabetic dyslipidemia,63–65 and is suggested to develop in individuals with IR mainly via two mechanisms: (1) promotion of de novo lipogenesis in the liver by circulating glucose and insulin, and (2) impairment in the catabolism of very-low-density lipoprotein.98,99 Emerging data indicate that hypertriglyceridemia itself exerts a deleterious effect on peripheral insulin sensitivity and muscle glucose utilization, providing an explanation of the finding that hypertriglyceridemia may be an independent risk factor for developing T2D,100,101 and suggesting the existence of a vicious circle between IR and hypertriglyceridemia. 102 As plasma TG and glucose concentrations are routinely measured in clinical practice, a mathematical formula that includes both parameters was formulated and is being evaluated as a potential surrogate marker of IR. 103
The triglyceride-glucose (TyG) index was first described by Simental-Mendía et al. 103 in 2008, and is calculated according to the following equation: TyG index = Ln (fasting triglycerides [mg/dL] × fasting glucose (mg/dL)/2). 103
Since its advent, the TyG index has been perceived as a promising alternative marker of IR. The current benchmark method for detecting IR, the hyperinsulinemic-euglycemic clamp, has also been used to validate and compare the predictive value of different novel IR biomarkers. A study mentioned earlier, which included the use of a hyperinsulinemic-euglycemic clamp, demonstrated that the TyG index exhibits the lowest sensitivity (59%) yet the highest specificity (70%) among other indices (TG/HDL ratio, LAP index, and VAI) in identifying IR (AUC: 0.688). 97 Conversely, a cross-sectional study comprising a total of 99 individuals classified into groups according to glycemic status, demonstrated that the cutoff value of 4.68 (AUC: 0.858) yields the highest sensitivity (96.5%) and specificity (85%) in estimating IR. 104 Moreover, a prospective cohort study of 7 643 subjects without a baseline clinical history of T2D, of whom 1 306 (17.1%) developed newly diagnosed T2D during the 10-year follow-up period, demonstrated that increased TyG index (TyG index ≥4.69) predicts T2D more accurately (AUC: 0.672, sensitivity: 62.1%, specificity: 63.1%) compared with the HOMA-IR index (AUC: 0.566, sensitivity: 36.8%, specificity: 73.1%), LAP index (AUC: 0.642, sensitivity: 59.2%, specificity: 63.9%), and VAI (AUC: 0.622, sensitivity: 50.4%, specificity: 68.8%). 105
Data from an increasing number of large-scale observational studies have confirmed the efficacy of the TyG index as an indicator of IR. Most interestingly, a prospective cohort study, which included 4 543 participants who did not meet the criteria for prediabetes or T2D and had an average follow-up period of 3.25 years, demonstrated a close association between the TyG index and incidence of prediabetes (AUC: 0.60 [95% CI 0.58, 0.62]) and each 1-SD increment of TyG index resulted in a 1.38-fold increased risk of prediabetes (OR 1.38 [95% CI 1.28, 1.48]). 106 Another prospective cohort study of 7 428 individuals, aged ≥45 years, without T2D at baseline who were followed up for 3.4 years, showed that the highest quartile of TyG index was significantly correlated to an elevated risk of new-onset T2D (HR 1.73 [95% CI 1.38, 2.16]) versus the lowest quartile, after adjusting for confounding variables. In addition, every SD increase in the TyG index was associated with a 22% higher risk of developing T2D. 107 Similarly, a meta-analysis of 14 cohort studies, including a total of 270 229 subjects, reported that the TyG index is robustly associated with the incidence of T2D (unadjusted relative risk [RR] 4.68 [95% CI 3.01, 7.29]; adjusted RR 3.54 [95% CI 2.75, 4.54]). 108
As TG and glucose serum concentrations are routinely obtained in clinical practice and can be incorporated into databases, large-scale studies evaluating the TyG index can be conducted in a timely and efficient manner. In this regard, a retrospective cohort study of 201 298 individuals without T2D at baseline, and with an average follow-up of 3.12 years, documented that a raised TyG index was independently correlated with a greater risk of incident T2D (HR 3.34 [95% CI 3.11, 3.60]). Additionally, compared with the lowest quartile (TyG index < 7.93), individuals with the top TyG index quartile (TyG index ≥ 8.73) demonstrated an approximately 6-fold greater risk of developing T2D (adjusted HR 6.26 [95% CI 5.15, 7.60]). 109 Similarly, a recently published prospective cohort study, which recruited 141 243 individuals aged 35–70 years and had a median follow-up period of 13.2 years, reported that the highest tertile for TyG index (TyG index ≥ 8.81) was associated with increased risk of incident T2D (HR 1.99 [95% CI 1.82, 2.16]) compared with the lowest tertile (TyG index < 8.27). 110
Among all surrogate biomarkers, HOMA-IR is the most widely used method to assess the degree of insulin sensitivity. 111 As stated earlier, the dependence on laboratory determination of fasting insulin concentration renders HOMA-IR a less accessible index than the TyG index in daily practice. 112 Meanwhile, several lines of evidence have also indicated that the TyG index may be a more accurate and cost-effective diagnostic tool than HOMA-IR for predicting IR, MetS, and arterial stiffness.105,111–116 Lastly, the TyG index may also serve as a reliable indicator of CVD.117,118
The ceaseless pursuit of the perfect biomarker of IR continues; with current investigation as to whether the inclusion of other variables in the above-defined TyG equation may further strengthen its diagnostic performance. Indeed, modified TyG indices, such as TyG-BMI, TyG-waist circumference, and TyG-waist-to-height ratio, exhibit a strong association with T2D risk, which may be superior to that of the TyG index (Table 1).119–122
Using a mathematical model to assess IR brings all the benefits discussed above. However, TG levels vary according to age, ethnicity, underlying disease, genetic and environmental factors, as well as several other parameters, posing a challenge in interpreting TyG index values.123–125 Consequently, the optimal TyG index cutoff point for identifying IR has yet to be determined; although cutoff points between 4.0 and 5.0, amongst others, have been proposed.104,105,126
Equations of the indices discussed herein that comprise glucose, insulin, TG and/or HDL-C serum levels, are summarized in Table 1.
Inflammatory markers
As alluded to earlier, advanced molecular insights into the mechanisms underlying IR have been attained in recent years, and chronic, low-grade inflammation is now well-established as an integral component of IR, acting as the initial determining step that leads to a decrease in insulin sensitivity.127–129 Nonetheless, the subclinical inflammation observed in the setting of IR cannot be considered the predominant cause of T2D; instead, it serves as a bridge between the primary causes of T2D and its manifestation. 130 The involvement of inflammation in T2D pathogenesis is also implied by the finding that the presence of chronic inflammatory disorders accompanies an increased incidence of T2D. 131
The discovery that elevated levels of markers, mediators of inflammation, and acute-phase reactants have been positively correlated with incident T2D has been the key impetus for evaluating inflammatory markers as predictors of IR; 14 indeed, many have provided encouraging results in this context. The present narrative review will focus on the more extensively studied molecules.
C-reactive protein
C-reactive protein is a non-specific inflammation marker that is produced primarily by the hepatocytes. 132 It is well documented that adipose tissue in the context of obesity is characterized by an increased production and secretion of proinflammatory cytokines, including tumor necrosis factor (TNF)-α and interleukin (IL)-6, which in turn stimulate CRP synthesis. 133
A growing body of research underpins the use of CRP as a surrogate marker of IR.133–139 A pivotal cross-sectional study of 107 nondiabetic subjects, conducted in 1999, was the first to demonstrate that CRP, IL-6, TNF-α, and fibrinogen serum concentrations are elevated in subjects with IR, as indicated by HOMA-IR index values. 140 Indicatively, in a large-scale prospective cohort study that enrolled 22 946 subjects without a history of T2D, 278 (1.2%) incident cases of T2D were ascertained during a median follow-up period of 3 years. The highest tertile for CRP levels (CRP ≥ 1.35 mg/L for males; CRP ≥ 1.02 mg/L for females) was associated with an increased risk of developing T2D (males, HR 1.67 [95% CI 1.00, 2.45]; females, HR 2.80 [95% CI 1.73, 4.52]), compared with the lowest tertile for CRP levels (CRP ≤ 0.56 mg/L for males; CRP ≤0.43 mg/L for females). 141
However, in another prospective cohort trial, comprising 5 401 males without T2D at baseline and with a follow-up period of 6.8 years, raised high-sensitivity (hs)-CRP had a negative impact on insulin sensitivity, as indicated by indices of IR, but was not associated with an increased risk of incident T2D (HR 1.07 [95% CI 1.04, 1.09]) after adjustment for confounding factors. 142 Importantly, in a meta-analysis of 22 prospective cohorts, including a total of 40 735 nondiabetic participants, of whom 5 753 (14.1%) developed incident T2D, 1 log mg/L increment in CRP levels was associated with an increased risk of T2D (RR 1.26 [95% CI 1.16, 1.37]). 143 These findings suggest CRP is a promising candidate surrogate marker of IR, but further evaluation is necessary.
Recently, CRP has been considered more than a mere indicator of inflammation and, therefore, is being evaluated as a diagnostic tool in various pathological contexts. Intriguingly, hs-CRP > 3 mg/L was associated with an elevated risk of CVD (adjusted HR 1.45 [95% CI 1.07, 1.96]) and with an even greater risk of all-cause mortality (adjusted HR 2.47 [95% CI 1.88, 3.25]), versus hs-CRP < 1 mg/L, in a prospective cohort study of 7 301 patients with recent-onset T2D and with a median follow-up period of 4.8 years. 144
Interleukin-6
Extensive research has shown that IL-6 is a soluble, multifunctional cytokine with a pleiotropic action. 145 As stated above, the expanding adipose tissue is an essential source of circulating IL-6 in obesity, and emerging evidence robustly demonstrates that IL-6 intervenes in multiple pivotal metabolic pathways.133,146–149 Importantly, the role of IL-6 in the pathogenesis of IR is gradually being unveiled. 150
In this regard, in a prospective nested case–control study of 192 subjects who developed incident T2D during a 2.3-year follow-up period and 384 control subjects, IL-6 levels of the highest quartile (IL-6 ≥ 2.24 pg/ml) were associated with increased T2D risk (OR 2.57 [95% CI 1.24, 5.47]) after adjusting for risk factors and glycosylated hemoglobin (HbA1c), compared with IL-6 levels of the lowest quartile (IL-6 ≤ 0.90 pg/ml). 151 Similar results were obtained from another prospective nested case–control study, comprising 188 female participants who developed incident T2D over a 4-year follow-up period and 362 nondiabetic controls, in which the highest IL-6 (IL-6 >2.050 pg/ml) and CRP (CRP > 0.61 mg/dL) quartile values were independently associated with an increased T2D risk versus the lowest quartile of these inflammatory markers (IL-6 <0.909 pg/ml, CRP <0.10 mg/dL), after adjustment for risk factors of T2D. 152 In a meta-analysis of 10 prospective cohort studies, with a total of 19 709 participants, of whom 4 480 (22.7%) developed incident T2D, a 1 log pg/mL increment in circulating IL-6 values positively correlated with T2D risk (RR 1.31 [95% CI 1.17, 1.46]) more robustly than CRP (RR 1.26 [95% CI 1.16, 1.37]). 143
In another meta-analysis of 15 prospective cohort studies, including 31 562 individuals and 5 421 (17.2%) incident T2D cases, IL-6 levels were associated with a higher risk of incident T2D (HR 1.24 [95% CI 1.17, 1.32]) per log-pg/mL increment of its serum concentration. 153 Remarkably, in a trans-ethnic meta-analysis of 260 614 cases and 1 350 640 controls, the presence of a loss-of-function missense variant (Asp358Ala) in the IL-6 receptor gene (IL6R) was substantially associated with lower odds of T2D (OR 0.98 [95% CI 0.97, 0.99]). 153 The researchers of this study concluded that IL-6-mediated inflammation may be involved in the pathophysiology of T2D; however, its impact on T2D risk is probably small in the general population. Notably, a nested cohort study reported that elevated IL-6 plasma levels may also serve as an independent predictor of macrovascular events (HR1.37 [95% CI 1.24, 1.51] per SD increase) and all-cause mortality (HR 1.35 [95% CI 1.23, 1.49] per SD increase) in patients with T2D. 154 Considering all the above, further evaluation is merited to determine the value of IL-6 as a biomarker of IR.
Other inflammatory markers
Several other indicators of inflammation under evaluation have provided promising results as biomarkers of insulin sensitivity. For example, in a systematic review and meta-analysis of prospective studies, elevated TNF-α, IL-1β, and IL-18 levels were associated with increased T2D risk, although their predictive performance was inferior to those of CRP and IL-6. 155 Furthermore, plasma soluble cluster of differentiation-36 (CD36), procalcitonin, glycoprotein acetyls (GlycA), and the neutrophil-to-lymphocyte (NLR) ratio are only but a few of the exciting inflammatory markers that have positively correlated with IR across a number of studies.130,142,156–162
As mentioned earlier, low-grade, subclinical inflammation is implicated in the pathogenesis of IR. However, a plethora of conditions, including infections, immunologic diseases, and cancer, can cause elevations in inflammatory markers. 130 Therefore, a personalized approach must be considered when interpreting the values of inflammatory markers as surrogate markers of IR. Furthermore, except for CRP, the determination of most of the aforementioned inflammatory markers is unavailable in the majority of laboratories around the globe, as they require specialized equipment and are more expensive, currently limiting their use in research settings.
Adipokines: adiponectin, leptin
The functions of adipose tissue have been proven to extend beyond providing thermal insulation of the body and regulating energy homeostasis. 163 Ample evidence suggests that another principal role of visceral adipose tissue is that of producing and secreting a diverse range of bioactive molecules, called adipokines, which exert multiple biological activities; thus, visceral adipose tissue may also be considered an endocrine organ.163,164 Among the adipokines discovered, the effects of adiponectin and leptin have been most extensively studied and emerging data suggest that they are implicated in the causation of several disorders, including T2D, MASLD, dyslipidemia, and coronary artery disease.165–168 This section will outline current knowledge regarding the potential utility of adiponectin and leptin as biomarkers of insulin sensitivity/resistance.
Adiponectin
Adiponectin is the most abundant peptide hormone derived from adipose tissue, exerting pleiotropic actions on numerous tissues. Among others, antidiabetic properties have also been ascribed to adiponectin, with the proposed mechanism of this effect involving the enhancement of insulin signaling in target cells.169–172 The inverse relationship between circulating adiponectin levels and T2D risk has been consistently and reproducibly documented by several observational studies since 2002.173,174 However, whether adiponectin is the driver or passenger on the road to T2D remains under scrutiny.175,176 Regardless of the precise pathophysiologic underpinnings, there has been considerable research interest in dissecting the potential role of adiponectin as a biomarker of IR.
Notable evidence supports the use of adiponectin as an indicator of insulin sensitivity. To begin with, in a recent cross-sectional study that included 3 680 individuals, a decreasing trend of adiponectin levels in populations with normoglycemia (n = 2 449; mean, 4.0 [SD 2.9–5.5] mg/L), newly diagnosed prediabetes (n = 1 077; mean, 3.7 [SD: 2.7–5.3] mg/L), and newly diagnosed T2D (n = 154; mean, 3.2 [SD 2.1–4.7] mg/L) was observed. 177 Moreover, in a case–control study comprising a total of 2 810 participants (335 incident T2D cases and 2 415 healthy controls), in which adiponectin was measured three times per participant between 1991 and 2004, adiponectin levels at baseline were significantly decreased in T2D cases (median, 7 141 [interquartile range, 5 187–10 304] ng/mL) versus healthy subjects (median, 8 818 [interquartile range, 6 535–12 369] ng/mL). 178 During the 13-year study period, a decreasing linear trajectory in pre-diagnosis adiponectin values was reported in early-onset T2D (<52 years of age), regardless of gender, and in female T2D cases. However, the slope differences in early-onset T2D were substantially attenuated after adjustment for changes in obesity. The authors concluded that a steep decline in adiponectin levels may already be evident a decade before the diagnosis of T2D. 178
Furthermore, a prospective cohort study of 5 349 nondiabetic participants, with a median follow-up duration of 8.5 years, reported that each doubling in adiponectin values results in a HR of 0.55 for T2D risk (95% CI 0.41, 0.74) after adjustment for all baseline variables. 179 Another prospective cohort study comprised 5 085 individuals with impaired fasting glucose (stage 1 [n = 3 882], fasting glucose, 100–109 mg/dL; and stage 2 [n = 1 203], fasting glucose, 110 125 mg/dL) who were followed-up for 4.4 years. Results indicated that adiponectin values of the lowest tertile (males, adiponectin <3.90 μg/mL; females, adiponectin <6.01 μg/mL) were independently associated with T2D among this study population (stage 1, HR 1.24 [95% CI 0.94, 1.64]; stage 2, HR 1.82 [95% CI 1.40, 2.39]), compared with adiponectin values of the highest tertile (males, adiponectin ≥6.23 μg/mL; females, adiponectin ≥9.47 μg/mL). 180
The above findings have also been corroborated in two meta-analyses of case–control and prospective cohort studies, providing robust evidence that low adiponectin values may reliably predict prediabetes and T2D development.181,182 The results of these meta-analyses indicated that 1-log μg/mL increment in adiponectin levels is significantly associated with a reduced risk of T2D (RR 0.72 [95% CI 0.67, 0.78]), as well as that circulating adiponectin levels in patients with prediabetes are significantly decreased compared with healthy controls (weighted mean difference –1.694 [95% CI –2.151, –1.237] μg/mL).181,182 The latter finding was further intensified when the HOMA-IR value was > 2.12 and the mean age was >60 years.
Lastly, evidence supports that adiponectin may be a valuable tool in discriminating metabolically healthy obesity (a term used to describe obesity without associated metabolic abnormalities, such as hypertension, T2D, and dyslipidemia) from metabolically unhealthy obesity, further reinforcing its potential as a reliable biomarker of insulin sensitivity. 183
Another intriguing finding is that adiponectin circulates in the bloodstream in low-, middle-, and high-molecular-weight (HMW) complexes, with the HMW isoform mediating the predominant action in metabolic tissues.184,185 The inverse correlation between HMW adiponectin concentrations and T2D incidence has been reported in a few trials and limited data suggest that the HMW isoform may serve as a stronger predictor of IR than total adiponectin levels.186,187
Leptin
Leptin is another peptide hormone primarily secreted by adipocytes that exhibits a vast spectrum of biological functions, both at the central and peripheral level; regulation of satiety and energy homeostasis are only some of the well-described actions of leptin in the literature.188,189 Glucose-lowering effects have also been attributed to leptin, and, thus, leptin might have a putative role in the pathogenesis of T2D. 190
Meanwhile, a positive correlation between circulating leptin values and total adiposity is well-established to exist, as leptin reflects the amount of energy reserves stored in adipose tissue.191–193 Similarly to IR, leptin resistance is also observed in individuals with obesity, characterized by a decrease in tissue sensitivity to leptin.194–196 Evidence supports that leptin resistance occurs during the early stages of obesity and may have an adverse effect on insulin sensitivity, and vice versa, IR may also exacerbate leptin resistance; leptin resistance and IR are therefore closely linked.196,197
In light of the evidence above, leptin may be hypothesized to serve as a predictive marker of IR. However, inconsistent results have been obtained to date. In a cross-sectional study consisting of 5 599 participants, leptin levels in the highest quartile (males, leptin > 7.12 fg/L; females, leptin > 21.70 fg/L) were not independently associated with T2D risk (males, OR 1.07 [95% CI 0.59, 1.94]; females, OR 0.86 [95% CI 0.49, 1.51]) after adjustment for BMI, versus leptin levels in the lowest quartile (males, leptin < 2.64 fg/L; females, leptin < 7.68 fg/L). 198 Similarly, in a case–control study including 570 incident T2D cases and 530 controls who were followed-up over a median period of 3.0 and 8.9 years, respectively, high serum leptin values, obtained by comparing extreme leptin quartiles, were inversely correlated with T2D risk after adjusting for factors purportedly related to leptin resistance and adiponectin (HR 0.40 [95% CI 0.23, 0.67]). 199
Meanwhile, in a prospective cohort study that included 5 672 individuals aged 70–82 years with pre-existing CVD or increased risk for CVD, 864 (15.2%) developed a CVD event and 289 (5.1%) were newly diagnosed with T2D over 3.2 years of follow-up. In this context, a 1-unit log increase in leptin concentrations showed no correlation with CVD risk (HR 1.02 [95% CI 0.90, 1.16]) but was associated with T2D risk. However, this association retained significance only in men (HR 1.85 [95% CI 1.30, 2.63]) and not in women (HR 0.89 [95% CI 0.64, 1.26]) after adjustment for classic risk factors, BMI, CRP, and glucose. 200
In another prospective cohort study comprising 3 363 individuals without T2D at baseline, 584 (17.4%) developed incident T2D during a median follow-up period of 7.51 years. Higher circulating leptin concentrations (log-transformed leptin) were associated with T2D risk (HR 1.29 [95% CI 1.05, 1.58]) after adjustment for many variables including BMI; however, this association ceased to exist when the HOMA-IR index was also included as a confounding variable (HR 0.99 [95% CI 0.80, 1.22]). 201 Meanwhile, in a study involving 1 234 participants, a significant association between the HOMA-IR index and serum leptin concentrations, independently of adiposity levels, was observed. 202 As a final note, elevated leptin levels have also been linked to the presence and severity of coronary heart disease and heart failure, among others.168,203
Without a doubt, elucidating the role of adipokines in IR represents a research area of growing interest. Experimental focus on adiponectin and leptin is only a part of the picture; several other adipokines, including ghrelin and resistin, are under evaluation and have provided encouraging results as markers of IR.204–206 Furthermore, the leptin/adiponectin ratio has been recently introduced as a marker of insulin sensitivity, and emerging evidence suggests that it could achieve a better diagnostic performance than either leptin or adipokine alone. 207 Similarly, the free leptin index, calculated as the fraction of total leptin and plasma bound soluble receptor (sOB-r) concentrations, is considered a biomarker of leptin resistance and may be a predictor of developing T2D.208,209
Despite the above, it is crucial to acknowledge that, as with all biomarkers discussed in the present review, the absence of cutoff values for the identification of IR and the lack of data from large-scale studies represent two significant barriers yet to be overcome. Additionally, explanations for the inconsistent results in studies evaluating leptin, and gender-related differences in the outcomes of studies evaluating adiponectin, must be sought.178,198–201 Meanwhile, the influence of gender, BMI, and ethnicity on adiponectin and leptin serum reference values causes further confusion. Consequently, sex-, BMI-, and ethnic-specific reference intervals need to be determined.210–212
Capitalizing on their beneficial properties, adiponectin and leptin are considered attractive therapeutic targets; agents aimed at enhancing their levels focusing on innovative approaches, such as gene therapy, pharmacological interventions and combination treatments, have gradually come into the picture.203,213,214 Metreleptin, a recombinant analog of human leptin, was approved for the treatment of lipodystrophy in Japan in 2013 and a year later by the US Food and Drug Administration, and has paved the way for a more comprehensive exploration of these therapeutic avenues by the research community.203,215
A summary of the advantages and disadvantages of each aforementioned biomarker of insulin sensitivity/resistance, namely the HOMA-IR index, TG/HDL-C ratio, TyG index, inflammatory markers, and adipokines, is presented in Table 2.
Summary of the advantages and disadvantages of insulin sensitivity – resistance biomarkers, namely HOMA-IR index, TG/HDL-C ratio, TyG index, inflammatory markers, and adipokines.
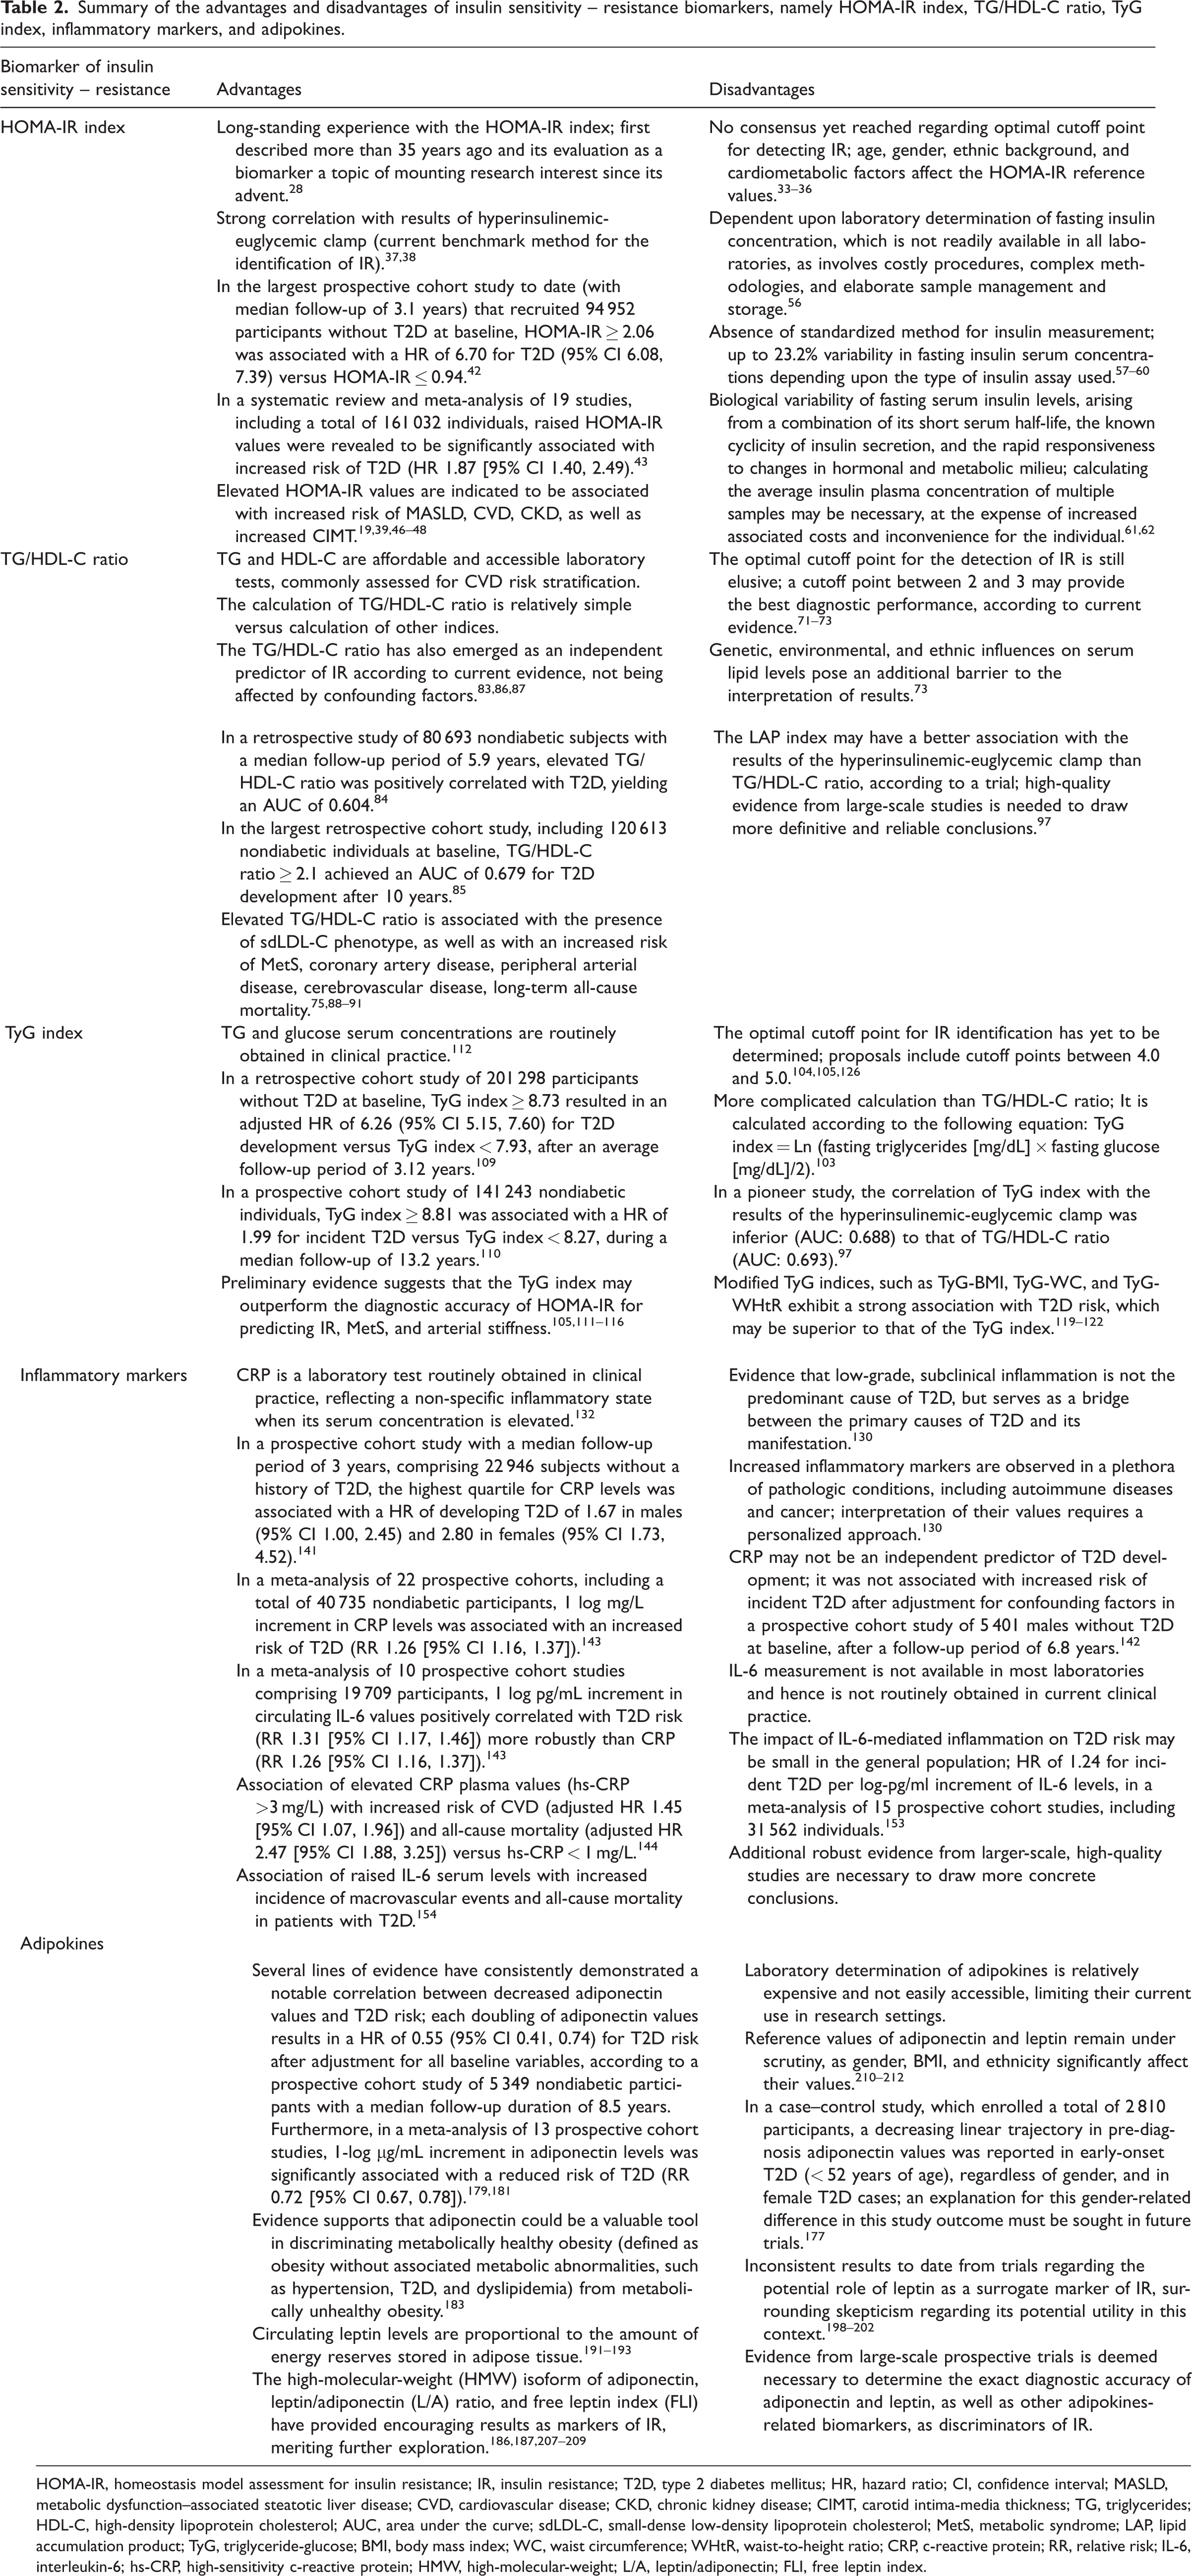
HOMA-IR, homeostasis model assessment for insulin resistance; IR, insulin resistance; T2D, type 2 diabetes mellitus; HR, hazard ratio; CI, confidence interval; MASLD, metabolic dysfunction–associated steatotic liver disease; CVD, cardiovascular disease; CKD, chronic kidney disease; CIMT, carotid intima-media thickness; TG, triglycerides; HDL-C, high-density lipoprotein cholesterol; AUC, area under the curve; sdLDL-C, small-dense low-density lipoprotein cholesterol; MetS, metabolic syndrome; LAP, lipid accumulation product; TyG, triglyceride-glucose; BMI, body mass index; WC, waist circumference; WHtR, waist-to-height ratio; CRP, c-reactive protein; RR, relative risk; IL-6, interleukin-6; hs-CRP, high-sensitivity c-reactive protein; HMW, high-molecular-weight; L/A, leptin/adiponectin; FLI, free leptin index.
Novel promising biomarkers
Without a doubt, this research field is vast and flourishing, as evidenced by the increasing number of studies evaluating the efficacy of different biomarkers in predicting IR. In this final section, emerging insights are provided regarding some novel biomarkers that hold immense potential to revolutionize the diagnostic landscape of IR in the coming years.
Markers of β-cell dysfunction
Insulin resistance and pancreatic β-cell dysfunction have long been recognized as two converging, synergistic phenomena leading to T2D development. The prevailing view is that, as IR becomes progressively more pronounced, the prolonged and increased secretory demand placed upon the β-cells eventually leads to their exhaustion, superseding IR in inducing T2D.216,217 Although β-cell dysfunction has traditionally been considered a late event in T2D progression, recent evidence suggests that β-cell function progressively declines many years before the onset of T2D.218,219 The gold standard method for evaluating β-cell function is the acute insulin response, but its applicability is limited to the research setting, as it requires the use of the hyperglycemic clamp technique. 220
Multiple markers that indicate β-cell dysfunction have been proposed as reliable predictors of T2D development. One such marker is C-peptide, a segment of proinsulin that is cleaved prior to its co-secretion with insulin by β-cells and is released into the bloodstream at a concentration equimolar to that of insulin.221,222 Unlike insulin, C-peptide is subjected to negligible first-pass metabolism by the liver and, consequently, has a twofold to fivefold longer half-life than insulin. 223 C-peptide is therefore considered a more dependable marker of endogenous insulin secretion and C-peptide-based indices may provide a more accurate reflection of IR compared with those based on insulin. 224 Notably, in a prospective cohort study comprising 5 176 normoglycemic subjects, of whom 289 (5.6%) developed incident T2D during a median follow-up period of 7.2 years, per doubling of C-peptide levels (per Log2-unit increase) was associated with an increased risk of T2D (HR 2.35 [95% CI 1.49, 3.70]) independent of glucose, insulin levels, and clinical risk factors. 225 Finally, it is worth noting that the urinary C-peptide/creatinine ratio has also shown promising potential as a biomarker of insulin sensitivity. 226
Proinsulin, the precursor of insulin packaged with C-peptide in β-cells, reaches the circulation only in small amounts under normal conditions. 227 However, as β-cells are burdened with increased secretory insulin demand in the setting of IR, the intracellular proinsulin and insulin secretion processes become defective, resulting in elevated plasma levels of proinsulin. 228 In this regard, accumulating research evidence suggests that increased serum proinsulin concentration, proinsulin-to-insulin ratio, and proinsulin-to-C-peptide ratio may be independent predictors of T2D development.228–231 In a prospective cohort study of 1 001 participants, 79 (7.9%) incident T2D cases were recorded during a median follow-up period of 6.6 years. Elevated proinsulin serum levels and proinsulin-to-insulin ratio were associated with an increment of T2D incidence (proinsulin, OR 3.72 [95% CI 2.55, 5.42]; proinsulin-to-insulin ratio, OR 1.66 [95% CI 1.26, 2.17]) after adjustment for age, gender, BMI and physical activity. 230
Numerous other biomarkers of β-cell dysfunction have been identified in preliminary trials, including many indices, such as the homeostasis model assessment of β-cell function.40,232,233 Research endeavors aimed at unraveling the intricate molecular mechanisms responsible for β-cell dysfunction and discovering robust methods to monitor β-cell function are expected to intensify significantly in the foreseeable future, promising exciting new insights and tools for diagnosing T2D.
Could imaging modalities be useful in the early detection of IR?
The accumulation of visceral adipose tissue, as opposed to subcutaneous adipose tissue, has been discerned to play a critical role in the etiology of IR.234–236 Thus, a concept that is gaining considerable attention is whether the quantification of excess visceral adipose tissue via imaging modalities, such as computed tomography (CT), ultrasonography, magnetic resonance, dual-energy x-ray absorptiometry or nuclear imaging techniques, could serve as a biomarker of IR. 237 Two different approaches have been considered in this direction: (1) measurement of visceral adipose tissue in a specific region of interest (e.g., at the umbilicus or the L2 vertebra level) and (2) quantification of visceral adipose tissue in specific body depots.
Both approaches have yielded impressive results thus far. Regarding the former approach, in a prospective cohort study of 436 individuals without T2D at baseline, CT-based measurement of visceral adipose tissue at the chest, umbilicus, and thigh level was conducted at baseline and at a 5-year follow-up examination. The study results showed that a 1-SD increase in the intra-abdominal fat area over 5 years led to a 1.65-fold increase in the odds of T2D at 10 years (95% CI 1.21, 2.25). 238 In a cross-sectional study of 2 477 individuals, CT-based quantification of visceral adipose tissue was performed over 24 abdominal imaging slices using volume analysis software, and demonstrated that a 1-SD increase in abdominal visceral adipose tissue was associated with an increased risk of T2D in females (OD 1.82 [95% CI 1.6, 2.1]) and males (OD 1.69 [95% CI 1.4, 2.0]). 239
Furthermore, another cross-sectional study of 1 907 participants, involving CT-based quantification of visceral adipose tissue at the umbilicus level, revealed that visceral fat area (VFA) ≥ 101.5 cm2 in males (AUC: 0.66, sensitivity: 0.61, specificity: 0.59) and VFA ≥ 72.5 cm2 in females (AUC: 0.66, sensitivity: 0.74, specificity: 0.78) may represent valuable markers of elevated T2D risk. 240 Meanwhile, in a prospective cohort study, measurement of visceral adipose tissue via a bioelectrical impedance analysis method was conducted in 13 004 individuals at baseline and after a median follow-up of 4.02 years. Results indicated that VFA ≥ 118.8 cm2 in males (AUC: 0.63, sensitivity: 56.8%, specificity: 64.5%) and VFA ≥ 82.6 cm2 in females (AUC: 0.76, sensitivity: 66.7%, specificity: 74.1%) were optimal cutoff values for predicting incident T2D. 241 Other preliminary trials have also supported the above findings, and indices comprising results from imaging modalities, such as the liver attenuation index and visceral adipose tissue/(body height), 3 may also be predictors of T2D development.241–243
Regarding the latter approach, growing evidence indicates that the quantification of excessive visceral adipose tissue in various body compartments may also indicate the presence of IR. These compartments include the epicardial, intermuscular, intrahepatic, pancreatic, periaortic, and intraperitoneal visceral adipose tissue depots.244–248 As per the available evidence, the accumulating visceral adipose tissue in these regions exhibits an altered metabolic, adipokine, and inflammatory profile, resulting in an unfavorable microenvironment that significantly contributes to the development of IR. 249
Undeniably, some obvious drawbacks to such an approach cannot be ignored. Firstly, the potential exposure to radiation, according to the imaging modality used, as well as the increased associated costs and the inconvenience for the patient, represent formidable barriers, curtailing the potential use of imaging modalities for the early identification of IR in the general population. A viable approach would be the quantification of excess visceral adipose tissue via imaging modalities in individuals that undergo imaging assessment for another indication, but further large-scale studies are deemed necessary to evaluate the clinical feasibility and efficacy of this proposed diagnostic strategy.
T2D prediction models
In the realm of preventive medicine, assessing the future risk of various diseases via prediction models has been the focus of intensive research efforts, and T2D is no exception. Indeed, the development and validation of T2D prediction models, which condense information from a variety of clinical and/or laboratory parameters into a composite index, has gained considerable traction over the last decades. While several risk scores have been proposed and have attained a satisfactory performance in predicting future T2D, a consensus on the best-performing risk score has yet to be reached.250,251
The Finnish Diabetes Risk Score (FINDRISC) and the Framingham Diabetes Risk Model (FDRM) are two characteristic examples of T2D risk prediction models currently being evaluated.251–253 The FINDRISC is calculated based on a simple questionnaire that comprises 8 variables, including age, BMI, waist circumference, physical activity, dietary factors, hypertension, hyperglycemia, and family history of T2D, and predicts the 10-year risk for developing T2D. 252 The FDRM, on the other hand, encompasses 9 factors, including age, gender, BMI, waist circumference, blood pressure, family history of T2D, fasting blood glucose, HDL-C, and TG levels, and estimates the 8-year risk of T2D development. Both risk models yielded an AUC of 0.85 in their initial model development studies. 253 Internal and external validation of T2D risk scores is an ongoing and iterative process, and there is hope that they will enter the terrain of clinical practice as screening tools of T2D in the foreseeable future. 254
In relation to IR, the reference values of these prediction models can be adjusted to estimate the presence of IR instead of future T2D risk. 255 There is also a growing trend towards the development of novel prediction models explicitly designed for IR screening. 256
Considering all the above, the use of T2D prediction models offers a number of advantages. First, the simplicity of T2D prediction models makes them suitable for screening purposes, as they require parameters that can be easily obtained from medical history, physical examination, and routine laboratory tests. Thus, an emerging approach recommends using a simple and valid questionnaire as a noninvasive and cost-effective initial screening method for IR, followed by more invasive and accurate methods if deemed necessary. 257 Furthermore, given the growing number of individuals at risk for T2D, a biomarker of IR should be cost-effective, and T2D prediction models may capitalize on this advantage versus other surrogate markers. Meanwhile, their predictive performance is impressive in preliminary trials, but needs to be validated in larger prospective cohorts. Lastly, the recent success stories of other prediction models, such as the introduction of the updated Systematic COronary Risk Evaluation (SCORE) model, namely SCORE2, and the SCORE2-Diabetes risk prediction algorithms in the European Society of Cardiology guidelines, have greatly encouraged a more detailed and exhaustive investigation of this field and may pave the way for more success stories in the foreseeable future.258,259 Thus, future trials will ascertain whether T2D prediction models could serve as simple, reproducible, efficient, and economic tools for identifying IR, as preliminary evidence has suggested, in the hands of the clinician.
MicroRNAs (miRNAs)
The groundbreaking discovery of the first miRNA by the pioneering studies of Ambros and Ruvkun laboratories in 1993 has decisively impacted the field of molecular biology.260,261 After years of research dedicated to unraveling the enigma of their biological function, it is now clear that miRNAs constitute a class of short RNA molecules, 19–25 nucleotides in size, that regulate post-transcriptional silencing of target genes. 262 In addition, accruing data indicate that miRNAs may enter the extravascular space or reach the bloodstream and act in a paracrine or endocrine manner. 263 Assessment of the clinical utility of miRNAs as potential diagnostic biomarkers and therapeutic targets represents one of the most cutting-edge and challenging research fields. 264 In this regard, specific miRNAs have displayed diagnostic potential in identifying IR.
Alterations in the expression or function of multiple miRNAs have been observed in response to T2D. In a prospective trial consisting of 462 individuals without a previous diagnosis of T2D, serum levels of 24 miRNAs were measured at baseline and at a 5-year follow-up examination. During this period, 107 patients (23.1%) developed incident T2D and significant variations in 9 miRNAs were identified (miR-9, miR-28-3p, miR-29a, miR-30a-5p, miR-103, miR-126, miR-150, miR-223, and miR-375). The inclusion of these 9 miRNAs with HbA1c yielded a satisfactory predictive value (AUC: 0.8342) for the early diagnosis of T2D, which was superior to HbA1c alone (AUC: 0.6950). 265
In another observational study, comprising 91 individuals with impaired glucose regulation, 102 with T2D, and 68 healthy controls, a multi-parameter diagnostic model, consisting of 4 miRNAs (miR-148b, miR-223, miR-130a, and miR-19a), was demonstrated to yield an AUC of 0.90 (sensitivity: 78.82%, specificity: 88.23%) for detecting T2D. Among the examined miRNAs, miR-223 had the best diagnostic value in discriminating T2D (AUC: 0.84, sensitivity: 73.37%, specificity: 81.37%). 266
Furthermore, in a study of 45 females with obesity (insulin sensitivity, n = 11; IR, n = 19; T2D, n = 15) and 12 controls, a total of 4 miRNAs (let-7b, miR-144-5p, miR-34a and miR-532-5p) were indicated to significantly contribute to a model predictive of IR. 267 Moreover, in a study comprising 33 adolescents aged 10–17 years, with obesity that was defined by age and sex-specific BMI ≥ 95th percentile per CDC growth charts, 12 out of the 179 examined miRNAs were significantly different in abundance in obese adolescents with IR versus obese adolescents without IR. Most prominently, 3 miRNAs (miR-30d-5p, miR-122-5p, and miR-221-3p) were positively correlated with insulin levels and IR indicators (HOMA-IR index, HOMA-Adiponectin index, TG/HDL-C ratio, and Adipose Tissue Insulin Resistance index). 268 In another study of 18 subjects with obesity only, and 21 subjects with obesity and MetS, 6 miRNAs (miR-331-3p, miR-452-3p, miR-485-5p, miR-153-3p, miR-182-5p, and miR-433-3p) were significantly correlated with HbA1c levels. 269
As the outcomes of recent studies in this research area have been inconsistent, it is clear that this field is still in its early stages. Further experimental and clinical studies are necessary to elucidate the miRNA signature of T2D and the diagnostic potential of miRNAs in detecting IR. Nonetheless, the preliminary findings discussed above lay the foundation for a more comprehensive exploration of this field.
Metabolomics
Metabolomics is another emerging and rapidly evolving research field, broadly defined as the comprehensive analysis of all metabolites present in a given organism or biological specimen. 270 This field has recently gained much prominence due to the discovery that changes in the metabolic profile occur in response to several pathological conditions. This finding has ignited great interest among researchers, who are now exploring whether metabolomics can be a valuable tool for identifying novel biomarkers of disease diagnosis, treatment, progression, and prognosis.271,272
In this context, determining the metabolomic footprint of IR and T2D has been a topic of extensive research, and several reports have demonstrated an association between specific metabolites and T2D.273–280 A signature of dysregulated metabolism of numerous metabolites, most notably branched-chain amino acids, aromatic amino acids, carbohydrate metabolites, and sphingolipids, has been identified in individuals with IR, and growing evidence supports that these metabolites may be predictive of T2D development.273–280 In a prospective cohort trial of 2 422 normoglycemic individuals who were followed for 12 years, 201 (8.3%) incident T2D cases were ascertained, and elevated plasma levels of 5 branched-chain amino acids and aromatic amino acids were associated with at least 4-fold increased risk of future T2D. Intriguingly, the fasting concentrations of these amino acids were found to be elevated up to 12 years prior to the onset of T2D. 277 Another prospective cohort study including 800 incident T2D cases that were identified over a follow-up period of 7 years, and 2 282 controls, 278 indicated that 12 metabolites were independently predictive of T2D after adjustment for established T2D biomarkers, yielding an AUC of 0.849 in discriminating T2D patients from healthy subjects. The predictive performance was slightly but significantly improved up to an AUC of 0.912 when they were added to established risk prediction models of T2D. 278
Furthermore, in a study of 11 896 normoglycemic individuals from 4 prospective cohort studies, 392 incident T2D cases (3.3%) were documented during 8–15 years of follow-up. Of the 229 examined metabolic measures, 113 were associated with incident T2D. Among the strongest predictors of T2D development were higher concentrations of branched-chain amino acids, aromatic amino acids, very-low-density lipoprotein particle measures, and the enrichment of triacylglycerol in all lipoprotein subclasses. 279 The above findings have also been corroborated in a meta-analysis of 61 prospective cohort studies, encompassing a total of 71 196 participants, of whom, 11 771 (16.5%) developed incident T2D. Alterations in the plasma concentrations of these metabolites resulted in an increased HR for incident T2D, ranging from 1.07 to 2.58, depending on the metabolite. 280
Significant strides have also been made in the fields of proteomics, lipidomics, genomics, and epigenetics in identifying biomarkers of insulin sensitivity.281–284 Furthermore, the metabolomic analysis of saliva, urine, and breath has provided propitious results in this direction in early trials.285–287 These innovative approaches hold great potential to revolutionize IR detection in the future; hence, more research is warranted to explore the full capabilities of these fields.
As stated earlier, the ceaseless pursuit of the perfect biomarker of IR continues. A schematic overview of the biomarkers of IR is depicted in Figure 1, and an indicative presentation of the characteristics of the ideal insulin sensitivity/resistance biomarker, considering the information provided in the present narrative review, is demonstrated in Figure 2.
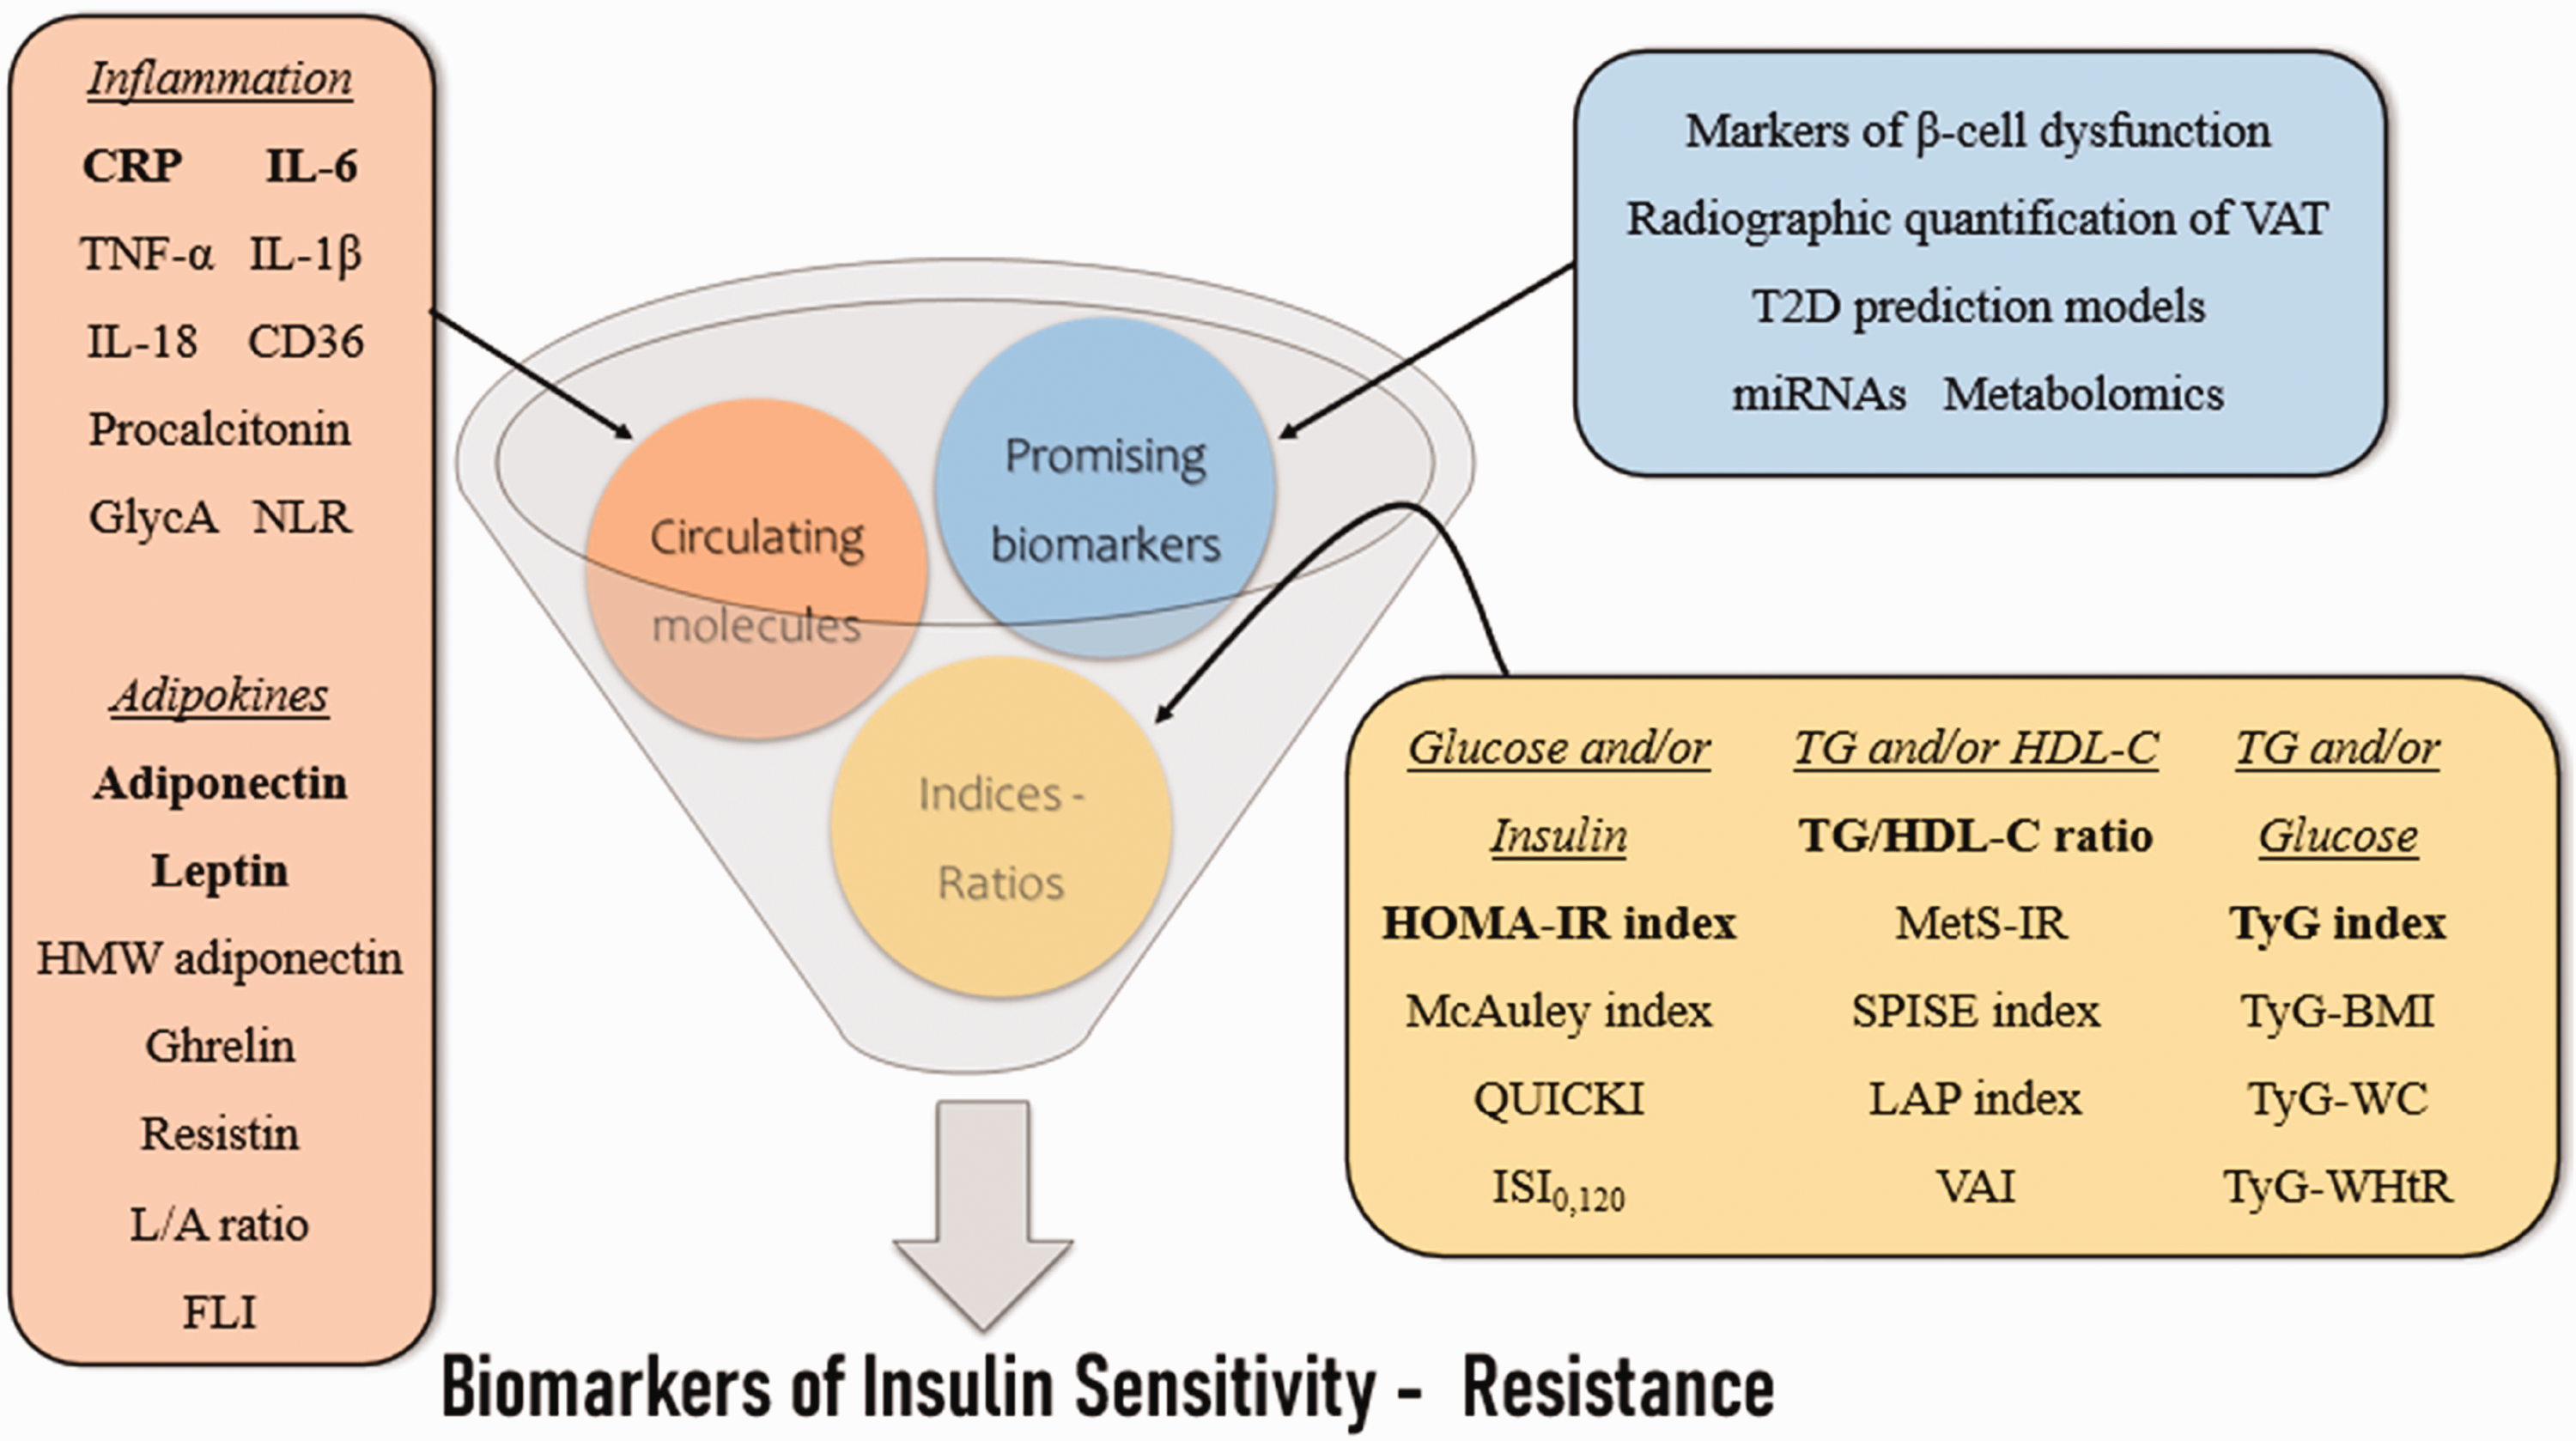
Schematic overview of the biomarkers of insulin sensitivity - resistance. CRP, C-reactive protein; IL, interleukin; TNF, tumor necrosis factor; CD36, cluster of differentiation 36; GlycA, glycoprotein acetyls; NLR, neutrophil-to-lymphocyte ratio; HMW, high molecular weight; L/A, leptin/adiponectin; FLI, free leptin index; VAT, visceral adipose tissue; T2D, type 2 diabetes mellitus; miRNAs, microRNAs; HOMA-IR, homeostasis model assessment for insulin resistance; QUICKI, quantitative insulin sensitivity check index; ISI0,120, insulin sensitivity index; TG, triglycerides; HDL-C, high-density lipoprotein cholesterol; MetS-IR, metabolic score for insulin resistance; SPISE, single-point insulin sensitivity estimator; LAP, lipid accumulation product; VAI, visceral adiposity index; TyG, triglyceride-glucose; BMI, body mass index; WC, waist circumference; WHtR, waist-to-height ratio.

Indicative presentation of the characteristics of the ideal biomarker of insulin sensitivity – resistance. IR, insulin resistance; T2D, type 2 diabetes mellitus.
Conclusion
Indisputably, the landscape of T2D has changed appreciably over recent decades, as our knowledge regarding the underlying molecular mechanisms of T2D has deepened. In this regard, the causal role of IR in T2D etiopathogenesis and its association with the emergence of cardiometabolic disorders, which further contribute to an increased CVD risk, have been well documented. Therefore, the modern era of preventive medicine emphasizes the value of timely and accurate diagnosis of IR, which would permit interventions aimed at postponing, or altogether preventing, T2D and CVD manifestations. Currently, no approved biomarkers of insulin sensitivity are available in clinical practice, representing a critical unmet need; the technical requirements and methodological complexity of the hyperinsulinemic-euglycemic clamp, widely accepted as the gold standard method for evaluating IR, render it unsuitable for routine clinical use. Thus, the development of accurate, accessible, and cost-effective diagnostic tools for IR has been intensively pursued in recent years by the research community.
Based on the evidence presented, it is clear that a multitude of indices and ratios, most prominently the HOMA-IR index, the TG/HDL-C ratio, and the TyG index, may act as valuable forecasters of IR. Moreover, alterations in circulating mediators of inflammation, including CRP and IL-6, and molecules derived from the adipose tissue, most notably adiponectin and leptin, have been observed in response to the dawn of IR and have demonstrated a robust and consistent ability to predict IR across several prospective cohort studies. Numerous other novel biomarkers, including markers of β-cell dysfunction, radiographic quantification of excess visceral adipose tissue, T2D prediction models, and certain miRNAs and metabolomic biomarkers, have also been positively correlated with IR in preliminary trials and are therefore worthy of further research.
Although this research area is expanding at a stunning pace, unfortunately, more questions than answers are currently available. To begin with, the optimal cutoff points for the detection of IR remain obscure for the majority of the examined biomarkers, as their value seems to be influenced by a wide range of factors, such as age, gender, and ethnic background. Furthermore, the predictive accuracy of each biomarker (e.g., AUC, sensitivity, specificity) has yet to be determined, and there are limited data from trials comparing the diagnostic yield of different markers; high-quality data from large-scale prospective cohort studies are therefore eagerly awaited. Another critical question to consider is whether these biomarkers could facilitate monitoring IR progression and the response to potential therapeutic interventions. As these gaps in knowledge remain unfilled, inevitably, no biomarker of insulin sensitivity has been incorporated into T2D practice guidelines to date. Meanwhile, the discussion regarding which individuals should receive a more detailed and comprehensive assessment for the presence of IR, as well as the cost-effectiveness of such diagnostic testing, has yet to commence.
Taken together, the repertoire of IR biomarkers under evaluation is currently expanding and many have exhibited a robust discriminating ability in predicting IR. As more evidence and answers accumulate, the prospect of incorporating biomarkers of insulin sensitivity into routine clinical practice draws closer. Certainly, this will not only be a game changer in the diagnostic algorithm of T2D but will also serve as an essential tool in our collective efforts to curb the escalating global burden of T2D.
Footnotes
Author contributions
Study conceptualization: Constantine E. Kosmas and Christina E. Kostara; Data analyses: Constantine E. Kosmas and Christina E. Kostara; Writing-first manuscript draft: Constantine E. Kosmas and Andreas Sourlas; Writing contribution: Konstantinos Oikonomakis, Eleni-Angeliki Zoumi and Aikaterini Papadimitriou; Critical manuscript revisions and approval of final version: Constantine E. Kosmas, Christina E. Kostara and Andreas Sourlas; Final manuscript review and approval: all authors.
Declaration of conflicting interest
The authors declare that there is no conflict of interest.
Funding
This research received no specific grant from any funding agency in the public, commercial, or not-for-profit sectors.