
Abstract
Background:
Gestational diabetes mellitus, a glucose metabolism disorder during pregnancy, is linked to insulin resistance. Pregnancy elevates insulin resistance, and gestational diabetes mellitus increases fetal complication risks via excessive glucose transport. Current gestational diabetes mellitus diagnosis relies solely on blood glucose levels, which inadequately guide clinical management or insulin initiation. While homeostatic model assessment for insulin resistance and Matsuda index assess insulin resistance, their utility for insulin treatment evaluation in gestational diabetes mellitus is underexplored.
Objectives:
Insulin resistance indices with enhanced discriminatory power for gestational diabetes mellitus were evaluated to predict insulin therapy during pregnancy in women suspected of gestational diabetes.
Design:
This retrospective analysis utilized existing clinical data.
Methods:
Clinical data from 383 pregnant women with suspected abnormal glucose metabolism at Tenshi Hospital (Jan 2018–Sep 2021) were analyzed. Gestational diabetes mellitus was diagnosed using 75-g oral glucose tolerance test criteria. Evaluations included blood glucose, insulin levels, homeostatic model assessment for insulin resistance, and Matsuda index. The primary outcome was predicting the need for insulin treatment. Statistical analyses involved receiver operating characteristic curves and propensity score adjustment.
Results:
Body mass index, glycated hemoglobin, glucose/insulin levels, homeostatic model assessment for insulin resistance, quantitative insulin sensitivity check index, and Matsuda index differed between gestational diabetes mellitus and nongestational diabetes mellitus groups. Standalone Matsuda index (area under the curve = 0.714) outperformed homeostatic model assessment for insulin resistance (area under the curve = 0.618) for gestational diabetes mellitus discrimination; however, both exhibited poor model fit. Notably, the propensity score-adjusted composite Matsuda index (Matsuda index × BS0 × BS120) demonstrated superior performance for gestational diabetes mellitus diagnosis (area under the curve = 0.891) and for predicting insulin treatment (area under the curve = 0.785, lowest Bayesian information criterion, highest positive likelihood ratio), surpassing single indices and adjusted homeostatic model assessment for insulin resistance models.
Conclusions:
The propensity score-adjusted Matsuda index for sustained hyperglycemia (Matsuda index × BS0 × BS120) excelled in gestational diabetes mellitus diagnosis and insulin therapy prediction. This adjusted index offers superior model fit and predictive accuracy, potentially guiding appropriate insulin treatment decisions in suspected gestational diabetes mellitus cases.
Trial registration:
Tenshi Hospital Ethics Committee (approval number: 151; accepted on February 3, 2022).
Introduction
Gestational diabetes mellitus (GDM) is defined as “an abnormality in glucose metabolism that does not lead to diabetes, is first detected or develops during pregnancy, and does not include overt diabetes during pregnancy or pregnancy complicated by diabetes.” 1 Insulin resistance refers to the inability of insulin to exert its hypoglycemic effect. Pancreatic β-cells increase insulin secretion when the hypoglycemic effect of insulin is disrupted. Common causes of insulin resistance include obesity, overeating, inactivity, and glucose toxicity; in addition, pregnancy itself is closely related to insulin resistance.
Abnormalities in insulin resistance during pregnancy are more strongly influenced by human placental growth hormone and human placental lactogen than by placental-derived progesterone and estrogen. 2 Increased insulin resistance typically improves after placental delivery. However, if a woman with a latent insulin secretory defect becomes pregnant, insulin secretion may be insufficient to compensate for the insulin resistance, resulting in increased blood glucose levels and GDM.1–5 In cases with GDM, insulin resistance is often accompanied by enhanced placental transport of excessive glucose. These changes can lead to fetal hyperglycemia and hyperinsulinemia, increasing the risk of serious fetal abnormalities and related complications. 6
The number of pregnant women diagnosed with GDM was reported to be 12.08% based on the current screening criteria used in the Japanese assessment of GDM screening trial in Japan. 3 However, Kyozuka et al. 4 reported six risk factors for GDM, including maternal age >35 years, body mass index (BMI), and a family history of type 2 diabetes, and predicted an increase in the future prevalence of pregnant women with GDM. As various factors influence the clinical course of GDM, relying solely on apparent blood glucose levels may be insufficient to fully reflect this situation.
In GDM, abnormal glucose metabolism during pregnancy can lead to miscarriage, abnormal fetal morphology, gigantism, neonatal hypoglycemia, and neonatal respiratory distress syndrome. Among other conditions, respiratory distress syndrome reportedly increases the risk of perinatal complications in both mothers and their children, and strict glycemic control is important to prevent these risks. 7 The “Guidelines for Diabetes Care 2024” have established target values for glycemic control during pregnancy. 8 Patients diagnosed with GDM are introduced to a dietary and lifestyle guidance program. If their blood glucose control is still insufficient, they are forced to undergo insulin treatment, which can cause psychological stress in some patients. Considering the psychological burden, it is important to avoid unnecessary insulin administration and initiate it appropriately in pregnant women who truly require it. However, detailed information regarding the appropriate use of insulin in pregnant women with suspected GDM is lacking.
The homeostasis model assessment of β-cell function (HOMA-β) has been used as a measure of insulin secretion, 9 while the homeostatic model assessment for insulin resistance (HOMA-IR),9,10 quantitative insulin sensitivity check index (QUICKI), 11 and Matsuda index12,13 have been used to assess insulin resistance. HOMA-IR is a widely used surrogate marker of insulin resistance, calculated from fasting glucose and insulin levels. It mainly reflects hepatic insulin resistance and has been associated with metabolic syndrome and cardiovascular risk in various populations, including the Japanese middle-aged population. 14 Conversely, the Matsuda index, derived from oral glucose tolerance test (OGTT) data, reflects whole-body insulin sensitivity, including both hepatic and peripheral (muscle) insulin action. 15 It has been reported to show a stronger association with metabolic syndrome components and cardiovascular disease risk than HOMA-IR in some cohort studies. 14 Therefore, both indices are valuable, with HOMA-IR primarily reflecting hepatic insulin resistance and the Matsuda index providing a more comprehensive measure of systemic insulin sensitivity.
However, few studies have evaluated insulin resistance and insulin treatment in pregnant women with suspected GDM.16–19 Therefore, this study aimed to investigate an index that could more effectively identify pregnant women with suspected GDM who require insulin therapy based on the insulin resistance index at the time of evaluation during the 75-g OGTT.
Methods
Study design
This retrospective analysis involved no participant intervention or invasion and utilized existing clinical data. It was conducted in compliance with ethical guidelines for life sciences and medical research involving human participants and was approved by the Tenshi Hospital Ethics Committee (approval number 151, approved on February 3, 2022). In accordance with institutional ethical standards, the study protocol was publicly disclosed on the website of Tenshi Hospital, and all pregnant women assured the opportunity to opt out, that is, the right to refuse disclosure after the fact. Therefore, the requirement for prior written informed consent was formally waived by the Ethics Committee.
The clinical data of 383 eligible pregnant women with suspected abnormal glucose metabolism, reported at the Department of Obstetrics of Tenshi Hospital between January 2018 and September 2021, were collected at a single time point from an initial sample of 485 pregnant women. Pregnant women who did not possess all the survey items were excluded. The inclusion criterion encompassed pregnant women with suspected abnormal glucose metabolism who were reported to the Department of Obstetrics at Tenshi Hospital between January 2018 and September 2021. The exclusion criteria were as follows: (1) patients who had already been diagnosed with DM, (2) patients with missing data on the 75-g OGTT, (3) patients with missing data on blood insulin levels, and (4) patients with chronic diseases affecting insulin secretion, such as chronic pancreatitis, or endocrine disorders like Cushing’s syndrome.
Initial outcome arm:
Enhanced of identification of diagnostic indices for GDM
A total of 383 eligible pregnant women were included in the initial analysis, aimed at identifying insulin resistance indices or their confounder-adjusted variants with superior diagnostic accuracy for distinguishing between women with and without GDM, compared to conventional diagnostic criteria. Based on standard GDM diagnostic criteria, participants were classified into two groups: 167 without GDM and 216 with GDM (Figure 1).

Classification flowchart for the target patients.
GDM is diagnosed when any of the following blood glucose levels are met during a 75-g OGTT: fasting ⩾ 92 mg/dL, 1-h ⩾ 180 mg/dL, or 2-h ⩾ 153 mg/dL. These criteria are based solely on blood glucose levels, which reflect an increase in insulin resistance—the primary cause of GDM—compensated for by insulin secretion.
Primary outcome arm:
Prediction of insulin therapy requirement
Subsequently, we investigated whether the indices identified in the initial outcome arm could serve as predictive markers for the need for insulin therapy during pregnancy among women suspected of having GDM. For this analysis, the same cohort of 383 participants was stratified into two groups based on whether insulin therapy was administered: 61 women received insulin therapy, while 322 did not (Figure 1).
Evaluations
The evaluation items included age at conception (years), BMI at nonpregnancy (kg/m2), number of births, number of incidences of family history of diabetes, pregnancy period (weeks), newborn weight (g), number of weeks of gestation at the time of the 75-g OGTT, glycated hemoglobin (HbA1c) (%) at the 75-g OGTT, fasting blood sugar: glucose (BS0), 1-h (BS60) and 2-h (BS120) blood glucose levels at the 75-g OGTT (mg/dL), fasting insulin level (IRI0), 1-h (IRI60) and 2-h (IRI120) insulin levels at the 75-g OGTT (μU/mL). Insulin use was defined as “with insulin use” when insulin therapy was administered regularly until delivery, regardless of the duration or type of formulation. None of the pregnant women used temporary insulin. Ritodrine administration was defined as “with ritodrine administration” when ritodrine was administered, regardless of the form of dosage. The HOMA-β index (%) (Formula 0) is an index of insulin secretion capacity, while the HOMA-IR index (Formula 1), QUICKI (Formula 2), and Matsuda index (Formula 3) are indices of insulin resistance and were calculated based on their corresponding formulas (Table 1).
Comparison between pregnant women without GDM and those with GDM.

Data are presented as median (25%–75%). Statistical analyses included either the t-test or the Mann–Whitney U test.
HOMA-β = (IRI0 × 360)/(BS0 −63); HOMA-IR = BS0 × IRI0/405; QUICKI = 1/(log BS0 + log IRI0); Matsuda index = 10,000/(BS0 × IRI0 × BS120 × IRI120)1/2.
BMI: body mass index; OGTT: oral glucose tolerance test; BS0: fasting blood glucose level; BS60: loading 1-h blood glucose level; BS120: loading 2-h blood glucose level; IRI0: fasting insulin level; IRI60: loading 1-h insulin level; IRI120: loading 2-h insulin level; Abnormal scores: Number of GDM pregnant women with abnormal blood glucose scores at diagnosis; HOMA-β: homeostasis model assessment of beta-cell function; HOMA-IR: homeostatic model assessment for insulin resistance; QUICKI: quantitative insulin sensitivity check index; GDM: gestational diabetes mellitus
mean ± SD (range).
An index of insulin secretory capacity, HOMA-β, was calculated using the following formula:

Indices of insulin resistance, HOMA-IR, QUICKI, and Matsuda indices, were calculated using the following formulas:


BS0 represents the fasting blood glucose level (mg/dL), BS120 represents the loading 2-h blood glucose level (mg/dL), IRI0 represents the fasting insulin level (μU/mL), and IRI120 represents the loading 2-h insulin level (μU/mL). For HOMA-IR, a value less than 1.6 was considered normal, and a value of 2.5 or more indicated insulin resistance.
Statistical analysis
The background factors of pregnant women with and without GDM were compared using the Shapiro–Wilk test for normality. Normally distributed continuous variables are expressed as means ± standard deviations (ranges), while nonnormally distributed continuous variables are expressed as medians (25%–75%). Comparisons between the two groups were performed using the t-test and Mann–Whitney U test for continuous variables with and without normality, respectively, and the χ2 test for nominal variables.
Initial outcome arm
Discrimination between pregnant women with and without GDM was assessed using univariate logistic regression, with insulin resistance indices as independent variables and GDM status as the dependent variable. Odds ratios and 95% confidence intervals (CIs) were calculated, and receiver operating characteristic (ROC) curve analysis was performed for independent indices, defined by pairwise correlation coefficients < 0.8 to avoid multicollinearity. Differences in areas under the curve (AUCs) were compared. The optimal cutoff values for dependent variables as outcome were determined using the Youden index. 20 To adjust for confounding by background factors, beneficial predictors were incorporated as composite variables via propensity score adjustment, applied when sufficient score overlap was observed between outcome groups. Significant variables between the groups of pregnant women with and without GDM were further analyzed using stepwise multivariable logistic regression to identify independent predictors.
Primary outcome arm
The ability to distinguish pregnant women requiring insulin treatment from all 383 participants was verified using individual optimal cutoff values for the insulin resistance index via a 2 × 2 contingency table. Pregnant women with high insulin resistance were considered positive, whereas those with low insulin resistance were considered negative. Sensitivity, specificity, positive predictive value, negative predictive value, positive likelihood ratio (pLR), and negative likelihood ratio for identifying insulin administration status using individual indicators were evaluated.
Additionally, to assess incremental predictive value, insulin resistance indices were adjusted using propensity scores based on confounding factors. Each was denoted as “Insulin Resistance Index × Confounding Factor.” The predictive performance of these models was evaluated by comparing the areas under the ROC curves. Model fit was assessed using the Bayesian information criterion (BIC), and goodness-of-fit was evaluated using lack-of-fit (LOF) statistics. 21
The significance level was set at 5%, and JMP Student Edition 18 (SAS. Cary, NC, USA) was used for statistical analyses.
Results
Initial outcome arm: Enhanced identification of diagnostic indices for GDM
The characteristics of the 383 eligible pregnant women are shown in Table 1, except for BS60 (mean ± standard deviation (range)), which demonstrated normality according to the Shapiro–Wilk test. Other evaluations are presented as medians (25th–75th percentiles). Statistically significant differences were observed between the 216 pregnant women with GDM and the 167 without GDM in the following variables: prepregnancy BMI, HbA1c at the 75-g OGTT, BS0, BS60, BS120, IRI0, IRI60, IRI120, HOMA-IR, QUICKI, and the Matsuda index.
Among the eight influential factors, such as BMI, HbA1c, BS0, BS60, BS120, IRI0, IRI60, and IRI120, that showed significant differences between the two groups in Table 1, IRI0 was found to exhibit potential multicollinearity with both HOMA-IR and QUICKI. In contrast, all eight factors demonstrated statistical independence with respect to the Matsuda index.
The results of the logistic regression analysis for the presence or absence of GDM based on the insulin resistance index are shown in Table 2. The odds ratios for the HOMA-IR, QUICKI, and Matsuda index were 1.48 (95% CI: 1.21–1.80), 0.135 (95% CI: 0.038–0.479), and 0.807 (95% CI: 0.743–0.877), respectively.
Analysis for the presence or absence of GDM based on the insulin resistance index.
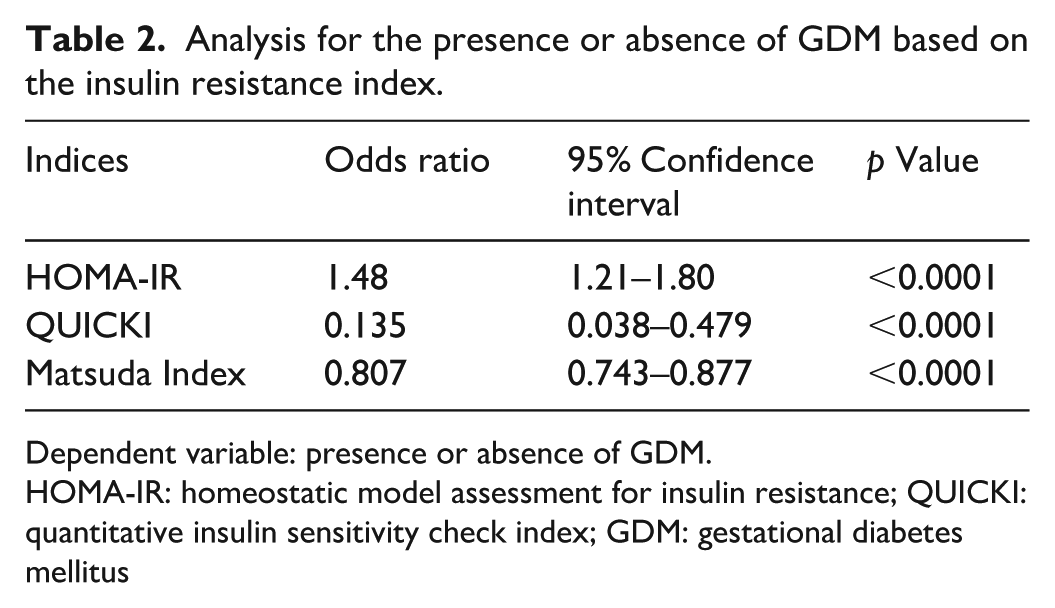
Dependent variable: presence or absence of GDM.
HOMA-IR: homeostatic model assessment for insulin resistance; QUICKI: quantitative insulin sensitivity check index; GDM: gestational diabetes mellitus
Furthermore, QUICKI and HOMA-IR were highly correlated (R = 0.86) and thus not independent. Therefore, HOMA-IR and the Matsuda index were selected for subsequent analysis.
BS0, BS60, and BS120, the individual pairwise correlation among them were insignificant and coefficients < 0.8, these variables were identified as statistically significant independent predictors for the outcome of GDM (all p < 0.0001). IRI0 was not an independent variable, while BMI, HbA1c, IRI0, IRI60, and IRI120, were independent variables. To further refine the predictive models, we constructed propensity score-adjusted composite indicators based on the strongest independent contributors to HOMA-IR and the Matsuda index. These included:
• HOMA-IR × BS60 × BS120
• Matsuda index × BS0 × BS120
• Matsuda index × BS0 × BS60 × BS120
Only variables with an area under the ROC curve (AUC) greater than 0.6 are shown in Table 3, the AUC for the Matsuda index alone was 0.714, which was significantly higher than that of HOMA-IR (AUC = 0.618, p < 0.0001). However, the LOF statistics for single nonadjusted indicators such as Matsuda index and HOMA-IR were low, indicating poor model fit.
Variable prediction of pregnant women with GDM (AUC > 0.6).

“Insulin Resistance Index × Confounding Factor” indicates each propensity score–adjusted composite insulin resistance index accounting for the influence of independent confounding factors.
GDM: gestational diabetes mellitus; AUC: area under the curve; IRI0: fasting insulin level; HOMA-IR: homeostatic model assessment for insulin resistance; BS0: fasting blood glucose level; BS60: loading 1-h blood glucose level; BS120: loading 2-h blood glucose level; CI: confidence interval; pLR: positive likelihood ratio; BIC: Bayesian information criterion; LOF: lack of fit.
p < 0.05; ***p < 0.001; ****p < 0.0001.
Compared to those of nonadjusted indicators, the LOF values for the three adjusted indicators—HOMA-IR × BS60 × BS120, Matsuda index × BS0 × BS120, and Matsuda index × BS0 × BS60 × BS120—were sufficiently high, suggesting good model fit. Their respective AUCs were 0.909, 0.891, and 0.932, respectively, all significantly higher than those of the single indicators (all p < 0.0001).
Furthermore, the pLRs for predicting GDM in pregnant women using the adjusted indicators were 4.6-fold, 14.8-fold, and 2.3-fold higher, respectively, compared to the Matsuda index alone.
These findings suggest that propensity score-adjusted indicators, which account for confounding effects of strong contributors to the Matsuda index, may offer superior predictive accuracy for GDM diagnosis compared to the Matsuda index alone.
ROC curves for these factors are shown in Figure 2. The corresponding optimal cutoff values for the HOMA-IR and Matsuda index were 1.72 and 3.74, respectively.

The areas under the ROC curves for HOMA-IR, Matsuda index, and adjusted composite indices.
Primary outcome arm: Prediction of insulin therapy requirement
Identification of pregnant women requiring insulin treatment using insulin resistance index
As shown in Figure 3, a 2 × 2 contingency table for all 383 pregnant women was constructed based on the presence or absence of insulin treatment using the optimal cutoff value for each insulin resistance index. Because of its ability to identify pregnant women who require insulin treatment, the Matsuda index had a sensitivity of 75% and a specificity of 62%, which was equivalent to that of HOMA-IR. The positive and negative predictive values for both indices were similar. The pLR of the Matsuda index was 1.99, which was higher than that of the HOMA-IR (1.6). The negative likelihood ratio of the Matsuda index was 0.40, which was slightly lower than that of the HOMA-IR index (0.63).
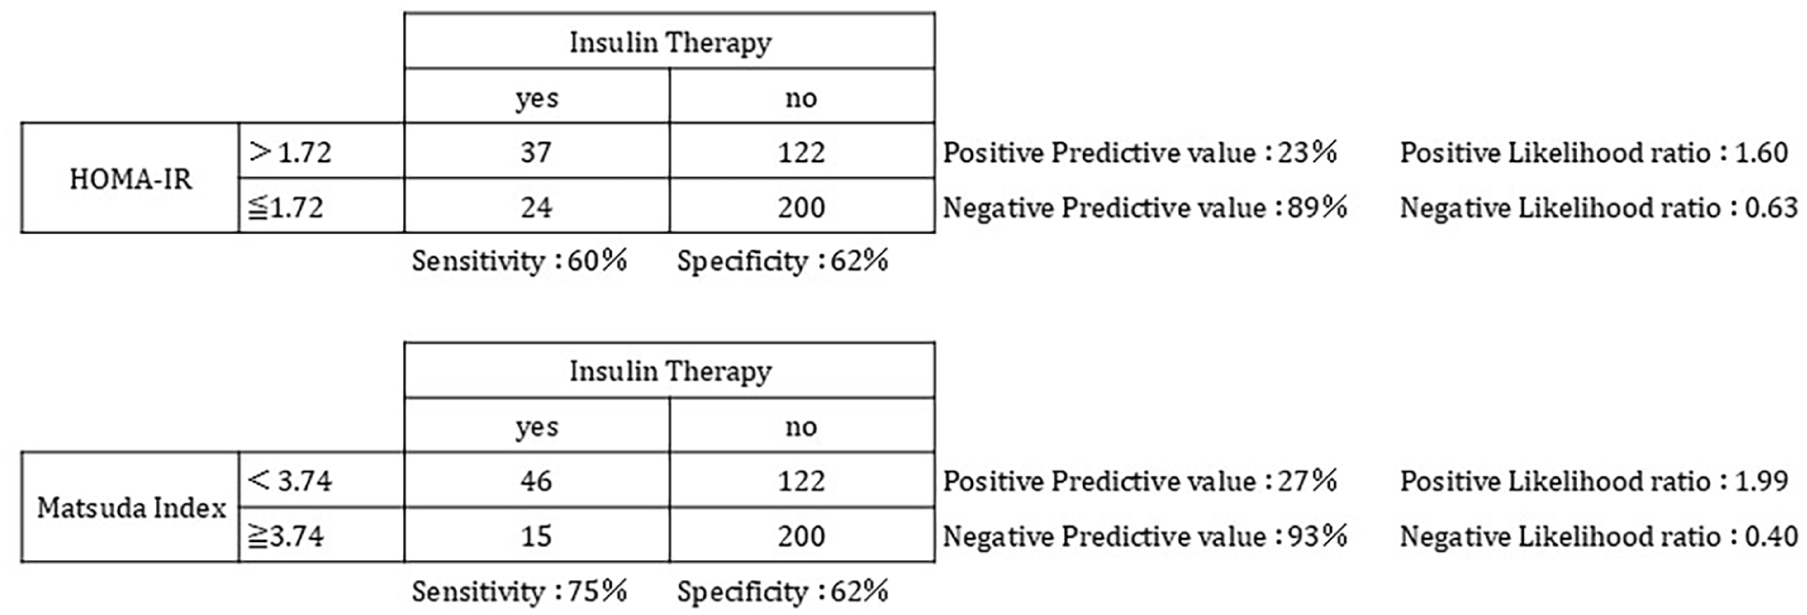
Verification of pregnant women who require insulin treatment based on the insulin resistance index.
Identification of pregnant women requiring insulin treatment using insulin resistance index and their propensity score
Table 4 presents the results of ROC analysis using insulin administration as the outcome, based on models incorporating significant explanatory variables including HOMA-IR and the Matsuda index alone (all p < 0.0001). The goodness-of-fit for all five models—based on HOMA-IR, Matsuda index, and their respective propensity score–adjusted versions—was high, with values exceeding 0.959. No significant differences were observed between HOMA-IR and the Matsuda index alone in terms of BIC, pLR, or AUC. In contrast, the propensity score-adjusted index (Matsuda index × BS0 × BS120) demonstrated the lowest BIC, indicating the best relative model fit, and the highest pLR, suggesting superior discriminative accuracy for identifying patients requiring insulin therapy at the optimal cutoff point. Furthermore, statistical comparisons of AUC values revealed that the adjusted Matsuda index × BS0 × BS120 was significantly higher than those of HOMA-IR, Matsuda index alone, and the adjusted HOMA-IR × BS0 × BS120 (p < 0.05, p < 0.05, and p < 0.0001, respectively), indicating enhanced predictive performance.
Prediction of insulin use on area under the ROC curve analysis.
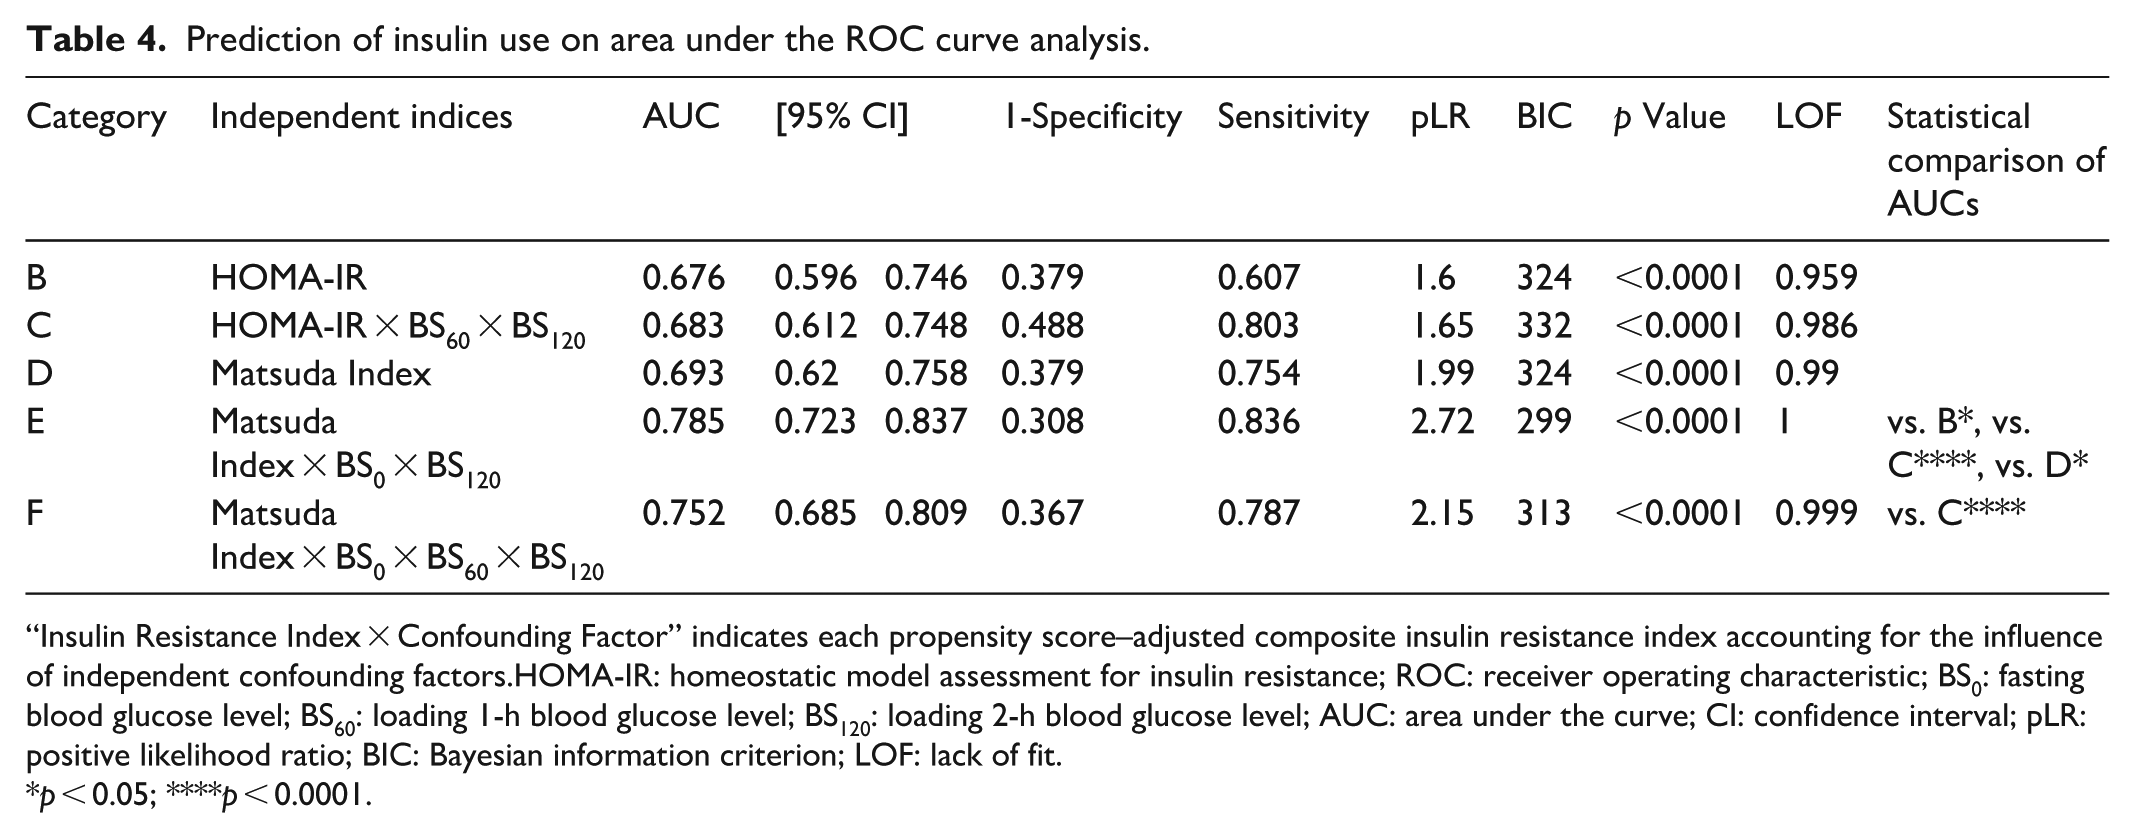
“Insulin Resistance Index × Confounding Factor” indicates each propensity score–adjusted composite insulin resistance index accounting for the influence of independent confounding factors.HOMA-IR: homeostatic model assessment for insulin resistance; ROC: receiver operating characteristic; BS0: fasting blood glucose level; BS60: loading 1-h blood glucose level; BS120: loading 2-h blood glucose level; AUC: area under the curve; CI: confidence interval; pLR: positive likelihood ratio; BIC: Bayesian information criterion; LOF: lack of fit.
p < 0.05; ****p < 0.0001.
Post hoc analysis
Post hoc analysis was conducted using data from 167 non-GDM and 216 GDM patients. At a significance level of α = 0.05, statistical power (β) was calculated based on group-specific standard deviations and mean differences: Matsuda index (SD: 3.15/2.98, mean difference: 1.78), HOMA-IR (SD: 1.02/1.41, mean difference: 0.53), and QUICKI (SD: 0.032/0.039, mean difference: 0.012). The resulting power values were 100% for Matsuda index, 89.9% for HOMA-IR, and 91% for QUICKI. For insulin therapy status, 322 nontreated and 61 treated patients were analyzed. Based on standard deviations (3.29/1.93 for Matsuda index and 1.20/1.80 for HOMA-IR) and mean differences (1.77 and 0.96, respectively), the power was 100% for Matsuda index and 98% for HOMA-IR.
Discussion
The diagnosis of GDM based solely on apparent blood glucose levels may overlook other clinical factors. Among the reported risk factors for GDM, maternal age ⩾35 years and higher prepregnancy BMI have been associated with increased risk.4,8,22 In our study, although maternal age showed no clear association, a higher BMI appeared related to GDM development. However, BMI alone lacked sufficient diagnostic accuracy for GDM (AUC < 0.6). Additionally, while ritodrine has been reported to elevate blood glucose levels, 23 its use showed no apparent association with GDM in this study.
Regarding HbA1c levels at the 75-g OGTT, pregnant women with GDM had significantly higher HbA1c levels than those without GDM (p < 0.001). HbA1c reflects blood glucose levels from previous 1–2 months, and at the average OGTT timing of 27.6 weeks, it suggests that hyperglycemia had already developed in women with GDM. Insulin resistance increases around 20 weeks due to hormonal changes, potentially contributing to elevated HbA1c. However, HbA1c alone lacked sufficient diagnostic accuracy for GDM (AUC < 0.6).
Additionally, some cases of abnormally high blood glucose and insulin levels were observed in the pregnant group with GDM, suggesting considerable individual differences. Shimizu et al. 24 reported no differences in abnormal OGTT scores at the time of examination or in the rate of insulin use among 154 pregnant women with GDM. They also found no association between the number of abnormal blood glucose scores at diagnosis and the number of pregnant women who received insulin treatment. Therefore, identifying women who require insulin treatment based on abnormal fasting OGTT scores at the time of examination is challenging. However, when considering the number of pregnant women with GDM who had abnormal blood glucose scores at diagnosis—not just fasting levels—the proportion of those with abnormal BS120 levels, which have been reported to relate to insulin secretion in pregnant women with GDM, 25 was the highest among those with BS0 and BS60 levels in this study. This finding suggests that prolonged hyperglycemia is involved in the onset of GDM. Therefore, these findings support our observation that BS0, BS60, and BS120 served as important confounding factors for the Matsuda index and HOMA-IR in distinguishing GDM status, even though their individual impact was limited.
HOMA-β is an index of insulin secretory capacity determined by fasting blood glucose and insulin levels, 9 and no significant difference was observed between pregnant women with and without GDM. Sadakata and Kohama 26 reported that insulin secretory capacity was preserved in patients with GDM diagnosed during early and mid-term pregnancies, while insulin resistance was high. Therefore, consistent with previous reports, we infer that the insulin secretory capacity of pregnant women with GDM in this study may not differ from that of pregnant women without GDM, as indicated by the HOMA-β index.
HOMA-IR is a stratified index based on fasting values, whereas the Matsuda index is a continuous index reflecting the degree of insulin resistance from both fasting and 2-h postload values. A HOMA-IR value of 1.6 or below is considered normal, whereas a value of 2.5 or above indicates insulin resistance. Moreover, HOMA-IR has been reported to be unable to accurately assess insulin resistance in patients with BS0 levels of 140 mg/dL or higher. 8 In this study, as no pregnant women had BS0 levels of 140 mg/dL or higher, the accuracy of HOMA-IR was confirmed. It was suggested that HOMA-IR values were considerably greater in current pregnant women with GDM, indicating greater insulin resistance. The Matsuda index 13 was markedly lower in pregnant women with GDM, suggesting increased insulin resistance.
Miyasato et al. also evaluated pregnant women with GDM who were diagnosed using a 75-g OGTT at <24 weeks of gestation (four insulin-induced and 75 noninsulin-induced women) and reported that the cutoff value for HOMA-IR at pregnancy for insulin-induced pregnant women was 3.30 (sensitivity, 75%; specificity, 94.7%). 19 In this study, the optimal HOMA-IR cutoff value for GDM discrimination in differentiating pregnant women without GDM from those with GDM was 1.72 (Figure 2), and few pregnant women with a HOMA-IR above 3.30 19 were identified. Some pregnant women without GDM had high HOMA-IR values, while some with GDM had low HOMA-IR values, indicating overlap between the groups. This study population included pregnant women without GDM who retained their insulin secretion capacity, which likely contributed to the lower cutoff values observed compared to those previously reported. 19 Therefore, determining the degree of insulin resistance in pregnant women with suspected GDM is difficult when stratified by HOMA-IR. This may explain why HOMA-IR showed a statistically significant association with GDM status but demonstrated poor model fit as indicated by LOF statistics, along with relatively low AUC and pLR values (Table 3).
QUICKI, an indicator for monitoring the progression of insulin resistance as the reciprocal of the logarithm of HOMA-IR, was considerably lower in pregnant women with GDM, suggesting increased insulin resistance. The QUICKI values observed in this study were approximately within the same range as those reported by Katsuki et al. 27
Therefore, the QUICKI, Matsuda index, and HOMA-IR were considered useful for detecting differences in insulin resistance between the two groups. Although all three insulin resistance indices showed a statistically significant association with GDM status, QUICKI and HOMA-IR were mathematically related therefore their predictive performance for GDM was similar, as indicated by comparable AUC values (data not shown). For further analysis, HOMA-IR and the Matsuda index were selected.
Pan et al. 28 compared the Matsuda index with the HOMA-β and HOMA-IR indices. The association between insulin resistance (Matsuda index or HOMA-IR) and GDM was weaker than that between β-cell dysfunction and GDM in the low BMI group (p < 0.05). Interestingly, in the high BMI group, the association between insulin resistance and GDM was stronger than that between β-cell dysfunction and GDM (p < 0.05), indicating that the Matsuda index had the highest AUC. 28 In this study, BMI values were also significantly higher in pregnant women with GDM than in those without GDM (p < 0.05), and the Matsuda index was most strongly associated with the presence of GDM. Consequently, we speculated that the Matsuda index is a more useful objective index than HOMA-IR for identifying the need for insulin therapy in pregnant women with preserved insulin secretory capacity. Unlike BMI, which did not demonstrate sufficient accuracy as a standalone marker for predicting GDM status, unadjusted HOMA-IR and Matsuda index were statistically significant predictors when considered individually. Although the unadjusted Matsuda index demonstrated a markedly higher AUC than unadjusted HOMA-IR—0.714 vs. 0.618—both values indicate limited discriminatory ability (Table 3). These findings suggest that unadjusted single indices may have limited utility in both the diagnosis and prediction of GDM. However, compared to the AUCs of the unadjusted single indices, propensity score-adjusted HOMA-IR and Matsuda index for independent confounding effects of BS0, BS60, and BS120 resulted in a marked improvement in predictive performance, with AUCs exceeding 0.89 (Table 3). Therefore, the adjusted indices that demonstrated improved ability to predict GDM status may also be valuable for the primary outcome—assessing the utility of the extracted indices in predicting the need for insulin therapy during pregnancy among women suspected of having GDM.
The diagnostic criteria for GDM require that at least one of the three 75-g OGTT values exceeds the established threshold; however, this measurement does not reflect the subsequent course of the disease. In the care of patients with GDM, insulin therapy may be necessary to maintain adequate glycemic control. Therefore, it is difficult to predict the clinical course, including the need for insulin therapy, based solely on GDM diagnostic criteria.
The difference in predictive accuracy for insulin administration, when using the optimal cutoff values of HOMA-IR and the Matsuda index for GDM status, was marginal (Figure 3: 2 × 2 contingency table). However, a marked improvement in the area under the ROC curve was observed when using a propensity score-adjusted index based on the Matsuda index, which demonstrated a higher pLR for identifying patients requiring insulin therapy. Although BS0 and BS120 are components already embedded within the Matsuda index, the observed enhancement in predictive performance suggests that the delayed glycemic response at 120 min during the OGTT represents a critical independent confounding factor in pregnant women. Specifically, the Matsuda index × BS0 × BS120 adjusted index, which adjusts for this confounding effect, showed considerably higher AUC values than either unadjusted HOMA-IR or the Matsuda index alone (Table 4). Furthermore, unlike the adjusted model based on HOMA-IR, the adjusted model incorporating the Matsuda index demonstrated better model fit, as indicated by a lower BIC value. Additionally, its higher pLR further supports its potential as a promising indicator for predicting insulin therapy requirements in pregnant women with suspected GDM. This indicates that it may serve as a more clinically useful tool for predicting future insulin therapy requirements among pregnant women.
The limitations of this study include its retrospective design and data collection from a single institution, collected data from Jan 2018 to Sep 2021, which reflects clinical practices during that period. Owing to the lack of strict guidelines for initiating regular insulin therapy since then, the decision to administer insulin have been left to the physician’s discretion, based on the overall clinical progress of the pregnancy and blood glucose levels. Furthermore, the pathophysiology of insulin secretion differs between early- and mid-term pregnancies and after pregnancy. 29 Additionally, this retrospective study lacked prior sample size estimation, which may have affected the reliability of group comparisons using insulin resistance indices. While post hoc power analysis showed sufficient power for Matsuda index and HOMA-IR, the study design and group size imbalance may limit generalizability. Nonetheless, these findings offer a basis for future prospective research to validate predictive markers for insulin therapy in pregnancy. Therefore, we aim to conduct a more detailed multicenter study to enhance the broader applicability of the findings.
Conclusions
In this study, the unadjusted Matsuda index showed better discriminatory ability for identifying GDM status than HOMA-IR, though its AUC was not sufficiently high. In contrast, the propensity score-adjusted composite index (Matsuda index × BS0 × BS120), which accounts for confounding from delayed glycemic responses during OGTT, demonstrated strong predictive performance not only for GDM status but also, more importantly, for the primary outcome—forecasting the need for insulin therapy in pregnant women suspected of having GDM. This adjusted index outperformed unadjusted insulin resistance markers. The adjusted model, which integrated the Matsuda index adjusted for sustained hyperglycemia, showed a better fit than the HOMA-IR model, suggesting its potential as a promising predictor for insulin therapy in suspected GDM cases.
These results highlight the emerging utility of real-time data in general practice and will be beneficial for future obstetrics and gynecology practices in promoting appropriate insulin treatment for pregnant women with suspected GDM. To enhance the broader applicability of the findings, further validation in multicenter studies is warranted to evaluate this adjusted index in relation to various factors, including the onset of GDM, insulin resistance, and fetal growth.
Footnotes
Acknowledgements
We thank all contributors to this study, including the research assistants at Hokkaido University of Science and Tenshi Hospital.
Ethical considerations
This study was a joint project conducted between Hokkaido University of Science and Tenshi Hospital, utilizing preexisting clinical data and following a retrospective design. The requirement for prior written informed consent was formally waived by the Ethics Committee. The study was approved by the Ethics Committee of Tenshi Hospital (approval number: 151; approved on February 3, 2022) and registered as “Ability to identify pregnant women who required insulin treatment during pregnancy using the Matsuda Index, an index of insulin resistance” in UMIN000056485 on December 18, 2024. This study complied with the Ethical Guidelines for Medical and Health Research Involving Human Participants. All authors confirm that the manuscript is free from plagiarism and complies with ethical standards of scientific publishing.
Consent to participate
Consent was obtained using the opt-out method.
Author contributions
MS and AK conceptualized and designed the study. MS drafted the manuscript. MM provided overall supervision and guidance on data interpretation and writing. KI, CT, TN, and MT contributed to interpreting the therapeutic course and revised the manuscript. MS monitored the patients and acquired their data. All authors contributed to the preparation of the final manuscript.
Funding
The authors received no financial support for the research, authorship, and/or publication of this article.
Declaration of conflicting interests
The authors declared no potential conflicts of interest with respect to the research, authorship, and/or publication of this article.
Data availability statement
All data generated or analyzed during this study are included in this published article and are available from the corresponding author upon reasonable request.