
Abstract
Objective
The study investigated the link between the homeostatic model assessment for insulin resistance (HOMA-IR) and myocardial infarction (MI) parameters, highlighting its role as a potential MI biomarker in Southern Saudi patients.
Methods
This cross-sectional study conducted from January to April 2021 at the Prince Faisal Bin Khalid Cardiac Center, Abha, Saudi Arabia, examined cardiovascular and diabetic biomarkers, including HOMA-IR, in MI patients and controls to assess insulin resistance (IR), risk, and diagnostic accuracy.
Results
MI patients showed significantly elevated HOMA-IR, leptin, resistin, body mass index (BMI), and glucose-complexed hemoglobin (HbA1c) levels compared with controls in both genders (p < 0.0001). HbA1c was strongly associated with HOMA-IR, whereas age, BMI, leptin, and resistin showed weak correlations. Elevated HOMA-IR increased MI risk and demonstrated high diagnostic accuracy.
Conclusions
Elevated HOMA-IR was identified as an early indicator of the onset of MI, whereas serum leptin and resistin levels exhibited a positive association with IR in patients with MI. Moreover, serum leptin, resistin, and elevated HOMA-IR may independently contribute to the risk of MI.
Introduction
It has been reported that the major portion of deaths (>50%) in patients with diabetes mellitus (DM) are due to cardiovascular (CV) causes. 1 There are two types of myocardial infarction (MI): silent, which may go undetected, and the second type might be catastrophic, resulting in deteriorating hemodynamics and sudden death. 2 Coronary artery disease (CAD) is considered the most common cause of MI. The build-up of cholesterol-rich substances in the coronary arteries leads to CAD. 2 Insulin resistance (IR), as assessed by the homeostatic model assessment for IR (HOMA-IR), is a significant factor in several clinical conditions associated with CV diseases and type 2 diabetes mellitus (T2DM).3,4 IR arises when cells cannot respond to insulin properly or reduce insulin receptor activity in response to hyperinsulinemia. Recent investigations have revealed that HOMA-IR has emerged as the most trustworthy independent predictor of severe and extensive coronary atherosclerosis.4,5
In IR, a pancreatic beta cell that is resistant to insulin produces more insulin. Consequently, hyperinsulinemia occurs to compensate for elevated blood glucose levels. Insulin levels are higher, beta cells are upregulated, and blood glucose levels are maintained during compensated IR. As glucose levels rise and compensatory insulin secretion is unable to increase, type 2 diabetes will develop. 6 Gene polymorphism of insulin receptor substrates has been also implicated in the development of T2DM. 7
HOMA-IR is linked to endothelial dysfunction, pro-inflammatory states, and increased atherosclerosis risk in CV disease. 8 Diabetic patients often develop CAD within a decade due to IR. IR is directly associated with atherosclerosis progression, coronary artery calcification, and carotid intima-media thickness. 9 MI is the leading cause of mortality in patients with T2DM, necessitating aggressive treatment and glycemic control to improve CV outcomes. 10 Moreover, Eid et al. 6 found that individuals with a body mass index (BMI) of 20–27 kg/m2 who experienced a sudden weight gain of 2–10 kg were more likely to have elevated HOMA-IR levels. 11
A previous study discovered that leptin, acting via tumor necrosis factor, may play a role in the development of MI, although the mechanisms involved are not fully elucidated.12,13 Furthermore, other reports have demonstrated that human resistin increases the expression of various pro-inflammatory factors, including endothelin-1, MCP-1, matrix metalloproteinases, and adhesion molecules, in endothelial cells. 14
Considering the current gaps in knowledge regarding the association between HOMA-IR and MI, this study aimed to investigate deeper the potential influence of HOMA-IR on clinical factors associated with MI. Examining the relationship between HOMA-IR levels and MI is particularly critical in this investigation because it could provide novel insights into the risk factors contributing to MI, paving the way for improved prevention and management strategies in patients with elevated IR.
Materials and methods
Study design and participants
In 2021, we conducted a population-based cross-sectional study in Abha, Asir Province, Saudi Arabia. This study, conducted in accordance with the Helsinki Declaration of 1975, as revised in 2013, was approved by Directorate Health Affairs, Asir Region Research Ethics Committee (REC-NO:13-2-2021), and King Khalid University Research Ethics Committee (ECM#2019-13). All patient details were de-identified to maintain confidentiality. The reporting of this study conforms to STROBE guidelines. 15 The participants of the study included 74 MI patients (49 males and 25 females) at the Prince Faisal Bin Khalid Cardiac Center (PFBKCC) in Abha, Saudi Arabia, and 77 healthy controls (29 males and 48 females); informed consent from the patients was obtained before blood collection. Patients were recruited within 24 hours of MI, and blood samples were collected within the same timeframe. The samples were obtained following the completion of all required tests at PFBKCC. These samples were obtained after finishing all necessary tests in PFBKCC. To determine BMI, demographic data from patients' medical records were retrieved, including gender, age, weight, and height whereas BMI was calculated as kg/m2. A calculated BMI of <25 kg/m2 is considered normal, between 25 kg/m2 and 29.9 kg/m2 is classified as overweight, and >30 kg/m2 is categorized as obese.
Patients with ST-segment elevation MI were included in the study. Exclusion criteria for the MI patients comprised medical history of renal failure or liver failure, thyroid problems, DM, acute or chronic inflammatory disorders, cardiomyopathy, or the current use of corticosteroids, lipid-lowering drugs, or smoking. Likewise, the exclusion criteria for the controls were patients with prior background of CAD (percutaneous coronary intervention MI and bypass grafting of coronary artery), known cases of smoking, DM, current use of corticosteroids, lipid-lowering drugs, and corroboration of noteworthy concomitant diseases, in particular hemodynamically significant valvular heart disease, surgery, or trauma within the previous month, known cardiomyopathy, known malignant diseases, or febrile conditions.
Sample collection and storage
The participant samples were divided into three groups, namely combined (containing both male and female subjects), male, and female groups, to analyze gender-wise differences. All three groups were again subdivided into controls and MI patients. Purposive/convenient sampling technique was used. After a fasting period of 10–12 hours, blood samples were collected from the patients and controls for the determination of the study parameters. The plasma and serum samples from all the participants were separated by centrifugation and aliquots were analyzed fresh as far as possible or some stored in a −20°C freezer until further analysis.
Measurements of biochemical markers
An automated clinical chemistry analyzer (Beckman Coulter chemistry analyzer, AU480, Beckman Coulter Diagnostics company, Riyadh, Saudi Arabia) was used to measure biochemical parameters, including glucose and cholesterol. Glucose-complexed hemoglobin (HbA1c), creatine monophosphate, lactate dehydrogenase, insulin, and triglycerides were measured using Abbott’s Architect PLUS S4000 (Abbott, Abbott Park, Illinois, USA), whereas cardiac troponin I (cTnI) was analyzed at PFBKCC with Abbott’s i-STAT 1 analyzer (Abbott). Commercially available enzyme-linked immunosorbent assay kits were used to determine the concentration of leptin and resistin in accordance with the manufacturer’s instructions (Novex by Life Technologies, Human Leptin Elisa kit, Cat.#KAC2281; Novex by Life Technologies, Human Resistin Elisa kit, Cat.#KHP0051). These were measured using FLUOstar® Omega Plate Reader (BMG LABTECH, Ortenberg, Germany). As determined, although hyperinsulinemic euglycemic clamp is the best and the gold standard test for IR, its practical clinical application is limited due to ethical and economic reasons. Alternatively, HOMA-IR is calculated instead
16
using the following formula:

Statistics analysis
Data were analyzed using GraphPad Prism v9.2.0 (GraphPad Software, Inc, San Diego, California, USA). Quantitative data were expressed as mean ± SD, whereas qualitative data were presented as numbers and percentages. The t test was used to compare means between two samples. The receiver operating characteristic curve (ROC) was used to appraise the overall diagnostic performance and to compare the performance between the diagnostic tests. Pearson's correlation coefficient was used to evaluate the strength and significance of correlations between IR and MI. A significance level of p < 0.05 was considered statistically significant.
Results
Characteristics of both the demographic profile and serum biochemical parameters among subjects with MI
The study included 74 individuals diagnosed with MI, where males comprised 66.2% and females 33.8% of the total. Furthermore, 77 healthy volunteers contributed to the study, with males constituting 38% and females 62% of the group. Table 1 presents a summary of the demographic and serum biochemical parameters of the participants. The mean BMI was lesser in the combined, male, and female groups than those who were diagnosed with MI as shown in Figure 1 in both genders (a), in male (b), and in female (c). Serum levels of glucose, HbA1c, insulin, leptin, and resistin were markedly elevated (p < 0.0001) in all patients compared with the control group.
General characteristics of the combined, male and female study controls, and MI patients.
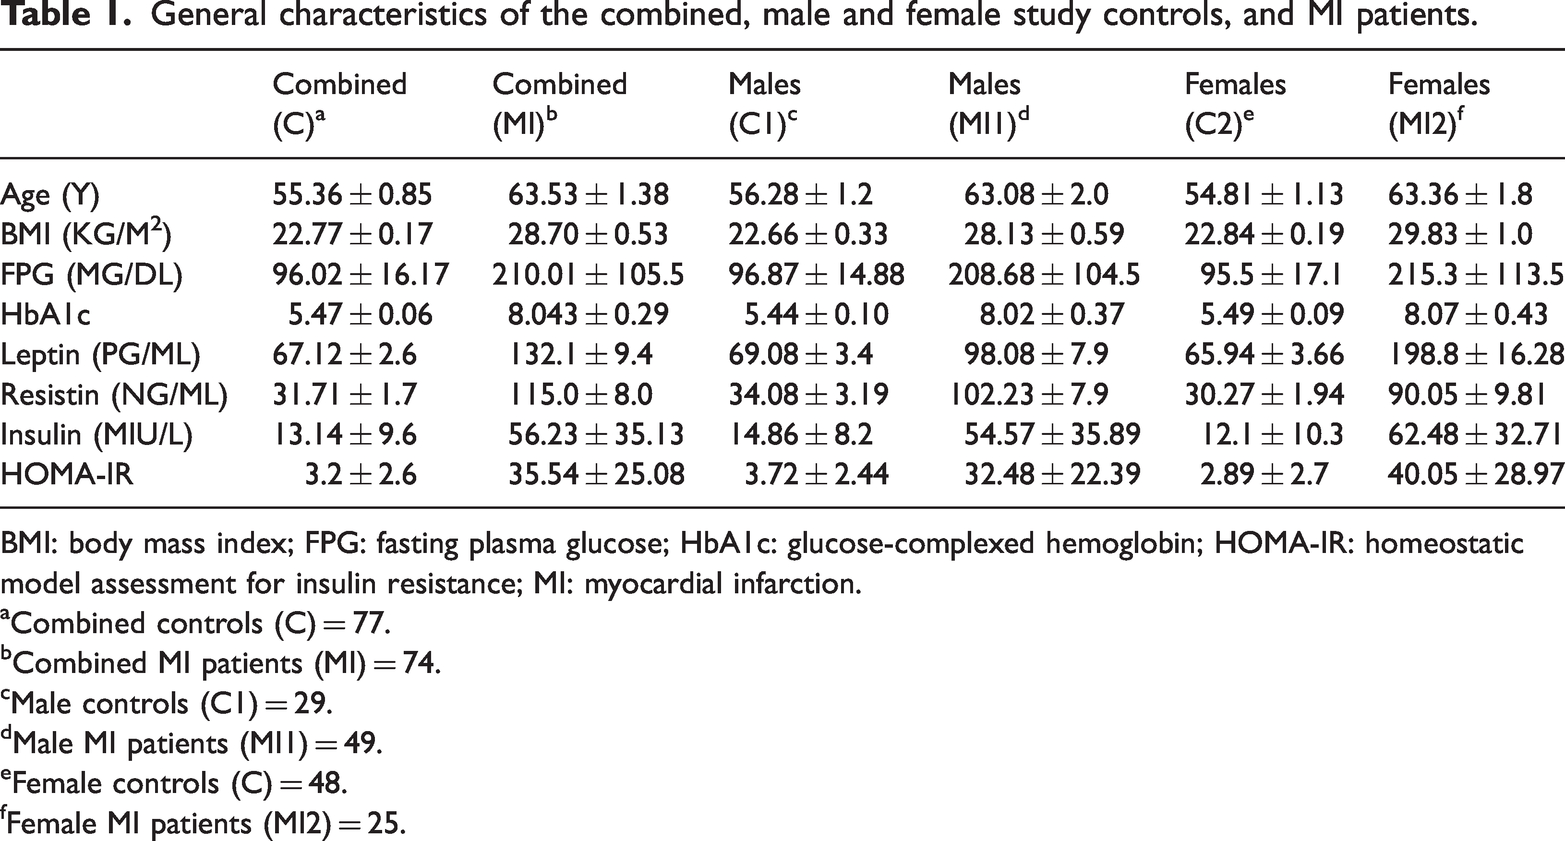
BMI: body mass index; FPG: fasting plasma glucose; HbA1c: glucose-complexed hemoglobin; HOMA-IR: homeostatic model assessment for insulin resistance; MI: myocardial infarction.
Combined controls (C) = 77.
Combined MI patients (MI) = 74.
Male controls (C1) = 29.
Male MI patients (MI1) = 49.
Female controls (C) = 48.
Female MI patients (MI2) = 25.

The mean BMI (mean ± SD) of control and MI patients in both genders (a), in males (b), and in females (c). Mean HbA1c (mean ± SD) of control and MI patients in both genders (d), in males (e), and in females (f). BMI: body mass index; HbA1c: glucose-complexed hemoglobin; MI: myocardial infarction.
Subjects with MI have significantly elevated BMI and HbA1c levels
When comparing the combined group of 74 male and female MI patients with the combined group of 77 male and female in the control group, it was observed that BMI was notably higher in MI patients compared with the control group (28.7 ± 0.53 kg/m2 vs 22.77 ± 1.17 kg/m2), which was higher than the normal range of BMI (18.5–24.9 m2), as shown in Figure 1(a), p < 0.0001. The mean BMI was significantly higher in the 49 males with MI than those in the control male group (28.13 ± 0.59 kg/m2 vs 22.66 ± 0.33 kg/m2), as illustrated in Figure 1(b). Moreover, on comparing the 40 females diagnosed with MI with the 48 controls, it was found that the average BMI was significantly higher in females with MI than in those in the control group (29.83 ± 1.0 kg/m2 vs 22.84 ± 0.19 kg/m2) as seen in Figure 1(c).
To assess HbA1c level in light of MI, as shown in Figure 1(d) to (f), the mean level of HbA1c of MI patients was consistently significantly higher in both genders (Figure 1(d); 8.04 ± 0.29 vs 5.47 ± 0.06), in males (Figure 1(e); 8.02 ± 0.37 vs 5.49 ± 0.09), and in females (Figure 1(f); 8.07 ± 0.43 vs 5.49 ± 0.09).
Subjects with MI have significantly elevated leptin and resistin
The analysis showed that the level of leptin was significantly elevated in both genders (Figure 2(a); 132.1 ± 9.4 vs 67.12 ± 2.6), in males (Figure 2(b); 98.08 ± 7.9 vs 69.08 ±3.4), and in females (Figure 2(c); 198.8 ±16.28 vs 65.94 ± 3.66) than in controls. In a comparative analysis, individuals who have MI exhibited notably higher levels of the hormone resistin compared with those in the control group for both genders (Figure 2(d); 115.0 ± 8.0 vs 31.71 ± 1.7), in males (Figure 2(e); 102.23 ± 7.9 vs 34.08 ± 3.19), and in females (Figure 2(f); 90.05 ± 9.81 vs 30.27 ± 1.94).

The mean leptin (mean ± SD) of controls and MI patients in both genders (a), in males (b), and in females (c). Mean resistin (mean ± SD) of controls and MI patients in both genders (d), in males (e), and in females (f). MI: myocardial infarction.
Subjects with MI have significantly increased HOMA-IR
A notable difference in HOMA-IR levels was observed between the MI group and the control group among both genders (Figure 3(a); 35.54 ± 25.08 vs 3.2 ± 2.6) when HOMA-IR was compared between the 74 MI patients with the 77 control subjects. Regarding gender, a significant difference between males in the control group and males in MI patients was observed (Figure 3(b); 3.72 ± 2.44 vs 32.48 ± 22.39) and, as seen, in females as well (Figure 3(c); 2.89 ± 2.7 vs 40.05 ± 28.97).

Mean of the calculated HOMA-IR (mean ± SD) between controls and MI patients, both genders (a), in males (b), and in females (c). HOMA-IR: homeostatic model assessment for insulin resistance; MI: myocardial infarction.
Correlation between HOMA-IR and leptin and resistin levels
Table 2 shows the Pearson’s correlation coefficient between HOMA-IR and several risk factors including age, BMI, HbA1c, leptin, and resistin. The correlation analysis demonstrated that the level of age, BMI, leptin, and resistin were weakly associated with HOMA-IR, except HbA1c which was significantly associated with HOMA-IR. It shows that the factors were significantly associated between the level of leptin and resistin with HOMA-IR level. Pearson’s correlation coefficients were 0.19 and 0.191 for leptin and resistin, respectively, both with a p < 0.001, suggesting a weekly association with the development of MI.
Correlation of decision limits of different tested variables with HOMA-IR.

BMI: body mass index; CI: confidence interval; HbA1c: glucose-complexed hemoglobin; HOMA-IR: homeostatic model assessment for insulin resistance; R2: Pearson’s correlation coefficient; p: statistical significance.
Elevated HOMA-IR carries a greater risk for MI
Table 3 presents the prevalence risk and odds ratio along with their 95% confidence interval for coefficient estimates resulting from different regression models. Statistically significant findings indicate that HOMA-IR scores significantly influence the probability of being diagnosed with MI, with a 65.3-fold increase in relative risk and a 7.2-fold increase in odds for each unit increase in HOMA-IR (p < 0.0001).
Risk assessment of elevated MI.
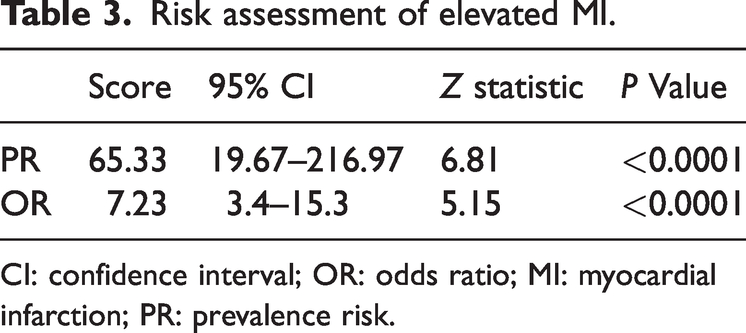
CI: confidence interval; OR: odds ratio; MI: myocardial infarction; PR: prevalence risk.
HOMA-IR displays high diagnostic accuracy for MI
To determine the most effective cut-off, point for maximizing both sensitivity and specificity in discriminating HOMA-IR among individuals with MI, we analyzed ROC curve analysis for all subjects, irrespective of gender. It was found that in the area under the curve (AUC), as shown in Figure 4(a) to (c), discrimination was significantly separated for HOMA-IR, leptin, and resistin with high accuracy in HOMA-IR and resistin, and moderate accuracy for leptin (AUC = 0.981, 0.921, and 0.72, respectively).

ROC curves of subject to discriminate (a) HOMA-IR, (b) leptin, and (c) resistin. AUC: area under the curve; HOMA-IR: homeostatic model assessment for insulin resistance; ROC: receiver operating characteristic curve.
Discussions
The observed association between elevated HOMA-IR levels and atherosclerosis in MI patients further supports the notion that HOMA-IR serves as an early indicator of MI onset. Additionally, the positive correlation of serum leptin and resistin levels with IR in MI patients aligns with previous findings, reinforcing their potential role in the pathophysiology of MI. There is an increase in the levels of biochemical biomarkers in the myocardium as a result of cell loss. 14 Studies have shown that polypeptide hormones produced by adipocytes such as leptin and resistin are essential in regulating metabolism.7,14 Compared with the control group, patients with MI exhibited significantly higher levels of BMI, fasting plasma glucose, insulin, HbA1c, leptin, resistin, and HOMA-IR (Table 1). Evidence from previous studies has established that an increased BMI is strongly associated with metabolic disturbances such as dyslipidemia, diabetes, hypertension, and systemic inflammation, which collectively contribute to a pro-coagulant state and elevate the risk of MI. These findings align with existing literature, highlighting the role of obesity and related metabolic dysfunctions as critical risk factors for CV disease. In a study performed by Ng et al., 17 there exists a positive association between raised levels of HbA1c and BMI and the occurrence of myocardial dysfunction and cardiomyopathy. In addition, several reports stated a significant association between higher MI and higher BMI. 18 As illustrated in Figure 2, individuals with MI exhibit significantly elevated levels of leptin and resistin. Existing literature supports the role of leptin in modulating myocardial blood flow, promoting angiogenesis, contributing to arterial thrombosis, and enhancing inflammatory vascular responses. These findings reinforce the hypothesis that leptin acts as a key mediator in the pathophysiology of CV disease, potentially exacerbating the progression of atherosclerosis and increasing the risk of adverse cardiac events. Similarly, resistin has been implicated in promoting endothelial dysfunction and inflammation, further linking it to the development and progression of MI.19,20 Regarding acute myocardial infarction (AMI) as an inflammatory process, a particular pathway has received wide investigation. Tumor necrosis factor-alpha, a pro-inflammatory mediator, is associated with recurrent MI and mortality. 21
Resistin production arises from various sources in both humans and animals, with distinct differences between the two. In humans, resistin is primarily produced by monocytes and macrophages, highlighting its role in inflammatory processes and metabolic dysfunction. In contrast, in animals, resistin is predominantly generated by adipocytes, suggesting a more direct involvement in adipose tissue metabolism and IR. 22 These differences indicate species-specific mechanisms in the regulation and function of resistin, which may influence its role in the development of metabolic and CV diseases. The serum resistin levels of patients with CAD are also increased in other studies, which are consistent with our results. A quantitative index of atherosclerosis, coronary artery calcification, was discovered to be independently associated with circulating resistin levels and found that patients with premature CAD had higher serum resistin levels than normal individuals. 23 There are several possible explanations for these differences. It is possible that resistance differences in resistin are found only early in the course of a disease, whereas our study measured resistin in survivors of MI. As a result, it is possible that the two studies investigated an earlier stage of disease, whereas our study did not include those who are dying from their disease and have high resistin levels. Various ethnic groups may also have varying resistin levels.
Our study showed that subjects with MI have significantly increased the HOMA-IR. CV disease and atherosclerosis progress more rapidly in people with diabetes. 6 CV intervention patients account for one-third of diabetic patients and half of patients with coronary artery bypass. 24 In diabetic patients, cardiac lesions tend to be more diffused and more infiltrated with inflammatory cells. Patients with diabetes who experience AMI tend to have more severe lesions and a poorer long-term prognosis compared with those without diabetes. 11 IR contributes to inflammation, coagulation, and endothelial dysfunction. 21 Moreover, diabetic patients with MI who have higher levels of HbA1c and a longer duration of diabetes are more likely to present with lipid-rich plaques, thin-cap fibroatheromas, and plaque ruptures. 9
The correlation analysis of decision limits for various tested variables with HOMA-IR demonstrated a significant association among these parameters (Table 2). Higher HOMA-IR values were directly correlated with increased leptin levels, suggesting a potential link between IR and leptin dysregulation. Based on these findings, it can be speculated that leptin levels may be influenced by additional confounding factors. Previous research provides substantial evidence indicating that elevated leptin levels contribute to the development of IR, highlighting leptin's role in metabolic dysfunction and its potential as a biomarker for assessing cardiometabolic risk. 25 In other studies, leptin has been shown to regulate the function of pancreatic cells. 26 A decrease in food intake is associated with leptin’s effects, as well as an improvement in insulin response. 6 HOMA-IR levels and resistin levels, in this study, are significantly correlated as illustrated in previous research.27–29 Therefore, we have further strengthened the hypothesis that IR is closely associated with serum resistin.
The result of this study shows that the AUC discrimination was significantly separated for HOMA-IR, leptin, and resistin showing high accuracy in HOMA-IR and resistin and moderate accuracy for leptin. As a screening test, HOMA assessments should be capable of identifying a significant proportion of early-stage diseases in their preclinical stages, aligning with the imperative of early disease detection. However, the absence of data from extensive, high-risk populations has prevented the establishment of a definitive cut-off for IR. 30 All these discrepancies in previous studies along with our findings in the research show a valuable addition to the propagation of MI. Elevated insulin levels induce oxidative stress and inflammation in both macrophages and endothelial cells. 31 These cell types subsequently release pro-inflammatory cytokines and interleukins, contributing to vascular endothelial damage.32,33 Recent studies have found decreased syndecan-1 levels and impaired glycocalyx to be contributing factors to vulnerable cells. 34 Hence, we can say that HOMA-IR displays high diagnostic accuracy for MI.
Our research had several limitations. Initially, this study was performed in a single center albeit with a large sample size, thus limiting the generalizability of our findings until further research is conducted in this aspect. Second, only one-time laboratory parameters were collected (at admission), which could also cause a potential bias because some patients were possibly on lipid-lowering medicines. Additionally, the differences in clinical characteristics, such as gender distribution, between the case and control groups have been acknowledged as a potential limitation of the analyses. However, these differences were carefully considered during the study design and statistical analysis to minimize their impact on the results. Appropriate adjustments were made to account for confounding variables, ensuring the reliability and validity of the findings. Nevertheless, this limitation has been recognized and addressed in the discussion section.
Conclusions
The results revealed that patients with MI had markedly elevated levels of leptin, resistin, and insulin than those who did not have MI. HOMA-IR values were positively correlated with leptin and resistin levels in people with AMI, suggesting that they may be contributing to MI development. The association of metabolic disturbances with CV diseases can also be demonstrated by the fact that AMI patients have higher HOMA-IR, indicating a greater risk of MI diagnosis.
Abbreviations
acute myocardial infarction area under the curve body mass index coronary artery disease cardiovascular diabetes mellitus glucose-complexed hemoglobin homeostatic model assessment for insulin resistance insulin resistance myocardial infarction Prince Faisal Bin Khalid Cardiac Center receiver operating characteristic curve type 2 diabetes mellitus
Footnotes
Acknowledgements
Author expresses their gratitude to the laboratory department of the Prince Faisal Bin Khalid Cardiac Center (PFBKCC) in Abha, Saudi Arabia.
Author’s contributions
Conceptualization, methodology, validation, formal analysis, writing, and funding acquisition by AAD. The author has agreed to finalize and publish this version of the manuscript. The author agrees to take responsibility for all aspects of the research to ensure that challenges relating to the accuracy or integrity of any part of the article are properly investigated and resolved.
Declaration of conflicting interests
The author declares that they have no conflict of interest.
Ethics approval statement
This study was approved by Directorate Health Affairs, Asir Region Research Ethics (REC-NO:13-2-2021), and King Khalid University Research Ethics Committee (ECM#2019-13).
Consent to participate and publish
The author accepted responsibility for the entire content of this submitted manuscript and approved submission.
Competing interests
The author has no relevant financial or non-financial interests to disclose.
Data availability
All data used in this manuscript are available with the author and can be provided on reasonable request for noncommercial purposes.
Funding
The author extends his appreciation to the Deanship of Scientific Research at King Khalid University for funding this work through small group Research Project under grant number RGP2/154/46.