
Abstract
Objective
The aim of this study was to identify and validate ferroptosis-related markers in ulcerative colitis (UC) to explore new directions for UC diagnosis and treatment.
Methods
We screened UC chips and ferroptosis-related genes from the Gene Expression Omnibus (GEO), FerrDb, and GeneCards databases. The differentially expressed genes (DEGs) and ferroptosis-related DEGs between the UC group and normal controls were analyzed using bioinformatics methods. Enrichment analysis, protein–protein interaction analysis, and hub genes were screened. Peripheral blood chip and animal experiments were used to validate the ferroptosis-related hub genes. Finally, hub gene–transcription factor, hub gene–microRNA (miRNA), and hub gene–drug interaction networks were constructed.
Results
Overall, 26 ferroptosis-related DEGs were identified that were significantly enriched in energy pathways and metabolism. We identified ten ferroptosis-related hub genes from the protein–protein interaction network: IL6, PTGS2, HIF1A, CD44, MUC1, CAV1, NOS2, CXCL2, SCD, and ACSL4. In the peripheral blood chip GSE94648, CD44 and MUC1 were upregulated, which was consistent with the expression trend in GSE75214. Animal experiments showed that CD44 expression was significantly increased in the colon.
Conclusions
Our findings indicate that CD44 and MUC1 may be ferroptosis-related markers in UC.
Keywords
Introduction
Ulcerative colitis (UC) is a chronic relapsing colorectal inflammatory disease with unknown etiology. The incidence of UC is increasing globally, but it is difficult to cure. Approximately 15% of UC patients will experience an aggressive course, and some will even develop dysplasia and colorectal cancer (CRC). The current research on the pathogenesis of UC has mainly focused on genetics, microbiota, immunity, environment, and the intestinal mucosal barrier.1–4 However, the exact pathogenesis of UC is still not fully understood. Therefore, exploring the etiology and pathogenesis of UC is of great significance to the diagnosis and treatment of this disease.
Recent evidence indicates that ferroptosis is closely related to the pathogenesis of UC.5,6 Ferroptosis is a recently discovered type of regulated cell death, and its occurrence is associated with the excessive accumulation of iron-dependent lipid reactive oxygen species (ROS) and consumption of polyunsaturated fatty acids in the plasma membrane.6,7 Excessive iron aggravates dextran sulfate sodium (DSS) colitis in rats, and a human diet high in iron also increases the risk of UC.8,9Iron chelators reduce ROS and improve UC. 10 However, the anti-inflammatory drug sulfasalazine, used for the treatment of UC, can also induce ferroptosis in cells by inhibiting the function of the antiporter system Xc−. 7 This may be one cause of adverse reactions to sulfasalazine. Regulating ferroptosis can ameliorate DSS-induced UC.11,12 However, the current research on ferroptosis in UC is still at an early stage, and the role of ferroptosis in the pathogenesis of UC is not fully understood. 6 Some studies have reported contrasting results. Uncovering and studying UC ferroptosis-related markers may provide new directions for UC diagnosis and treatment.
Here, we searched for ferroptosis-related genes in UC to address the lack of new ferroptosis-specific pharmacodynamic markers or biomarkers. 13 The differentially expressed genes (DEGs) related to ferroptosis in UC were enriched and analyzed, and a protein–protein interaction (PPI) network was constructed. Then, we screened for ferroptosis-related hub genes. Peripheral blood chip and animal experiments were used to validate these ferroptosis-related hub genes, and then microRNAs (miRNAs), transcription factors (TFs), or drugs targeting the hub genes were predicted.
Materials and methods
Screening of microarray data and ferroptosis-related genes
We searched Gene Expression Omnibus (GEO) (https://www.ncbi.nlm.nih.gov/geo/), the ferroptosis-related database FerrDb (http://www.zhounan.org/ferrdb/index.html), and the GeneCards database (https://www.genecards.org/) to find microarray data and ferroptosis-related genes. 14 GEO search formula: ((((inflammatory bowel diseases) OR Colitis, Ulcerative) OR Crohn Disease) OR colitis) AND “Homo sapiens”. The driver, suppressor, and marker genes related to ferroptosis were downloaded from FerrDb. The GeneCards database was searched using “ferroptosis”. The GEO inclusion criteria were human UC intestinal biopsy specimens or peripheral blood specimens, and more than eight cases. The exclusion criterion was colitis-associated CRC.
Identification of DEGs related to ferroptosis
GEO2R was used for GEO chips. The parameter options used were: 1) apply adjustment to the P-values: Benjamini and Hochberg (false discovery rate); 2) apply log transformation to the data: auto-detect; 3) apply limma precision weights (vooma): yes; 4) force normalization or quantile normalization: yes; 5) category of platform annotation to display on results: NCBI generated; 6) significance level cut-off: 0.05; 7) DEGs filter criteria: |log fold change (FC)| ≥1 and adj. P-value <0.05. SangerBox software (http://soft.sangerbox.com/) was used to generate volcano maps. The abscissa was −log10 (P-value), the ordinate was log2(FC), cut FC (−1.0 to 1.0), and cut P-value: 0.05. The red nodes represent upregulated DEGs, the green nodes are downregulated DEGs, and the black nodes are genes with no difference. Then, the DEGs and the ferroptosis-related genes from FerrDb and GeneCards were intersected using online Bioinformatics and Evolutionary Genomics to generate a Venn diagram (http://bioinformatics.psb.ugent.be/webtools/Venn/).
Gene enrichment analysis
FunRich-3.1.3 tool (http://www.funrich.org/) was used for gene enrichment analysis, including cell components, molecular functions, and biological processes. Based on Kyoto Encyclopedia of Genes and Genomes (KEGG), Enrichr (https://maayanlab.cloud/Enrichr/) was used for pathway analysis. A P-value less than 0.05 was defined as statistically significant.15,16
Construction of PPI network and identification of hub genes
A PPI network was constructed by GeneMANIA software (http://genemania.org/) using the automatically selected weighting method. Different colored edges represent different bioinformatics methods, including co-expression, physical interactions, colocalization, predicted pathways, shared protein domains, and genetic interactions.
The ferroptosis-related PPI network was constructed with STRING (version 11.0, https://string-db.org/). The organism was limited to Homo sapiens. The minimum effective binding score was set to 0.4. Then, the PPI results were imported into Cytoscape (version 3.6.0) for software analysis. 17 CytoHubba in Cytoscape was used to screen the top ten hub genes, and the algorithm used was the degree of connectivity. 18
Validation of hub genes
The peripheral blood chip GSE94648 was used to validate the hub genes. GraphPad Prism v 5.0 statistical software was used to analyze the expression of the hub genes in peripheral blood. The statistical method used was an unpaired t test, and differences were considered statistically significant with P-values <0.05. The hub gene verification method used was the same as that in our previous study. 19 Then, the statistically significant hub genes were further verified with animal experiments. The experimental animals were male BALB/c mice purchased from Tengxin Biotechnology (Chongqing, China), aged 6 to 8 weeks and weighing 18 to 22 g. Sixteen mice were randomly divided into two groups of eight animals each. The animal experiments were approved by the Ethics Committee of Guizhou Provincial People's Hospital on 8 April 2020 (No. 2020-256). We used 3% DSS (molecular weight 36–50 kDa; MP Biomedicals, Aurora, CO, USA) to induce a model of UC. Immunohistochemistry (IHC) was used to detect the expression of the hub genes in colon tissues. A rabbit anti-MUC1 antibody (1:200, ABclonal, Wuhan, China) and a rabbit anti-CD44 antibody (1:200, Affinity Biosciences, Cincinnati, OH, USA) were used as primary antibodies for IHC. A goat anti-rabbit horseradish peroxidase-conjugated secondary antibody (Beijing Zhongshan Jinqiao Biotechnology, Beijing, China) was used for detection. Analysis of variance (ANOVA) was used for statistical analysis. The experimental method was the same as that in our previous study. 20
Construction of miRNA (or TF)–hub gene network
The target genes and miRNA or TF interaction networks were generated by NetworkAnalyst (https://www.networkanalyst.ca/). 21 The parameters used were as follows: specify organism: H. sapiens (human); set ID type: Official Gene Symbol; Gene–miRNA interaction database: miRTarBase v8.0, TarBase v8.0 and miRecords databases; and TF–gene interaction database: ENCODE, JASPAR, and ChEA databases. The analysis results of NetworkAnalyst were then imported into Cytoscape software for further visualization.
Potential drug prediction
Potential drugs targeting the hub genes were predicted by The Drug Gene Interaction Database (DGIdb, https://dgidb.genome.wustl.edu/). The parameters used were: search for drug–gene interactions by gene; preset filters: none; advanced filters: none. Then the drug–gene interactions found in DGIdb were imported into Cytoscape software for further visualization.
Results
Ferroptosis-related DEGs in UC
We searched the GEO database to obtain 9984 data points from inflammatory bowel disease-related chips. Further screening resulted in two chips: GSE75214 and GSE94648. GSE75214, containing mucosal gene expression profiling of the colon, included 97 UC patients and 11 controls. GSE94648, used for validating the hub genes found in colon tissue, contained peripheral whole blood expression data of 22 healthy controls and 25 UC patients. We identified 545 upregulated DEGs and 300 downregulated DEGs from GSE75214, as shown in Figure 1a. There were 259 ferroptosis-related genes in FerrDb and 103 ferroptosis-related genes in GeneCards. After finding overlapping genes between the GSE75214 DEGs and the FerrDb and GeneCards genes, 26 ferroptosis-related DEGs were obtained, as shown in Figure 1b.

The differentially expressed genes (DEGs). (a) Volcano plot of GSE75214. The cutoff logFC (fold change) was −1/1, and P-value is 0.05. Red dots indicate upregulated genes; green dots indicate downregulated genes; black dots indicate non-statistically significant genes. (b) Venn diagram of the ferroptosis-related DEGs.
Results of enrichment analysis
The results of the GO enrichment analysis indicated that for cell components, the ferroptosis-related DEGs were enriched for the terms integral to membrane, integral to plasma membrane, extracellular, mitochondrion, lysosome, endoplasmic reticulum, nucleus, exosomes, cytoplasm, and plasma membrane. In terms of the molecular functions, the ferroptosis-related DEGs were mainly enriched in chemokine activity, ligase activity, cytokine activity, oxidoreductase activity, auxiliary transport protein activity, peroxidase activity, transcription factor activity, receptor activity, catalytic activity, and molecular function unknown. For biological processes, the ferroptosis-related DEGs were mainly enriched in cell communication, apoptosis, regulation of nucleobase and its analogue, cell growth and/or maintenance, transport, immune response, signal transduction, and biological process unknown. They were particularly significantly enriched in energy pathways and metabolism (P < 0.05). The KEGG enrichment results indicated that the ferroptosis-related DEGs were mainly enriched in biosynthesis of unsaturated fatty acids, legionellosis, leishmaniasis, the PPAR signaling pathway, ferroptosis, fatty acid biosynthesis, salmonella infection, the interleukin-17 (IL-17) signaling pathway, the hypoxia inducible factor-1 (HIF-1) signaling pathway, and the tumor necrosis factor (TNF) signaling pathway (P < 0.05) (Figure 2).
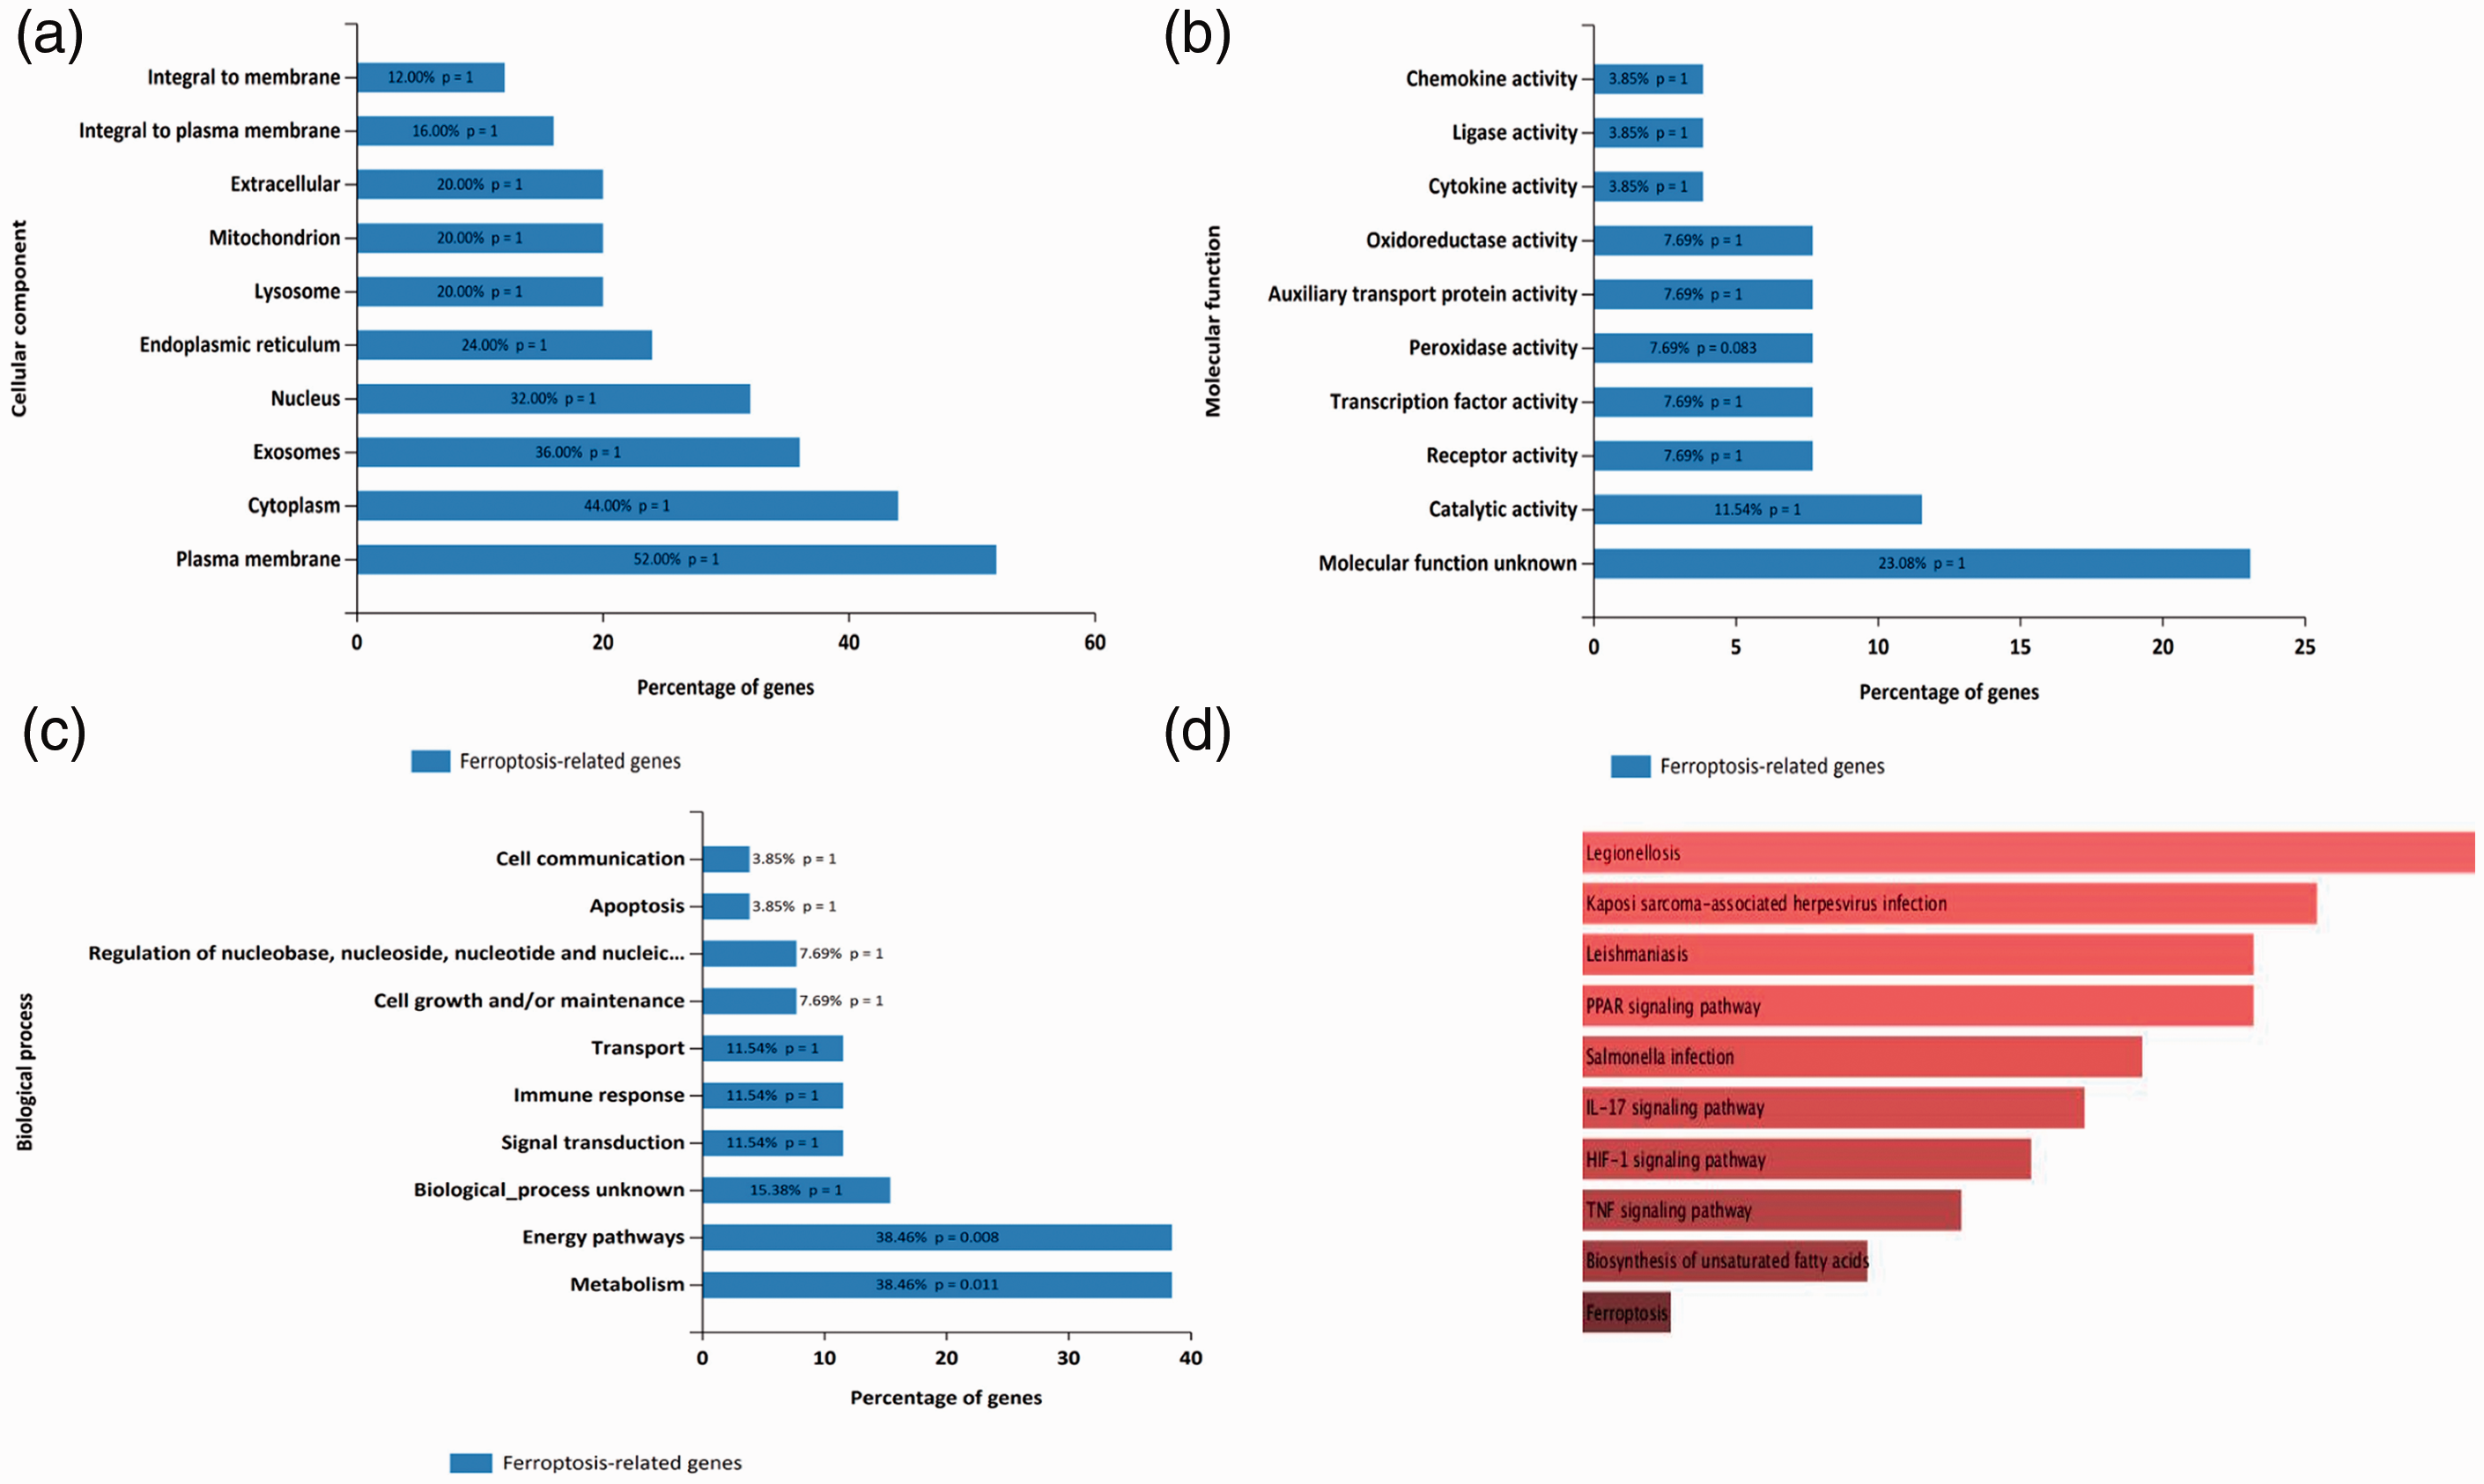
Enrichment analysis of the ferroptosis-related differentially expressed genes (DEGs). (a) Cell component analysis for the ferroptosis-related DEGs. (b) Molecular functions analysis for the ferroptosis-related DEGs. (c) Biological processes analysis for the ferroptosis-related DEGs. (d) Kyoto Encyclopedia of Genes and Genomes (KEGG) pathway analysis for the ferroptosis-related DEGs.
PPI and hub genes
The PPI network constructed with GeneMANIA is shown in Figure 3a. In the PPI network, co-expression accounts for 68.60%, physical interactions account for 14.07%, colocalization accounts for 10.50%, predicted accounts for 2.65%, pathway accounts for 2.31%, shared protein domains account for 1.62%, and genetic interactions account for 0.24%. The functions of the ferroptosis-related DEGs are shown in Figure 3a.
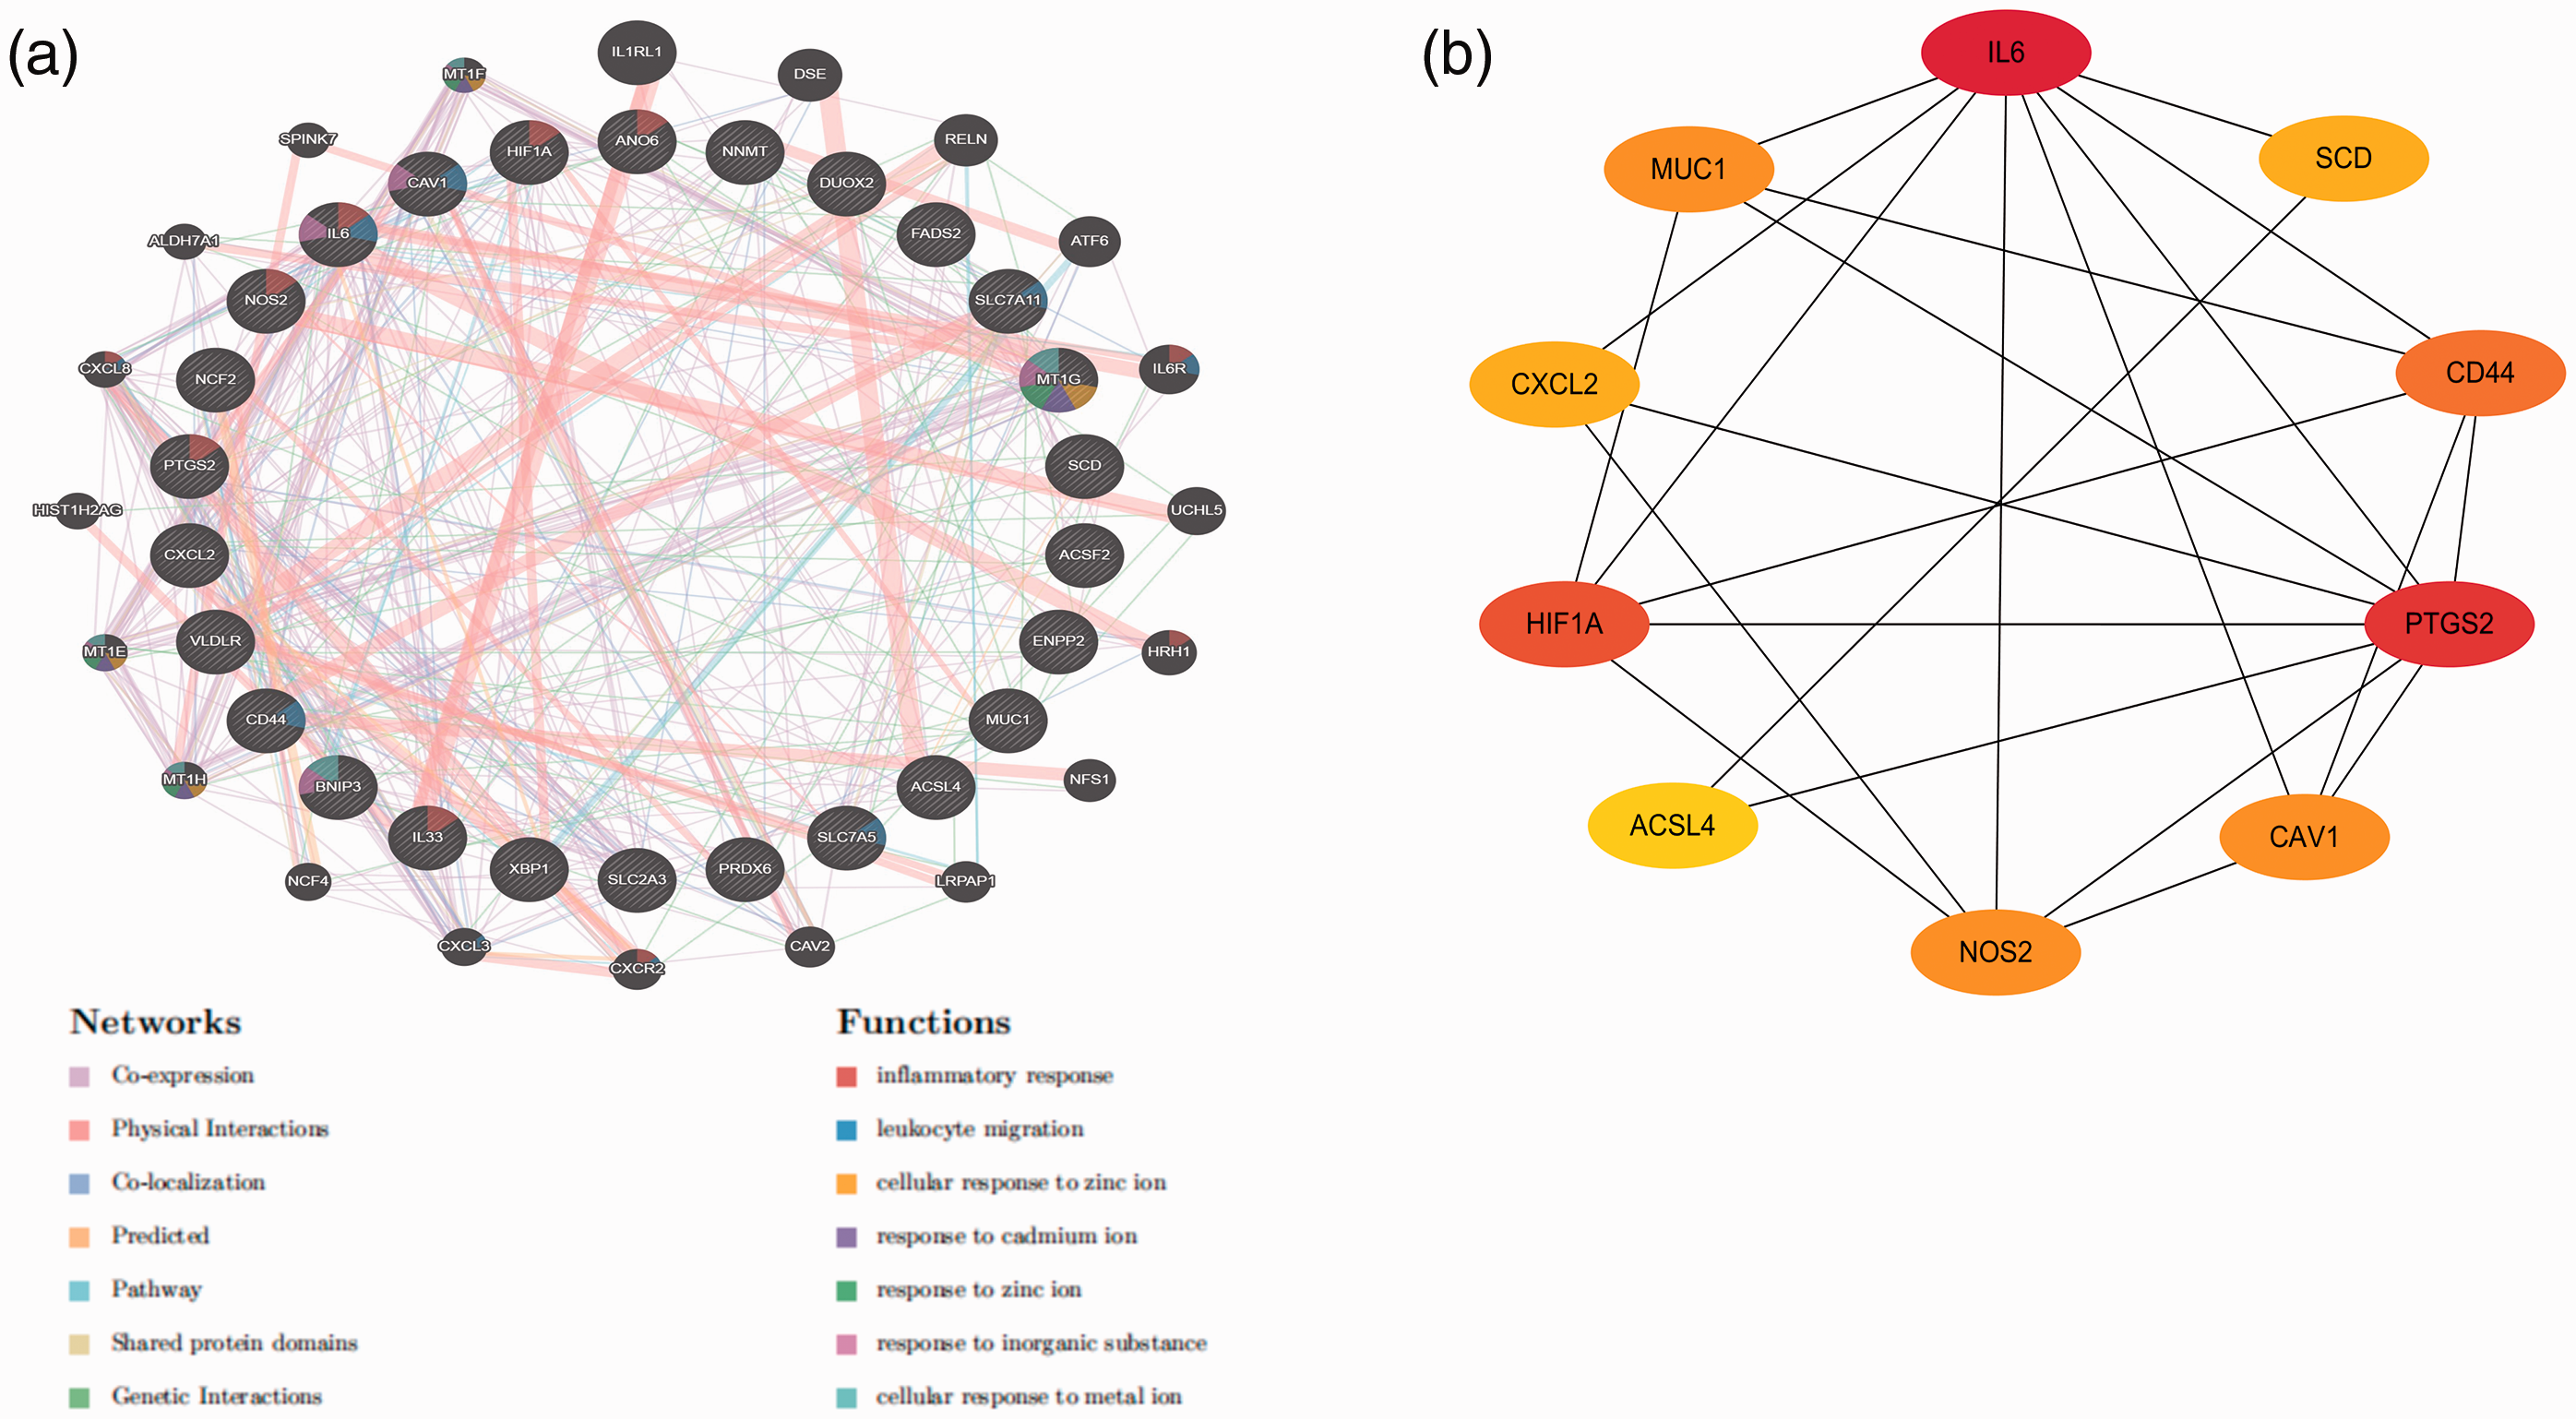
The protein–protein interaction (PPI) network and the ferroptosis-related hub genes.
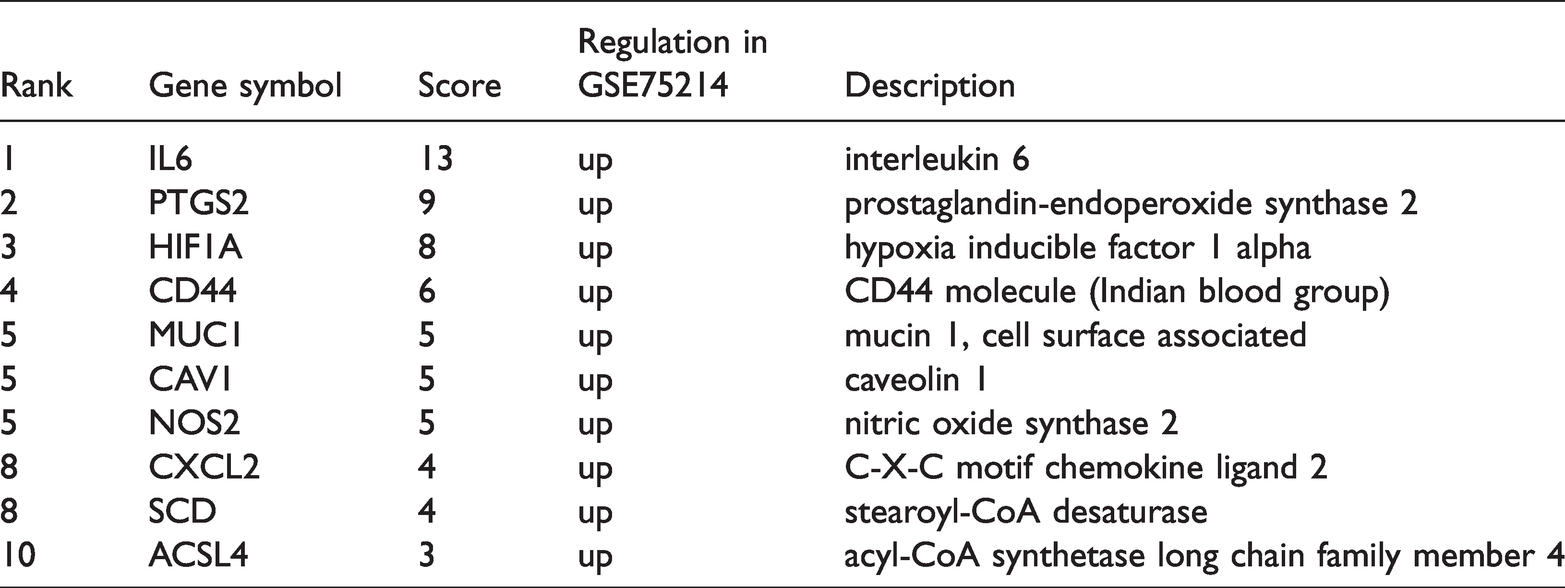
Using the STRING tool, we obtained 26 nodes, 42 edges, and an average node degree of 3.23 in the PPI network. The top ten hub genes were obtained using the cytoHubba plugin in Cytoscape to calculate the degree of connectivity, as shown in Figure 3b and Table 1.
Top ten hub genes with higher scores.
Validation of hub genes in peripheral blood and animal experiments
The peripheral blood chip GSE94648 was used to validate hub gene expression in peripheral blood. The results showed that the expression levels of CD44 and cell surface associated mucin 1 (MUC1) in peripheral blood were significantly altered (P < 0.05, Figure 4a and b). In addition, CD44 and MUC1 were both upregulated in GSE94648 and GSE75214. The animal experiments suggested that the expression of CD44 in the DSS-induced colitis model was significantly different from the control (P < 0.05), while the expression of MUC1 showed no significant difference (Figure 4c).

Validation of hub genes in peripheral blood and animal experiments. (a) Expression of CD44 in peripheral blood (P < 0.05). (b) Expression of MUC1 in peripheral blood (P < 0.05). (c) Expression of CD44 in colon tissue of BALB/c mice (immunohistochemistry, × 400). Cytoplasmic brown is positive expression
Predictive results of miRNA, TF, or drugs targeting the hub genes
The target gene–miRNA network of the hub genes CD44 and MUC1 was constructed, which showed that hsa-miR-125b-5p and hsa-miR-145-5p could regulate CD44 and MUC1 expression (Figure 5a). The target gene–TF network of the hub genes CD44 and MUC1 was constructed, which identified Sin3A associated protein 30 (SAP30), tripartite motif containing 22 (TRIM22), zinc finger protein 24 (ZNF24), lysine demethylase 5B (KDM5B), PHD finger protein 8 (PHF8), and SIN3 transcription regulator family member A (SIN3A) as modulators of CD44 and MUC1 (Figure 5b).

Predictive networks of microRNAs (miRNAs), transcription factors (TFs), or drugs targeting the hub genes. (a) Target gene–miRNA network. (b) Target gene–TF network. The red circle nodes represent hub genes and the yellow squares represent miRNAs or TFs. (c) Drug–CD44 interaction network. (d) Drug–MUC1 interaction network. The red circle nodes are the hub genes and the yellow diamond nodes are the predicted drugs or molecular compounds.
Using DGIdb to predict drugs that can target the hub genes, five potential drugs or compounds for CD44 were found, including gentamicin, progesterone, hyaluronan, hyaluronate sodium, and bivatuzumab (Figure 5c). In addition, four potential drugs or compounds for MUC1 were predicted, including HuHMFG1, SAR566658, emepepimut-S, and GO-203-2c (Figure 5d).
Discussion
Intestinal mucosal barrier damage can occur before a clinical diagnosis of UC. This is a variable factor in the pathogenesis of UC, and may also provide a future strategy for preventing this disease. 4 Recent studies have found that ferroptosis is closely related to intestinal mucosal barrier dysfunction, p53, and the immune system.5,6,22 Thus, it is important to explore the ferroptosis-related markers of intestinal mucosa injury and immunotherapy in UC. Using bioinformatics analysis, peripheral blood chip, and animal experiments, we found MUC1 and CD44 to be ferroptosis-related hub genes in UC. This will provide a basis for studying UC pathogenesis and identifying potential novel treatments.
MUC1, secreted by intestinal goblet and absorptive cells, is a membrane-bound glycoprotein in the mucus layer. MUC1 protein expression increases during intestinal inflammation to protect the intestinal mucosal barrier, and plays an important role in UC pathogenesis. 23 This gene can regulate cell signal transduction and participate in immune regulation. MUC1 expression was shown to significantly increase during the transition from colitis to tumorigenesis, but the specific mechanism of action was unclear. 24 A recent study reported that MUC1 is related to ferroptosis. 25 Our research also found that the expression of MUC1 was upregulated in UC, which is possibly related to ferroptosis. However, further research is necessary because an increase in MUC1 expression was not observed in animal experiments.
The protein encoded by the CD44 gene is a cell surface glycoprotein involved in cell–cell interactions, cell adhesion, and migration. A recent study found that CD44 expression inhibited ferroptosis. 26 Interestingly, multi-bioresponsive silk fibroin-based nanoparticles with the capacity for on-demand cytoplasmic drug release targeted to CD44 could alleviate UC. 27 In our study, the CD44 expression levels were significantly increased in human colon tissue and peripheral blood. In our animal experiments, CD44 expression also increased significantly, which is consistent with previous research reports. However, the relationship between CD44 and ferroptosis proteins requires further study.
Our data suggest that the ferroptosis-related markers MUC1 and CD44 are related to the pathogenesis of UC. However, this study has some limitations, including a lack of unique morphological characteristics of ferroptosis and lipid ROS, a lack of research on the effect of ferroptosis-related markers on immunity, and the possibility of selection bias in the inclusion of the chips. To improve the prevention, diagnosis, treatment, and prognosis of UC, future research is necessary to identify ferroptosis-specific pharmacodynamic markers or small-molecule ferroptosis modulators, as well as to study the role of ferroptosis in intestinal mucosal barrier damage, the immune response, an iron-containing diet, and carcinogenesis.
Footnotes
Declaration of conflicting interest
The authors declare that there is no conflict of interest.
Funding
The authors disclosed receipt of the following financial support for the research, authorship, and/or publication of this article: This work was financially supported by Cultivation Fund of National Natural Science Foundation (Grant No. qiankehe2018-5764-11), Doctor Foundation of Guizhou Provincial People's Hospital [No. GZSYBS(2017)09], and Beijing Medical and Health Foundation [No. YWJKJJHKYJJ-B184053].