
Abstract
Objective
To use bioinformatics tools to screen for gene biomarkers from monocytes, which play an important role in the pathogenesis of atherosclerosis.
Methods
Two expression profiling datasets (GSE27034 and GSE10195) were obtained from the Gene Expression Omnibus dataset and the differentially expressed genes (DEGs) between atherosclerotic human peripheral blood mononuclear cells (PBMC) samples and control subjects were screened using GEO2R. Gene Ontology and Kyoto Encyclopedia of Genes and Genomes pathway enrichment analyses were conducted for the DEGs. STRING and MCODE plug-in of Cytoscape were used for constructing a protein–protein interaction network and analysing hub genes.
Results
The two datasets had 237 DEGs in common between non-atherosclerotic- and atherosclerotic PBMC samples. Functional annotation demonstrated that these DEGs were mainly enriched in protein binding, positive regulation of transcription from RNA polymerase II promoter, nucleus and viral carcinogenesis. Five hub genes, FBXL4, UBOX5, KBTBD6, FZR1 and FBXO2, were identified.
Conclusion
This present bioinformatics analysis identified that the FBXL4, UBOX5, KBTBD6 and FBXO21 genes might play vital roles in the pathogenesis of atherosclerosis. These four genes might represent new biomarkers for the diagnosis and treatment of atherosclerosis.
Introduction
Atherosclerosis (AS), as a chronic inflammatory disease involving the blood vessels, is the underlying pathology of various diseases, such as coronary artery disease, peripheral arterial disease and cerebrovascular disease.1–3 AS remains a major cause of death and accounts for 31% of global mortality. 4 Therefore, considerable research is undertaken in AS and studies have demonstrated that monocytes play a vital role in the initiation and progression of AS.5–7 Research suggests that monocytes are identified as the cellular hallmark in AS. 8 In the early phases of AS, monocytes are recruited to the dysfunctional endothelium and then enter into the arterial intima. 9 In the intima, monocytes proliferate, mature and differentiate into macrophages, then these macrophages engulf low-density lipoprotein (LDL) particles and eventually progress into macrophage foam cells. 9
Research has shown that the pathophysiological processes involving monocytes are closely related to the mutation and abnormal expression of genes. For example, the expression of RadioProtective 105 (RP105), a Toll-like receptor (TLR) homolog capable of regulating TLR4 signalling, was upregulated in the early phases of AS. 10 The study also found that RP105 deficiency decreased monocyte influx and reduced early atherosclerotic lesion formation. 10 Moreover, research has demonstrated that the expression levels of the ST6 beta-galactoside alpha-2,6-sialyltransferase 1 (ST6GAL1) gene decreased significantly during the progression of AS; and overexpression of ST6GAL1 strongly inhibited monocyte transendothelial migration and prevented the process of AS development. 11 Another study suggested that deletion of Bmal1 in monocytes and macrophages can promote AS. 12 The authors also found that deleting Bmal1 can enhance monocyte recruitment into the AS lesion, which leads to an increased macrophage content and enlarged lesion size. 12 Therefore, research needs to focus on the mutation and abnormal expression of genes in AS, which should identity novel biomarkers for this disease.
In recent years, bioinformatics tools and high-throughput sequencing technology, such as microarrays, have been used to identify the potential genetic targets of diseases. This has dramatically improved the efficiency and speed of gene discovery.13–15 These methods could help researchers determine the biological relevancy of any identified genes, particularly within the complex networks of genes that are likely to be involved in the development of AS.
The peripheral blood transcriptome can reflect the changes occurring in the macro- and microenvironment in the body during the procession of diseases, because it has interactive and dynamic properties. 16 The current study aimed to identify potentially critical genes associated with AS in order to further understand the pathogenesis of AS. This was achieved by downloading and re-analysing two microarray-based transcriptional profiling datasets of human peripheral blood mononuclear cells (PBMC) from the Gene Expression Omnibus (GEO) dataset, which can reduce false-positive rates in an independent microarray analysis. Using this dataset, the study aimed to identify differentially expressed genes (DEGs) between non-atherosclerotic and atherosclerotic PBMC samples so that Gene Ontology (GO) and Kyoto Encyclopedia of Genes and Genomes (KEGG) pathway enrichment analysis of the DEGs could be undertaken. Protein–protein interaction (PPI) network analysis was constructed and dissected for the identified DEGs.
Materials and methods
Data sources
Two gene expression profiling datasets, GSE27034 and GSE10195, were downloaded from the GEO database (http://www.ncbi.nlm.nih.gov/geo/). GSE27034 consisted of 37 PBMC samples from 19 patients with atherosclerosis and 18 control subjects, which was sequenced on the platform of GPL570, [HG-U133_Plus_2] Affymetrix Human Genome U133 Plus 2.0 Array. GSE10195 consisted of 41 PBMC samples from 27 patients with atherosclerosis and 14 control subjects, which was sequenced on the platform of GPL1708, Agilent-012391 Whole Human Genome Oligo Microarray G4112A (Feature Number version). No experiments on humans or animals were conducted for this investigation. Thus, local ethical committee approval or patient consent to participate were not needed.
Identification of DEGs
The DEGs between atherosclerotic PBMC samples and controls were screened using GEO2R (http://www.ncbi.nlm.nih.gov/geo/geo2r). GEO2R is an interactive web tool that allows users to compare two or more datasets in a GEO series in order to identify DEGs across experimental conditions. Thresholds of P-value < 0.05 and |log2FC| (fold change) > 1 were set. A Venn diagram was delineated by an interactive web tool (http://bioinformatics.psb.ugent.be/webtools/Venn/).
Functional annotation and pathway enrichment analyses of DEGs
To get a better understanding of the DEGs, GO and KEGG pathway enrichment analyses were conducted using the Database for Annotation, Visualization and Integrated Discovery (DAVID) tool (https://david.ncifcrf.gov/home.jsp; version 6.8). DAVID is a gene functional classification tool that integrates a set of functional annotation tools for investigators to analyse biological functions behind massive genes. GO classifications consist of molecular function (MF), biological process (BP) and cellular component (CC) terms. 17 KEGG is a database that is used to allocate gene sets to their relevant pathways. A P-value < 0.05 was set as the threshold for the identification of significant enrichment.
Construction and analysis of the PPI network
The PPI network was predicted using the Search Tool for the Retrieval of Interacting Genes (STRING) online database (http://string-db.org; version 11.0). 18 The analysis of interactions between various proteins might put forward some novel ideas into the pathophysiological mechanisms involved in the development of AS. PPIs of DEGs were selected with a score (median confidence) > 0.4, as described previously;19–21 and the PPI network was then visualized using Cytoscape (version 3.7.1), a free visualization software.
Mining and analysis of hub genes
The plug-in Molecular Complex Detection (MCODE) of Cytoscape is an application used for clustering a given network based on topology to find densely connected regions. The most significantly clustered modules in the network were screened using MCODE. The criteria for the MCODE analysis were as described previously: MCODE scores ≥4, degree cut-off = 2, max depth = 100, k-score = 2 and node score cut-off = 0.2.22–24 Then the names, abbreviations and functions of these hub genes were identified from the GeneCards (https://www.genecards.org/) database, which is an online interactive database of human genes.
Results
This study analysed two public datasets using GEO2R to identify the DEGs. The results showed that 1351 DEGs were identified from the GSE10195 dataset and 3278 DEGs were identified from the GSE27034 dataset. The Venn diagram result showed that 237 DEGs were contained in the two databases simultaneously (Figure 1).

A Venn diagram showing the overlap of 237 genes between the two microarray-based transcriptional profiling datasets of human peripheral blood mononuclear cells (GSE27034 and GSE10195) from the Gene Expression Omnibus (GEO). GEO2R was used to compare these GEO datasets to identify differentially expressed genes between patients with atherosclerosis and control subjects.
The GO and KEGG pathway enrichment analyses were conducted to gain the cellular function, process and signal pathways of DEGs in AS. The biological process GO enrichment analysis showed that the DEGs were mainly enriched in the positive regulation of transcription from RNA polymerase II promoter, negative regulation of transcription, DNA-templated, regulation of transcription from RNA polymerase II promoter and positive regulation of the apoptotic process (Figure 2a). The cellular component GO enrichment analysis showed that the DEGs primarily took part in the nucleus, cytoplasm, nucleoplasm and mitochondrion (Figure 2b). The molecular function GO enrichment analysis showed the DEGs were mainly involved in protein binding, sequence-specific DNA binding, actin binding and transcription factor binding (Figure 2c). KEGG pathway analysis showed that all of the DEGs were enriched in viral carcinogenesis and the p53 signalling pathway.

Gene Ontology (GO) enrichment analysis of differentially expressed genes (DEGs) identified from two microarray-based transcriptional profiling datasets of human peripheral blood mononuclear cells (GSE27034 and GSE10195) that was used to identify DEGs between patients with atherosclerosis and control subjects. (a) The biological process GO enrichment analysis of DEGs; (b) The cell component GO enrichment analysis of DEGs; (c) The molecular function GO enrichment analysis of DEGs.
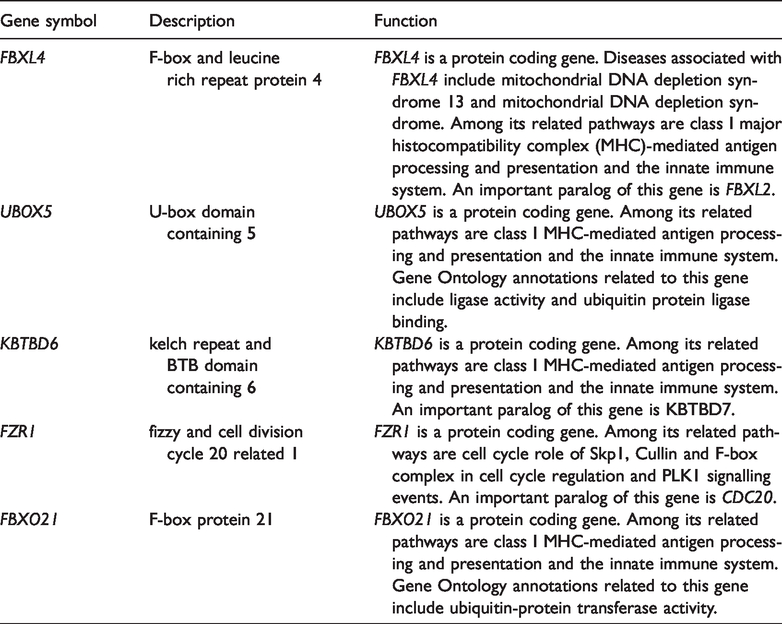
The PPI network of DEGs was constructed (Figure 3) and the most significant module was identified using Cytoscape (Figure 4). The analysis identified five hub genes from the most significant module. They were F-box and leucine rich repeat protein 4 (FBXL4), U-box domain containing 5 (UBOX5), kelch repeat and BTB domain containing 6 (KBTBD6), fizzy and cell division cycle 20 related 1 (FZR1) and F-box protein 21 (FBXO21). Their names, abbreviations and functions are summarized in Table 1.

The protein–protein interaction network of the differentially expressed genes between patients with atherosclerosis and control subjects.

The most significant module identified in the protein–protein interaction network identified five hub genes. FBXL4, F-box and leucine rich repeat protein 4; UBOX5, U-box domain containing 5; KBTBD6, kelch repeat and BTB domain containing 6; FZR1, fizzy and cell division cycle 20 related 1; FBXO21, F-box protein 21.
Summary of the functions of the five hub genes in the most significant module identified in the protein–protein interaction network.
Discussion
Atherosclerosis is one of the major causes of mortality in ageing populations worldwide and it is a serious life-threatening disease. 25 However, a complete understanding the molecular mechanisms involved and the identification of accurate biomarkers for the diagnosis and treatment of AS remained to be elucidated. Recent developments in bioinformatic technology have allowed it to be widely used to predict potential therapeutic targets for AS.26,27 In this present study, a bioinformatics approach was used to identify the DEGs in atherosclerotic PBMCs. Analysis of the GSE27034 and GSE10195 datasets using GEO2R identified DEGs between non-atherosclerotic and atherosclerotic PBMC samples. The two datasets had 237 DEGs in common. Functional annotation demonstrated that these DEGs were mainly enriched in protein binding, positive regulation of transcription from RNA polymerase II promoter, nucleus and viral carcinogenesis. Furthermore, in the most significant module of the PPI network, five hub genes with a high degree of connectivity, FBXL4, UBOX5, KBTBD6, FZR1 and FBXO21, were identified. Their potential diagnostic and therapeutic values for AS are worthy of further investigation.
The FBXL4 gene is a protein coding gene, which can encode a member of the F-box protein family. 28 F-box and leucine rich repeat protein 4 has a highly conserved 50-amino acid protein motif and it can specifically bind substrates to regulate the degradation of cellular regulatory proteins via ubiquitin-mediated proteolysis. 29 Research has demonstrated that FBXL4 plays an important role in the maintenance of mitochondrial DNA integrity, which was associated with diseases including mitochondrial DNA depletion syndrome 13 and mitochondrial DNA depletion syndrome. 28 Recently, it was shown that FBXL4 could interact with endoplasmic reticulum lectin 1 (ERLEC1), which is a molecular chaperone playing a role in the endoplasmic reticulum (ER) stress response. 30 The ER stress response is related to various systemic and arterial-wall factors that promote atherosclerosis. 31 A previous study demonstrated that ER stress could induce apoptosis, which may directly participate in the initiation and development of AS. 32 In addition, as shown in Table 1, FBXL4-related pathways are class I major histocompatibility complex (MHC)-mediated antigen processing and presentation and the innate immune system. Research has demonstrated that the innate and adaptive immune responses play a significant role in atherogenesis.33,34 According to this current analysis, FBXL4 expression in atherosclerotic PBMC samples was significantly different compared with that of control PBMCs. Therefore, these findings suggest that FBXL4 expression is involved in the development of AS and FBXL4 could serve as a diagnostic marker of AS.
The UBOX5 gene can encode a U-box domain containing protein, which interacts with ubiquitin-conjugating enzyme (E2) and may play a role in the ubiquitination pathway. 35 As the results show in Table 1, GO annotations related to this gene include ligase activity and ubiquitin protein ligase (E3) binding. E2 and E3 both belong to the ubiquitin proteasome system (UPS), which plays a crucial role in the pathophysiology of AS. 36 The UPS is composed of ubiquitin-activating enzyme (E1), E2 and E3, forming a cascade of regulated enzymes to target proteins for degradation. 36 A previous study found that ITCH, a type E3 ubiquitin ligase, could influence the pathogenesis of AS. 37 The authors also demonstrated that the loss of ITCH could upregulate the reuptake of LDL into the liver mediated by the LDL receptor, which inhibited the progression of AS. 37 Furthermore, the lysosomal- and ubiquitin-dependent proteasome can degrade the receptor of platelet activating factor (PAF), thereby exacerbating the effects of PAF on vascular cells, which is proatherogenic. 36 In this current study, UBOX5 expression in atherosclerotic PBMC samples was significantly different with that of control PBMCs. UBOX5 may influence the UPS via E2 and E3; and sequentially take part in the initiation and development of AS. Therefore, these findings suggest that UBOX5 might be a potential biomarker and therapeutic target for AS.
The KBTBD6 and FBXO21 genes are both protein coding genes and their related pathways are both class I MHC-mediated antigen processing and presentation and the innate immune system. As discussed above, the innate and adaptive immune responses play a significant role in atherogenesis.33,34 The innate immune system consists of various cellular components including granulocytes, mast cells, monocytes/macrophages, dendritic cells and natural killer cells; and it forms the first line of host defence against pathogens. 38 All of these immune cell types participate in the initiation and progression of AS. 38 Research has demonstrated that the number of monocytes is increased in patients with atherosclerosis and the number is correlated with the size and stage of the atherosclerotic plaque. 39 In addition, GO annotations related to FBXO21 include ubiquitin-protein transferase activity, which suggests that FBXO21 might also be involved in the progression of AS via UPS. Therefore, these findings suggest that the expression of KBTBD6 and FBXO21 plays a vital role in the development of AS.
The FZR1 gene is a protein coding gene and its related pathways are cell cycle role of Skp1, Cullin, and F-box complex in cell cycle regulation and PLK1 gene signalling events. A previous study reported that FZR1 can specifically activate the anaphase-promoting complex or cyclosome, a ubiquitin ligase that can regulate the cell cycle. 40 Furthermore, reduced expression, deletions and mutations of the FZR1 gene, as a tumour suppressor, have been found in various human tumour tissues. 41 However, the relationship between FZR1 and AS is not clear and needs to be explored further.
This study had one limitation, which was that all of the results were based on bioinformatics technologies and lacked experimental validation. Therefore, further experiments in vitro and in vivo are required to verify these findings.
In conclusion, this present bioinformatics analysis study found that the FBXL4, UBOX5, KBTBD6 and FBXO21 genes might play vital roles in the pathogenesis of AS. These genes might be useful diagnostic markers of AS or form targets for the treatment of AS in the future.
Footnotes
Acknowledgements
We are thankful to Ge Lan, Department of Cardiology, The Third Medical Centre of Chinese PLA General Hospital, Beijing, China for her assistance and support during the submission process.
Declaration of conflicting interest
The authors declare that there are no conflicts of interest.
Funding
This research received no specific grant from any funding agency in the public, commercial, or not-for-profit sectors.