
Abstract
Objectives
This study aimed to investigate hub genes and their prognostic value in colon cancer via bioinformatics analysis.
Methods
Differentially expressed genes (DEGs) of expression profiles (GSE33113, GSE20916, and GSE37364) obtained from Gene Expression Omnibus (GEO) were identified using the GEO2R tool and Venn diagram software. Function and pathway enrichment analyses were performed, and a protein–protein interaction (PPI) network was constructed. Hub genes were verified based on The Cancer Genome Atlas (TCGA) and Human Protein Atlas (HPA) databases.
Results
We identified 207 DEGs, 62 upregulated and 145 downregulated genes, enriched in Gene Ontology terms “organic anion transport,” “extracellular matrix,” and “receptor ligand activity”, and in the Kyoto Encyclopedia of Genes and Genomes pathway “cytokine-cytokine receptor interaction.” The PPI network was constructed and nine hub genes were selected by survival analysis and expression validation. We verified these genes in the TCGA database and selected three potential predictors (ZG16, TIMP1, and BGN) that met the independent predictive criteria. TIMP1 and BGN were upregulated in patients with a high cancer risk, whereas ZG16 was downregulated. The immunostaining results from HPA supported these findings.
Conclusion
This study indicates that these hub genes may be promising prognostic indicators or therapeutic targets for colon cancer.
Introduction
Colon cancer has become a major global public health concern because of its high incidence and mortality rates; more than 1.8 million new cases and 881,000 deaths were expected in 2018. 1 Several risk factors have been linked to this disease; 2 however, predicting prognosis in colon cancer is imperfect. The search for effective prognostic biomarkers will aid in predicting prognosis and improving colon cancer treatment.
Microarray technology can simultaneously scan hybridization signals of various gene probes and rapidly detect differentially expressed genes (DEGs). 3 It also provides a platform for public databases and exploring the molecular mechanisms of multiple cancers. A high-quality microarray could potentially link molecular biomarkers to the development, diagnosis, and treatment of colon cancer.
In this study, we identified DEGs in expression profiles GSE33113, GSE20916, and GSE37364 from the Gene Expression Omnibus (GEO) database. We performed Gene Ontology (GO) and Kyoto Encyclopedia of Genes and Genomes (KEGG) functional and pathway analyses and constructed a protein–protein interaction (PPI) network. Survival analysis and expression validation of hub genes were determined by Gene Expression Profiling Interactive Analysis (GEPIA). Hub genes and the clinical prognosis of patients with colon cancer were compared and analyzed with the objective of identifying novel prognostic biomarkers and therapeutic targets.
Materials and methods
Ethical approval
The Second Affiliated Hospital of Guangxi Medical University Ethical Review Committee approved this study (Approval Number: 2020-KY[0097]). All study material was from publicly available databases and therefore patient consent was not applicable.
Data collection
Expression profiles of GSE33113, GSE20916, and GSE37364 based on the GPL570 platform were obtained from the GEO database (https://www.ncbi.nlm.nih.gov/geo/). The three datasets included 90, 66, and 27 colon cancer tissues and 6, 34, and 38 normal tissues, respectively.
DEG identification
DEGs of expression profiles were identified via GEO2R online tools (www.ncbi.nlm.nih.gov/geo/geo2r) and Venn diagrams (bioinformatics.psb.ugent.be/webtools/Venn). The cut-off criteria were |log fold-change| >2 and adjusted P-value <0.05.
GO and KEGG pathway analyses
To elucidate potential gene functional annotation and pathway enrichment, GO4,5 and KEGG pathway analyses6,7 were performed using the “enrichplot” package in R software (https://www.R-project.org/). GO annotation categorizes functions into biological processes (BP), molecular functions (MF), and cellular components (CC).
PPI network construction
DEGs were evaluated using the Search Tool for the Retrieval of Interacting Genes (STRING, https://string-db.org/), and results with a minimum interaction score of 0.4 were visualized in Cytoscape software (version 3.6.1; https://cytoscape.org). In addition, the degree of each protein node in the PPI network was calculated using cytoHubba, 8 and the top 30 genes were selected as potential hub genes.
Survival analysis and expression validation of hub genes
GEPIA is a web server that analyzes cancerous and normal gene expression profiles and interactions in The Cancer Genome Atlas (TCGA; https://www.cancer.gov/about-nci/organization/ccg/research/structural-genomics/tcga) and the Genotype-Tissue Expression (GTEx; https://gtexportal.org/home/) projects. 9 The overall survival of colon cancer patients and the expression level validation of hub genes were evaluated using GEPIA. P < 0.05 was defined as the significant threshold to indicate candidate genes.
Verification of hub genes with TCGA database
The 30 potential hub genes were analyzed by survival analysis and expression validation using GEPIA; nine of these genes were analyzed by univariate Cox regression, in which candidate genes were selected if they satisfied the screening condition of P < 0.05. Thereafter, we used LASSO regression for high-dimensional data to select the most useful prognostic factors using the “glment” package in R software. 10 By this process, three hub genes were selected and the related risk score was calculated. Patients were divided into high-risk and low-risk groups based on the median expression levels of these three genes. Univariate and multivariate Cox regression analyses were performed to identify prognostic factors for colon cancer, and a heatmap of these three hub genes and clinical risk factors was constructed using the R package “pheatmap.”
Protein levels of hub genes in the HPA database
In our study, the protein levels of hub genes in tumors and normal tissues were explored using the HPA database (https://www.proteinatlas.org/), which contains immunohistochemistry-based expression data for specific human tissues. 11
Statistical analyses
Statistical analysis and graphs were prepared with R software (version 3.8; https://www.R-project.org/). Data are represented as the mean ± standard deviation, and the t-test was used for comparisons between the two groups. R packages “survival” and “forestplot” were used for univariate and multivariate Cox regression analyses, and package “glmnet” was used for LASSO regression analysis. P < 0.05 was considered statistically significant.
Results
Identification of DEGs
The three profile datasets included 183 colon cancer tissues and 78 normal tissues. According to the cut-off criteria, 272, 184, and 301 DEGs were extracted from GSE33113, GSE20916, and GSE37364, respectively, via the GEO2R online tools. Subsequently, 207 DEGs were identified by Venn diagram software, including 62 upregulated and 145 downregulated genes (Table 1 and Figure 1).
Differentially expressed genes (DEGs) in three Gene Expression Omnibus datasets.

DEG, differentially expressed gene; GEO, Gene Expression Omnibus.
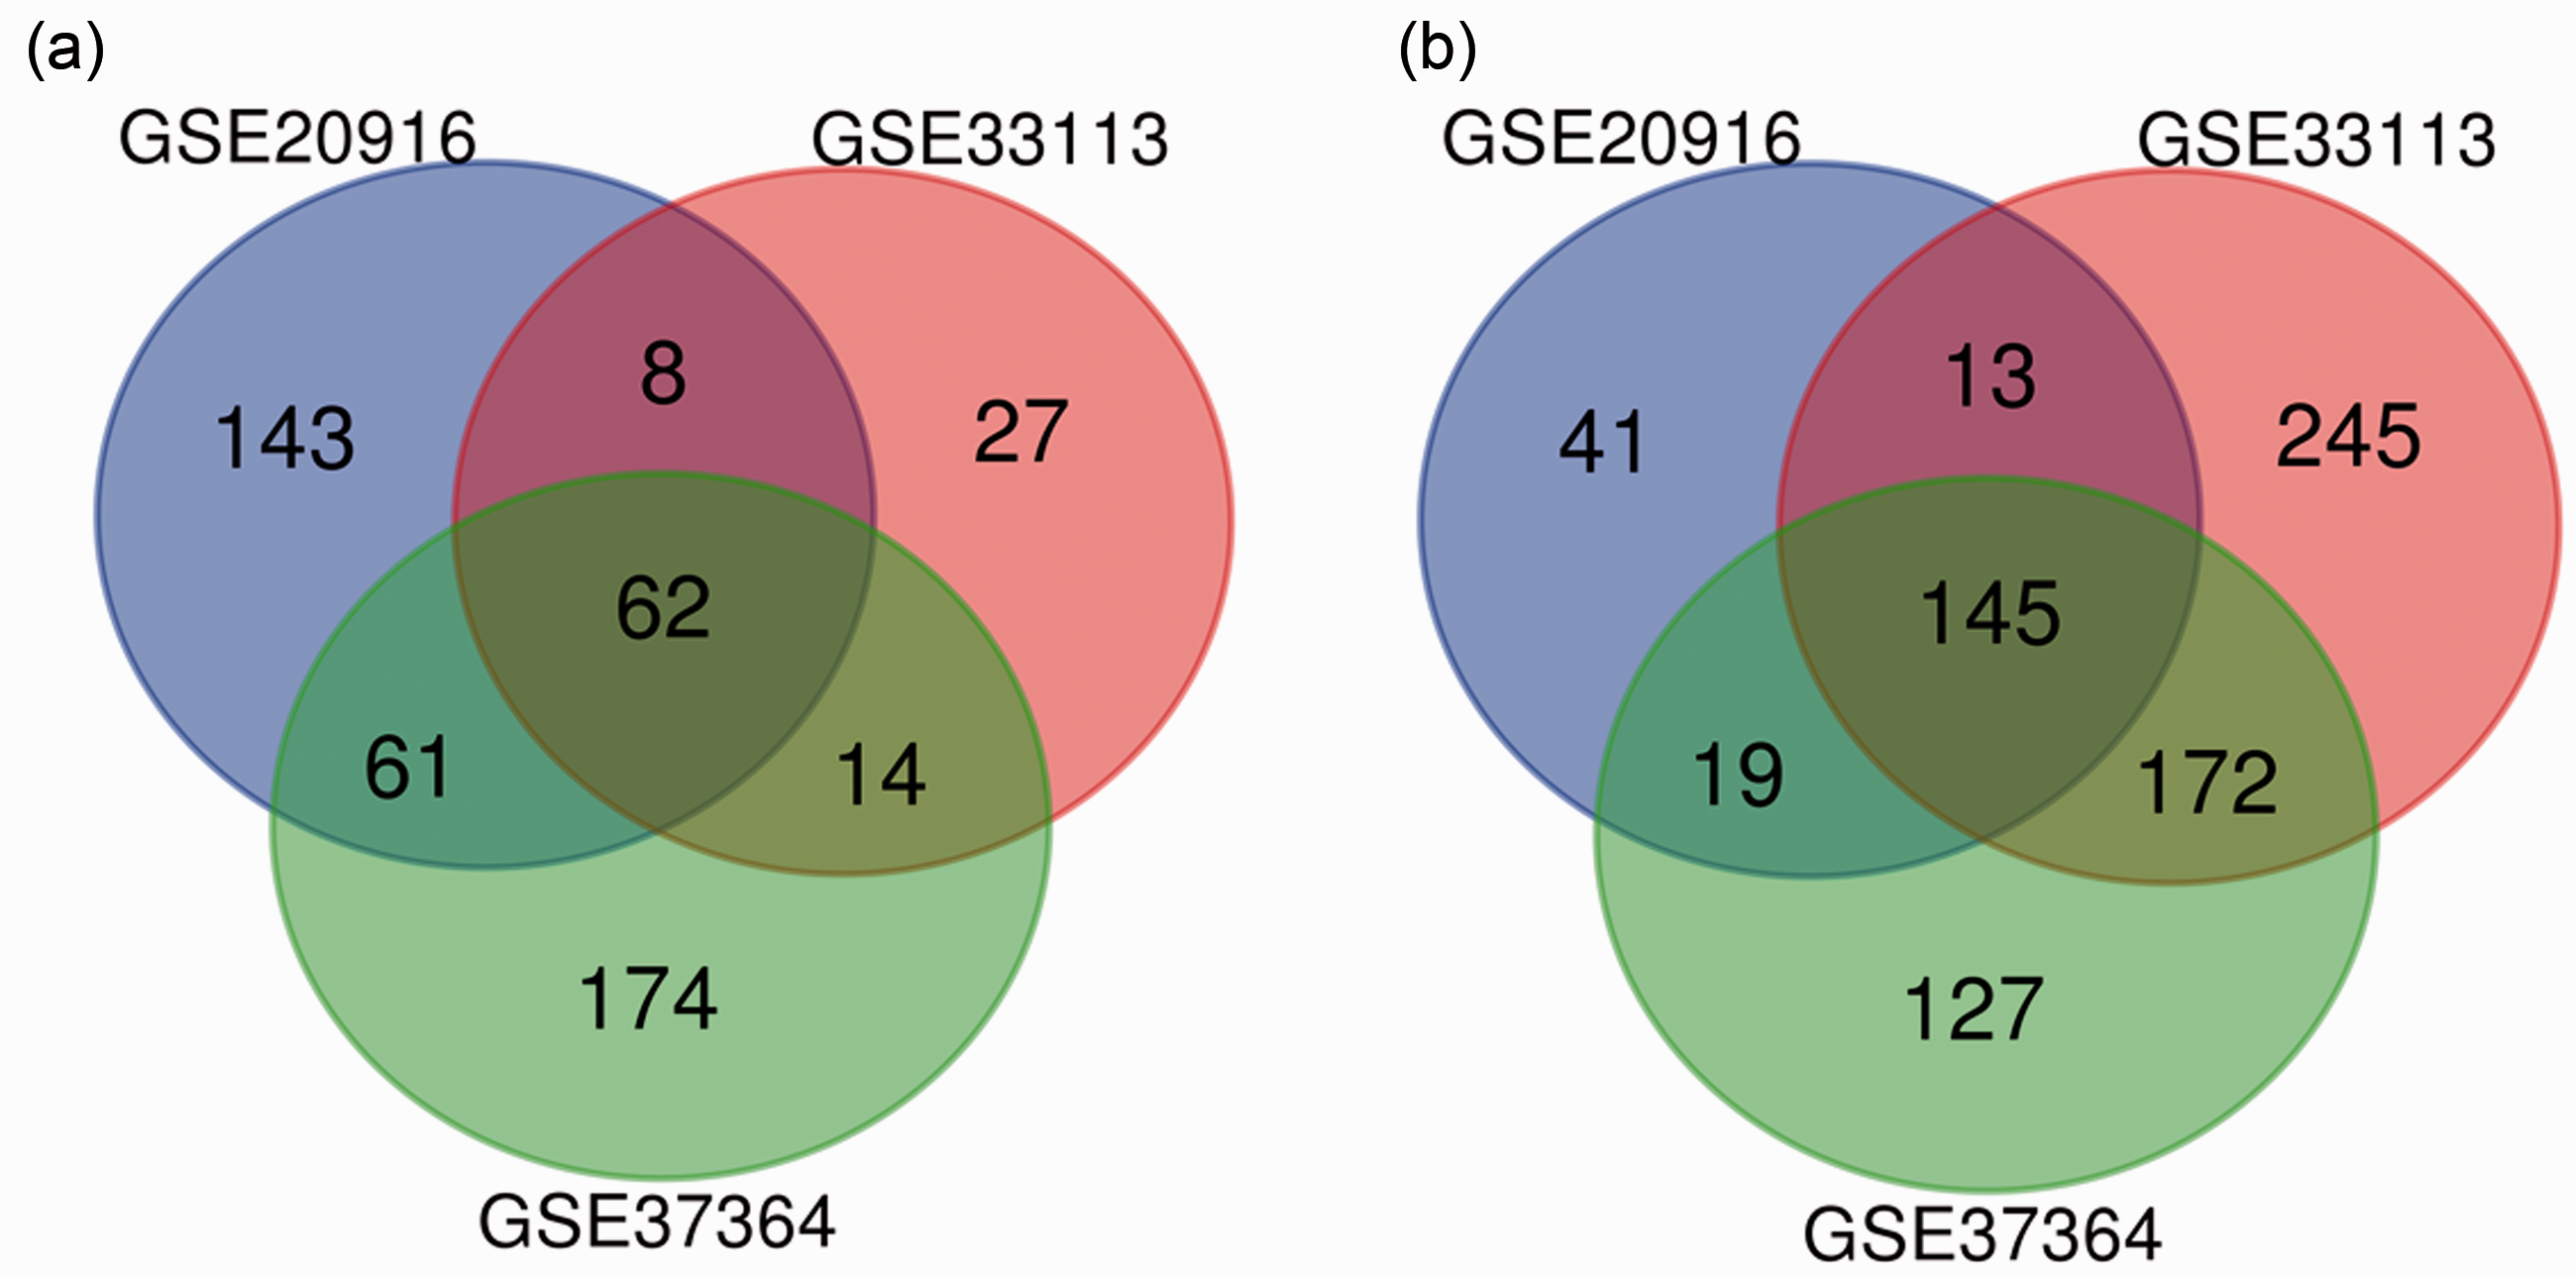
Venn diagram of DEGs from three GEO datasets. (a) Upregulated genes (n = 62), (b) downregulated genes (n = 145).
Functional enrichment analysis of DEGs
To elucidate potential gene functional annotation and pathway enrichment, GO categories BP, CC, and MF were analyzed using R software; the top 10 GO terms among 207 DEGs are shown in Figure 2A. Regarding the KEGG analysis, the 25 main terms are shown in Figure 2B, and these indicated that DEGs were particularly enriched in cytokine–cytokine receptor interaction, IL-17 signaling pathway, viral protein interaction with cytokines and cytokine receptors, rheumatoid arthritis, and chemokine signaling pathway (P < 0.05).

GO and KEGG enrichment analyses. (a) Top 10 GO term enrichment analysis of DEGs, including BP, CC, and MF; (b) KEGG pathway enrichment analysis of DEGs.
PPI network construction
A PPI network complex that included 189 nodes and 424 edges was constructed using STRING. In this PPI network complex, there were 152 DEGs, with 48 upregulated and 104 downregulated genes (Figure 3A). Finally, the top 30 genes were identified by cytoHubba as potential hub genes (Figure 3B).

PPI network and hub gene identification. (a) PPI networks of DEGs: 48 upregulated genes are shown in red and 104 downregulated genes are shown in green; (b) the top 30 genes were selected from the PPI network.
Survival analysis and expression levels of hub genes
Survival analysis and expression level analysis of the 30 hub genes were performed using GEPIA (http://gepia.cancer-pku.cn/index.html). The survival analysis of 10 genes was statistically significant (P < 0.05). Patients with high expression of CLCA1, CXCL2, CXCL3, CXCL8, IL1B, and ZG16 demonstrated better survival; in contrast, patients with high expression of BGN, COL1A2, THBS2, and TIMP1 demonstrated poor survival (Figure 4). Results from the GEPIA database revealed that the expression levels of nine genes differed significant between normal tissues and tumors (P < 0.05). The expression levels of CXCL2, CXCL3, CXCL8, IL1B, BGN, THBS2, and TIMP1 significantly increased in tumors, whereas those of CLCA1 and ZG16 decreased (P < 0.05) (Figure 5).

Survival analysis of hub genes by GEPIA. Six genes (CLCA1, CXCL2, CXCL3, CXCL8, IL1B, and ZG16) were related to better survival (a–e), and four genes (BGN, COL1A2, THBS2, and TIMP1) showed poor survival (f–j) (P < 0.05).

Expression of hub genes in different tissues by GEPIA. Red indicates tumor tissue and gray indicates normal tissue. (a) BGN, (b), CXCL2, (c) CXCL3, (d) CXCL8, (e) IL1B, (f) THBS2, (g) TIMP1, (h) CLCA1, and (i) ZG16. The box represents the interquartile range of data, the middle line is the median, and the upper and lower whiskers indicate the maximum and minimum values, respectively. Each dot represents a patient sample. Red asterisks indicate P < 0.05.
Construction of LASSO model
We used univariate Cox regression to analyze the nine genes, and three candidate genes were selected after corresponding to a screening condition of P < 0.05 (Figure 6A). The LASSO Cox regression model was adopted to select the most predictive genes as prognostic indicators; λ was selected when the median of the sum of squared residuals was the smallest. Three hub genes (BGN, TIMP1, and ZG16) were identified as prognostic factors for colon cancer (Figure 6B, C). The risk scores of these three genes were also calculated for further univariate and multivariate Cox regression analyses.
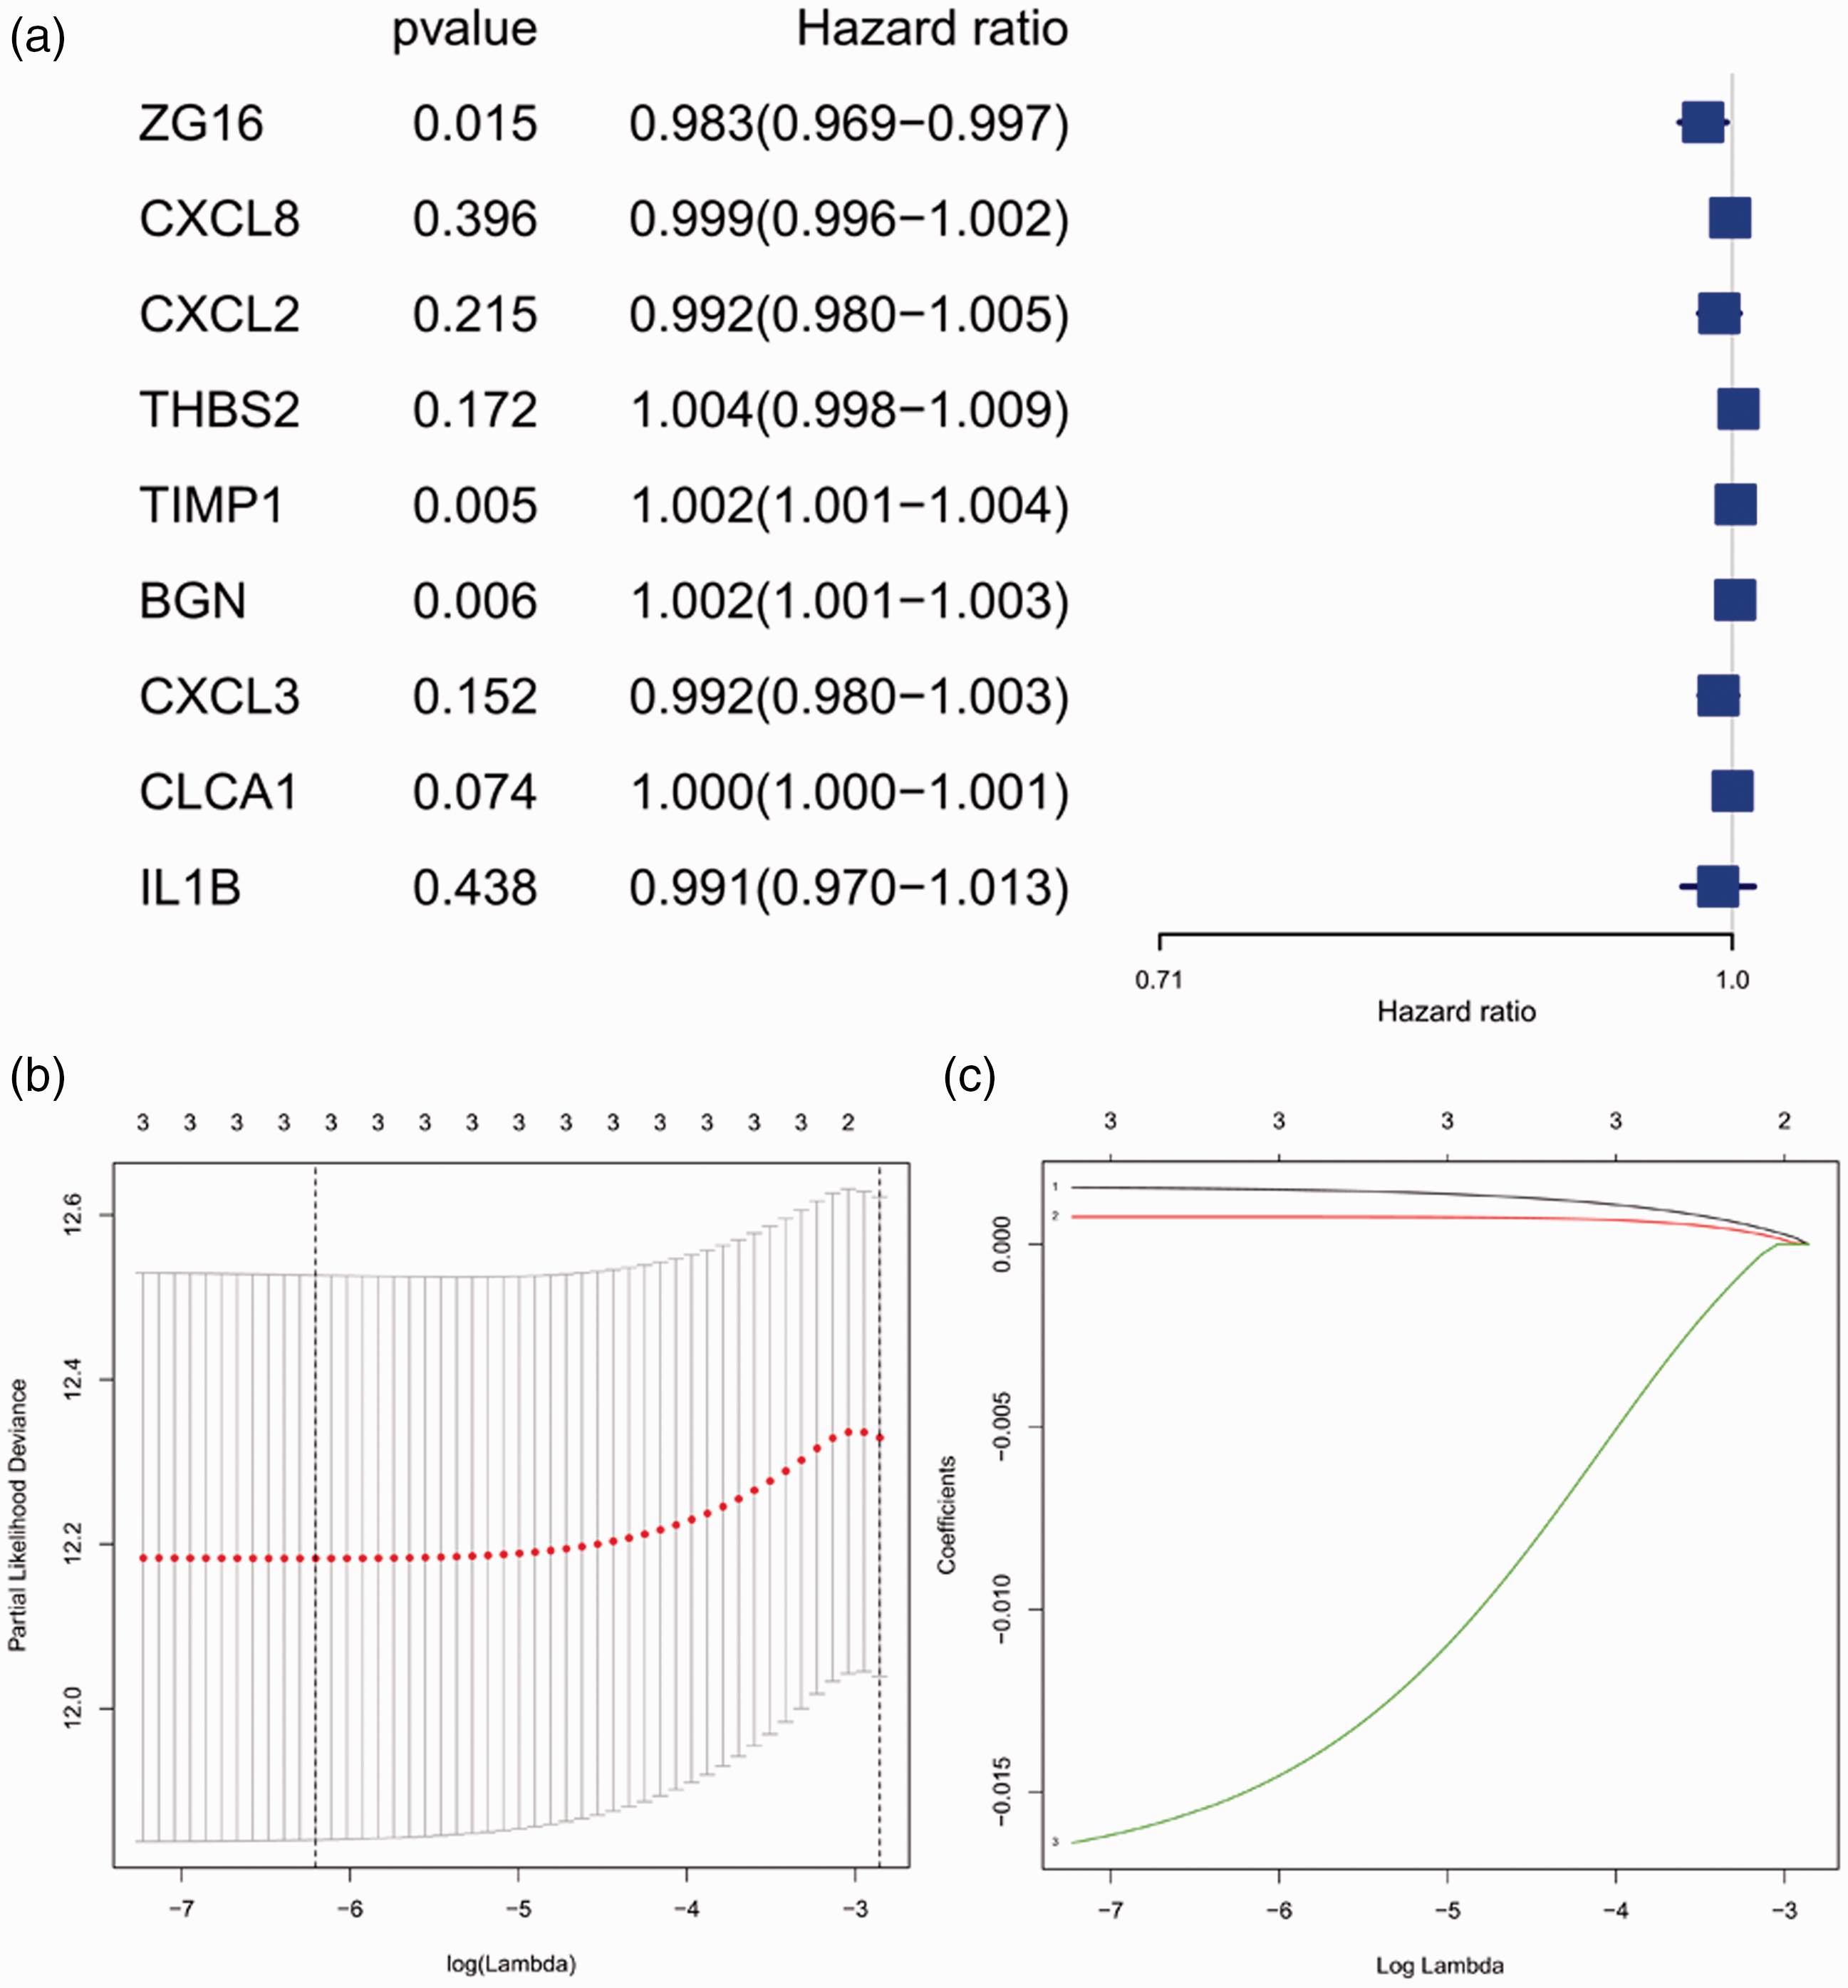
Selection of genes in colon cancer prognosis prediction. (a) Forest plot for hazard ratios of survival-associated hub genes in colon cancer; (b) partial likelihood deviance versus log (λ) was drawn using a LASSO Cox regression model; (c) coefficients of selected features shown by the lambda parameter.
Prognostic values of the three hub genes
Univariate analysis showed that age, clinical stage, T stage, M stage, N stage, and risk score of hub genes could affect the prognosis of patients (P < 0.05). Sex was not correlated with colon cancer prognosis (Figure 7A). The multivariate regression analysis demonstrated that age, clinical stage, and risk score of the three hub genes were independent prognostic factors in colon cancer (P < 0.05) (Figure 7B). As shown in Figure 7C, the protective ZG16 gene had a tendency to be upregulated in low-risk patients, whereas TIMP1 and BGN had a tendency to be highly expressed in high-risk patients. M stage and survival status were linked with the degree of risk (P < 0.05), whereas T stage, N stage, clinical stage, sex, and age were not significant.
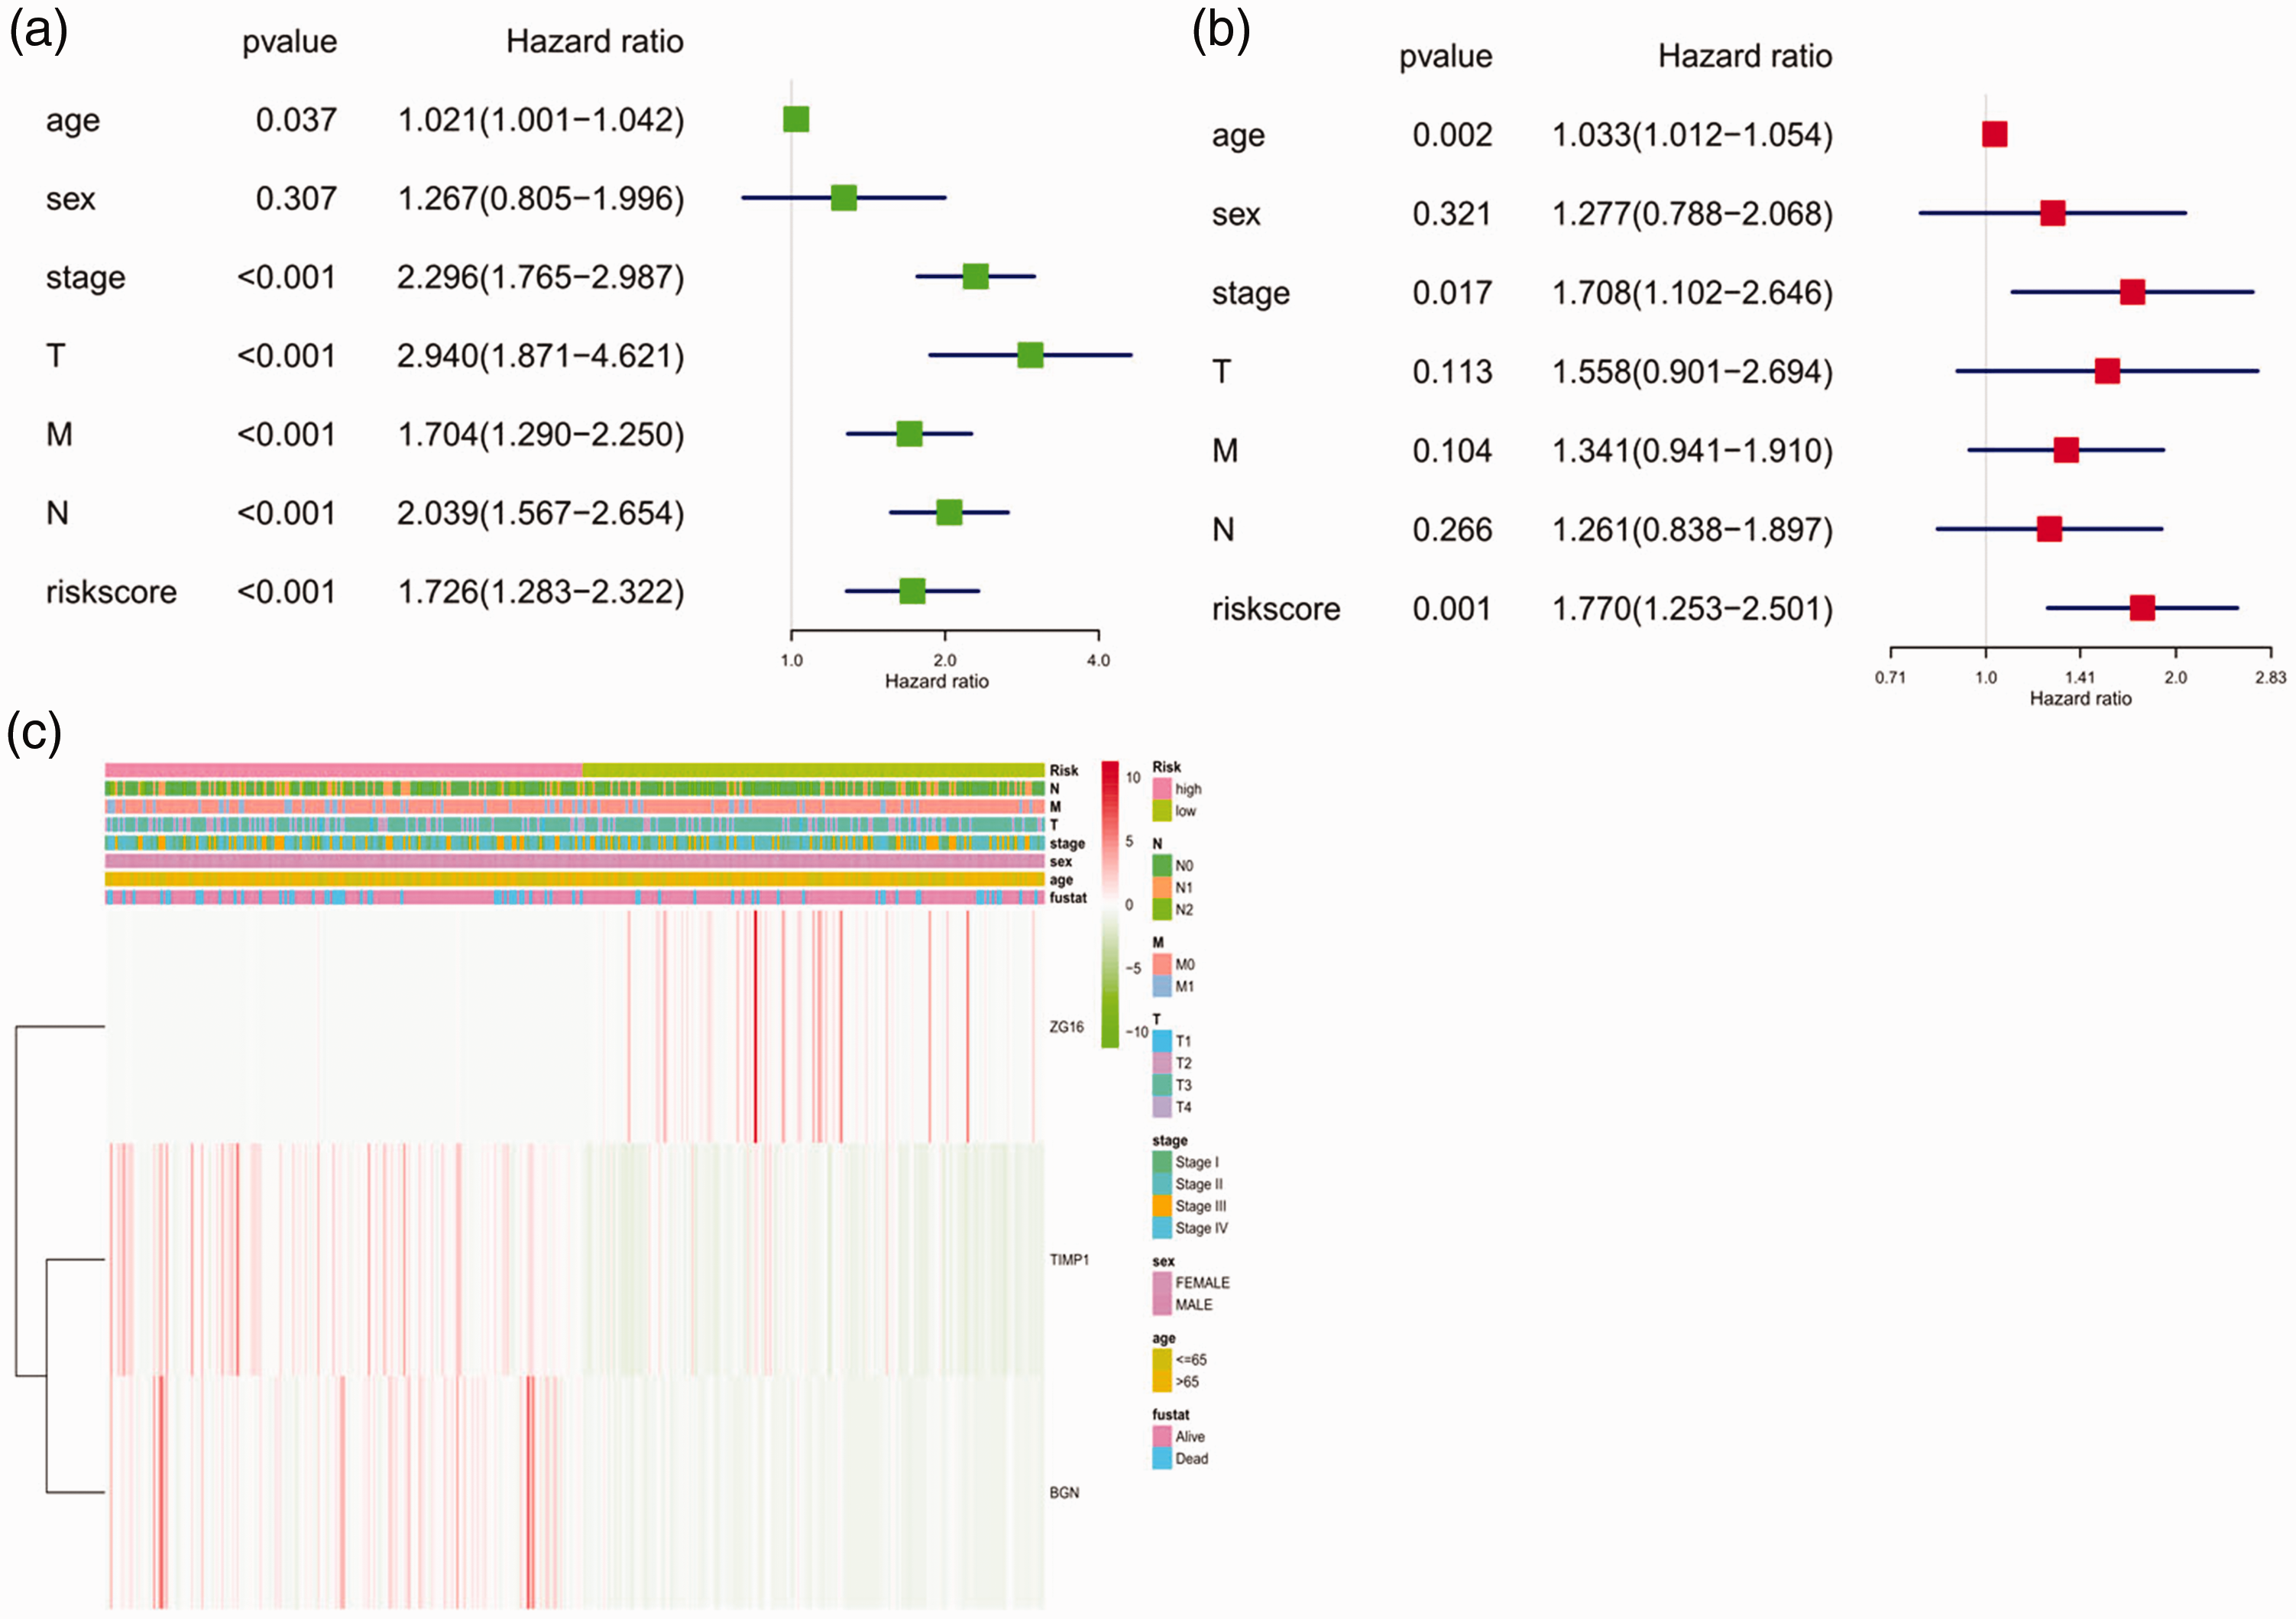
Forest plot and heatmap of hub genes and clinical risk factors (age, sex, stage, TMN stages, and risk score). (a) Forest plot of the univariate Cox regression analysis in colon cancer; (b) forest plot of the multivariate Cox regression analysis in colon cancer; (c) heatmap of hub genes ZG16, TIMP1, and BGN and clinical risk factors.
Validation of the three hub genes with the HPA database
As shown in Figure 8, expression levels of the three hub genes, ZG16, TIMP1, and BGN, were validated by immunostaining data from the HPA database. Compared with normal tissue, expression levels of BGN and TIMP1 increased in colon cancer tissue, whereas that of ZG16 decreased.

Validation of the three hub genes: (a, b) ZG16, (c, d) BGN, and (e, f) TIMP1 with immunohistochemistry of normal and tumor tissue from the Human Protein Atlas database.
Discussion
To discover more effective prognostic biomarkers for colon cancer, a worldwide public health problem, we analyzed three datasets (GSE33113, GSE20916, and GSE37364) from the GEO database. A total of 207 DEGs were identified; these were significantly enriched in the GO terms “organic anion transport” (BP), “extracellular matrix” (CC), and “receptor ligand activity” (MF). In the KEGG pathway analysis, DEGs were primarily enriched in “cytokine-cytokine receptor interaction” and “IL-17 signaling pathway.” Cytokines are crucial components of the extracellular environment and they influence tumor cell proliferation, invasion, and migration. 12 In recent years, the development of colon cancer treatment methods based on cytokines such as interleukin (IL-17) has attracted much attention. 13
Using integrated bioinformatic analyses, nine hub genes were selected and verified based on TCGA. Ultimately, we found that three genes (ZG16, TIMP1, and BGN) could be considered potential targets for prediction of colon cancer prognosis. High expression levels of TIMP1 and BGN were related to worse clinical outcomes, whereas higher expression of ZG16 might predict better survival in colon cancer patients. Expression levels of these three genes were validated with immunostaining data from the HPA database.
Zymogen granule protein 16 (ZG16) is expressed in mucus-secreting cells of the digestive system such as in the liver, colon, small intestine, and pancreas. 14 ZG16 is an important component of the protective mucus layer, which keeps bacteria away from host colon epithelium. 15 The lectin-like domain of ZG16 can stimulate the T cells of the intestinal immune system and participate in tumor recognition. Compared with that in normal colon tissue, ZG16 expression in colon cancer is significantly decreased. Meng et al. 16 reported that low levels of ZG16 mRNA were correlated with poor survival in colon cancer. Previous studies have found that ZG16 was further downregulated in patients with distant metastasis and this loss of protein expression was regulated by the microRNA miR-196a. 17 However, the role of ZG16 in colon cancer is still poorly documented and further research is needed.
Tissue inhibitor of metalloproteinases (TIMP-1), one of the most important regulators of matrix metalloproteinases (MMPs), is markedly increased in malignant tissue 18 and expressed in fibroblast-like cells located at the invasive front. 19 TIMP-1 is also associated with poor prognosis in colon cancer patients 20 and positively correlates with lymph node metastasis and Dukes classification. 21 TIMP-1 can promote the migration and invasion of cancer cells via reduction of cell apoptosis and activation of cell growth. Song et al. 22 found that downregulation of TIMP1 decreased proliferation and metastasis in human colon cancer by inducing the focal adhesion kinase (FAK)-phosphatidylinositol 3-kinase (PI3K)-Akt signaling pathway and mitogen-activated protein kinase (MAPK) pathway. Therefore, a high TIMP-1 level can predict poor prognosis of colon cancer, which is consistent with our findings.
Biglycan (BGN) is a proteoglycan of the extracellular matrix that plays an important role in the biological function of epithelial cells 23 and is the downstream target of a variety of signal transduction pathways. 24 The upregulation of BGN has been reported to lead to poor prognosis in several malignant epithelial tumors. Previous reports have demonstrated that BGN is associated with lymph node metastasis and distant metastasis of colon cancer. 25 BGN may be involved in the epithelial–mesenchymal transition process by the integrated pathway of transforming growth factor-β/Snail with tumor necrosis factor-α/nuclear factor-κB, 26 and it exerts an antiapoptotic effect via the p38 MAPK signaling pathway in colon cancer. 27 Our study demonstrated that BGN is also an indicator of poor prognosis in colon cancer patients.
Conclusions
Through bioinformatics analyses, we demonstrated that ZG16, TIMP-1, and BGN are hub genes related to clinical status in patients with colon cancer, and these genes are potential biomarkers for prognosis of colon cancer. Although the possible biological mechanisms through which these relationships occur require verification by in vivo and in vitro analyses, our study provides a new direction for further studies on colon cancer.
Footnotes
Acknowledgements
The authors thank the staff members of Department of Gastroenterology, the Second Affiliated Hospital of Guangxi Medical University, for their technical assistance and kind encouragement.
Declaration of conflicting interest
The authors declare that there is no conflict of interest.
Funding
The author(s) disclosed receipt of the following financial support for the research, authorship, and/or publication of this article: This work was supported by grants from Guangxi Health Department Scientific Research Program (No. Z20200153).