
Abstract
Objective
The objective was to identify potential hub genes associated with the pathogenesis and prognosis of hepatocellular carcinoma (HCC).
Methods
Gene expression profile datasets were downloaded from the Gene Expression Omnibus database. Differentially expressed genes (DEGs) between HCC and normal samples were identified via an integrated analysis. A protein–protein interaction network was constructed and analyzed using the STRING database and Cytoscape software, and enrichment analyses were carried out through DAVID. Gene Expression Profiling Interactive Analysis and Kaplan–Meier plotter were used to determine expression and prognostic values of hub genes.
Results
We identified 11 hub genes (CDK1, CCNB2, CDC20, CCNB1, TOP2A, CCNA2, MELK, PBK, TPX2, KIF20A, and AURKA) that might be closely related to the pathogenesis and prognosis of HCC. Enrichment analyses indicated that the DEGs were significantly enriched in metabolism-associated pathways, and hub genes and module 1 were highly associated with cell cycle pathway.
Conclusions
In this study, we identified key genes of HCC, which indicated directions for further research into diagnostic and prognostic biomarkers that could facilitate targeted molecular therapy for HCC.
Keywords
Introduction
On a global scale, cancer is the main public health problem and liver cancer is a major contributor to both cancer morbidity and mortality. 1 Liver cancer is the sixth most common cancer and the fourth highest cause of cancer-related mortality worldwide. 2 There were expected to be 42,030 newly diagnosed cases and 31,780 deaths of liver cancer in the United States during 2019. 3 Hepatocellular carcinoma (HCC) is the most common form of primary liver cancer, comprising 75% to 85% of cases. 2 The well-recognized risk factors for HCC include chronic infection with hepatitis B (HBV) or hepatitis C virus, exposure to dietary aflatoxin, alcohol-induced cirrhosis, smoking, obesity, and type 2 diabetes.2,4 In Asia (especially China), chronic HBV infection is the leading etiologic factor of HCC. 5 Most HCC patients are diagnosed at an advanced stage, and locoregional treatments (chemoembolization) and surgical treatments are relatively disappointing in terms of overall survival (OS) of patients with advanced disease. 6 In addition, traditional chemotherapies have not shown promising outcomes in treatment of HCC and have significant toxicity.6,7 Meanwhile, the lack of early detection of diagnostic markers and limited treatment strategies increase the risk of poor prognosis and death. 8 Therefore, there is a pressing need to develop robust diagnostic strategies and effective therapies for HCC patients. 9
Over the past decades, microarray technology and bioinformatics have been extensively applied to identify the molecular mechanisms of HCC, which provide strong research support for the diagnosis, treatment, and prognosis of HCC. 10 Because of the ability to process a large number of datasets quickly, integrated bioinformatics analysis and microarray technology have allowed researchers to comprehensively identify the functions of numerous differentially expressed genes (DEGs) in HCC, and they help researchers explore the complicated process of HCC occurrence and development.10,11 A work by He et al. 12 identified four hub genes and two important pathways in the development of HCC from cirrhosis from one Gene Expression Omnibus (GEO) dataset using a bioinformatics method, including DEG screening, enrichment analyses, and construction of a protein–protein interaction (PPI) network. Zhang et al. 13 screened hub genes and pathways correlated with the occurrence and progression of HCC via a series of bioinformatics analyses incorporating DEGs identification, functional enrichment analyses, PPI network and module analysis, and weighted correlation network analysis. Zhou et al. 11 identified the pivotal genes and microRNAs in HCC using a bioinformatics approach, including analysis of raw data via GEO2R, Gene Ontology (GO), and Kyoto Encyclopedia of Genes and Genomes (KEGG) pathway enrichment analyses, and construction of PPI network. However, to improve the diagnosis and treatment of HCC, novel diagnostic and prognostic biomarkers for HCC are needed. The flowchart of the study approach is shown in Figure 1.

Flowchart for identification of core genes and pathways for hepatocellular carcinoma (HCC). GEO, Gene Expression Omnibus; DEG, differentially expressed gene; GO, Gene Ontology; KEGG, Kyoto Encyclopedia of Genes and Genomes; PPI, protein–protein interaction; GEPIA, Gene Expression Profiling Interactive Analysis.
Materials and methods
Ethical approval
Ethical approval was not required in this study because we analyzed only published data from the GEO database.
Gene expression profile data
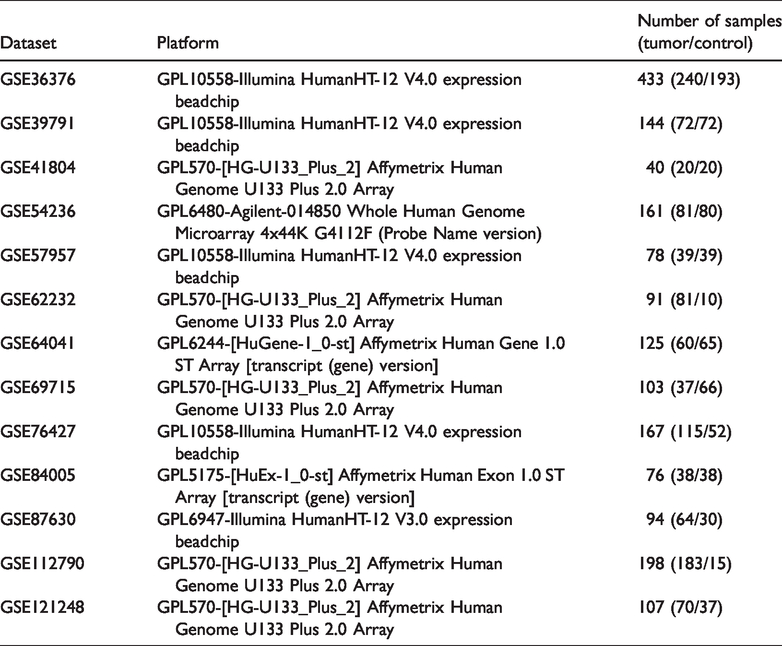
Gene expression profile data (GSE36376, 14 GSE39791, 15 GSE41804, 16 GSE54236,17,18 GSE57957, 19 GSE62232, 20 GSE64041, 21 GSE69715, 22 GSE76427, 23 GSE84005, GSE87630, 24 GSE112790, 25 and GSE121248 26 ) were downloaded from the GEO database (http://www.ncbi.nlm.nih.gov/geo/), 27 a public data repository, including high-throughput gene expression and other functional genome datasets. The selection criteria for the included datasets were as follows: (1) tissue samples collected from human HCC and corresponding adjacent or normal tissues; and (2) including at least 40 samples.
Integrated analysis of microarray datasets
The matrix data of each GEO dataset were normalized and log2 transformed using the R software package limma, 28 and the DEGs between HCC and corresponding adjacent or normal tissues were also filtered using the limma package. Integration of DEGs identified from the 13 datasets was performed by RobustRankAggreg package 29 in R software. A |log2 fold change (FC)| ≥1 and adjusted P-value < 0.05 were considered significant for the DEGs.
Enrichment analyses of DEGs
Database for Annotation, Visualization and Integrated Discovery (DAVID; https://david.ncifcrf.gov/, version, 6.8) 30 is a comprehensive functional annotation tool for extracting biological significance from large gene/protein datasets. In this study, the GO and KEGG pathway enrichment analyses for the DEGs were conducted via DAVID. The visualization of enrichment analysis results was conducted by using ggplot2 31 and the GOplot 32 package in the R software.
PPI network and module analysis
Search Tool for the Retrieval of Interacting Genes/Proteins (STRING; https://string-db.org/) 33 is a database of known and predicted protein interactions, showing direct and indirect interactions among proteins. This database was applied to obtain potential interactions among the DEGs. PPIs with a confidence score ≥0.7 were reserved and imported into Cytoscape software 34 to construct the PPI network. Furthermore, the clustering modules in this PPI network were analyzed using the MCODE (Molecular Complex Detection) plugin in Cytoscape. 35 Pathway enrichment analyses for important modules were also carried out. The visualization of enrichment analysis results was performed by using the imageGP platform (http://www.ehbio.com/ImageGP/index.php/Home/Index/GOenrichmentplot.html).
Survival analysis of hub genes
Kaplan–Meier plotter (KM plotter; http://kmplot.com/analysis/) is a database containing clinical data and gene expression data. 36 This database is used to further understanding the molecular basis of disease and identifying biomarkers associated with survival. 37 The recurrence-free survival and OS information were based on GEO, the European Genome-phenome Archive (EGA), and The Cancer Genome Atlas (TCGA) databases. Hazard ratios (HR) with 95% confidence intervals and log rank P-value were calculated to assess the association of gene expression with survival and are shown in plots. 38
Expression level analysis and correlation analysis of hub genes
The Gene Expression Profiling Interactive Analysis (GEPIA; http://gepia.cancer pku.cn/index.html) 39 is a newly developed web-based tool that applies a standard processing pipeline to analyze gene expression data between tumor and normal tissues. The relationship of expression of hub genes in HCC and normal tissues were visualized by boxplot. 38 In addition, correlation analysis was performed by GEPIA to check the relative ratios between two genes. 39
Results
Identification of DEGs
In the present study, 13 datasets were downloaded from GEO that included 1100 cancer tissues and 717 corresponding adjacent or normal tissues (Table 1). After integrated analysis, 380 DEGs (293 downregulated and 87 upregulated) were identified (Figure 2a-m and Appendix). Figure 2n shows the top 20 down- and upregulated genes.
Information for the 13 Gene Expression Omnibus datasets included in the current study.
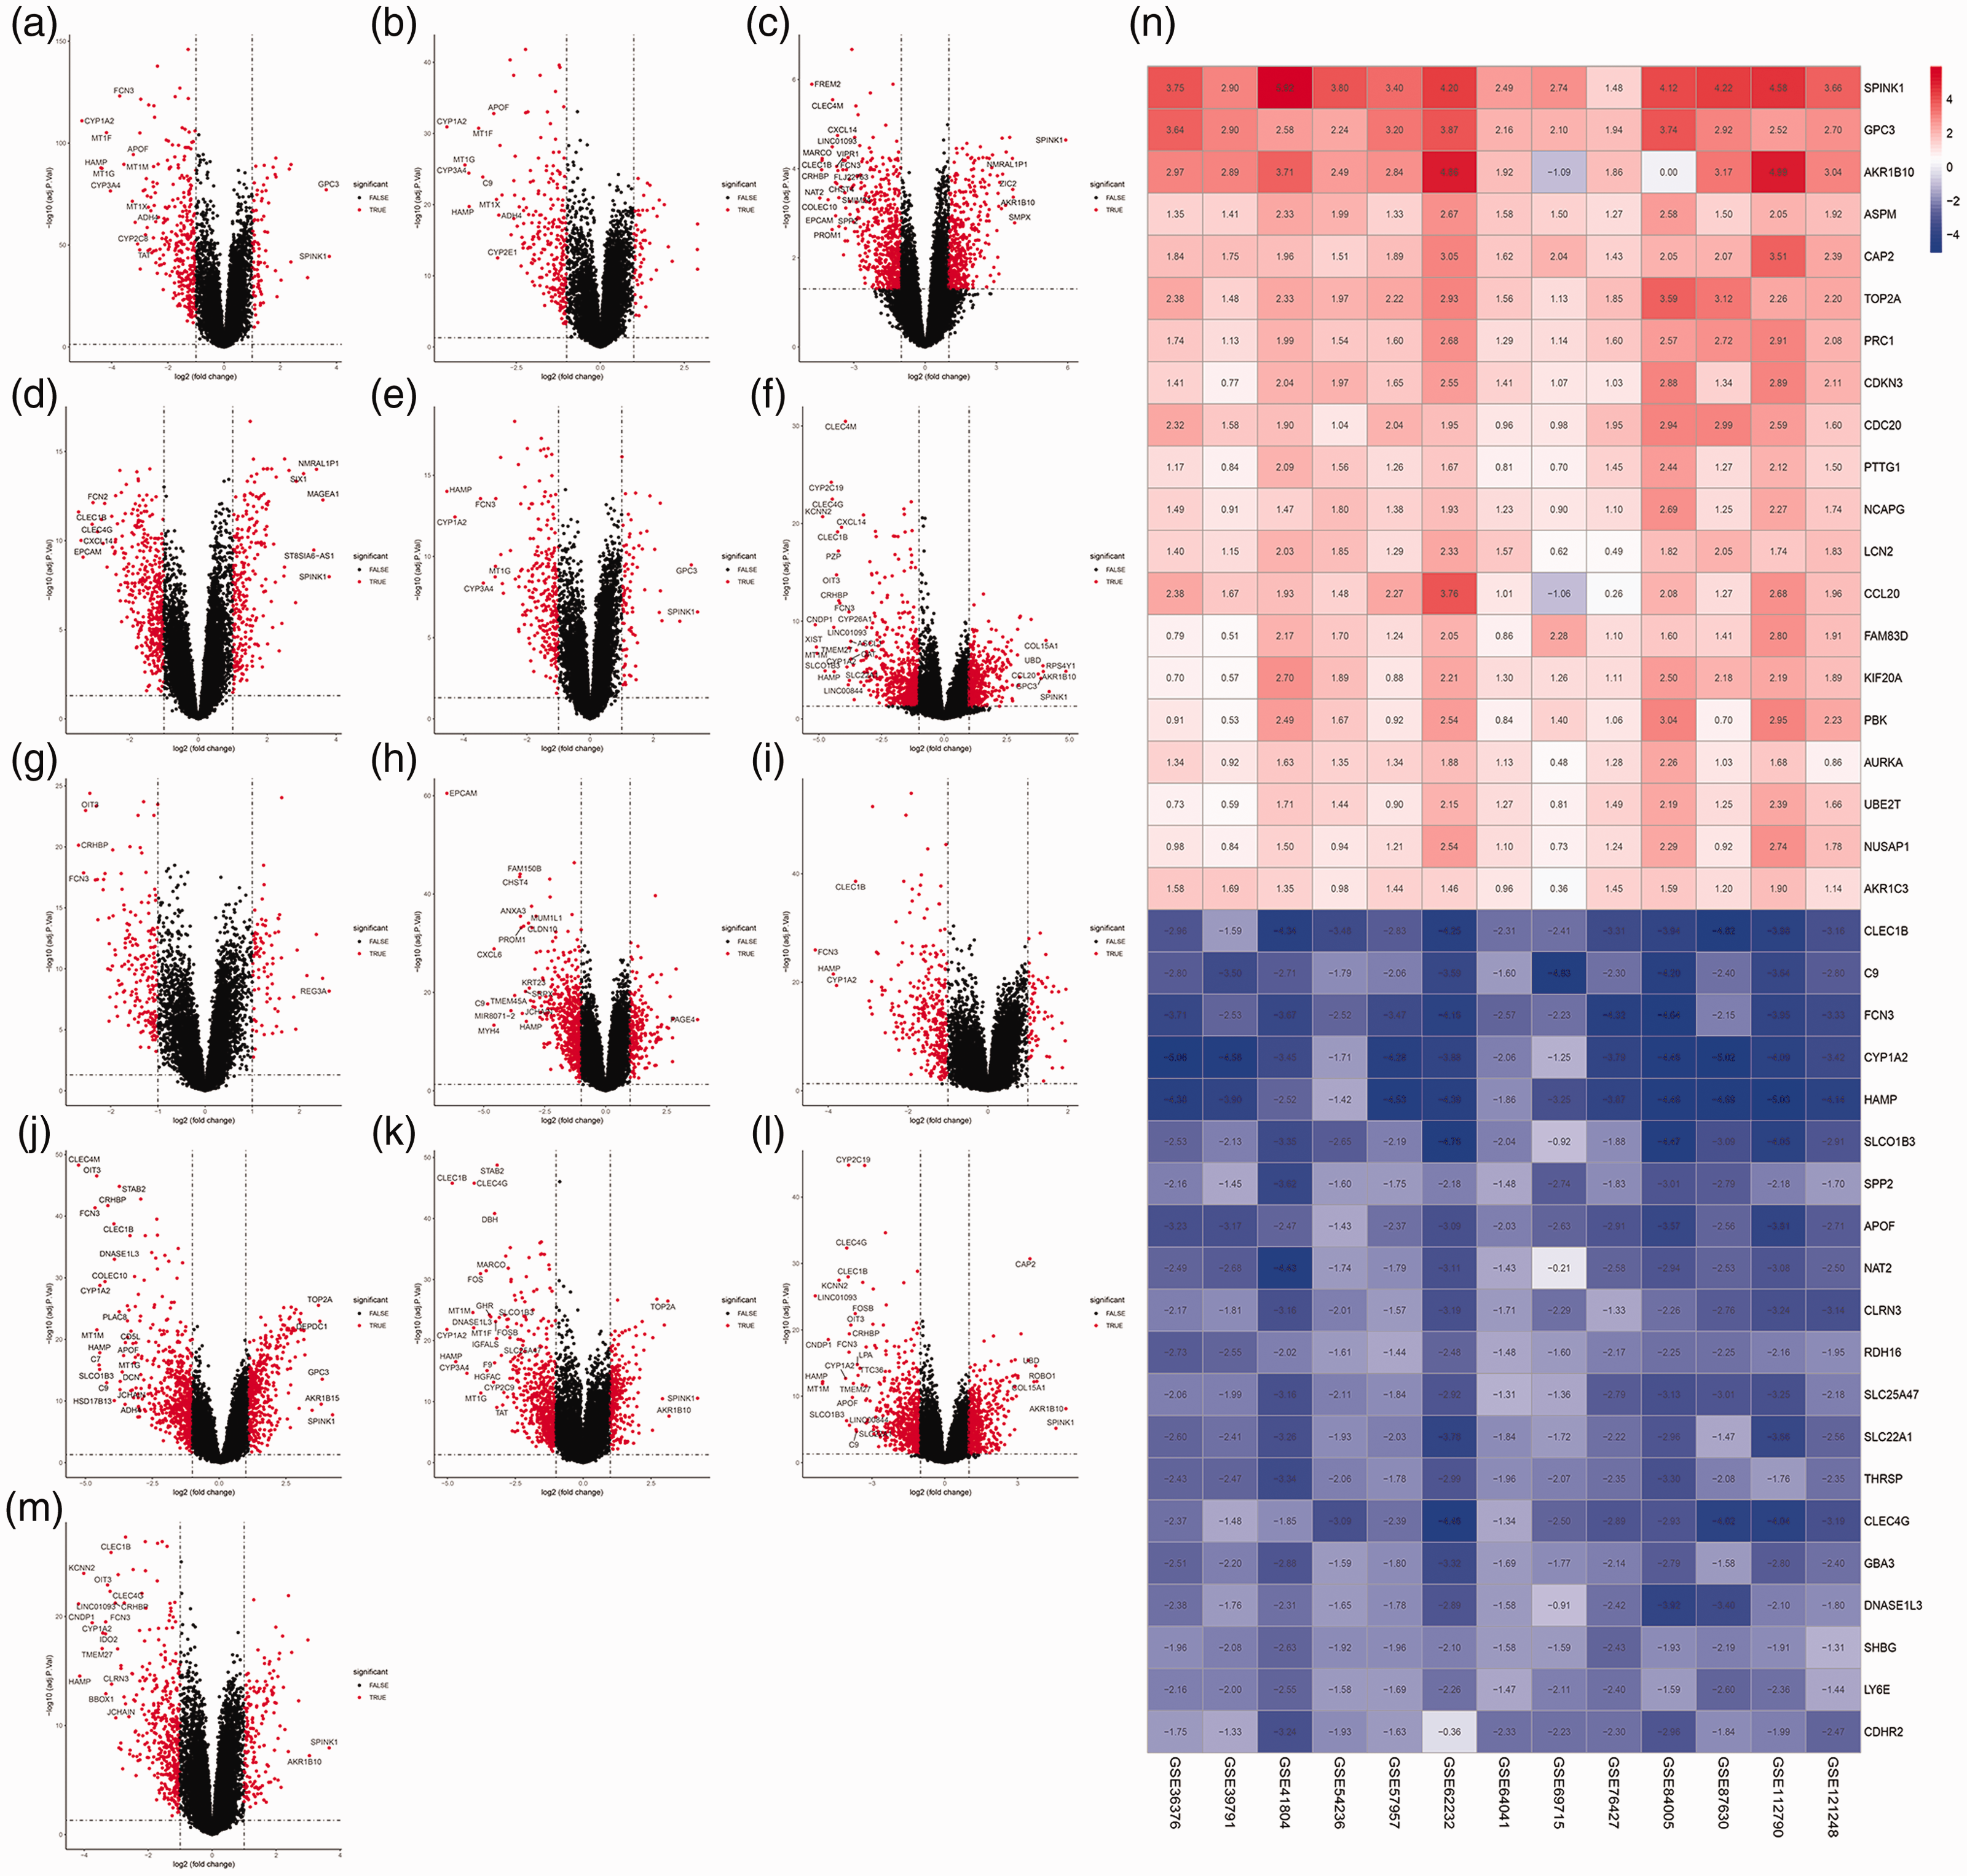
Identification of DEGs. Volcano plots of Gene Expression Omnibus datasets (a) GSE36376, (b) GSE39791, (c) GSE41804, (d) GSE54236, (e) GSE57957, (f) GSE62232, (g) GSE64041, (h) GSE69715, (i) GSE76427, (j) GSE84005, (k) GSE87630, (l) GSE112790, and (m) GSE121248; (n) heat map of DEGs. Blue indicates lower expression levels, red indicates higher expression levels, and white indicates no differentially expression among the genes. Each column represents one dataset and each row represents one gene. The number in each rectangle represents the normalized gene expression level. The gradual color ranged from blue to red represents the changing process from downregulation to upregulation. DEG, differentially expressed gene.
GO and KEGG pathway enrichment analyses of DEGs
To deepen our understanding of DEGs, we performed GO and KEGG pathway enrichment analyses. Thirty-one significantly enriched GO terms were selected based on a false discovery rate (FDR) < 0.05 (Figure 3a and Appendix). In the GO terms were 13 terms for biological process, mainly related to metabolic process, P450 pathway, and oxidation-reduction process; 12 terms for molecular function, highly involved with multiple enzyme activities, heme binding, iron ion binding and oxygen binding; and 6 terms for cellular components, associated with organelle membrane, extracellular exosome, extracellular region, extracellular space, blood microparticle, and membrane attack complex.

Enrichment analysis of DEGs. (a) GO enrichment analysis of DEGs, (b) top 5 terms of GO enrichment, and (c) KEGG pathway analysis of DEGs. DEG, differentially expressed gene; GO, Gene Ontology; KEGG, Kyoto Encyclopedia of Genes and Genomes; FDR, false discovery rate.
In the KEGG pathway enrichment analyses, we screened nine pathways according to FDR < 0.05. Figure 3c shows the results of KEGG analysis; the DEGs primarily participated in diverse metabolism-associated signaling pathways, such as metabolic pathways, retinol metabolism, drug metabolism-cytochrome P450, among others.
PPI network establishment and module analysis
The PPI network of DEGs comprised 242 nodes and 1267 interactions (Figure 4a); degree was calculated to identify candidate key nodes. Finally, 11 potential key nodes were identified, the degrees of which were all more than four times the corresponding average values: CDK1, CCNB2, CDC20, CCNB1, TOP2A, CCNA2, MELK, PBK, TPX2, KIF20A, and AURKA (Table 2). Moreover, to determine important clustering modules in the PPI network, module analysis was performed using MCODE, and the two modules with the highest scores (score >10) were obtained (Figure 4b, 4c). The enrichment pathways of module 1 and module 2 are shown in Figure 5. Module 1 was highly associated with cell cycle and oocyte meiosis; module 2 was closely connected to drug metabolism-cytochrome P450, linoleic acid metabolism, chemical carcinogenesis, arachidonic acid metabolism, retinol metabolism, metabolism of xenobiotics by cytochrome P450, and metabolic pathways.

PPI network and hub clustering modules. (a) The PPI network of DEGs, (b) module 1 (MCODE score = 38.769), and (c) module 2 (MCODE score = 10.364). Blue circles represent downregulated genes and red circles represent upregulated genes. PPI, protein–protein interaction; DEG, differentially expressed gene; MCODE, Molecular Complex Detection.
Upregulated hub genes with high degrees.


Pathway analysis of the two modules with the highest scores. The y-axis shows significantly enriched KEGG pathways, and x-axis shows the two modules. KEGG, Kyoto Encyclopedia of Genes and Genomes; FDR, false discovery rate.
Survival analysis, expression, and correlation analysis of hub genes
Survival analysis of 11 hub genes was performed using the KM plotter. The results showed that high expression of CDK1 (HR = 2.15, 95% CI: 1.52–3.06; P = 1.1e−05), CCNB2 (HR = 1.91, 95% CI: 1.28–2.87; P = 0.0013), CDC20 (HR = 2.49, 95% CI: 1.72–3.59; P = 5.1e−07), CCNB1 (HR = 2.34, 95% CI: 1.55–3.54; P = 3.4e−05), TOP2A (HR = 1.99, 95% CI: 1.39–2.86; P = 0.00012), CCNA2 (HR = 1.92, 95% CI: 1.36–2.72; P = 0.00018), MELK (HR = 2.22, 95% CI: 1.5–3.27; P = 3.7e−05), PBK (HR = 2.24, 95% CI: 1.5–3.34; P = 4.8e−05), TPX2 (HR = 2.29, 95% CI: 1.62–3.24; P = 1.4e−06), KIF20A (HR = 2.33, 95% CI: 1.63–3.32; P = 1.8e−06), and AURKA (HR = 1.77, 95% CI: 1.25–2.5; P = 0.0011) was related to unfavorable OS for HCC patients (Figure 6). Furthermore, GEPIA was adopted to analyze the different expression level of hub genes in HCC and normal tissues and the 11 hub genes were confirmed to be highly expressed in HCC tissues (Figure 7). The correlations between hub genes were also analyzed by GEPIA, which showed that the 11 hub genes were significantly correlated with each other. Figure 8 showed that the increase in expression of CDK1 was strongly associated with increased expression of the other 10 hub genes.

Prognostic roles of 11 hub genes in patients with HCC shown as survival curves. (a) CDK1, (b) CCNB2, (c) CDC20, (d) CCNB1, (e) TOP2A, (f) CCNA2, (g) MELK, (h) PBK, (i) TPX2, (j) KIF20A, and (k) AURKA. HCC, hepatocellular carcinoma; HR, hazard ratio.

Analysis of expression levels of 11 hub genes in human HCC. The red and gray boxes represent cancer and normal tissues, respectively. (a) CDK1, (b) CCNB2, (c) CDC20, (d) CCNB1, (e) TOP2A, (f) CCNA2, (g) MELK, (h) PBK, (i) TPX2, (j) KIF20A, and (k) AURKA. HCC, hepatocellular carcinoma; LIHC, liver hepatocellular carcinoma.

Correlation analysis of 10 hub genes in HCC with CDK1: (a) CCNB2, (b) CDC20, (c) CCNB1, (d) TOP2A, (e) CCNA2, (f) MELK, (g) PBK, (h) TPX2, (i) KIF20A, and (j) AURKA. HCC, hepatocellular carcinoma.
Discussion
HCC is the most common type of malignancy and one of the leading causes of cancer-related mortality worldwide.40,41 Although much research has been done on HCC, its early diagnosis and treatment remains difficult because of a lack of understanding of the molecular mechanisms associated with HCC occurrence and development. 41 Therefore, in-depth studies of the etiological factors and molecular mechanisms of HCC are of critical importance for HCC diagnosis and treatment. 11 Currently, bioinformatics analysis and microarray technology are developing rapidly and this approach can be used to identify therapeutic targets for diagnosis, therapy, and prognosis of a variety of neoplasms. 42 In this research, we identified 380 DEGs, including 293 downregulated and 87 upregulated genes, between HCC and corresponding adjacent or normal tissues. Enrichment analyses indicated that the DEGs were mostly associated with metabolic processes, such as metabolism of retinol, drugs, xenobiotics, tyrosine, tryptophan, and histidine, as well as fatty acid degradation. This indicated that metabolic dysregulation is closely related to HCC. In addition, we obtained 11 hub genes (CDK1, CCNB2, CDC20, CCNB1, TOP2A, CCNA2, MELK, PBK, TPX2, KIF20A, and AURKA) in the PPI network, which were upregulated in HCC tissues compared with normal tissues; expression of the first hub gene, CDK1, was strongly correlated with that of the other hub genes. Overexpression of the 11 hub genes was correlated with worse OS.
Recent evidence implies that tumor cells need specific interphase cyclin-dependent kinases (CDKs) to proliferate. 43 Cyclin-dependent kinase 1 (CDK1) belongs to the CDK family, a member of the serine/threonine protein kinases, and it is crucial for the cell cycle phase transitions G1/S and G2/M.44,45 CDK1 is required for cell proliferation because it is the only CDK that can initiate mitosis. 46 The deregulation of CDK1 is likely related to HCC tumorigenesis. 47 Research has found that high expression of CDK1 is correlated with poor OS of HCC. 45 Cyclins act as the regulatory subunits of the CDKs, regulating temporal transitions among various stages of the cell cycle via CDK activation. 48 Cyclin-A2 (CCNA2), cyclin-B1 (CCNB1), and cyclin-B2 (CCNB1), encoded by the CCNA2, CCNB1, and CCNB2 genes, respectively, all belong to the cyclin family. CCNA2 activates CDK1 at the end of interphase to facilitate the onset of mitosis, and CCNA2 overexpression has been reported in numerous types of cancers. 49 A previous study indicated that CCNA2 amplification and overexpression is associated with carcinogenesis of transgenic mouse liver tumors. 50 Moreover, research has demonstrated that inhibition of CCNA2 can arrest HCC cell proliferation and tumorigenesis. 51 High expression of CCNA2 is associated with reduced survival in patients with breast cancer and HCC.52,53 CCNB1 and CCNB2 are the principal activators of CDK1 and, together with CDK1, they promote the G2/M transition.54,55 Expression of CCNB1 changes periodically throughout the cell cycle, and is a crucial initiator of mitosis. 56 Decreased CCNB1 expression is related to inhibition of HCC occurrence and development, and activation of CCNB1 expression can promote proliferation in human HCC cells.56,57 Furthermore, previous research has shown that CCNB1 is closely connected to prognosis of HCC patients. 56,58 The dimerization of CCNB2 with CDK1 is an essential component of the cell cycle regulatory machinery, and an increase in expression of CCNB2/CDK1 could promote tumor cell proliferation. 55 Furthermore, CCNB2 is highly expressed in several malignant tumors and overexpression of CCNB2 is related to poor prognosis in HCC. 59 Cell division cycle protein 20 (encoded by CDC20) is a regulator of cell cycle checkpoints, which plays a crucial role in anaphase initiation and exit from mitosis.60,61 It degrades several important substrates, including cyclin A and CCNB1, to regulate cell cycle progression.62,63 CDC20 overexpression is related to progression and poor prognosis in various malignant tumors.64–67 Thus, it is a potential target in multiple cancer treatments. 68 A recent study found that increased expression of CDC20 is related to HCC development and progression. 67 Additionally, research has indicated that silencing expression of CDC20 and heparanase can activate cell apoptosis; thus, targeting inhibition of both CDC20 and heparanase expression is an ideal approach for the treatment of HCC. 69
Aurora kinase A (encoded by AURKA) is involved in centrosome duplication, spindle formation, chromosomal amplification and segregation, and cytokinesis, and it plays a significant role in centrosome maturation and mitotic commitment in the late G2 phase.70,71 Abnormal activity of AURKA promotes tumorigenic progression and transformation via defective control at the checkpoint of mitotic spindle. 72 Meanwhile, AURKA is highly expressed in a variety of human cancers, including breast cancer, 73 lung cancer, 74 gastrointestinal cancer, 75 bladder cancer, 76 and oral cancer. 77 A study demonstrated that genetic variations in AURKA might be a reliable predictor of early-stage HCC and a crucial biomarker for HCC development. 78 Moreover, other research has indicated that AURKA contributes in metastasis and invasiveness of HCC. 79 Therefore, AURKA might represent a new therapeutic target for HCC. Topoisomerase II alpha (TOP2A), a potential biomarker for cancer therapy, has been detected in various types of cancer.80–82 It participates in chromosome condensation and chromatid separation. 80 TOP2A encodes topoisomerase II alpha 81 and is reported to be overexpressed in HCC tissues. 83 Furthermore, a study has shown that TOP2A has prognostic value in HCC and its reactive agents can be used in HCC therapy. 84 Maternal embryonic leucine zipper kinase (encoded by MELK) is a member of the AMP protein kinase family of serine/threonine kinases, which affect many stages of tumorigenesis. 85 Several studies have shown that MELK is an oncogenic kinase essential for early HCC recurrence, and its expression is upregulated in HCC.86–88 Furthermore, MELK inhibition is associated with suppression of tumor growth, indicating that MELK is a potential therapeutic target for HCC. 89 PDZ-binding kinase (encoded by PBK) can regulate cell cycle processes. 90 Although PBK is barely detectable in normal somatic tissues, it is often elevated in various tumor tissues and is therefore an important target for cancer screening and targeted therapy.91,92 Recent research has shown that PBK overexpression promotes migration and invasion of HCC, and it could be a therapeutic target for HCC metastasis. 93 Targeting protein for Xklp2 (TPX2) expression is modulated by the cell cycle, and it is detected in G1/S phase and disappears after cytokinesis.94,95 Several studies have indicated that TPX2 is highly expressed in different types of cancers.96,97 Additionally, expression of TPX2 is related to proliferation and apoptosis in HCC. 98 TPX2 overexpression promotes the growth and metastasis of HCC. 99 Kinesin family member 20A (KIF20A) is required during mitosis for the final step of cytokinesis.100,101 Studies have found that high expression of KIF20A is correlated with progression or poor prognosis of many types of cancers.102–104 Furthermore, KIF20A is aberrantly expressed in HCC tissues and its expression may be associated with poor OS. 105
According to enrichment analyses of two modules, we found that module 1 was mostly associated with cell cycle and module 2 was closely related to metabolic pathways. Furthermore, all 11 hub genes belonged to module 1 and most are associated with cell cycle and enriched in the “cell cycle” pathway. A number of studies have elucidated that cell cycle disorders are closely related to human cancer. 43 Therefore, the carcinogenesis and progression of HCC may be associated with the cell cycle pathway, and we might be able to suppress HCC cell cycle progression, inhibit HCC cell proliferation, and reduce HCC malignancy by downregulating expression of the 11 hub genes identified herein.
Compared with previous studies, this work has several advantages, as follows. First, the current integrated microarray data used a relatively large sample size from several GEO datasets (GSE36376, 14 GSE39791, 15 GSE41804, 16 GSE54236,17,18 GSE57957, 19 GSE62232, 20 GSE64041, 21 GSE69715, 22 GSE76427, 23 GSE84005, GSE87630, 24 GSE112790, 25 and GSE121248 26 ). Second, functional enrichment analyses were performed to identify the main biological functions and pathways regulated by DEGs. Third, we established PPI networks, conducted module analysis, discovered potential biomarkers for diagnosis and prognosis of HCC, and performed correlation analysis of hub genes.
The limitations of this work were as follows: First, our results need to be verified by corresponding experimental studies. Second, we obtained data from the GEO database, and data quality cannot be verified. Finally, our study focused on genes that are typically identified as significant changes in diverse datasets, without regard to sex, age, or grading and staging of tumors from which the samples were derived.
Conclusion
In the present work, we identified 11 hub genes (CDK1, CCNB2, CDC20, CCNB1, TOP2A, CCNA2, MELK, PBK, TPX2, KIF20A, and AURKA) associated with the development and poor prognosis of HCC by integrated bioinformatics analysis. However, because our study was based on data analysis only, further experiments are required to confirm the results. Our findings will provide evidence and new insights to enhance approaches for the early diagnosis, prognosis, and treatment of HCC.
Footnotes
Declaration of conflicting interest
The authors declare that there is no conflict of interest.
Funding
This work was supported by the National Natural Science Foundation of China (No. 81473547, 81673829) and the Young Scientists Training Program of Beijing University of Chinese Medicine.
Appendix
Information for 293 downregulated genes (down) and 87 upregulated genes (up).
Information on Gene Ontology (GO) enrichment analysis in biological process (BP), cellular component (CC), and molecular function (MF) categories.