
Abstract
Objective
Atherosclerosis (AS) is a life-threatening disease in aging populations worldwide. However, the molecular and gene regulation mechanisms of AS are still unclear. This study aimed to identify gene expression differences between atheroma plaques and normal tissues in humans.
Methods
The expression profiling dataset GSE43292 was obtained from the Gene Expression Omnibus (GEO) dataset. The differentially expressed genes (DEGs) were identified between the atheroma plaques and normal tissues via GEO2R, and functional annotation of the DEGs was performed by GSEA. STRING and MCODE plug-in of Cytoscape were used to construct a protein–protein interaction (PPI) network and analyze hub genes. Finally, quantitative polymerase chain reaction (qPCR) was performed to verify the hub genes.
Results
Overall, 134 DEGs were screened. Functional annotation demonstrated that these DEGs were mainly enriched in sphingolipid metabolism, apoptosis, lysosome, and more. Six hub genes were identified from the PPI network: ITGAX, CCR1, IL1RN, CXCL10, CD163, and MMP9. qPCR analysis suggested that the relative expression levels of the six hub genes were significantly higher in AS samples.
Conclusions
We used bioinformatics to identify six hub genes: ITGAX, CCR1, IL1RN, CXCL10, CD163, and MMP9. These hub genes are potential promising diagnostic and therapeutic targets for AS.
Keywords
Introduction
Atherosclerosis (AS) is a common global disease that can result in the development of various cardiovascular diseases with high morbidity and mortality, such as myocardial infarction and stroke.1,2 Because of the prevalence of unhealthy diets, commonly composed of high fat and sugar and low fiber, the incidence of AS has increased significantly in recent decades and has resulted in serious harm to human health. 3 AS is considered to be a chronic inflammatory disease of arteries where an injury to the arterial intima initiates a lesion. Subsequently, inflammatory cells accumulate, low-density lipoprotein (LDL) infiltrates and is retained in the arterial intima, and atherosclerotic plaques form. 4 Although research supports this definition of AS, the mechanism controlling it at the gene regulation level is still unclear.
Numerous studies have suggested that AS is related to genetic factors. 5 Therefore, it is important to study AS at the gene level, which may offer some novel ideas for preventing and treating this disease. In recent years, the development of gene-sequencing technology has made sequencing an entire genome more rapid and inexpensive. 6 The differentially expressed genes (DEGs) associated with AS can be screened via bioinformatics tools. These methods could help researchers detect any gene regulation mechanisms that affect AS.
In this study, we analyzed one human expression profiling dataset downloaded from the Gene Expression Omnibus (GEO) Dataset and obtained the DEGs between carotid atheroma and normal tissues. Finally, we constructed networks of protein–protein interaction (PPI), significant modules, and hub genes by using various bioinformatics technologies. These findings could help facilitate further investigations of the underlying molecular and gene regulation mechanisms of AS.
Materials and methods
Access to public data
The GEO database (http://www.ncbi.nlm.nih.gov/geo) is a public genomics database that offers various high-throughput resources, such as microarrays, gene expression data, and chromatin immunoprecipitation (ChIP)-Seq data. 7 GSE43292, an expression profiling dataset, was downloaded from the GEO database, which was sequenced on the platform GPL6244 [HuGene-1_0-st] Affymetrix Human Gene 1.0 ST Array [transcript (gene) version]. This dataset consisted of 32 atheroma plaques and 32 macroscopically intact tissues derived from pieces of carotid endarterectomy collected from 32 hypertensive patients.
Identification of DEGs with GEO2R
GEO2R (http://www.ncbi.nlm.nih.gov/geo/geo2r) is an online tool for analyzing GEO data and runs using the R language based on two R packages, GEOquery and limma. GEO data can be imported into R for differential analysis. The DEGs were identified between the atheroma plaques and normal tissue via GEO2R. Statistically significant thresholds were adj. P-value < 0.01 and |log2FC| (fold change) > 1.
Enrichment analysis by Gene Set Enrichment Analysis (GSEA)
GSEA is an analysis method for genome-wide expression profile ChIP data that compares genes of interest with predefined gene sets. 8 A molecular tag database is built on the basis of the existing information of gene location, property, function, and biological significance. In this database, known genes are grouped and classified according to multiple functional gene sets, such as chromosome location, established gene set, module sequence, tumor-related gene set, and gene ontology (GO) gene set. By analyzing the gene expression profile data, we can understand expression patterns in a specific set of functional genes and whether this expression status is statistically significant. GO and Kyoto Encyclopedia of Genes and Genomes (KEGG) pathway enrichment analyses were performed for identified DEGs using GSEA analysis.
Construction and analysis of the PPI network
The PPI network was constructed via the Search Tool for the Retrieval of Interacting Genes (STRING) online database (http://string-db.org; version 11.0) to predict and track protein–protein interactions. 9 The minimum required interaction score was medium confidence >0.4. Cytoscape (version 3.7.1), an open-source visualization software tool, can help visualize the PPI network and can be used to analyze the network in more depth.
Mining and screening of hub genes
Molecular COmplex DEtection (MCODE), a plug-in of Cytoscape, can mine densely connected regions from a PPI network based on the topology principles. The PPI network was constructed by Cytoscape, then the hub genes were screened by MCODE. The criteria for the MCODE analysis were as follows: MCODE score >5, degree cutoff = 2, node score cutoff = 0.2, k-score = 2, and max depth = 100.
Sample collection
The AS samples and control artery samples were collected from the vessels of inpatients admitted to Beijing Hospital. The AS samples were collected from the experimental group – inpatients admitted for carotid endarterectomy. The control artery samples were collected from the control group – inpatients admitted for amputation. The inclusion criteria of the experimental group were: the patient is between 18 and 110 years old, has AS, underwent surgery in the Vascular Surgery Department or Pathology Department, and consent was obtained from the patient and his or her family. The inclusion criteria of the control group were: the patient is between 18 and 110 years old, has had an arterial blood vessel transplant, and does not have AS. Exclusion criteria included: the patient is < 18 or >110 years old, has poor wound healing or an infection, has severely weakened cardiopulmonary function, and has high preoperative intracranial pressure, encephalocele, or an intracranial infection.
The research conformed to the Declaration of Helsinki and was authorized by the Human Ethics and Research Ethics Committees of the Beijing Hospital (2017BJYYEC-111-01). Written informed consent was obtained from all participants.
Quantitative polymerase chain reaction (qPCR) assays
Fresh tissue samples were placed in cryogenic tubes and RNA later reagent (Beijing Biolab Technology Co., Ltd., Beijing, China) was added. The tubes were then stored at −80°C. To verify expression levels of the hub genes, qPCR assays were conducted. Total RNA was extracted from these samples using the RNAiso Plus (Trizol) Kit (Thermo Fisher Scientific, Waltham, MA, USA) for 1 hour at 42°C according to manufacturer instructions. Total RNA was then and reverse transcribed to cDNA using the Servicebio® RT First Strand cDNA Synthesis Kit (Wuhan Servicebio Biotechnology Co., Ltd., Wuhan, China). Reactions were terminated by heating the samples at 70°C for 5 minutes. qPCR was performed in a Light Cycler® 4800 System (Roche Diagnostics, Basel, Switzerland) with specific primer sets to amplify hub genes and Pyrobest DNA Polymerase (Beijing Baori Medical Technology Co., Ltd., Beijing, China). Primers used are described in Table 1. The thermocycling conditions used were as follows: 30 cycles of 95°C for 15 s and 60°C for 1 minute. The relative quantification units (relative quantification = 2−ΔΔCt, where Ct represents quantification cycle values) of each sample were calculated and presented as fold change of gene expression relative to the control group. GAPDH was used as the endogenous control.
Primers sequences for reverse transcription qPCR analysis.

qPCR, quantitative polymerase chain reaction; hF, human forward; hR, human reverse; GAPDH, glyceraldehyde 3-phosphate dehydrogenase; CXCL10, C-X-C motif chemokine ligand 10; CCR1, C-C motif chemokine receptor 1; IL1RN, interleukin 1 receptor antagonist; ITGAX, integrin subunit alpha X; MMP9, matrix metallopeptidase 9.
Results
Identification of DEGs
The DEGs between atheroma plaques and normal tissues were identified by analyzing the GSE43292 dataset using GEO2R. Overall, 134 DEGs were screened. The top 30 genes with the highest fold changes are listed in Table 2.
The top 30 genes with the highest fold changes.

FC, fold change.
GO and KEGG pathway enrichment analyses with GSEA
The GO analysis results, as shown in Figure 1, were mainly enriched in NAD-ADP-ribosyltransferase activity, synaptic vesicle endocytosis, synaptic vesicle recycling, chromosome condensation, sodium independent organic anion transmembrane transporter activity, and ceramide metabolic process. The KEGG analysis results, as shown in Figure 2, were mainly enriched in sphingolipid metabolism, vibrio cholerae infection, apoptosis, lysosome, natural killer cell mediated cytotoxicity, and N-glycan biosynthesis.

Gene Ontology (GO) enrichment analysis of differentially expressed genes (DEGs) identified from GSE43292. The results were enriched in NAD-ADP-ribosyltransferase activity, synaptic vesicle endocytosis, synaptic vesicle recycling, chromosome condensation, sodium independent organic anion transmembrane transporter activity, and ceramide metabolic process.
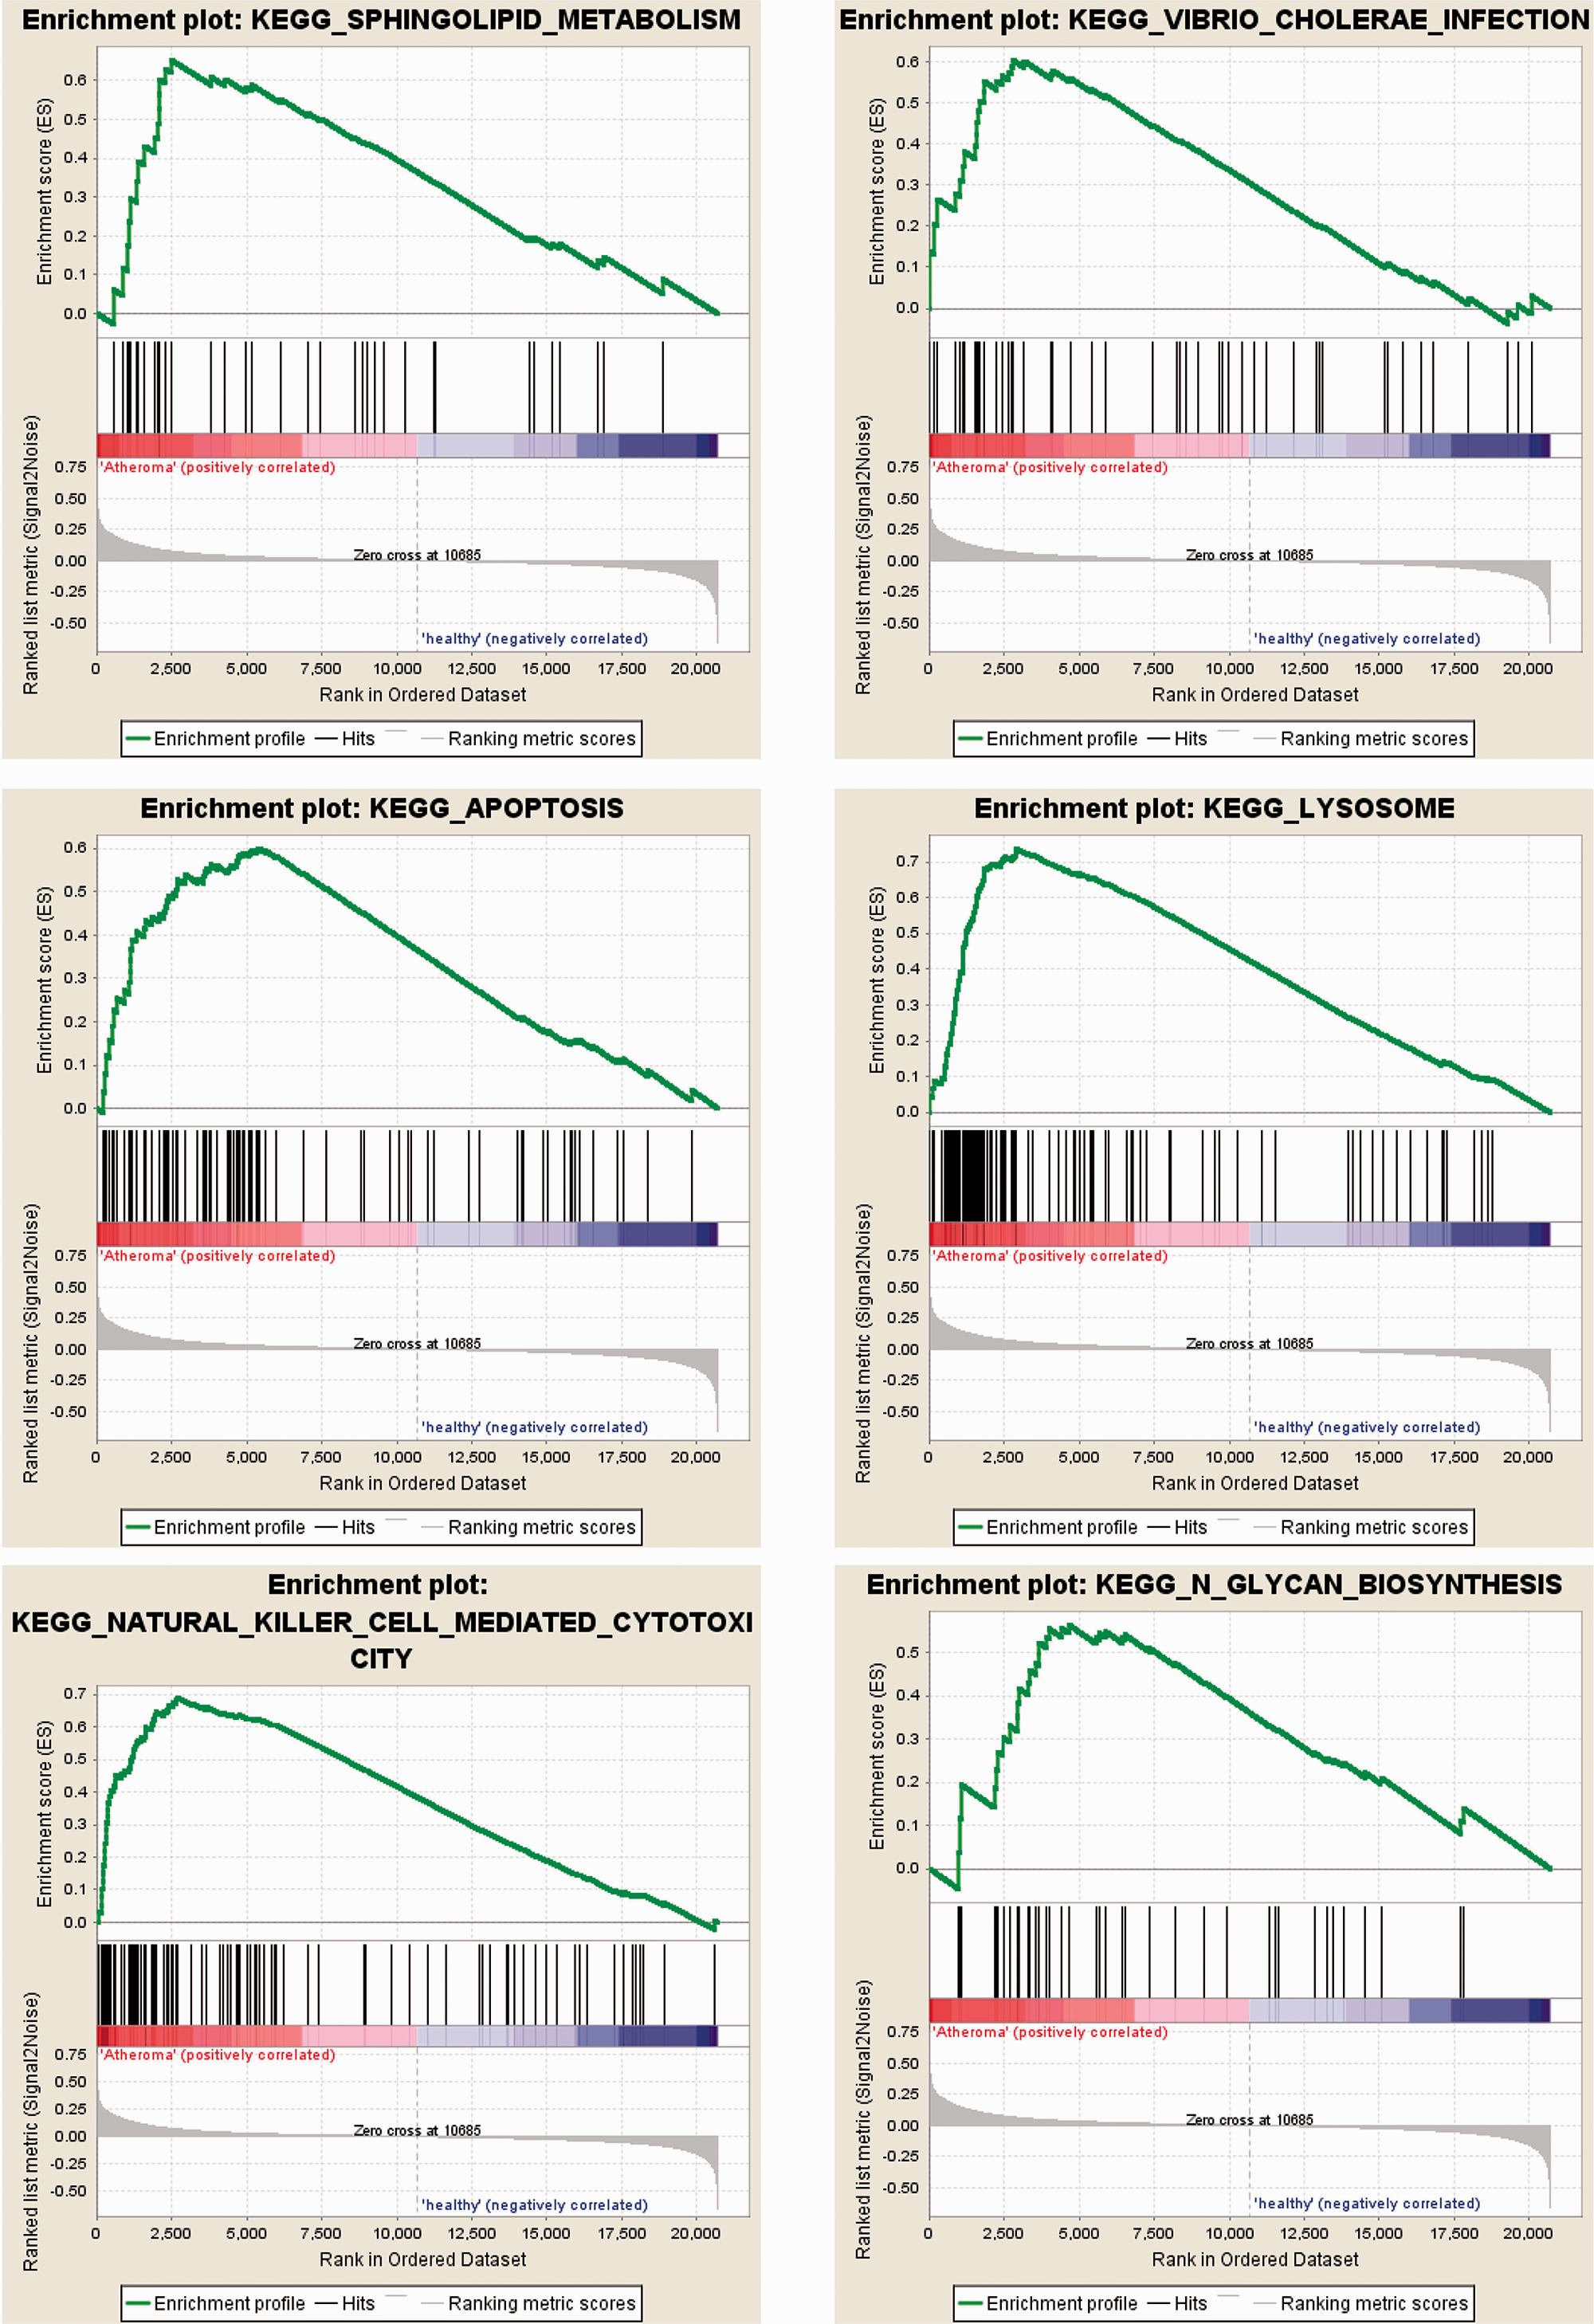
Kyoto Encyclopedia of Genes and Genomes (KEGG) pathway enrichment analysis of differentially expressed genes (DEGs) identified from GSE43292. The results were enriched in sphingolipid metabolism, vibrio cholerae infection, apoptosis, lysosome, natural killer cell mediated cytotoxicity, and N-glycan biosynthesis.
Construction of the PPI network and analysis of hub genes
The DEGs PPI network was constructed using Cytoscape (Figure 3), and the most significant module was identified with MCODE (Figure 4). Finally, six hub genes were screened from the PPI network, including integrin subunit alpha X (ITGAX), C–C motif chemokine receptor 1 (CCR1), interleukin 1 receptor antagonist (IL1RN), C-X-C motif chemokine ligand 10 (CXCL10), CD163, and matrix metallopeptidase 9 (MMP9), as listed in Table 3. The expression heatmap of the hub genes from the GSE datasets was generated to determine the associations and differences between samples (Figure 5). The heatmap shows that the six hub genes were expressed at higher levels in the AS samples relative to the control samples, and these differences were statistically significant (P < 0.05).
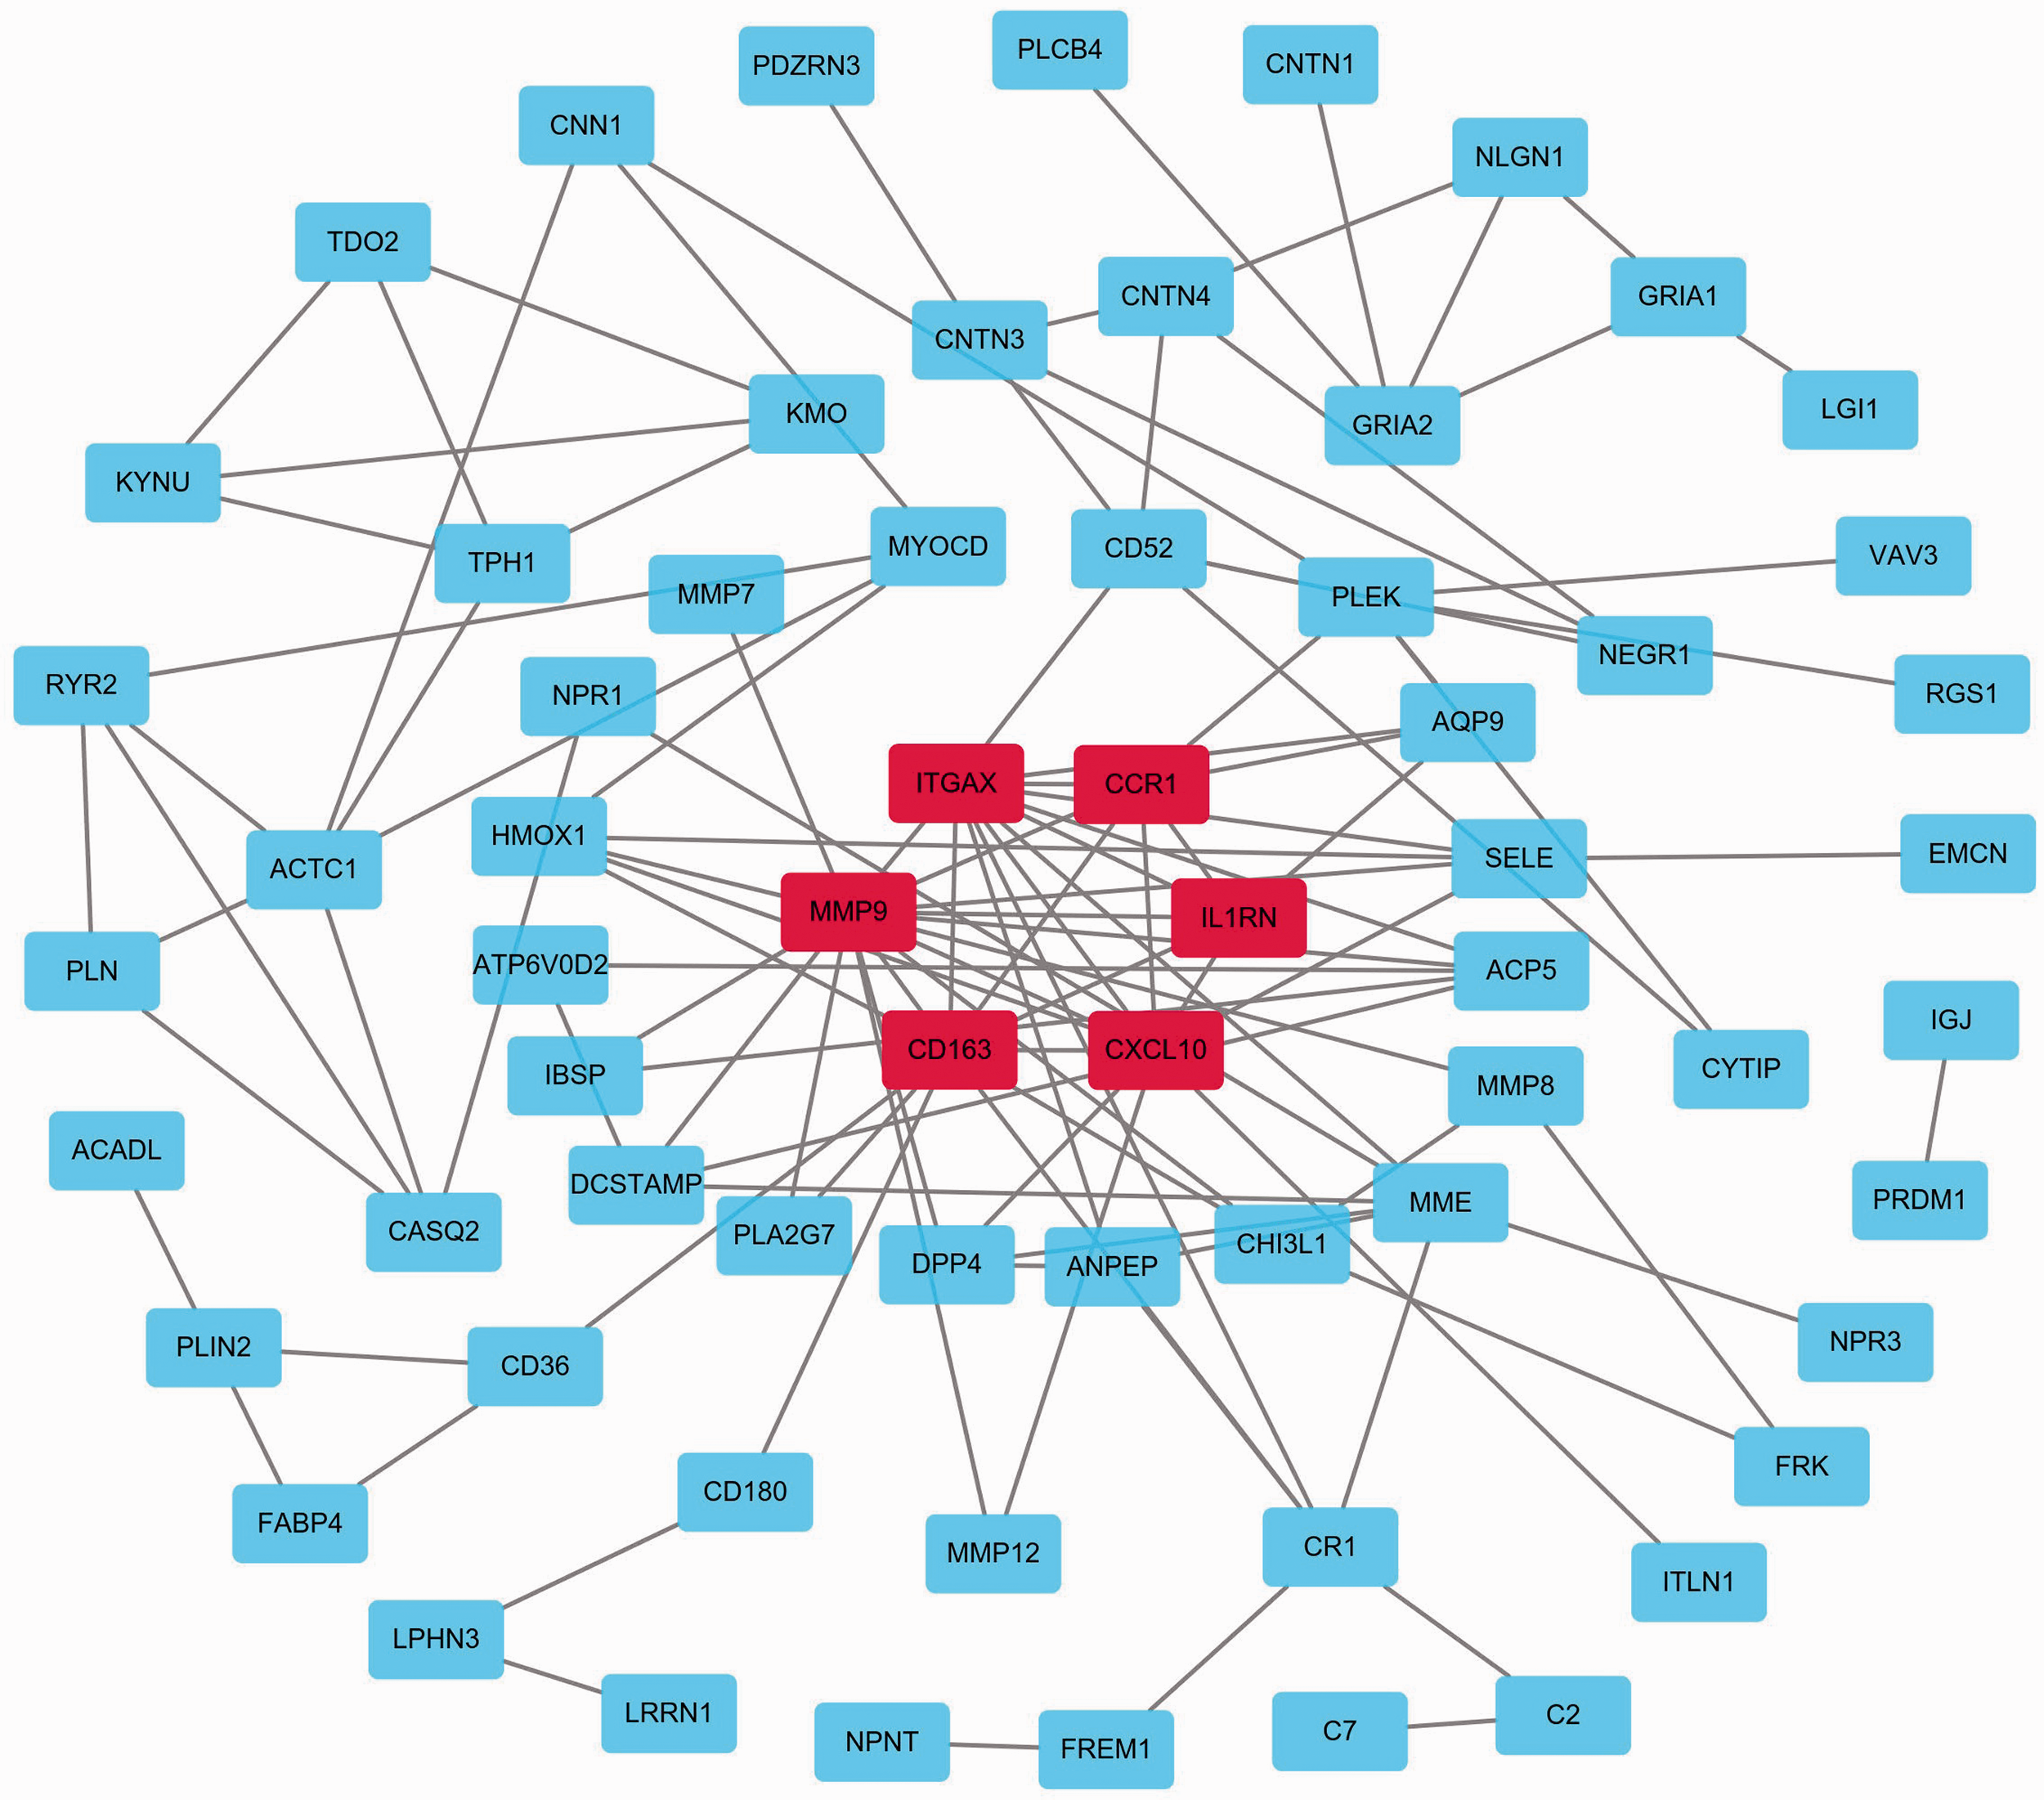
Protein–protein interaction (PPI) network of differentially expressed genes (DEGs) identified from GSE43292. Red represents the most significant module.

The most significant module identified in the protein–protein interaction (PPI) network.
Details of the six hub genes.

FC, fold change.

Results of hierarchical clustering showing that the hub genes can differentiate atheroma plaques and normal tissue in GSE43292. Red represents high level expression and blue represents low level expression. The hub genes are highly expressed in the atherosclerosis (AS) group, but expressed at lower levels in the control group.
Verification of hub gene expression levels
According to the above analysis, the six hub genes were markedly upregulated in AS samples. Next, qPCR assays were performed to verify these observations. The AS samples and control artery samples were collected from the vessels of inpatients admitted to Beijing Hospital. Finally, we included five participants in the experimental group and five participants in the control group (Table 4). Results of the qPCR assays suggested that the relative expression levels of the six hub genes were significantly higher in the AS samples compared with the control group (P < 0.05) (Figure 6).
Participant information

AS, atherosclerosis.
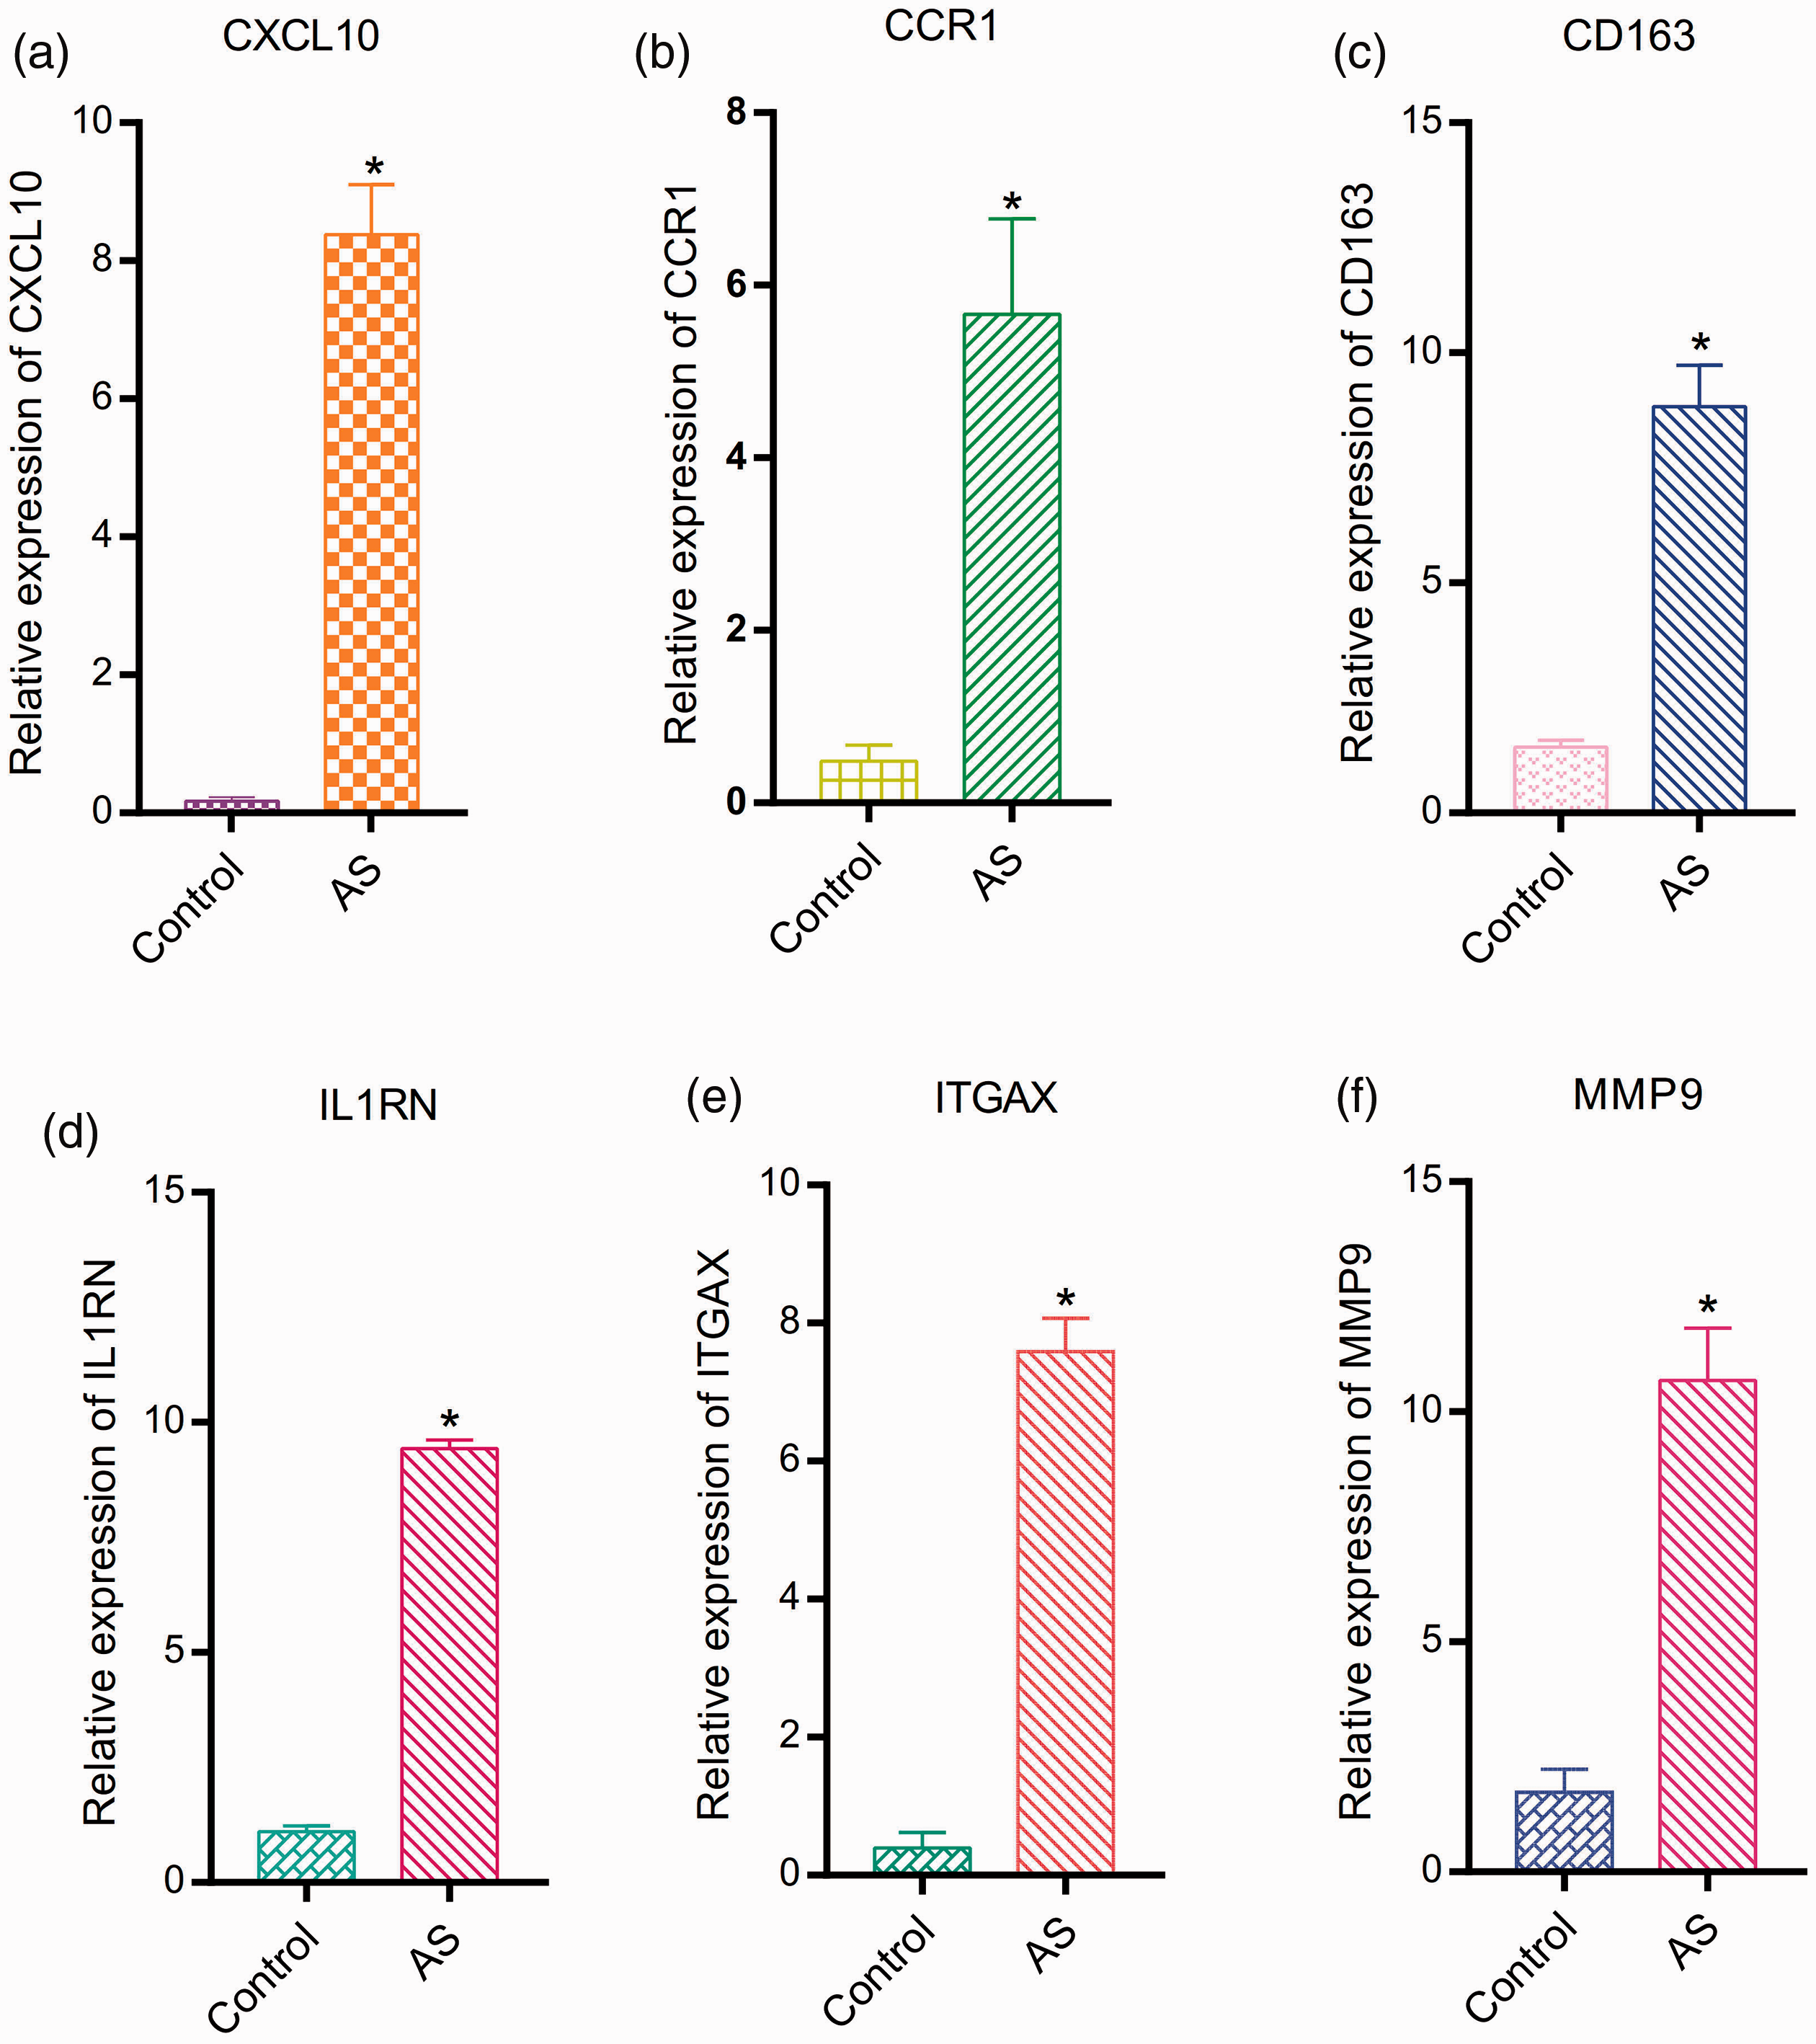
Relative expression levels of the six hub genes by quantitative polymerase chain reaction (qPCR) analysis. *P < 0.05, compared with the control. The relative expression levels of the six hub genes, (a) CXCL10, (b) CCR1, (c) CD163, (d) IL1RN, (e) ITGAX, and (f) MMP9, are significantly higher in the atherosclerosis (AS) group compared with the control group.
Discussion
AS, which can cause various cardiovascular and cerebrovascular diseases, is a serious life-threatening condition in aging populations worldwide.1,2 It is important to understand the underlying gene regulation mechanisms of AS to develop novel treatments for cardiovascular disease. In this study, the GSE43292 expression profiling dataset was reanalyzed and 134 DEGs were screened. The KEGG analysis results were enriched in apoptosis. A previous study showed that there were increased levels of endothelial cell turnover and apoptosis in AS-prone regions of the vessel. 10 The endothelium apoptotic activity in pathological conditions could impair barrier function of the endothelium and allow more LDL to infiltrate into the endangium, which can initiate the development of AS.11,12 These results help identify DEGs possibly associated with AS. We then identified six hub genes from the PPI network of DEGs: ITGAX, CCR1, IL1RN, CXCL10, CD163, and MMP9. Finally, we used qPCR assays to verify that the relative expression levels of the six hub genes were significantly higher in the AS samples (P < 0.05). The potential diagnostic and therapeutic values of the hub genes for AS are worthy of further investigation.
ITGAX, also called CD11c, is a gene that encodes the integrin alpha X chain protein. The integrin alpha X protein is a receptor for fibrinogen, and it mediates cell–cell interactions during inflammatory responses that are especially important in monocyte adhesion and chemotaxis. Monocytes are one of the major cell types that are involved in AS, and CD11c can mediate monocyte adhesion on endothelial cells and transendothelial infiltration into arterial walls. 13 This is a key step for atherogenesis.14,15 Wu et al. suggested that CD11c−/−/apoE−/− mice exhibited diminished adhesion of monocytes, reduced macrophage content in atheroma plaques, and decreased AS, which demonstrated an important role of CD11c in AS development. 16 CD11c is also expressed by both dendritic cells (DCs) and macrophages. 17 A recent study found that CD11c+ DCs were involved in the formation of early atheroma plaques. 18 In addition, the expression of CD11c in macrophages can be regulated by interferon regulatory factor (IRF)-5, which promotes the maintenance of CD11c+ macrophages within atheroma plaques and is detrimental to AS. 19 According to our current analysis, ITGAX (CD11c) expression in atheroma plaque samples was significantly higher compared with that of control tissues. Therefore, our findings suggest that ITGAX is involved in the development of AS and its effect as a diagnostic marker of AS deserves further study.
The CCR1 gene encodes a member of the beta chemokine receptor family, and the ligands of this receptor include macrophage inflammatory protein 1 alpha (MIP-1 alpha), regulated on activation normal T expressed and secreted protein (RANTES), monocyte chemoattractant protein 3 (MCP-3), and myeloid progenitor inhibitory factor-1 (MPIF-1). Chemokines and their respective receptor-mediated signal transduction are critical for the recruitment of effector immune cells to the site of inflammation. RANTES, also called C–C chemokine ligand 5 (CCL5), are secreted from various inflammatory cells, and the interaction between RANTES and CCR1 triggers leukocyte migration into the vascular endothelium leading to AS development. 20 CCR1 is expressed on macrophages and T cells as a chemokine receptor for CCL3 and CCL5, 21 and both macrophages and T cells are major cell types involved in AS. 22 Recent research has suggested that activation of the CCL5-CCR5/CCR1 axis could recruit classical monocytes to atherosclerotic lesions. 23 A previous study has shown that CCR1 plays a key role in the adhesion and extravasation of neutrophils to large arteries. 24 Recent animal studies have suggested that the use of pharmacological antagonists of CCR1 reduce the risk of cardiovascular disease. 25 According to our current analysis, CCR1 expression in atheroma plaque samples was significantly higher compared with that of control tissues. Therefore, we found that CCR1 expression is associated with the occurrence and development of AS, making CCR1 a potential target diagnostic marker of AS.
IL1RN encodes a member of the interleukin-1 (IL-1) cytokine family and is related to cytokine signaling in the immune system and the IL-1 signaling pathway. 26 CXCL10 encodes a chemokine of the CXC subfamily and ligand for the receptor CXCR3. Binding of this protein to CXCR3 results in pleiotropic effects, including stimulation of monocytes, natural killer cell and T cell migration, and modulation of adhesion molecule expression. 27 CD163 encodes a member of the scavenger receptor cysteine-rich (SRCR) superfamily, and this protein may also function as an innate immune sensor for bacterial infection and can induce local inflammation. 28 GO annotations related to MMP9 include identical protein binding and metalloendopeptidase activity. 29 IL1RN, CXCL10, CD163, and MMP9 may therefore be associated with AS via the immune system. How these genes are involved in the progression of atheroma plaque formation and their effects as therapeutic targets need further study.
There are some inevitable limitations of this study. Because there are fewer available datasets associated with AS in open public databases, the sample size of our study was small. This may result in some deviations in the results. In addition, this study only examined AS vessels, not multi-tissues. Talukdar et al. analyzed genetic and gene expression data from seven tissues relevant to coronary artery disease, which could allow for better hub gene identification by genome-wide association studies. 30 Moreover, Erola et al. developed a Bayesian model-based multi-tissue clustering algorithm, revamp, which could make the multi-tissue clustering analysis more efficient. 31
In this study, bioinformatics analysis was used to screen 134 DEGs and ultimately identify six hub genes associated with AS: ITGAX, CCR1, IL1RN, CXCL10, CD163, and MMP9. These hub genes are potential promising diagnostic and therapeutic targets for AS. These hub genes were part of the most highly significant module of the PPI network of DEGs, which suggested they were important. However, genes that are highly connected or associated with three or more other genes are often more difficult to target with drugs, 32 so further research about the related pathways is necessary to find targets for treatment.
Footnotes
Declaration of Conflicting Interest
The authors declare that there is no conflict of interest.
Funding
The authors disclosed receipt of the following financial support for the research, authorship, and/or publication of this article: This work was supported by the Central Health Research Project (W2017BJ11).