
Abstract
Objectives:
The underlying molecular mechanisms of diabetic nephropathy have yet not been investigated clearly. In this investigation, we aimed to identify key genes involved in the pathogenesis and prognosis of diabetic nephropathy.
Methods:
We downloaded next-generation sequencing data set GSE142025 from Gene Expression Omnibus database having 28 diabetic nephropathy samples and nine normal control samples. The differentially expressed genes between diabetic nephropathy and normal control samples were analyzed. Biological function analysis of the differentially expressed genes was enriched by Gene Ontology and REACTOME pathways. Then, we established the protein–protein interaction network, modules, miRNA-differentially expressed gene regulatory network and transcription factor-differentially expressed gene regulatory network. Hub genes were validated by using receiver operating characteristic curve analysis.
Results:
A total of 549 differentially expressed genes were detected including 275 upregulated and 274 downregulated genes. The biological process analysis of functional enrichment showed that these differentially expressed genes were mainly enriched in cell activation, integral component of plasma membrane, lipid binding, and biological oxidations. Analyzing the protein–protein interaction network, miRNA-differentially expressed gene regulatory network and transcription factor-differentially expressed gene regulatory network, we screened hub genes MDFI, LCK, BTK, IRF4, PRKCB, EGR1, JUN, FOS, ALB, and NR4A1 by the Cytoscape software. The receiver operating characteristic curve analysis confirmed that hub genes were of diagnostic value.
Conclusions:
Taken above, using integrated bioinformatics analysis, we have identified key genes and pathways in diabetic nephropathy, which could improve our understanding of the cause and underlying molecular events, and these key genes and pathways might be therapeutic targets for diabetic nephropathy.
Keywords
Introduction
Diabetic nephropathy (DN) is a common and devastating microvascular complication of the kidneys induced by diabetes mellitus. 1 The incidence of DN is reported to be 30%–40% of patients with diabetes 2 and is the main cause of end-stage renal disease throughout the world in both developed and developing countries. 3 Numerous risk factors may affect DN progression 4 ; however, how these factors affect the development of DN requires further study and no effective method has been developed. Despite important developments toward an understanding of the pathophysiology of DN, early diagnosis, therapeutic interference, and underlying molecular pathogenesis are necessary. 5 Therefore, enlightening the rare nature belonging to DN is predominant in expanding therapies to improve patient outcomes.
DN remains end-stage renal disease worldwide because of its complicated molecular mechanisms and cellular heterogeneity, and its prevalence raises every year. 6 Therefore, recognition of DN might offer clinicians novel tools that can be used to treat the disease. Extensive genomic investigations showing the effects of genes have accepted noticeable attention. Many key genes must be identified to develop the clinical outcome for DN patients. However, the number of biomarkers that can be used to show therapeutic effects is still limited, and prognostic factors are essential for the treatment of DN patients. Therefore, it is necessary to elucidate the detailed molecular mechanisms that are independently associated with DN.
The exact mechanisms of DN are still unknown. A number of investigations have reported possible roles of some genes and pathways such as UCP1-3 7 and JAK/STAT3 signaling pathways 8 in the development of DN. However, these reports only concentrated on any certain molecule, gene, or pathway, ignoring that the development process involves aberrant expression of a variety of genes and pathways, among which some proteins might interact with other proteins and thus play an essential role in the DN. 9 Hub genes might act as prognostic or diagnostic biomarkers or treatment targets for DN.10–12 Therefore, it is urgent to search new biomarkers for DN with powerful genome-wide technology.
High-throughput platform next-generation sequencing (NGS) data are increasingly valued for the analysis of gene expression in DN. 13 A high-quality NGS data could potentially link molecular biomarkers to the development, diagnosis, and treatment of DN.
In the present investigation, the NGS data set (GSE142025) 14 was selected from the Gene Expression Omnibus database (GEO) (http://www.ncbi.nlm.nih.gov/geo) 15 and to identify the genes correlated to DN progression and prognosis. Using the online tool limma, differentially expressed genes (DEGs) between DN and normal control were obtained. Gene Ontology (GO) annotation and REACTOME pathway enrichment analyses were conducted to further provide an overview of the function of the screened DEGs. A protein–protein interaction (PPI) network, module, miRNA-DEG regulatory network, and transcription factor (TF)-DEG regulatory network were constructed to determine the hub genes, miRNA, and TF associated with DN. Receiver operating characteristic (ROC) curve analysis of the hub genes was carried out using pROC. The aim of this investigation was to identify key genes and pathways and to explore potential candidate biomarkers for the diagnosis and therapeutic targets in DN.
Materials and methods
Data source
The DN NGS data set GSE142025 14 was downloaded from the NCBI GEO database. The data set GSE142025 was based on the GPL20301 platform (Illumina HiSeq 4000 (Homo sapiens)), including 28 DN samples and nine normal control samples. NGS data GSE142025 have generated massive genomic data, which facilitated understanding the molecular mechanisms involved in the DN.
Identification of DEGs
Identifying a gene that is differentially expressed across experimental conditions was used to identify DEGs in the GSE142025 data set with the limma package of R language. Adjusted p-value was retrieved by implementing the Benjamini–Hochberg false discovery rate (FDR) correction on the original p-value, and a fold change threshold was preferred based on our plan to target statistically significant DEGs. 16 Only genes with a fold change > 1.35 for upregulated genes and fold change < –1.24 for downregulated genes, and adjusted p-value < 0.05 were considered statistically significant DEGs. A volcano plot and heat map of the identified DEGs were also constructed, using an R package.
GO and pathway enrichment analysis of DEGs
In the current investigation, the significant enrichment analysis of DEGs was assessed based on the GO and REACTOME using the ToppGene (ToppFun) (https://toppgene.cchmc.org/enrichment.jsp), 17 an online tool for functional annotation analysis. GO analysis (http://geneontology.org/) 18 is an accepted, effective method for annotating genes and gene products and for identifying unique biological aspects of high-throughput genome or transcriptome data, including three categories: biological process (BP), cellular component (CC), and molecular function (MF). REACTOME database (https://reactome.org/) 19 is a well-known pathway database for precise analysis of gene functions in biological signaling pathways, which links genomic information with higher-order functional information. To analyze the function of the identified DEGs, biologic analyses were performed using GO enrichment and REACTOME enrichment pathway analysis via ToppGene online database. p < 0 .05 as the cutoff criterion considered statistically significant.
Construction of PPI network
The online database InnateDB interactome (https://www.innatedb.com/) 20 was used to construct the PPI network and module analysis. Cytoscape (version 3.8.1) (www.cytoscape.org/) 21 was used to visualize the PPI network of DEGs. Next, the Network Analyzer plug-in for Cytoscape was applied to calculate node degree, 22 betweenness centrality, 23 stress centrality, 24 and closeness centrality. 25 The plug-in PEWCC1 26 of Cytoscape was applied to detect densely connected regions in PPI networks. The PPI networks were constructed using Cytoscape, and the most significant module in the PPI networks was selected using PEWCC1.
Integrated regulatory network construction
The integrated regulatory network of miRNAs (microRNAs) and TFs was constructed based on the standardized integration of numerous high-throughput data sets. It granted a plan including a set of hub genes, miRNAs, and TFs for analyzing multilevel regulation in DN. The miRNAs associated with DEGs were selected from miRNet (https://www.mirnet.ca/) 27 Database (The integration database of TarBase, miRTarBase, miRecords, miRanda (S mansoni only), miR2Disease, HMDD, PhenomiR, SM2miR, PharmacomiR, EpimiR, starBase, TransmiR, ADmiRE, and TAM 2.0), and TFs associated with DEGs were selected from NetworkAnalyst database (https://www.networkanalyst.ca/) 28 Database (The integration database of JASPAR). The miRNA-DEG regulatory network and TF-DEG regulatory network were constructed by using Cytoscape software, 21 which is open-source software for visualizing complex networks.
ROC curve analysis of the hub genes
The diagnostic value of validated hub genes was assessed using ROC curve analysis using the pROC in R with GLM prediction model. 29 An area under the curve (AUC) value was determined and used to nominate the ROC effect.
Results
Identification of DEGs
DN and normal control samples (28 and 9, respectively) were first analyzed. Limma was used to identify the DEGs. Following analysis of the NGS data set GSE142025, 549 DEGs (275 upregulated and 274 downregulated) genes were identified and are listed in Table 1. The volcano plot and heat map are shown in Figures 1 and 2, respectively.
The statistical metrics for key differentially expressed genes (DEGs).


Volcano plot of differentially expressed genes.
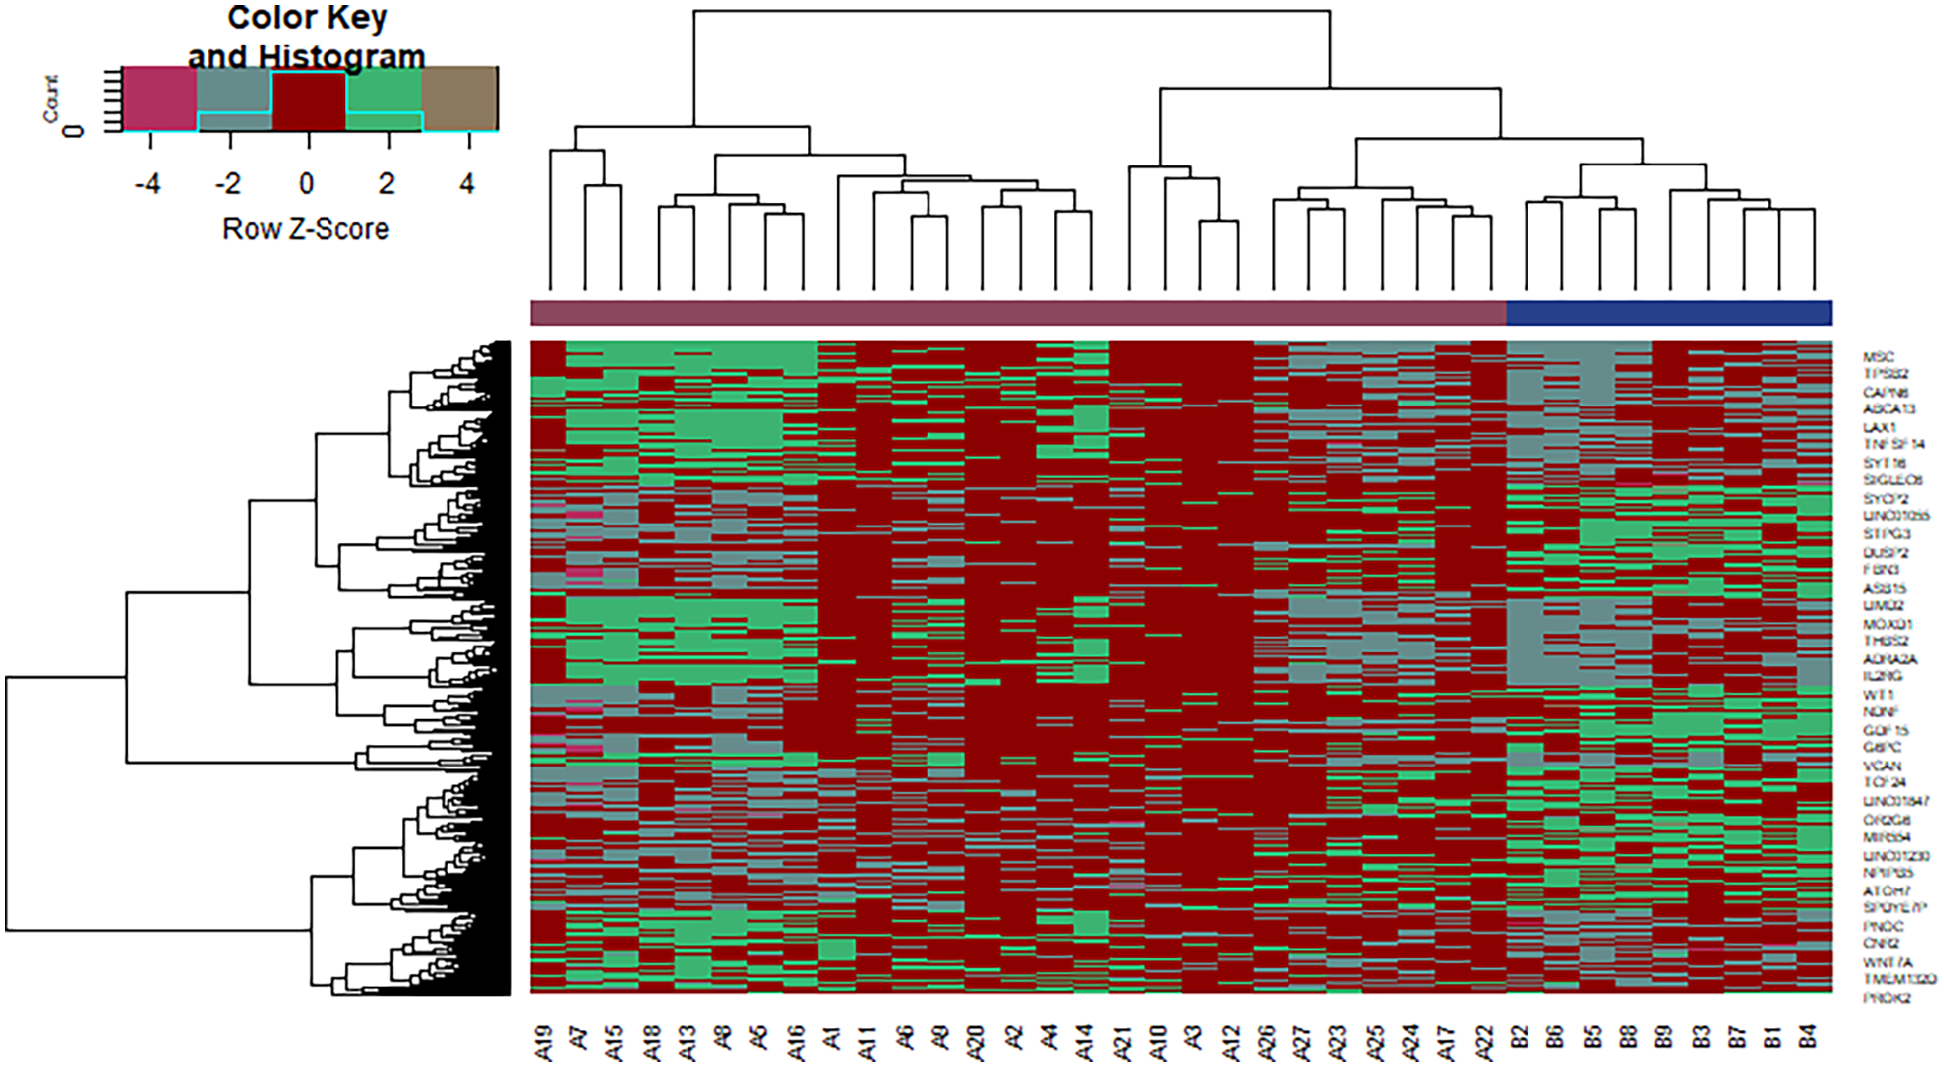
Heat map of differentially expressed genes.
Gene ontology and pathway enrichment analysis of DEGs
The identified DEGs were uploaded to the online software ToppGene for GO and REACTOME pathway enrichment analyses and results are listed in Tables 2 and 3. The results of the GO analysis revealed that upregulated genes were significantly enriched in BP, including cell activation and regulation of the immune system process, whereas downregulated genes were significantly enriched in response to hormone and ion transport. In terms of CC, the upregulated genes were enriched in the cell surface and intrinsic component of the plasma membrane, whereas downregulated genes were enriched in the integral component of plasma membrane and nuclear chromatin. In terms of MF, the upregulated genes were enriched in signaling receptor binding and identical protein binding, whereas downregulated genes were enriched in lipid binding and transporter activity. REACTOME pathway analysis revealed that the upregulated genes were highly associated with pathways including immunoregulatory interactions between lymphoid and nonlymphoid cells and the innate immune system, whereas downregulated genes were significantly enriched in biological oxidations and GPCR ligand binding.
The enriched GO terms of the up- and down-regulated differentially expressed genes.

BP: Biological Process; CC: Cellular Component; MF: Molecular Functions.
The enriched pathway terms of the up- and down-regulated differentially expressed genes.

Construction of PPI network
The DEG expression profiles in DN were constructed according to the information in the InnateDB interactome database. The PPI network of DEGs consisted of 2718 nodes and 4477 edges (Figure 3). There are 10 genes selected as hub genes, such as MDFI, LCK, Bruton tyrosine kinase (BTK), IRF4, PRKCB, EGR1, JUN, FOS, ALB, and NR4A1 are listed in Table 4. Two significant modules were obtained from the PPI network of DEGs using PEWCC1, including 15 nodes and 36 edges (Figure 4(a)) and 7 nodes and 12 edges (Figure 4(b)). GO and pathway enrichment analysis revealed that genes in these modules were mainly involved in the innate immune system, immunoregulatory interactions between lymphoid and nonlymphoid cells, cell activation, regulation of immune system process, cell surface, response to the hormone, cytokine signaling in the immune system, metabolism of proteins, and nuclear chromatin.
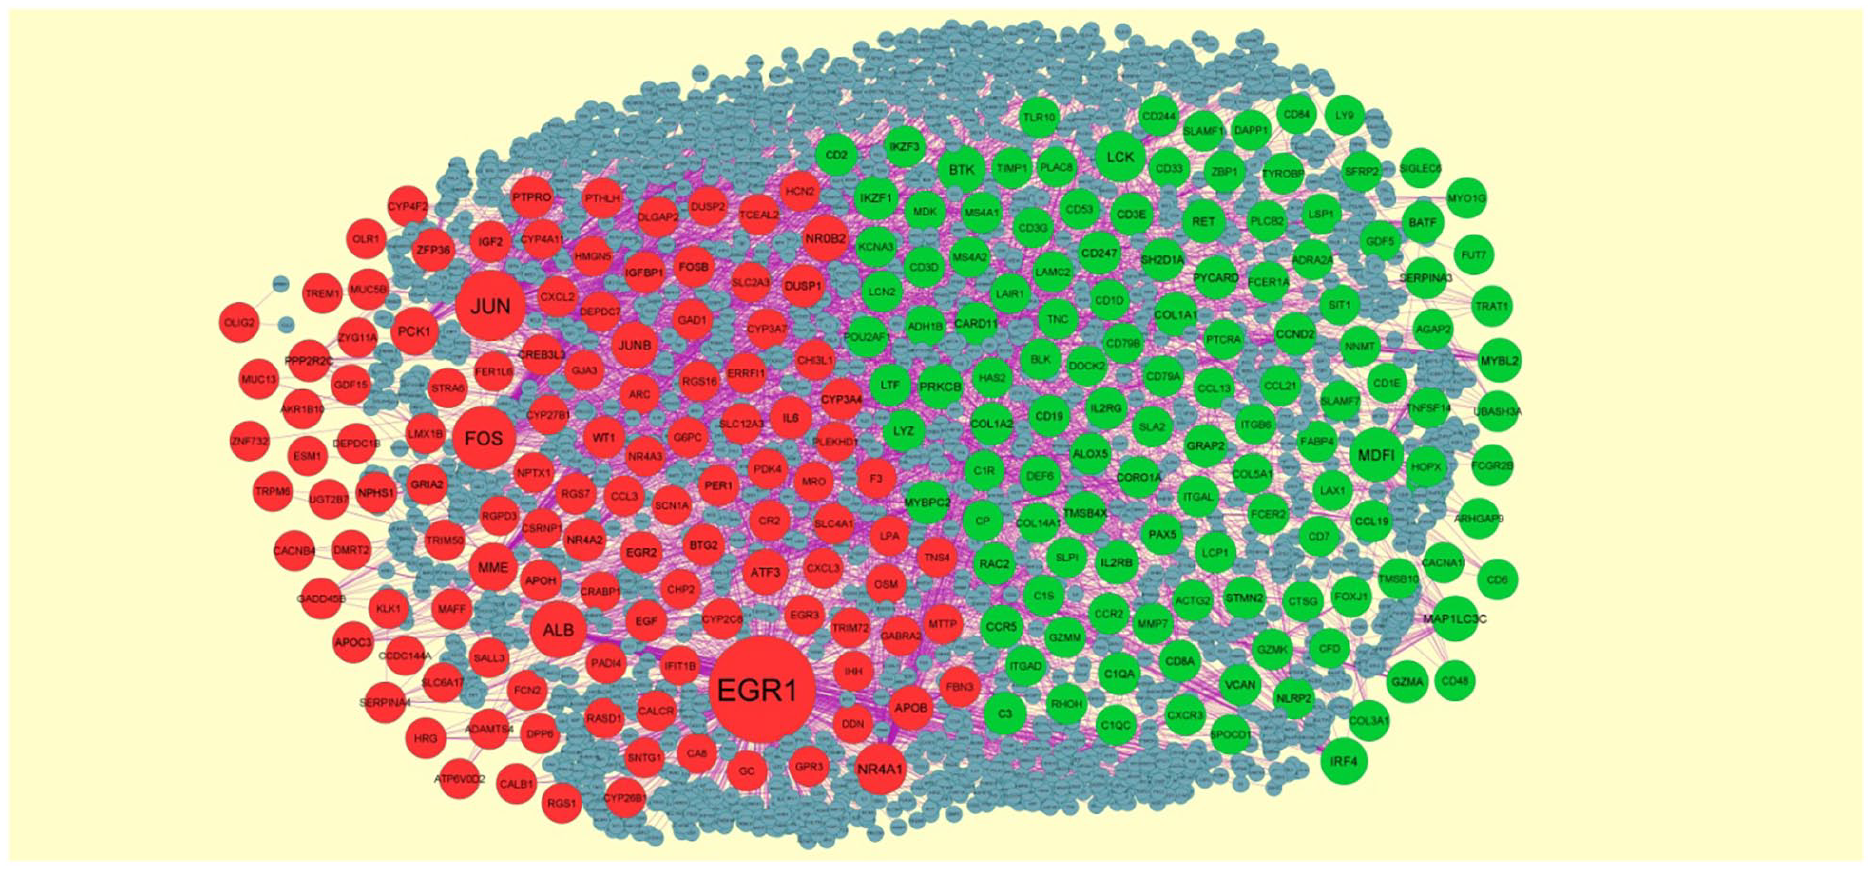
PPI network of DEGs. The PPI network of DEGs was constructed using Cytoscape. Upregulated genes are marked in green; down-regulated genes are marked in red.
Topology table for up- and down-regulated genes.


Significant modules of DEGs: (a) The most significant module was obtained from PPI network with 15 nodes and 36 edges for upregulated genes. (b) The most significant module was obtained from PPI network with seven nodes and 12 edges for upregulated genes. Upregulated genes are marked in green; down-regulated genes are marked in red.
Integrated regulatory network construction
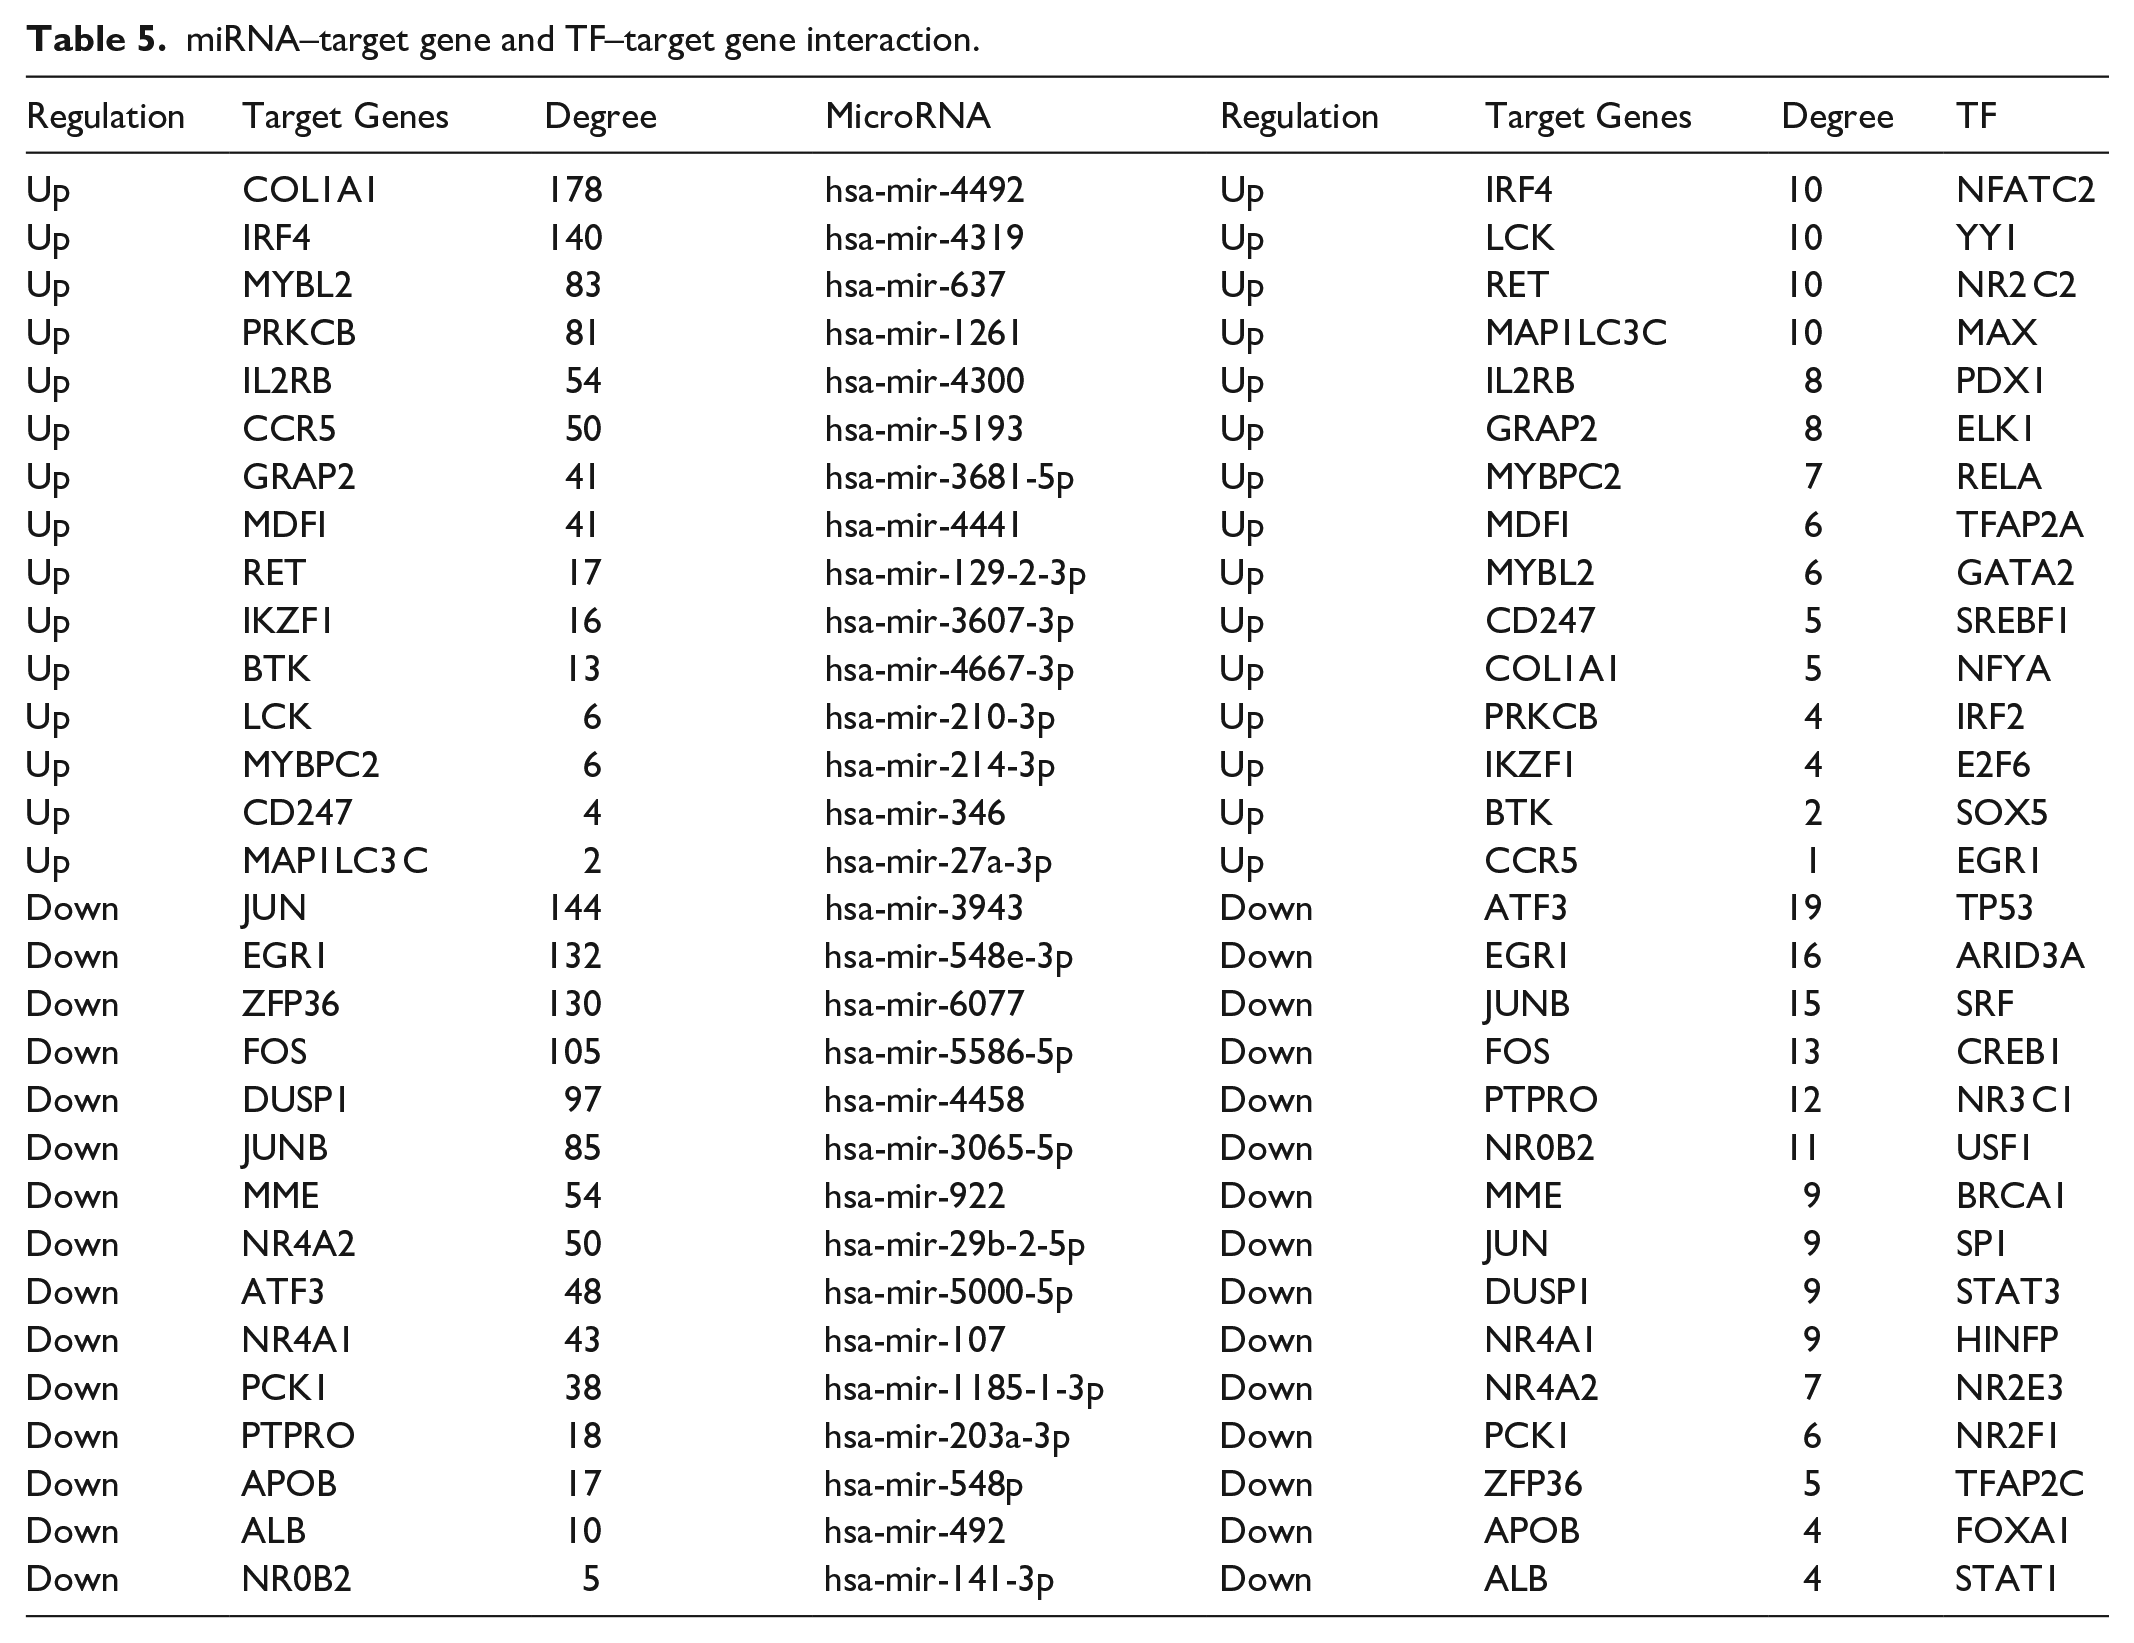
The miRNA-DEG regulatory network had 8997 interactions (involving 1973 miRNAs and 248 DEGs) (Figure 5). Moreover, COL1A1 was targeted by 178 miRNAs (ex, hsa-mir-4492), IRF4 was targeted by 140 miRNAs (e.g. hsa-mir-4319), MYBL2 was targeted by 83 miRNAs (e.g. hsa-mir-637), PRKCB was targeted by 81 miRNAs (e.g. hsa-mir-1261), IL2RB was targeted by 54 miRNAs (e.g. hsa-mir-4300), JUN was targeted by 144 miRNAs (e.g. hsa-mir-3943), EGR1 was targeted by 132 miRNAs (e.g. hsa-mir-548e-3p), ZFP36 was targeted by 130 miRNAs (e.g. hsa-mir-6077), FOS was targeted by 105 miRNAs (e.g. hsa-mir-5586-5p), and DUSP1 was targeted by 97 miRNAs (e.g. hsa-mir-4458), which are listed in Table 5. The TF-DEG regulatory network had 1954 interactions (involving 81 TFs and 250 DEGs) (Figure 6). Moreover, IRF4 was targeted by 10 TFs (e.g. NFATC2), LCK was targeted by 10 TFs (e.g. YY1), RET was targeted by 10 TFs (e.g. NR2 C2), MAP1LC3C was targeted by 10 TFs (e.g. MAX), IL2RB was targeted by 8 TFs (e.g. PDX1), ATF3 was targeted by 19 TFs (e.g. TP53), EGR1 was targeted by 16 TFs (e.g. ARID3A), JUNB was targeted by 15 TFs (e.g. SRF), FOS was targeted by 13 TFs (e.g. CREB1), and PTPRO was targeted by 13 TFs (e.g. NR3C1), which are listed in Table 5.

Target gene–miRNA regulatory network between target genes and miRNAs.
miRNA–target gene and TF–target gene interaction.

Target gene–TF regulatory network between target genes and TFs.
ROC curve analysis of the hub genes
Ten hub genes are prominently expressed in DN; we performed a ROC curve analysis to evaluate their sensitivity and specificity for the diagnosis of DN. As shown in Figure 7, MDFI, LCK, BTK, IRF4, PRKCB, EGR1, JUN, FOS, ALB, and NR4A1 achieved an AUC value of > 0.8, demonstrating that these hub genes have high sensitivity and specificity for DN diagnosis. The results suggested that MDFI, LCK, BTK, IRF4, PRKCB, EGR1, JUN, FOS, ALB, and NR4A1 can be used as biomarkers for the diagnosis of DN.

ROC curve validated the sensitivity, specificity of hub genes as a predictive biomarker for DN prognosis: (a) MDFI, (b) LCK, (c) BTK, (d) IRF4, (e) PRKCB, (f) EGR1, (g) JUN, (h) FOS, (i) ALB, and (j) NR4A1.
Discussion
DN affects millions of people all over the world. 30 DN occurs in uncontrolled diabetes, which is a worldwide complaint. The aim of this investigation was to screen and verify hub genes involved in DN as well as to explore potential molecular mechanisms.
In the present study, NGS data from GSE142025 were extracted to identify the DEGs between DN and normal control. In this investigation, we identified 549 DEGs, which includes 275 upregulated and 274 down-regulated genes. CFHR1 31 and RGS1 32 have been reported to altered expression in nephropathy. Studies have shown that GREM1 is linked with the progression of DN. 33 Existing evidence has reported that CCL19 34 is responsible for renal inflammation and fibrosis in DN. COL6A5 35 is associated with neuropathic chronic itch. Reports indicate that cell death-inducing DFFA-like effector c (CIDEC) 36 was found in the progression of obesity. NR4A1 drives DN growth through mitochondrial fission and mitophagy. 37 Recent study has reported that expression of NR4A2 is associated with myocardial infarction. 38 EGR1 is required for fibrosis and inflammatory response in DN. 39 ATF3 expression has been implicated in DN. 40 Altered expression of NR4A3 contributes to type 2 diabetes mellitus progression. 41 A previous study showed that the KLK1 gene is involved in DN. 42
A series of DEGs was discovered to be enriched in the GO functions and pathways. Previous investigations have shown a signaling pathway that includes the innate immune system, 43 extracellular matrix organization, 44 hemostasis, 45 cytokine signaling in the immune system, 46 and metabolism of proteins, 47 which were associated with DN development. Previous studies had reported that expression of SERPINA3, 48 IKZF1, 49 BTK, 50 C1QA, 51 CD1C, 52 and CCL13 53 was correlated with lupus nephritis. Recent studies have demonstrated that the expression of TNFSF14, 54 ITGAL (integrin subunit alpha L), 55 PLAC8, 56 ADRA2A, 57 CCL21, 58 ALOX5, 59 CNR2, 60 COL1A1, 61 WNT7A, 62 SLAMF1, 63 CD3D, 64 lactotransferrin (LTF), 65 MIR27B, 66 PDK4, 67 UCN3, 68 PCK1, 69 carboxyl ester lipase (CEL), 70 TRPM6, 71 microsomal triglyceride transfer protein (MTTP), 72 CYP2 C8, 73 and CYP3A4 74 is associated with progression of type 2 diabetes mellitus. Recent studies have proposed that the altered expression of MZB1, 75 LAIR1, 76 MIR142, 77 and fibroblast activation protein alpha (FAP) 78 has been shown to be a meaningful advance factor for myocardial infarction. IRF4 plays a key role in obesity-induced insulin resistance. 79 Accumulating evidence showed that altered expression of genes such as midkine (MDK), 80 CCR2, 81 SAA1, 82 C3, 83 CD19, 84 CCR5, 85 CXCR3, 86 FABP4, 87 GDF15, 88 IGF2, 89 IGFBP1, 90 and IL6 91 is important in the progression of DN. A previous study has shown that UBASH3A, 92 signal regulatory protein gamma (SIRPG), 93 IKZF3, 94 CD1D, 95 CD2, 96 CD48, 97 CD247, 98 and CYP27B1 99 are liable for progression of type 1 diabetes mellitus. The studies have shown that expression of SIT1, 100 junction adhesion molecule like (JAML), 101 TIMP1, 102 protein kinase C beta (PRKCB), 103 MMP7, 104 WNT7B, 105 WNT10A, 106 DUSP1, 107 WT1, 108 APOC3, 109 ERRFI1, 110 HCN2, 111 membrane metalloendopeptidase (MME), 112 STRA6, 113 SLC12A3, 114 and GC vitamin D-binding protein (GC) 115 expedites the epithelial-to-mesenchymal transition and renal fibrosis in DN. Previous studies have found complement factor D (CFD), 116 DOCK2, 117 lysozyme (LYZ), 118 CD5L, 119 SCARA5, 120 versican (VCAN), 121 GDF5, 122 SFRP2, 123 BTG2, 124 ZFP36, 125 GPR3, 126 OLR1, 127 PM20D1, 128 and UGT2B7 129 to be expressed in obesity. A study has confirmed that altered expression of FCRL3, 130 FCGR2B, 131 cartilage oligomeric matrix protein (COMP), 132 erythroferrone (ERFE), 133 and NPHS1 134 is involved in the progression of nephropathy. The expression of COL1A2, 135 LCK (LCK proto-oncogene, Src family tyrosine kinase), 136 LCN2, 137 and apolipoprotein B (APOB) 138 is key for the progression of diabetic retinopathy. Researchers showed that altered expression of COL3A1, 139 PER1, 140 JUN (Jun proto-oncogene, AP-1 transcription factor subunit), 141 SLC26A4, 142 F2RL3, 143 CYP4A11, 144 and CYP4F2 145 plays an important role in hypertension. Collectively, the results of enriched GO and REACTOME pathway enrichment analysis were positively correlated with experimental findings. However, further investigations are needed to explore and confirm the potentially significant pathways for DN and to achieve a comprehensive understanding of this process.
Based on the PPI network and module analysis, we obtained top hub genes in the whole network. Albumin (ALB) 146 has been shown as a promising biomarker in DN. In our study, correlations of MyoD family inhibitor (MDFI) and FOS (Fos proto-oncogene, AP-1 transcription factor subunit) with patient prognosis highlight the importance of these genes as novel biomarkers to stratify DN patients as well as potential therapeutic targets, but concrete roles of these genes need further investigation.
Based on the miRNA-DEG regulatory network and TF-DEG regulatory network, we obtained targets in the whole network. Recent recent investigation reported that the altered expression of MYBL2 was associated with myocardial infarction progression, 147 but this gene might be a novel target for DN. Many investigations have reported that expressions of hsa-mir-637 148 and NR3 C1 149 were linked with the progression of hypertension, but these genes might be a novel target for DN. Hsa-mir-1261 150 has been shown to have an important role in DN. Hsa-mir-4458 151 has been found to be differentially expressed in myocardial infarction, but this gene might be a novel target for DN. Recent studies have reported that expressions of NFATC2, 152 PDX1, 153 and CREB1 154 were involved in the progression of type 2 diabetes, but these genes might be a novel target for DN. Previous studies have demonstrated that expressions of YY1, 155 TP53 156 and serum-response factor (SRF) 157 played a key role in the progression of DN. IL2RB, hsa-mir-4492, hsa-mir-4319, hsa-mir-4300, hsa-mir-3943, hsa-mir-548e-3p, hsa-mir-6077, hsa-mir-5586-5p, RET (ret proto-oncogene), MAP1LC3C, PTPRO (protein tyrosine phosphatase receptor type O), NR2C2, myc-associated factor X (MAX), and ARID3A might be novel diagnostic biomarkers associated with the progression of DN, which remains to be verified based on a larger sample.
Besides, this investigation is purely a bioinformatics analysis without any in vivo and in vitro data. There are some limitations in our investigation. The lack of molecular and cellular evidence in wet-lab experiments imposes restrictions on the conclusions that can be drawn from our results.
Conclusion
In sum, based on a series of bioinformatics methods and a retrospective analysis, our identified 10 hub genes (MDFI, LCK, BTK, IRF4, PRKCB, EGR1, JUN, FOS, ALB, and NR4A1), which showed an intimate correlation with DN advancement and prognosis and had the potential acting as therapeutic targets and prognostic indicators. Further experiments are required to confirm the expression and potential functions of the identified key genes in DN.
Footnotes
Acknowledgements
The authors thank Weijia Zhang, Icahn School of Medicine at Mount Sinai, Renal, New York, USA, very much, the author who deposited their expression profiling by high-throughput sequencing data set, GSE142025, into the public GEO database. They also thank the preprint research square for providing information online; it is their pleasure to acknowledge their contributions.
Author contributions
H.J. contributed to Methodology and validation. B.V. contributed to Writing original draft, and review and editing. N.J. contributed to Software and resources. C.V. contributed to Investigation and resources.
Availability of data and materials
The data sets supporting the conclusions of this article are available in the GEO (Gene Expression Omnibus) (https://www.ncbi.nlm.nih.gov/geo/) repository. ((GSE142025) (![]() )
)
Declaration of conflicting interests
The author(s) declared no potential conflicts of interest with respect to the research, authorship, and/or publication of this article.
Ethical approval
This article does not contain any studies with human participants or animals performed by any of the authors.
Funding
The author(s) received no financial support for the research, authorship, and/or publication of this article.
Informed consent
No informed consent because this study does not contain human or animals participants.