
Abstract
Objective
This study aimed to explore the potential molecular mechanism of allergic rhinitis (AR) and identify gene signatures by analyzing microarray data using bioinformatics methods.
Methods
The dataset GSE19187 was used to screen differentially expressed genes (DEGs) between samples from patients with AR and healthy controls. Gene ontology (GO) and Kyoto Encyclopedia of Genes and Genomes (KEGG) pathway analyses were applied for the DEGs. Subsequently, a protein–protein interaction (PPI) network was constructed to identify hub genes. GSE44037 and GSE43523 datasets were screened to validate critical genes.
Results
A total of 156 DEGs were identified. GO analysis verified that the DEGs were enriched in antigen processing and presentation, the immune response, and antigen binding. KEGG analysis demonstrated that the DEGs were enriched in Staphylococcus aureus infection, rheumatoid arthritis, and allograft rejection. PPI network and module analysis predicted seven hub genes, of which six (CD44, HLA-DPA1, HLA-DRB1, HLA-DRB5, MUC5B, and CD274) were identified in the validation dataset.
Conclusions
Our findings suggest that hub genes play important roles in the development of AR.
Keywords
Introduction
Allergic rhinitis (AR), also known as hay fever, is an inflammatory disorder of the nasal mucosa, which is induced by an immunoglobulin E (IgE)-mediated reaction in allergen-sensitized subjects. 1 Four hundred million people suffer from AR worldwide, and the incidence has been increasing over recent decades because of rises in industrialization and air pollution. 2 AR is characterized by sneezing, rhinorrhea, nasal congestion, and nasal pruritus, which are often accompanied by ocular pruritus, redness, and lacrimation in 60% to 70% of patients. 3 Although not life-threatening, the symptoms of AR are frequently bothersome, and adversely affect work and the quality of life, especially in children and adolescents. 4 Moreover, AR is commonly associated with other conditions such as asthma, anosmia, and otitis media, suggesting that these conditions are closely related. 5 Indeed, studies have suggested that 20% to 50% of patients with AR have clinical asthma, whereas more than 80% of patients with allergic asthma have concomitant rhinitis symptoms. 6 Although numerous efforts have been made to understand the mechanisms underlying AR, available treatments are only partially successful in certain subtypes of patients. 7 Thus, there is an urgent need to identify the key molecules involved in AR pathology, to help provide an accurate diagnosis as well as timely treatment. 8
Evidence such as population heterogeneity, and interactions between multiple genes as well as environmental and genetic factors clearly supports AR being influenced by a complex immune procedure.9–11 The world’s largest study on AR comparing around 60,000 patients with over 150,000 healthy controls of primarily European ancestry identified 41 loci in the human genome which significantly increased the risk of AR when altered. 12 Additionally, polymorphisms of candidate genes have been associated with the development of AR,13–15 while several genes related to immunity and transcriptional regulation, such as FOS, JUN, and CEBPD, play crucial roles in seasonal allergic rhinitis (SAR) through interacting with each other. 16 Moreover, a comparison of seven SAR samples and five non-allergic samples found that CDC42EP5, SLC39A11, and PRDM10 genes associate with the pathogenesis of AR. 17 However, the prevalence and factors responsible for AR etiology are still not fully understood, especially in China.
In the present study, we downloaded the original microarray data GSE19187 from the Gene Expression Omnibus (GEO) database. Subsequently, we compared gene expression profiles of nasal airway epithelium cells from patients with AR and healthy controls to identify differentially expressed genes (DEGs). These underwent gene ontology (GO) and Kyoto Encyclopedia of Genes and Genomes (KEGG) pathway enrichment analyses, followed by the construction of a protein–protein interaction (PPI) network to identify hub genes. Gene expression profiles GSE44037 and GSE43523 were combined to validate the critical genes, which could be used as molecular biomarkers or diagnostic targets for AR therapy. Collectively, our study will help the development of a genetic diagnosis for AR and more effective measures of prevention and intervention.
Materials and methods
Data source
Gene expression profiles were downloaded from the GEO database (http://www.ncbi.nlm.nih.gov/geo). GSE19187 includes 14 cases of isolated AR without asthma and 11 healthy control samples. The expression profiling of nasal epithelial cells collected by brushing had been performed on the GPL6244 platform (Affymetrix Human Genome 1.0 ST Array); 18 GSE44037 includes five cases of AR and six healthy control samples, based on the GPL13158 platform (Affymetrix HT HG-U133+ PM Array); 19 and GSE43523 includes seven cases of SAR and five healthy control samples, based on the GPL6883 platform (Illumina HumanRef-8 v3.0 expression beadchip). Datasets GSE44037 and GSE43523 were merged as validation data to validate the critical genes. The expression levels of CD44, HLA-DPA1, HLA-DRB1, HLA-DRB5, MUC5B, and CD274 were compared between AR and healthy control samples using the Wilcoxon test. The subject characteristics of the dataset are listed in Supplementary Table 1 and the genes detected by microarray data are listed in Supplementary Table 2. All data are freely available online, and this study did not involve any experiments on humans or animals performed by any of the authors. Ethical approval was not required because this study used publicly available datasets.
Identification of DEGs
Linear Models for Microarray Data, an R package from Bioconductor (http://www.bioconductor.org), was used to identify DEGs between samples from patients with AR and healthy controls. If multiple probes corresponded to the same gene, we used the mean value as the expression of this gene. We defined DEGs as a fold change (FC) >1.5 or <−1.5.18,19 An adjusted P value < 0.05 was considered statistically significant. DEGs were clustered using the hierarchical clustering method to show two groups by the heatmap.2 function from the gplots R package (https://www.rdocumentation.org/packages/gplots/). The Euclidean distance was chosen as a measure of distance between the samples. A volcano plot for the distribution of genes from patients with AR and healthy controls was made by plotting the negative log10-transformed p values against the log ratios (log2 fold change) in the two groups.
GO and KEGG pathway enrichment analyses of DEGs
GO annotation and KEGG pathway enrichment analyses were performed for DEGs using The Database for Annotation, Visualization and Integrated Discovery (DAVID; https:/david.ncifcrf.gov/), which provides systematic and comprehensive annotation tools to analyze high-throughput gene function. A P value <0.05 was considered statistically significant.
PPI network construction and module analysis
The Search Tool for the Retrieval of Interacting Genes database (STRING; version 10.5; http://www.string-db.org/) was used to assess and integrate PPI with a combined score >0.4 as the cutoff criterion. The PPI network of DEGs was visualized by Cytoscape (version 3.5.0) and the plug-in Molecular Complex Detection (MCODE) was used to screen functional modules to identify hub genes. A P value <0.05 was considered statistically significant.
Statistical analysis
Statistical analysis was performed using SPSS version 16.0 (SPSS Inc., Chicago, IL, USA) and R software version 3.2.5 (MathSoft, USA). The DEGs between the groups of AR and healthy controls were determined using a two-tailed Student's t-test. The Wilcoxon test was used to compare the expression level of critical genes between the groups of AR and healthy controls in the validation datasets. P values < 0.05 were considered statistically significant.
Results
Identification of DEGs
Gene expression profiles from GSE19187 identified 156 DEGs, of which 94 were up-regulated and 62 were down-regulated in patients with AR relative to healthy controls (Figure 1). Detailed DEG information is shown in Supplementary Table 3. Hierarchical clustering analysis revealed a clear distinction of DEGs between patients with AR and healthy controls (Figure 2).

Volcano plot for the distribution of gene expression between patients with AR and healthy controls from the GSE19187 dataset. Negative log10-transformed P values are plotted against log ratios (log2 fold change) in the two groups. Red and blue points represent down-regulated and up-regulated genes in patients with AR compared with healthy controls, respectively. Gray points represent non-differentially expressed genes. Critical genes are labeled.
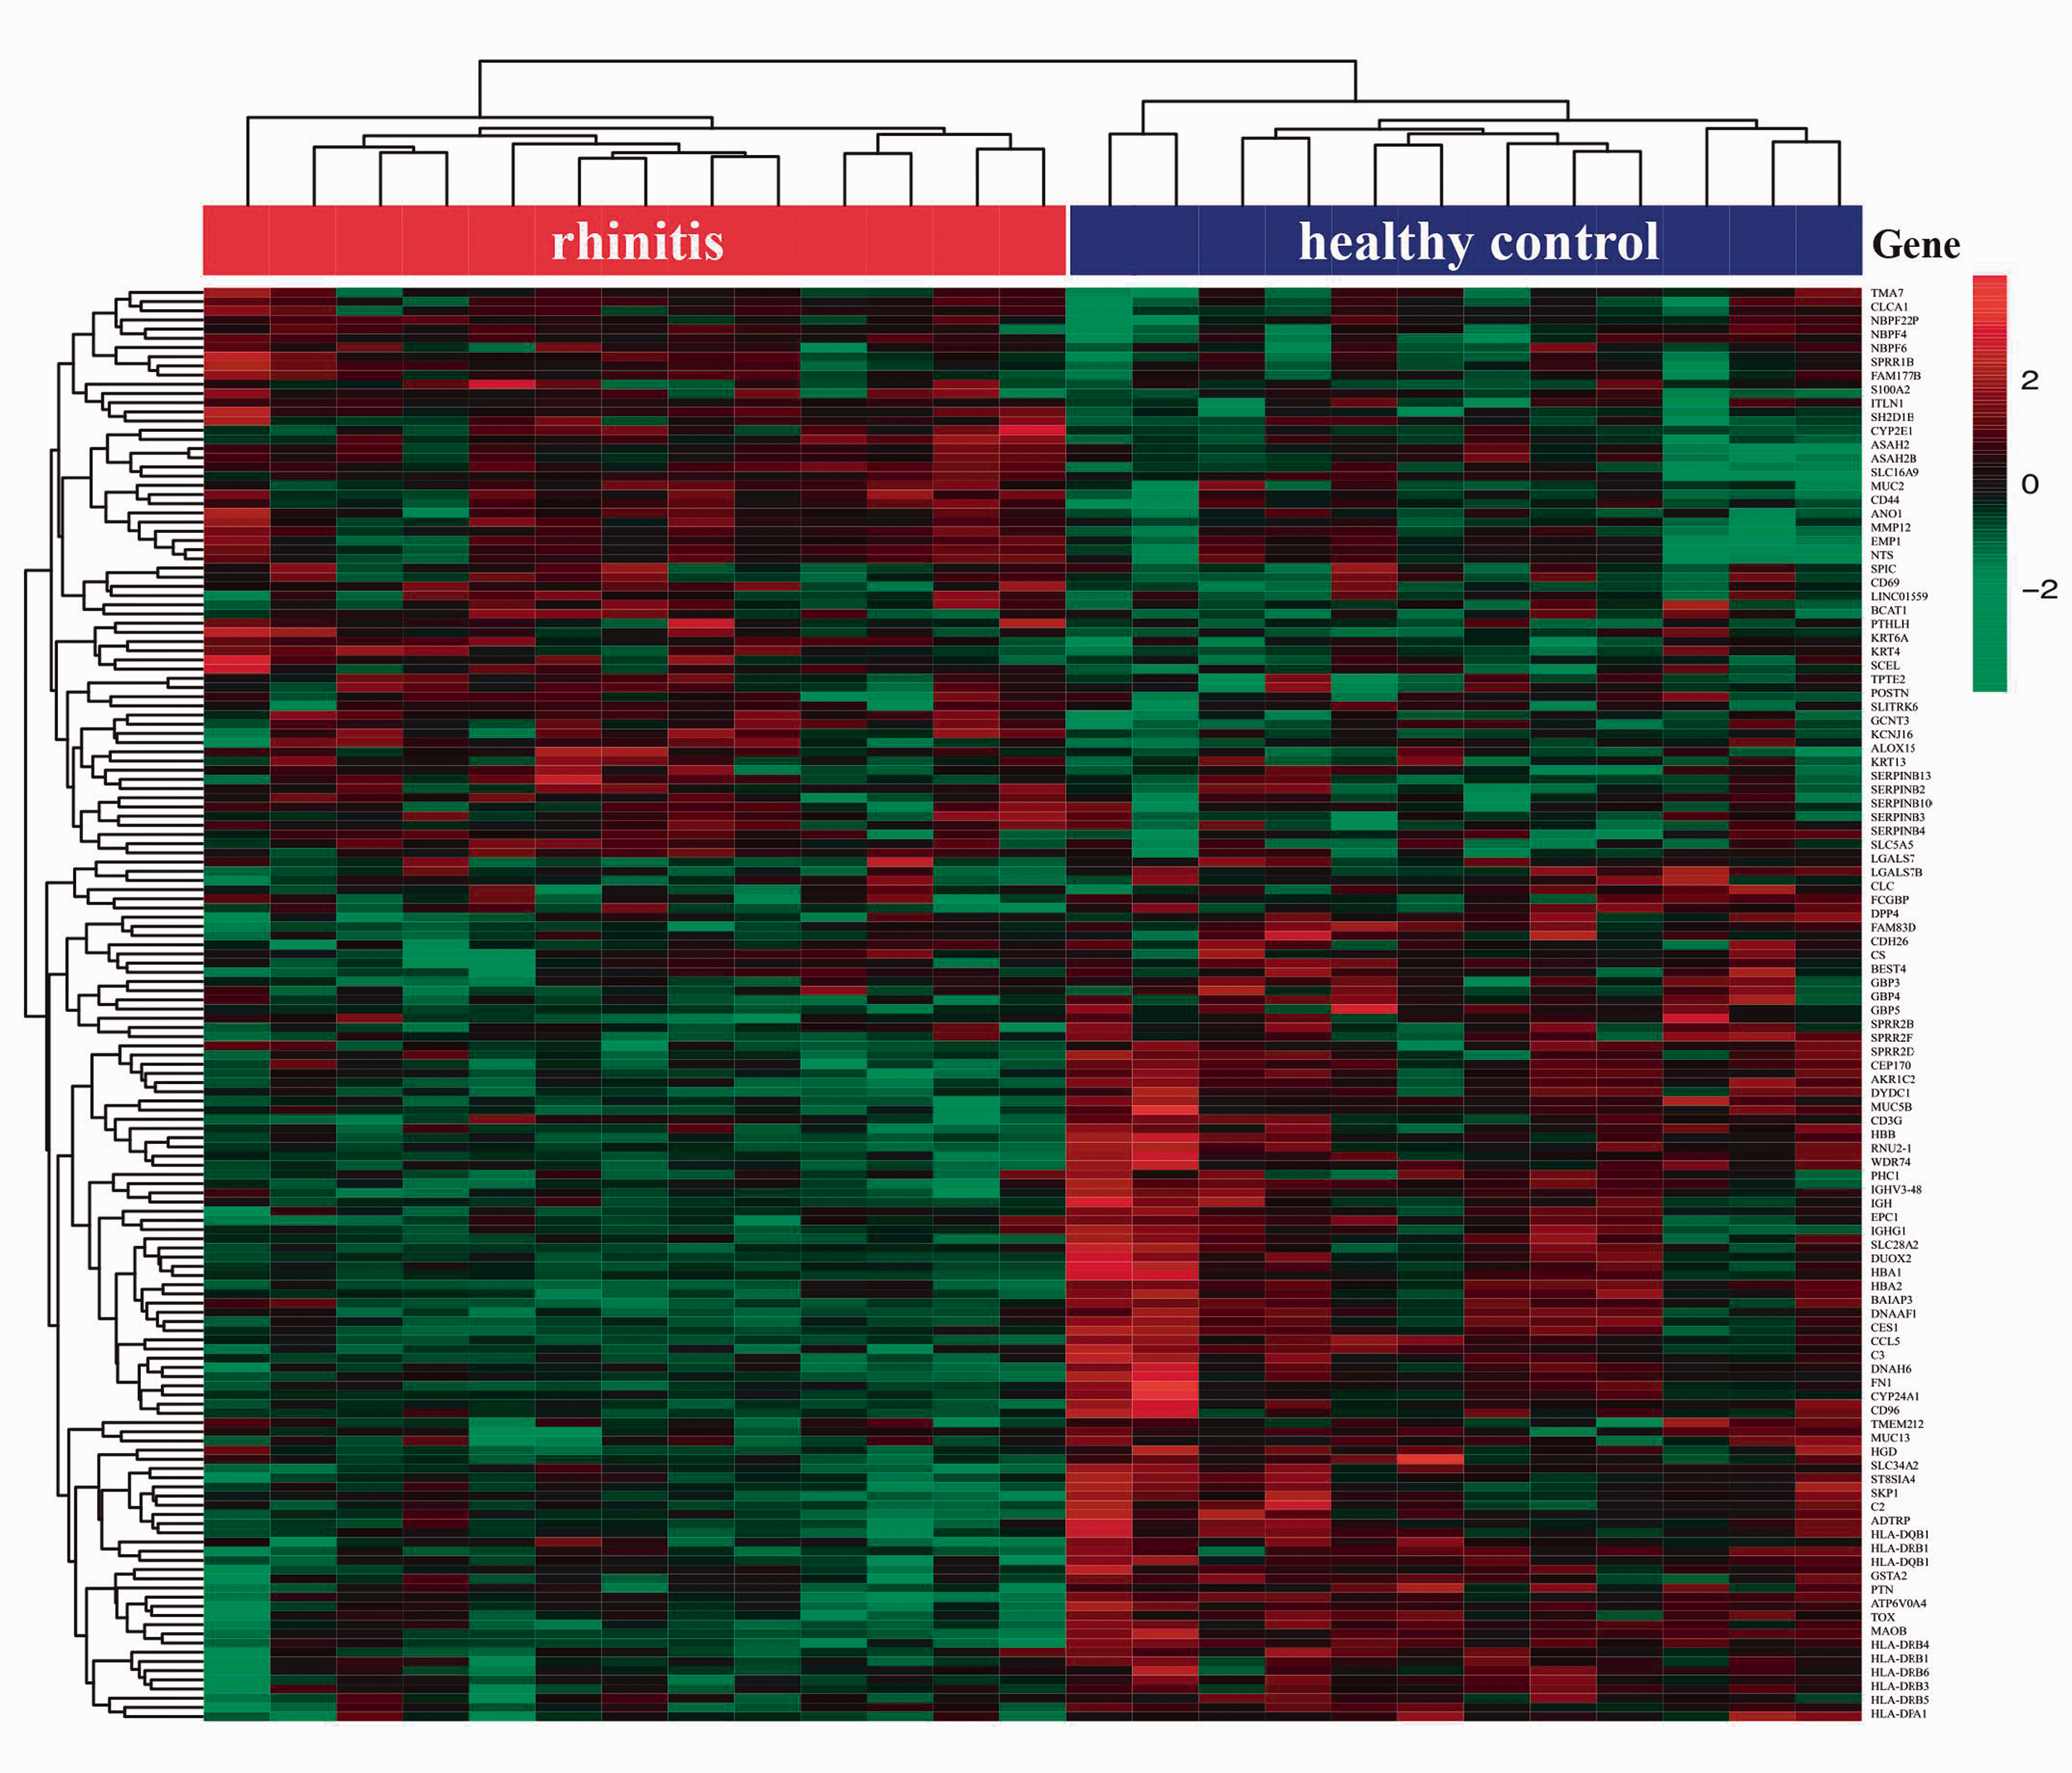
Heatmap of DEG hierarchical clustering between patients with AR and healthy controls. Rows represent genes, while columns represent samples. The red bar represents patients with AR while the blue bar represents healthy controls. Values are gene expression levels.
Gene ontology enrichment analysis
The online analysis tool DAVID was used to identify significantly enriched GO terms for DEGs. DEGs that were down-regulated in patients with AR were more enriched than those that were up-regulated (Table 1). The down-regulated genes were mainly enriched in the biological process ontology, including antigen processing and presentation, the T cell receptor signaling pathway, and the immune response. For the cellular component ontology, down-regulated genes were enriched in the major histocompatibility complex (MHC) class II protein complex, haptoglobin–hemoglobin complex, and various vesicle membranes. For the molecular function ontology, down-regulated genes were significantly enriched in peptide antigen binding, MHC class II receptor activity, and haptoglobin binding.
Gene ontology analyses of the DEGs

DEGs, differentially expressed genes.
KEGG pathway analysis
The significantly enriched pathways of DEGs showed that up-regulated genes were only enriched in amoebiasis (Table 2), while down-regulated genes were enriched in various pathways including Staphylococcus aureus infection, rheumatoid arthritis, asthma, graft-versus-host disease, leishmaniasis, allograft rejection, and herpes simplex infection (Table 2).
KEGG pathway analyses of the DEGs

KEGG, Kyoto Encyclopedia of Genes and Genomes; DEGs, differentially expressed genes.
Module analysis and hub genes selection in the PPI network
After assessing the DEG PPI by STRING, a high-quality PPI network was constructed by Cytoscape containing 59 nodes and 92 edges. The MCODE plug-in was used to screen functional modules of the PPI network, which represent a sub-network of highly interconnected proteins. The largest module contained 13 nodes and 33 edges (Figure 3). The seven highest hub nodes evaluated by connectivity degree in the PPI network were identified (Table 3), and their expression level was examined in an independent validation dataset (GSE44037 and GSE43523) and compared with the original dataset (GSE19187). Six of the seven hub genes, CD44, HLA-DPA1, HLA-DRB1, HLA-DRB5, MUC5B, and CD274, were validated (Figure 4).

Highest module selected from the DEG PPI between patients with AR and healthy controls. Pink rectangles represent up-regulated genes while blue ones represent down-regulated genes
The seven hub nodes with the highest PPI network score

PPI, protein–protein interaction.

Expression of validated hub genes in original and validation datasets. GSE19187 is the original dataset, while the merger of GSE44037 and GSE43523 was used as the validation dataset. *, P < 0.05
Discussion
AR is the most common chronic disease in childhood. It can have a deleterious impact on quality of life, affecting sleep, cognitive and psychomotor function, and participation in social activities, and may impair learning.1–4 Accumulating evidence suggests that genetic variation significantly increases the risk of disease.12,16,17 In the present study, we used gene expression profile data to identify DEGs between patients with AR and healthy controls and a series of bioinformatics analyses to screen key genes and pathways associated with the development of AR.
KEGG pathway analysis found that genes down-regulated in patients with AR were enriched in S. aureus infection, rheumatoid arthritis, and allograft rejection. Many pathways are associated with the pathogenesis of allergic disease. The nasal carriage of S. aureus is an important risk factor for nosocomial and community-acquired infections, 20 and Refaat et al. showed that nasal S. aureus actively modulates the immune reaction in patients with persistent AR by promoting local IgE production; this has enabled early detection and treatment. 21 Major associations between common allergic diseases and incident rheumatoid arthritis were previously identified using Taiwan’s National Health Insurance Research Database. 22 This is consistent with the hypothesis that allergic diseases and rheumatoid arthritis share a similar underlying etiologic pathway related to chronic inflammatory responses.23,24 Considering that AR and asthma are both chronic heterogeneous disorders, with an overlapping epidemiology of prevalence, health care costs, and social costs, it is not surprising to identify AR-associated DEGs that are enriched in the asthma pathway.25–27
Our PPI network and module analyses predicted seven hub genes, of which six were validated in gene expression profiles GSE44037 and GSE43523 (CD44, HLA-DPA1, HLA-DRB1, HLA-DRB5, MUC5B, and CD274). These key genes might play important roles in the development of AR and act as early diagnosis biomarkers or treatment targets of AR. Interestingly, the cell adhesion molecule CD44, which is involved in lymphocyte infiltration of inflamed tissues, showed the highest connectivity degree in the PPI network. 28 CD44 was previously reported to be critical for the development of airway inflammation in a murine model of allergic asthma. 29 To our knowledge, this study is the first to identify an association between CD44 and the development of AR. Recently, a genome-wide association study found that genetic variants in the HLA-DPA1/HLA-DPB1 locus are associated with the risk of pediatric asthma in Asian populations. 30 Human leukocyte antigen (HLA) genes and alleles are responsible for the display of cell surface proteins and regulation of the immune system, 31 and several studies showed them to be either risk factors or protective factors for allergies involving common allergens.32–34 Yang et al. used sequence-specific primer PCR to show that two different HLA-DRB1 alleles associate with AR in northeast China. 35 Moreover, variants of the HLA-DRA|HLA-DRB5 inter-region were reported to be significant predictors of allergy to penicillins, but not to cephalosporins, suggesting complex gene–environment interactions in which genetic susceptibility of HLA type 2 antigen presentation plays a central role.36,37
MUC5B is an evolutionarily conserved gene that encodes structurally related mucin glycoproteins, which are the principal macromolecules in airway mucus.38,39 Ali et al. identified MUC5B as a major gel-forming mucin secreted in the airway, 40 while MUC5B was also demonstrated to alter the mucus gel and decrease mucus clearance, or contribute to mechanisms of airway eosinophilia because a deficiency in MUC5B-associated Siglec8 decreased eosinophil apoptosis in the airway lumen. 41 CD274, also known as programmed death ligand 1, emerged as an important immune modulator that can block T cell receptor signaling. 42
The present study had some limitations. The sample size of our dataset was small, meaning that statistical power was low; we are attempting to collect more data to overcome this. Moreover, our results need to be validated by molecular analyses. Nevertheless, our findings lay the foundation for further study. Micro (mi)RNAs are be a fundamental regulator of gene expression, with roles identified in numerous immunological and inflammatory disorders, including allergic inflammation. 43 Therefore, our future work will investigate the interactions of genes and miRNA profiles to shed new light on the molecular mechanisms involved in AR pathology.
In conclusion, we identified several key genes that are potentially associated with the development of AR using bioinformatics analyses of DEGs between patients with AR and healthy controls. These genes and their pathways will further our understanding of AR etiology, and help improve diagnosis, prevention, and intervention. Our findings suggest that the up-regulated expression of CD44 and CD274, and the down-regulation of HLA-DPA1, HLA-DRB1, MUC5B, and HLA-DRB5 can be considered candidate biomarkers or therapeutic targets for AR.
Supplemental Material
sj-xlsx-1-imr-10.1177_03000605211029521 - Supplemental material for Identification of key genes in allergic rhinitis by bioinformatics analysis
Supplemental material, sj-xlsx-1-imr-10.1177_03000605211029521 for Identification of key genes in allergic rhinitis by bioinformatics analysis by Yunfei Zhang, Yue Huang, Wen-xia Chen and Zheng-min Xu in Journal of International Medical Research
Footnotes
Declaration of conflicting interest
The authors declare that there is no conflict of interest.
Funding
The author(s) disclosed receipt of the following financial support for the research, authorship, and/or publication of this article: This research was supported by the Scientific Research Project of Shanghai (grant no: 18411965500).
References
Supplementary Material
Please find the following supplemental material available below.
For Open Access articles published under a Creative Commons License, all supplemental material carries the same license as the article it is associated with.
For non-Open Access articles published, all supplemental material carries a non-exclusive license, and permission requests for re-use of supplemental material or any part of supplemental material shall be sent directly to the copyright owner as specified in the copyright notice associated with the article.