
Abstract
Objective
As a unique histological subtype of colorectal cancer (CRC), mucinous adenocarcinoma (MC) has a poor prognosis and responds poorly to treatment. Genes and markers related to MC have not been reported.
Methods
To identify biomarkers involved in development of MC compared with other common adenocarcinoma (AC) subtypes, four datasets were obtained from the Gene Expression Omnibus database. Differentially expressed genes (DEGs) were identified using GEO2R. A protein–protein interaction network was constructed. Functional annotation for DEGs was performed via DAVID, Metascape, and BiNGO. Significant modules and hub genes were identified using Cytoscape, and expression of hub genes and relationships between hub genes and MC were analyzed.
Results
The DEGs were mainly enriched in negative regulation of cell proliferation, bicarbonate transport, response to peptide hormone, cell–cell signaling, cell proliferation, and positive regulation of the canonical Wnt signaling pathway. The Venn diagram revealed eight significant hub genes: CXCL9, IDO1, MET, SNAI2, and ZEB2 were highly expressed in MC compared with AC, whereas AREG, TWIST1, and ZEB1 were expressed at a low level. AREG and MET might be significant biomarkers for MC.
Conclusion
The identified DEGs might help elucidate the pathogenesis of MC, identify potential targets, and improve treatment for CRC.
Keywords
Introduction
Mucinous adenocarcinoma (MC) is a subtype of colorectal cancer (CRC) that is characterized by the formation of “mucus lakes,” in which the mucinous focus accounts for at least 50% of the tumor. MC accounts for 5% to 15% of total cases of CRC and is associated with proximal locations of the primary tumor. 1 This subtype of CRC tends to be more locally invasive than the other common adenocarcinoma (AC) subtype. Patients with MC have metastatic disease more frequently and have metastases at multiple sites more often than patients with the AC subtype. The common sites of metastasis are also different: MC predominantly metastasizes to the peritoneum, whereas AC more frequently metastasizes to the liver. 2 Compared with AC, patients with MC generally have a poor response to radiotherapy and chemotherapy and tend to have worse prognoses.3–6 At present, there are no specific clinical guidelines for MC patients, and treatment is the standard program used for AC. Because of the lack of confirmed data, the best treatment for MC remains unclear. To further refine the treatment for this subtype, we need an in-depth understanding of its pathogenesis.
Previous studies have suggested that the genetic origin of mucinous colorectal adenocarcinoma is related to the BRAF, microsatellite instability (MSI), and CpG island methylation phenotype (CIMP) pathways.7,8 There are differences in the expression of mucin family members in MC: MUC2 and MUC5 are highly expressed, whereas MUC1 shows low expression. The differential expression of mucin is related to the risk of metastasis and death. 9 In addition, the expression of p53 and p16 may predict the prognosis of MC patients of CRC. 10 However, the diagnostic or therapeutic value of a single gene remains uncertain. Because of the lack of specific biomarkers and therapeutic targets, the prognosis of MC cannot be effectively improved. Therefore, new signal pathways and molecular targets should be screened to identify potential markers and develop new diagnostic and treatment approaches.8–10
In this study, we used a bioinformatics approach to compare differentially expressed genes (DEGs) between MC and AC based on microarray data to find specific biomarkers and therapeutic targets of MC. Bioinformatics, using extensive data mining at the molecular level, can screen DEGs between MC and AC, construct networks of abnormal gene interactions, and identify key genes. This approach could help clarify the cause of MC and find potential treatment targets. In this study, we analyzed four expression profiling datasets of human samples from the Gene Expression Omnibus (GEO) database and identified the DEGs between MC and AC. Then, we carried out Gene Ontology (GO) and Kyoto Encyclopedia of Genes and Genomes (KEGG) pathway analyses. A protein–protein interaction (PPI) network analysis was constructed to elucidate the molecular pathogenesis of MC. Overall, eight hub genes were identified, which could have potential as biomarkers or molecular targets for MC.
Methods
Access to public data
All data used in this study were from publicly accessible databases; therefore, ethical approval was deemed unnecessary.
The Gene Expression Omnibus (GEO) database (http://www.ncbi.nlm.nih.gov/geo) is an open functional genomics database of high-throughput resources, including microarrays, gene expression data, and chips. Four expression profiling datasets (GSE101651, GSE103512, GSE101479, and GSE101481) were obtained from GEO that included data from 8 MC and 40 AC cases of colorectal cancer.
DEGs identified by GEO2R
GEO2R (https://www.ncbi.nlm.nih.gov/geo/geo2r/) is an interactive online tool used to identify DEGs from GEO series. 11 GEO2R can be applied to distinguish DEGs between MC and AC subtypes. Probe sets without corresponding gene symbols or genes with more than one probe set were removed. For the dataset GSE103512, statistical significance was defined at P ≤ 0.05 and fold change ≥1. For the other datasets, there was no criterion for P-value or fold change. The DEGs were presented in volcano maps drawn using a volcano plotting tool (https://shengxin.ren) based on the R language.
Construction of the PPI network
The Search Tool for the Retrieval of Interacting Genes 12 (STRING; http://string-db.org), an online database, can trace and predict PPI networks after importing the common DEGs identified in the GEO datasets. STRING was used to construct the PPI network of DEGs in this study. Cytoscape 13 (version 2.8; https://cytoscape.org/) was used to visualize the PPI network.
Functional annotation of DEGs by KEGG and GO analysis
DAVID (version 6.8; https://david.ncifcrf.gov/home.jsp) is an online analysis suite allowing integrated discovery and annotation. 14 Gene Ontology (GO) is widely used in bioinformatics and covers three aspects of biology: biological processes (BP), cellular components (CC), and molecular functions (MF). 15 Kyoto Encyclopedia of Genes and Genomes (KEGG; https://www.kegg.jp/) is one of the most commonly used biological information databases worldwide. 16 To perform GO and KEGG analysis of DEGs, the DAVID online tool was implemented. Significance was defined at P < 0.05.
Function and pathway enrichment analysis by Metascape
Metascape (http://metascape.org/gp/index.html#/main/step1) 17 is a powerful gene function annotation tool used to apply bioinformatics methods to batch analysis of genes and proteins and thus understand their functions. It can annotate a large number of genes or proteins, perform enrichment analysis, and construct PPI networks. It integrates several authoritative functional databases, such as GO, KEGG, and Uniprot, to analyze not only human data but also that of many other species. It can analyze a single data set or multiple gene sets simultaneously. Metascape was used to conduct the functional and pathway enrichment analysis in the research.
Further analysis for BP and CC Gene Ontology terms
The Biological Networks Gene Oncology tool (BiNGO, version 3.0.3; http://apps.cytoscape.org/apps/bingo) was used to analyze and visualize the biological processes and cellular components of identified hub genes. 18
Identification of significant modules and hub genes
The Cytoscape plug-in Molecular Complex Detection (MCODE, version 1.5.1; http://apps.cytoscape.org/apps/mcode) identified the most important modules of the network map. The criteria of MCODE analysis were degree cut-off = 2, MCODE score > 5, Max depth = 100, node score cut-off = 0.2, and k-score = 2. 19 The hub genes were identified in the PPI network by using the Cytoscape app cytoHubba (https://apps.cytoscape.org/apps/cytohubba). Because a single algorithm sometimes produces false positives, we adopted a four-fold algorithm to jointly identify hub genes and the four algorithms were used in different ways. The algorithms applied to identify hub genes were MCC, DMNC, EPC, and Degree. The common hub genes were analyzed by Venn diagram using FunRich software (http://www.funrich.org/).
Screening and analysis of significant hub genes
Significant hub genes were identified by Venn analysis for MCODE and cytoHubba. Then, STRING was used to construct the network of significant hub genes, and DAVID was used to perform BP analysis. Pearson’s correlation test was used to assess correlations among the significant hub genes. Heatmaps, presenting correlations among all hub genes, were prepared using the R language to visualize the expression levels of genes.
Identification of hub genes associated with colorectal cancer
The Comparative Toxicogenomics Database (http://ctdbase.org/) 20 was searched for integrated chemical–disease, chemical–gene, and gene–disease interactions to predict novel associations and generate expanded networks. The relationships between gene products identified in our datasets and CRC were analyzed using this database.
Quantitative real-time-PCR
Total RNA was extracted using TRIzol reagent (Thermo Fisher Scientific, MA, Waltham, USA) and reverse-transcribed into cDNA using the Reverse Transcription System (Promega, Fitchburg, WI, USA). Then, the prepared cDNA was subjected to quantitative real-time PCR analysis. The 2−ΔCt method was used to analyze relative expression of genes. Three technical replicates per sample were analyzed. The primer sequences are shown in Table 1. Differences between groups were evaluated using the two-tailed Student’s t-test. All statistical analyses were performed using SPSS version 21.0 software (IBM Corp., Armonk, NY, USA). P < 0.05 was considered significant.
Gene primers used in this study.

Construction and analysis of a target gene-TF-microRNA regulatory network
TFmiR (http://service.bioinformatik.uni-saarland.de/tfmir/) can integrate and analyze the interaction among transcription factors (TFs), microRNAs (miRNAs), and target genes, all of which are related to the pathogenesis of disease. The internal operation of cells depends on the correct functioning of an extremely complex activation inhibition system that can be disturbed in many ways. TFmiR can help explain cellular mechanisms at the molecular level of the network. TFmiR provides an analysis of topological properties and functions and reveals a disease-specific co-regulatory network between genes, TFs, and miRNAs.
Results
DEGs identified between MC and AC of CRC
Based on analysis of the datasets GSE101651, GSE103512, GSE101479, and GSE101481 with GEO2R, differences between MC and AC samples are presented in volcano plots (Figure 1a, b, c, and d). The complete list of DEGs between MC and AC samples in GEO datasets GSE101651, GSE103512, GSE101479, and GSE101481 is shown in Table 2.

Volcano plots of DEGs and the PPI network. The DEGs between mucinous adenocarcinoma and other adenocarcinoma samples in Gene Expression Omnibus datasets (a) GSE101651, (b) GSE103512, (c) GSE101479, and (d) GSE101481. (e) PPI network of all DEGs.
Complete list of differentially expressed genes between MC and AC samples in Gene Expression Omnibus datasets GSE101651, GSE103512, GSE101479, and GSE101481.

MC, mucinous carcinoma; AC, other adenocarcinoma.
PPI network and DAVID enrichment analysis of DEGs
A PPI network of all DEGs in the four datasets was constructed (Figure 1e). The results of the GO analysis showed that variations in DEGs linked to BP were mainly enriched in maintenance of gastrointestinal epithelium, negative regulation of catenin import into nucleus, Wnt signaling pathway involved in somitogenesis, wound healing, negative regulation of cell adhesion mediated by integrin, cell differentiation, defense response to virus, negative regulation of canonical Wnt signaling pathway, cellular response to organic cyclic compound, epidermal growth factor receptor signaling pathway, negative regulation of osteoblast differentiation, positive regulation of canonical Wnt signaling pathway, cell proliferation, cell−cell signaling, response to peptide hormone, bicarbonate transport, and negative regulation of cell proliferation (Figure 2a). Variations in DEGs linked to CC were significantly enriched in extracellular space, extracellular region, proteinaceous extracellular matrix, extracellular exosome, basolateral plasma membrane, cell surface, and zymogen granule membrane (Figure 2b). With regard to MF, DEGs were significantly enriched in protein binding, E-box binding, protein homodimerization activity, CXCR3 chemokine receptor binding, and carbonate dehydratase activity (Figure 2c). Analysis of KEGG pathways indicated that the top canonical pathways associated with DEGs were pancreatic secretion, bile secretion, and nitrogen metabolism (Figure 2d).

The enrichment analysis of DEGs by DAVID (https://david.ncifcrf.gov/home.jsp). Detailed information relating to changes in Gene Ontology categories (a) BP, (b) CC, and (c) MF; (d) KEGG pathway analysis for hub genes.
Metascape enrichment analysis of DEGs
Functional enrichment analysis with Metascape showed that DEGs between MC and AC were significantly enriched in negative regulation of cell proliferation, epithelial cell differentiation, maintenance of gastrointestinal epithelium, and regulation of epithelial cell differentiation (P < 0.05; Figure 3a, b, and c).

Enrichment analysis of DEGs by Metascape (http://metascape.org/gp/index.html#/main/step1). (a) Heatmap of enriched terms across lists of input differentially expressed genes, colored by P-values, via Metascape. (b) Network of enriched terms colored by cluster identity, where nodes that share the same cluster identity are typically close to each other. (c) Network of enriched terms, colored by P-values, where terms containing more genes tend to have more significant P-values.
Further analysis for BP and CC using BiNGO
The BP and CC analysis of DEGs by BiNGO verified the results of the GO analysis (Figure 4a, b). The results of BiNGO analysis showed that variations in in DEGs linked to BP were mainly enriched in negative regulation of such activities as cell differentiation, fluid transport, and water transport (Figure 4a). Changes in CC could also be enriched in extracellular region, extracellular space, extracellular region part, mucus layer, inner mucus layer, outer mucus layer, apical lamina of hyaline layer, hyaline layer, apical plasma membrane, cytoplasmic vesicle, vesicle, membrane-bound vesicle, stored secretory granule, zymogen granule, cytoplasmic membrane-bound vesicle, zymogen granule membrane, and cytoplasmic vesicle (Figure 4b).

BiNGO (http://apps.cytoscape.org/apps/bingo) analysis for all DEGs. (a) BP enrichment for all DEGs; (b) CC enrichment for all DEGs.
Significant modules
The three most significant modules were obtained from the PPI network using Cytoscape. The first module consisted of EREG, AREG, MET, ZEB1, ZEB2, TWIST1, SNAI2, SFRP2, and AXIN2 (Figure 5a), the second consisted of ZG16, TFF3, MS4A12, KRT20, and REG4 (Figure 5b), and the third consisted of GZMA, CXCL9, and IDO1 (Figure 5c).

Three significant modules identified from the PPI network. (a) The first module consists of EREG, AREG, MET, ZEB1, ZEB2, TWIST1, SNAI2, SFRP2, and AXIN2. (b) The second module consists of ZG16, TFF3, MS4A12, KRT20, and REG4. (c) The third module consists of GZMA, CXCL9, and IDO1
Hub genes identified from the PPI network
The MCC, DMNC, EPC, and Degree algorithms were used to identify hub genes shown in Figure 6a, b, c, and d, respectively. The common hub genes (CXCL9, MET, AREG, ZEB1, ZEB2, TWIST1, STAT1, SNAI2, IDO1, IFIT3) were identified by Venn diagram (Figure 6e).

Hub gene networks identified from the protein–protein interaction network using (a) the MCC algorithm; (b) the DMNC algorithm; (b) the EPC algorithm; and (d) the Degree algorithm of the Cytoscape app cytoHubba (https://apps.cytoscape.org/apps/cytohubba). (e) The Venn diagram shows the common hub genes (CXCL9, MET, AREG, ZEB1, ZEB2, TWIST1, STAT1, SNAI2, IDO1, IFIT3).
Screening and analysis of significant hub genes
Through the Venn diagram, eight significant hub genes (CXCL9, MET, AREG, ZEB1, ZEB2, TWIST1, SNAI2, and IDO1) were identified between MCODE and cytoHubba (Figure 7a). A summary of the functions of the eight hub genes is given in Table 3, and the network of significant hub genes is displayed in Figure 7b. Through DAVID analysis, the GO analysis showed that variations in significant hub genes linked to BP were mainly enriched in such activities as cell proliferation, negative regulation of transcription, negative regulation of gene expression, cell migration, and cell motility (Figure 7c). The correlations among all significant hub genes are presented in Figure 7d.

Screening and analysis of significant hub genes. (a) The Venn diagram shows eight significant hub genes (CXCL9, MET, AREG, ZEB1, ZEB2, TWIST1, SNAI2, IDO1) identified by MCODE and cytoHubba. (b) The network of significant hub genes. (c) The BP enrichment analysis of the significant hub genes by DAVID (https://david.ncifcrf.gov/home.jsp). (d) The heatmap shows the correlations among all significant hub genes.
Summary of the functions of the eight hub genes (function descriptions from https://pmlegacy.ncbi.nlm.nih.gov/).

Identification of hub genes
Analysis by heatmap allowed for simple differentiation of MC from AC tissues CRC based on the expression levels of hub genes. Expression of AREG, TWIST1, and ZEB1 was downregulated in MC tissues compared with AC tissues. However, expression of the other five significant hub genes was higher in MC (Figure 8). The Comparative Toxicogenomics Database showed that all 8 hub genes were associated with CRC (Figure 9). These results were verified by qRT-PCR in 50 AC tissues and 20 MC tissues (Figure 10). The results showed that compared with AC, expression of AREG was significantly downregulated, and expression of SNAI2, IDO1, and MET were significantly upregulated in MC, consistent with bioinformatics results. However, no significant differences were found for the other genes, which may be related to the small sample size. To better understand the mechanism of the MET gene, we constructed and analyzed a target genes–TF regulatory network and target gene–miRNA regulatory network (Figure 11).

Eight hub genes could differentiate mucinous adenocarcinoma samples from other adenocarcinoma samples. The upregulated genes in MC were CXCL9, IDO1, MET, SNAI2, and ZEB2, and the downregulated genes were AREG, TWIST1, and ZEB1.

Relationships of colorectal cancer with significant hub genes based on the comparative toxicogenomics database (http://ctdbase.org/). (a) CXCL9, (b) MET, (c) AREG, (d) ZEB1, (e) ZEB2, (f) TWIST1, (g) SNAI2, and (h) IDO1.

The eight significant hub genes (TWIST1, ZEB1, AREG, SNAI2, IDO1, ZEB2, MET, CXCL9) were validated by qRT-PCR. *P < 0.05, **P < 0.01, N.S., nonsignificant.
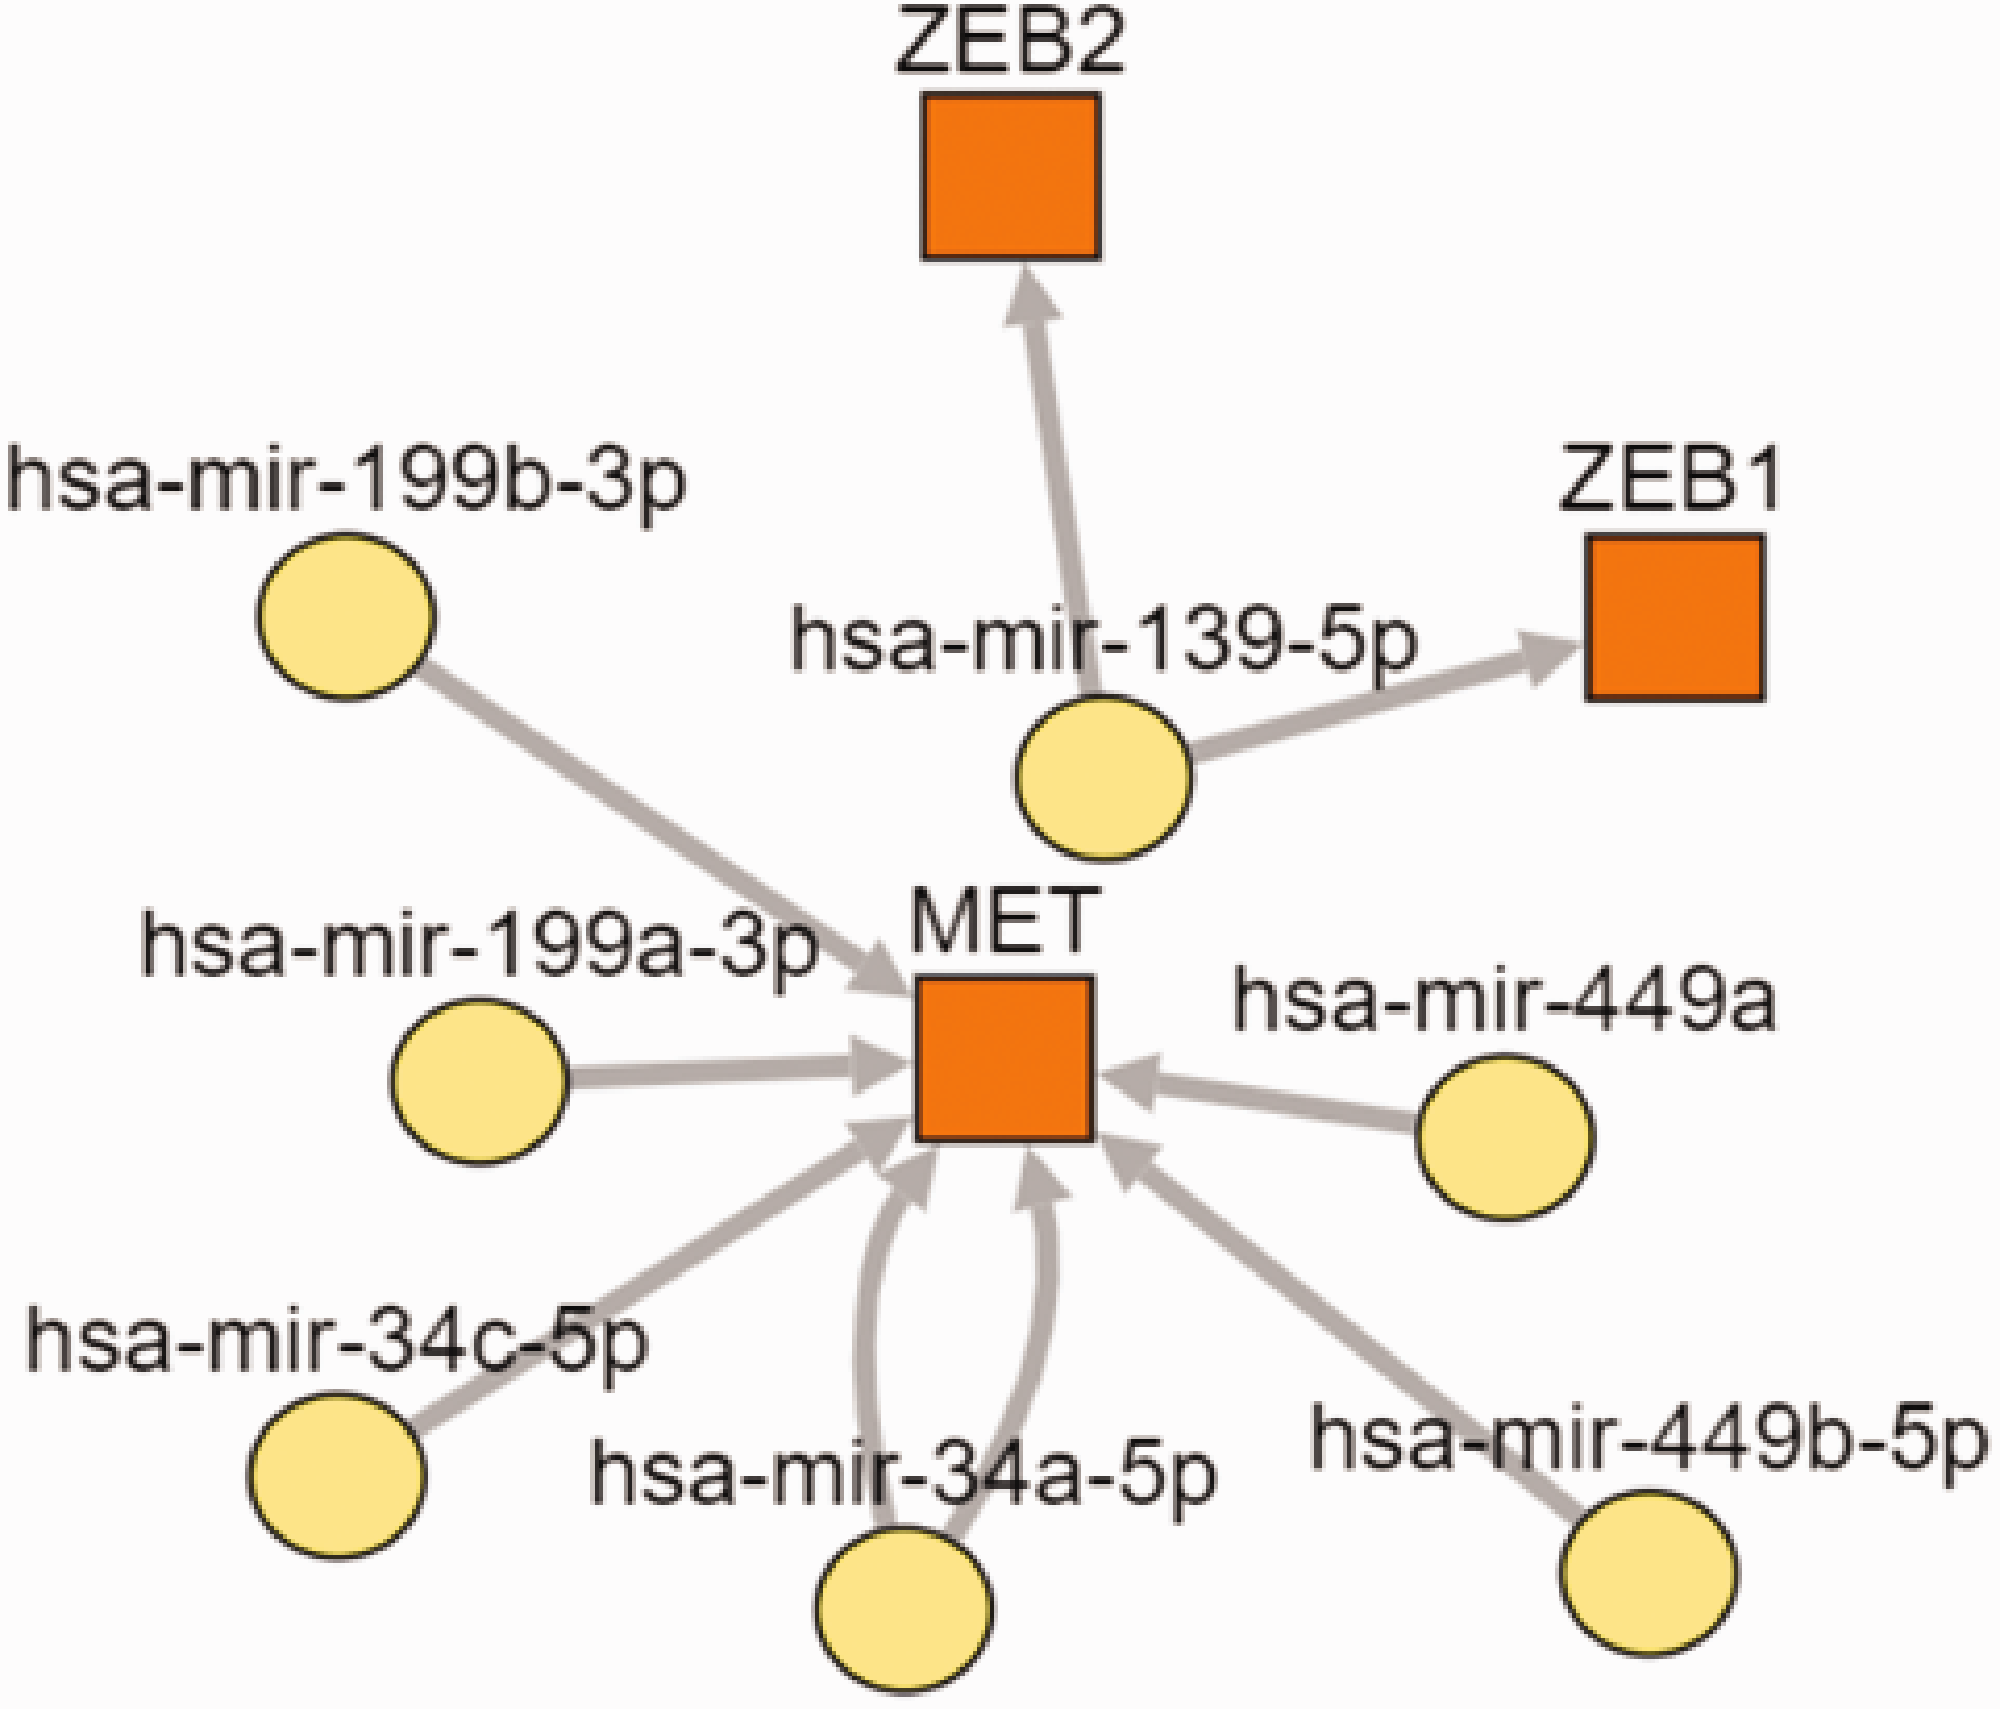
The target gene–transcription factor–microRNA regulatory network.
Discussion
MC originates more often in the right (proximal) colon and is more common in women. 6 It is more frequently associated with hereditary non-polyposis colorectal cancer and young-age sporadic CRC. 9 A meta-analysis of 44 studies and 222,256 patients showed that the prevalence of stage IV disease was similar in patients with AC and MC. 6
In patients with advanced disease, patients with MC have shown a worse response to fluorouracil and oxaliplatin/irinotecan-based first-line chemotherapy than patients with AC.21,22 MC patients tend to have worse overall survival (OS) and quality of life, more metastatic sites, and more peritoneal metastases. For patients with stage II CRC, although American Society of Clinical Oncology (ASCO) and European Society for Medical Oncology (ESMO) guidelines define the prognostic factors to guide adjuvant chemotherapy, including inadequate sampling of lymph nodes, pT4 primary tumors, obstruction, perforation, lymphovascular and perineural invasion, and poorly differentiated tumors, the effect of histological subtypes remains unclear. A study of 4893 patients with stage II CRC showed that MC patients tended to have a higher T category, a greater percentage of lymph nodes harvested, larger tumor size, and worse grading. For lymph node-negative CRC patients, the tumor histology of MC is related to poor prognosis. MC is a high-risk factor for stage II CRC patients with good or moderate differentiation and negative vascular or perineural invasion, indicating poor prognosis. 23 This finding is consistent with that of Lee et al. 24 For treatment of CRC patients with MC stage II, grade 3, adjuvant chemotherapy with oxaliplatin and fluoropyrimidine for 6 months instead of 3 months is needed because of the worse relapse-free survival and OS in the subgroup of patients with MC. 25
Despite the use of standard neoadjuvant and adjuvant regimens, MC remains a negative prognostic factor in young patients with CRC. It is associated with high and early recurrence rates. 26 Because of the early recurrence behavior of MC, physicians need to fully evaluate treatment and prognosis of CRC patients, and explore new treatment options.
In the past few decades, bioinformatics technology has been widely used to screen potential genetic targets of diseases; it is a useful approach to identify DEGs and related pathways and it has greatly improved the efficiency of scientific research. In this study, we used previous tissue samples from patients with MC and AC to identify DEGs in the two subtypes. The qRT-PCR results revealed no significant differences in expression of TWIST1, ZEB1, CXCL9, and ZEB2 between patients with MC and AC, which may be related to the small sample size. However, our results provide a direction for further study of the pathogenesis of MC and thus to optimize individualized treatment of MC.
Amphiregulin (AREG) is one ligand of the epidermal growth factor receptor (EGFR). It is expressed in multiple human tumors, such as liver cancer, prostate cancer, gastric cancer, esophageal cancer, breast cancer, and myeloma. AREG is expressed in stromal and epithelial compartments in CRC tissues and might be related to the development and progression of CRC. Researchers have demonstrated the coordinate expression of AREG, EGFR activity, and cell proliferation markers in vivo. 27 In addition, AREG may stimulate the growth of tumor cells through autocrine and paracrine pathways in vitro. AREG in the extracellular matrix can stimulate the growth of CRC cells. It has been suggested that AREG plays pro-neoplastic roles in CRC. 27 The expression of AREG s negatively correlated with the BRAF mutation and high expression of CIMP. In addition, the mRNA expression level of AREG was higher in left-sided tumors than that in right-sided tumors.28,29 This may further explain the greater response of left-sided tumors to EGFR antibody. Expression of AREG is associated with the occurrence of liver metastasis in CRC patients as an important predictive marker.30,31 MC predominantly metastasizes to peritoneal sites, whereas patients with AC more frequently have liver metastases, which may be related to differences in AREG expression. Researchers observed a significant downregulation of AREG expression in 5-fluorouracil-resistant CRC cells. 32 In this study, we found that AREG was expressed at a lower level in MC than in AC. This may help explain why MC patients always have a worse response to chemotherapy. It has been shown that high expression of AREG in CRC tissues is related to longer OS and progression-free survival, whereas low expression of AREG indicates poor survival.33–35 However, other researchers have found that high serum expression of AREG is associated with poor pathological factors. 36 Overall, we believe that low expression of AREG affects metastasis, therapeutic effect, and prognosis of MC, but its function and mechanism need further exploration.
In our study, AREG was negatively correlated with the mesenchymal–epithelial transition factor (MET), a cell-surface receptor tyrosine kinase (RTK) for hepatocyte growth factor (HGF)/scatter factor (SF). MET is an important signal in the development of CRC, and its high expression predicts a poor prognosis.37,38 A retrospective study of 286 patients with CRC showed that MET expression was significantly higher in advanced CRC than in early stages. 39 MET interacts with other growth factor receptors in CRC, and these interactions or cross-talk could lead to tumor progression and play a key role in drug resistance of targeted therapy. MET/HGF signaling plays an important role in solid tumors, especially in CRC. Researchers have found that MET/HGF signal, together with its downstream PI3K/AKT, MAPK, and STAT3 pathways, is a regulator of vascular endothelial growth factor (VEGF) expression. 40 Hypoxia-induced c-Met expression by VEGF pathway inhibitors leads to resistance to VEGF inhibition. The MET and RON tyrosine kinases belong to the scatter factor receptor family of TM RTKs, sharing many similar functional domains, and they are often co-expressed. A study showed that increased immunoreactivity of RON or MET was associated with shorter survival time and that moderate to strong co-expression of both receptors was associated with a worse prognosis. 41 MET could compensate for the loss of RON signal. 42 c-Met and RON signaling pathways rely mainly on the activation of PI3K and MAPK, which leads to the activation of PI3K/Akt, SRC, STAT3, nuclear factor-κB, focal adhesion kinase (FAK), and β-catenin, leading to cell responses, including epithelial–mesenchymal transition, cytoskeleton changes, invasion, angiogenesis, proliferation, resistance to apoptosis, among others. 43 The crosstalk of RET/c-Met and HER2/c-Met play important roles in proliferation, survival, and cell migration. In addition, the heterodimerization of EGFR and HER3 with c-Met could lead to cell proliferation. 44 In addition, HGF/c-Met signals have been shown to interact with insulin-like growth factor and its receptor (IGF1/IGF1R) 45 and MACC1 (MET transcriptional regulator).46,47 In this study, we found that MET was highly expressed in MC, which tends to be have a more malignant biological behavior.
The results of this study were based on bioinformatics analysis, without a large number of clinical samples for validation. In the next stage, we will conduct an in vivo or clinical study to verify the conclusions of this study.
In conclusion, the purpose of this study was to determine characteristic gene expression in the MC subtype of CRC. We compared DEGs between MC and AC using microarray data and provided new insights into specific biomarkers and potential therapeutic targets. Data mining and integration are promising tools to predict biomarkers of malignant tumors. However, our results are preliminary and would benefit from further in-depth study.