
Abstract
Objective
Glioma is the most common intracranial primary malignancy, but its pathogenesis remains unclear.
Methods
We integrated four eligible glioma microarray datasets from the gene expression omnibus database using the robust rank aggregation method to identify a group of significantly differently expressed genes (DEGs) between glioma and normal samples. We used these DEGs to explore key genes closely associated with glioma survival through weighted gene co-expression network analysis. We then constructed validations of prognosis and survival analyses for the key genes via multiple databases. We also explored their potential biological functions using gene set enrichment analysis (GSEA) and gene set variation analysis (GSVA).
Results
We selected DLGAP5, CDCA8, NCAPH, and CCNB2, as four genes that were abnormally up-regulated in glioma samples, for verification. They showed high levels of isocitrate dehydrogenase gene mutation and tumor grades, as well as good prognostic and diagnostic value for glioma. Their methylation levels were generally lower in glioma samples. GSEA and GSVA analyses suggested the genes were closely involved with glioma proliferation.
Conclusion
These findings provide new insights into the pathogenesis of glioma. The hub genes have the potential to be used as diagnostic and therapeutic markers.
Introduction
Glioma is a refractory malignant tumor prone to relapse, which is associated with poor prognosis and whose pathogenesis remains unclear. 1 The 2016 update of the World Health Organisation classification of central nervous system tumors integrated molecular characteristics such as mutations in isocitrate dehydrogenase genes (IDH), 2 the 1p/19q codeletion, 3 and the H3 K27M mutant 4 . The use of these novel molecular biological markers offers promising future diagnostic and therapeutic targets. For example, the IDH mutation status provides important information for the accurate diagnosis and prognosis of glioma.5,6
With the recent application of microarrays and high-throughput sequencing technology, molecular targeted therapy enables the possibility of individualized treatments following the accurate identification and inhibition of tumor gene mutations. 7 Although the use of different technology platforms or small sample sizes is associated with limitations and inconsistencies, these can be overcome by applying robust regression analysis (RRA) as an integrated bioinformatics method, particularly in cancer research.8,9
In this study, through the comprehensive application of many advanced bioinformatics methods, we integrated multiple gene expression omnibus (GEO) datasets to explore genes that are differentially expressed in glioma, and investigated their potential biological functions. The study workflow is shown in Figure 1.

Study workflow.
Materials and methods
Identification of glioma GEO datasets
Four eligible glioma datasets (GSE4290, GSE7696, GSE50161, and GSE68848) were downloaded from the GEO database. The selection criteria were as follows: (1) the collection of gliomas and corresponding adjacent or normal tissues; (2) including more than 60 samples; and (3) microarray datasets on the same platform. In additional, microarray datasets from the Oncomine database were used to analyze hub gene expression differences between glioma samples and normal tissues. A total of 693 glioma samples were downloaded from the Chinese Glioma Genome Atlas (CGGA http://www.cgga.org.cn) database, and 702 glioma samples were obtained from The Cancer Genome Atlas (TCGA) database. GEO dataset information and comprehensive demographic information of patients are shown in Table 1 and Table 2, respectively. The study protocol was approved by the Clinical Medical Research Ethics Committee of the First Affiliated Hospital of Bengbu Medical College.
Details of eligible datasets.

Baseline characteristics of study patients.

TCGA, the Cancer Genome Atlas; CGGA, Chinese Glioma Genome Atlas; IDH, isocitrate dehydrogenase.
Screening of robust DEGs
Each GEO dataset was normalized to identify DEGs through R package Limma. Next, RRA was used to integrate the results to obtain the most significant DEGs. 10,11 |log2FC| ≥ 1 and adjusted P-value < 0.05 were considered statistically significant for the DEGs.
Gene ontology (GO) and Kyoto Encyclopedia of Genes and Genomes (KEGG) pathway enrichment analysis
GO annotation and KEGG pathway analyses were conducted for identified DEGs using the R package clusterProfiler. GO terms or KEGG pathways with adjusted P < 0.05 were considered statistically significant.
Weighted gene co-expression network analysis (WGCNA)
The top 4000 up-regulated DEGs (according to P value) from RRA analysis underwent WGCNA analysis with expression profile data and clinical data from TCGA using R package WGCNA. This aimed to identify co-expressed gene modules, and to explore the relationships between the gene network and the phenotype of concern, as well as the core genes in the network. Within R package WGCNA, the adjacent coefficient and the joint strength between nodes were determined. A suitable soft threshold (β value) was precomputed by the pick soft-threshold function, and the adjacent matrix and topological overlap matrix (TOM) were obtained according to the β value. TOM was employed to characterize functional modules in the co-expressed network by hierarchical clustering. Next, the memory network under the selected β value was verified to determine whether it was scale-free. The topological matrix obtained was clustered with dissimilarity between genes, then gene trees were cut into different modules by the dynamic tree cut algorithm (with a minimum of 30 genes in the module). The eigengene of each module was then calculated, and modules with relevance >0.8 were merged. The module closely related to survival was determined according to the correlation between clinical traits and module eigengenes. This correlation was assessed to identify the relevant clinically significant module. Gene significance (GS) reflects the correlation between gene expression and certain clinical features. Hub genes related to key modules were screened by setting a GS >0.4 and module membership (MM) >0.8. Enrichment analysis was then performed of KEGG pathways for the key module.
Diagnosis and prognostic analysis of key genes
Differences in gene expression were validated between glioma and normal samples based on the Oncomine database. Using R package ggstatsplot, the pathological grade and IDH mutation status of key genes were verified in CGGA and TCGA databases. Sample information for key genes downloaded from these two databases was divided into high and low expression groups, and Kaplan–Meier survival curves of hub genes were plotted with R packages survminer and survival. Next, receiver operating characteristic (ROC) curves were plotted to evaluate the diagnostic values of hub genes using the pROC R package. Univariate and multivariate Cox regression analyses using SPSS v. 21.0 software (IBM Corp, Armonk, NY, USA) of patient age, sex, IDH mutation status, use of radiotherapy and chemotherapy, and the mutation status of cyclin B2 (CCNB2), non-SMC condensin I complex subunit H (NCAPH), cell division cycle associated 8 (CDCA8), and disks large-associated protein 5 (DLGAP5) genes were used to evaluate the impact of these factors on the prognostic value in glioma patients based on TCGA database.
Methylation analysis
Version 3.0 of DiseaseMeth (DiseaseMeth 3.0, http://diseasemeth.edbc.org) is an online database that analyzes abnormal methylation in human diseases. Its sample size has been increased to 17,024 samples by including TCGA, GEO, and Sequence Read Archive data. 12 DiseaseMeth 3.0 was used to analyze the methylation levels of key genes between glioma and normal tissues.
Analysis of tumor-infiltrating immune cells
The tumor immune estimation resource (TIMER; https://cistrome.shinyapps.io/timer/) is a comprehensive resource that systematically analyzes immune infiltrates using the TIMER algorithm across various cancer types. 13 TIMER was used to explore whether there was a link between identified key genes and tumor immune cells.
GSEA and GSVA analysis
The R package clusterProfiler was applied to carry out GSEA of key genes, while R package GSVA was used to discover potential pathways associated with key genes. Each key gene was divided into high expression and low expression groups based on median expression levels with TCGA-LGGGBM data. GSEA and GSVA analyses were performed based on the downloaded gene set “c2.cp.kegg.v7.0.entrez.gmt” (MSigDB, http://software. broadinstitute.org/gsea/msigdb/index.jsp).
Results
Identification of integrated DEGs in glioma
Four GEO datasets were standardized and the following DEGs were screened out: GSE4290: 1268 up-regulated genes, 1412 down-regulated genes; GSE7696: 754 up-regulated genes, 924 down-regulated genes; GSE50161: 2665 up-regulated genes, 2288 down-regulated genes; and GSE68848: 1193 up-regulated genes, 1593 down-regulated genes in glioma samples compared with normal samples. These DEGs were then integrated using the RRA method to identify the most significant. DEG integration from four GEO datasets screened 551 up-regulated and 817 down-regulated DEGs (Figure 2). The top two significantly up-regulated genes were RRM2 (P < 0.01, adjPvalue < 0.01) and TOP2A (P < 0.01, adjPvalue < 0.01), while SV2B (P < 0.01, adjPvalue < 0.01) and GJB6 (P = <0.01, adjPvalue < 0.01) were the top two significantly down-regulated genes. The top 20 up-regulated and down-regulated DEGs are shown as a heatmap in Figure 3.
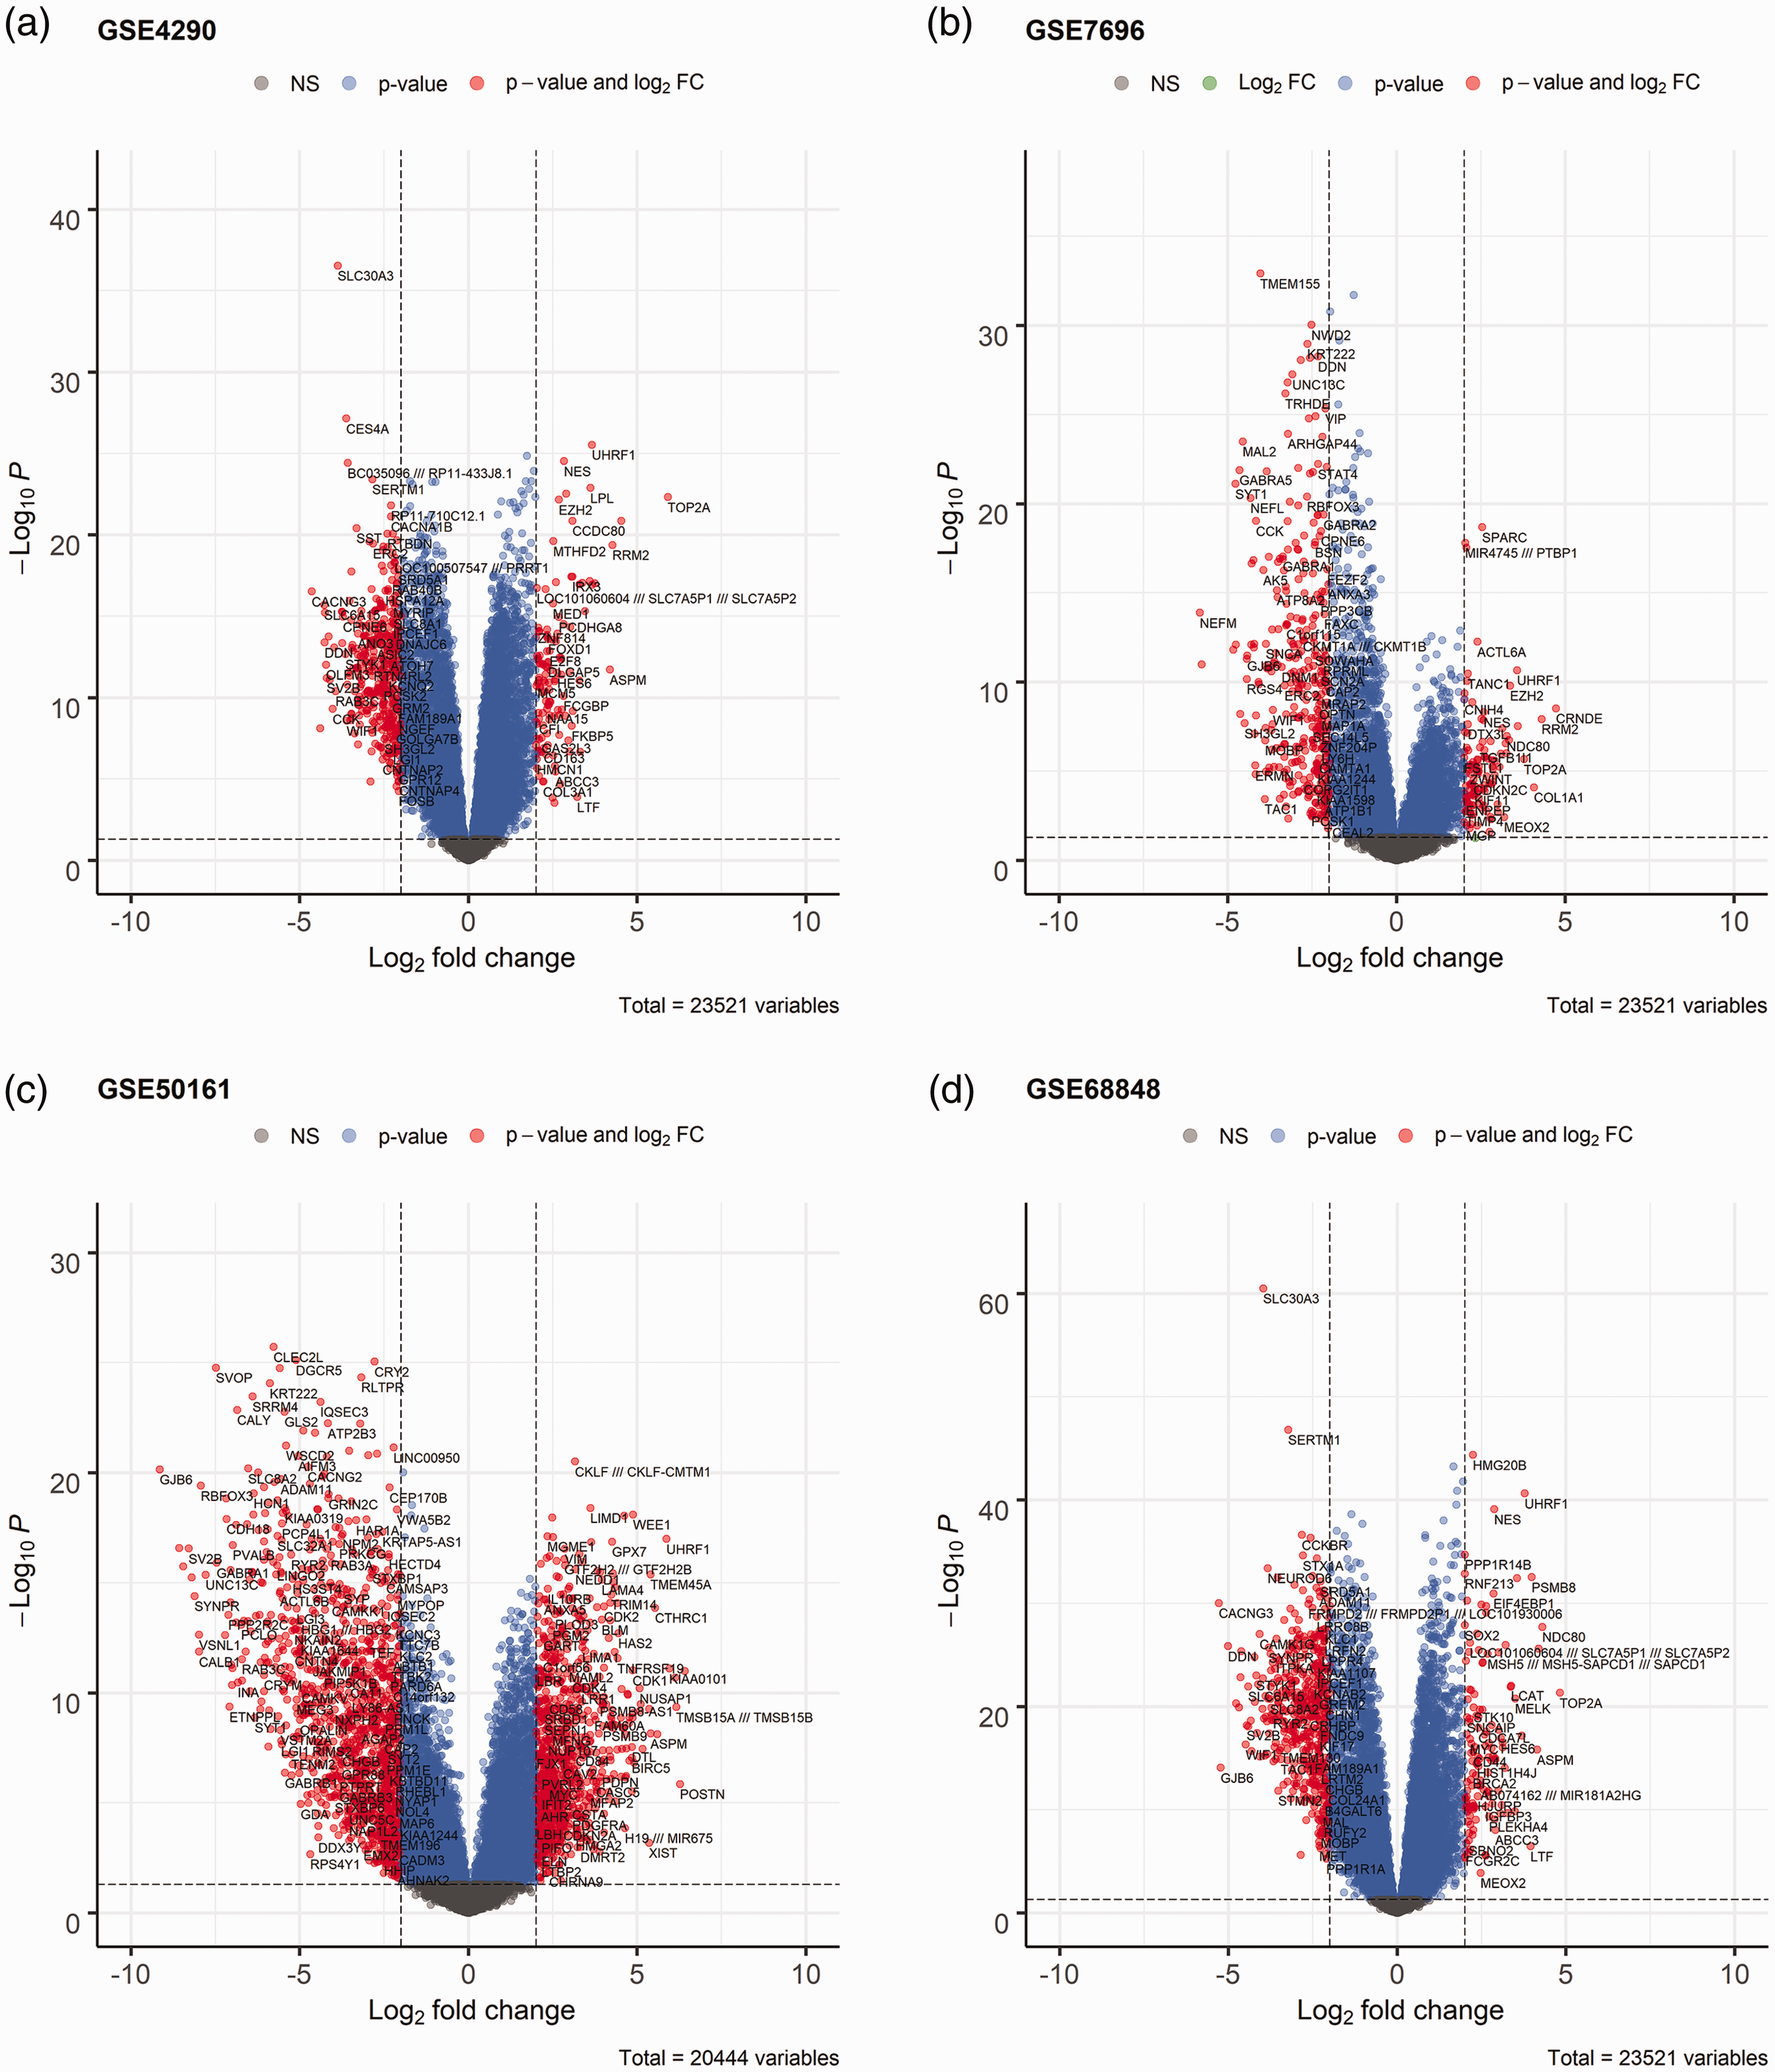
Differentially expressed genes between the two groups of samples in each dataset. (a) Volcano plot of GSE4290. (b) Volcano plot of GSE7696. (c) Volcano plot of GSE50161 and (d) Volcano plot of GSE68848.

Heatmap of robust DEGs determined by RRA analysis. Red indicates up-regulation; blue represents down-regulation. The number in each rectangle represents the logarithmic fold change.
Enrichment analysis
GO analysis showed that the up-regulated DEGs were mainly enriched in biological processes (BP) including extracellular structure organization, cellular components (CC) including collagen-containing extracellular matrix, and molecular functions (MF) including extracellular matrix structural constituents (Figure 4a). KEGG pathway analysis found that the phosphoinositide 3-kinase (PI3K)-Akt signaling pathway, cell cycle, and focal adhesion were associated with these genes (Figure 4b). Down-regulated DEGs were shown to be mostly enriched in BP including the modulation of chemical synaptic transmission and regulation of trans-synaptic signaling, CC including presynapses, and MF including gated channel activity (Figure 4c). KEGG pathway analysis revealed they mainly participated in the calcium signaling pathway and neuroactive ligand–receptor interactions (Figure 4d).

GO and KEGG enrichment analysis of DEGs. (a) GO terms for up-regulated genes. (b) KEGG analysis of up-regulated genes. (c) GO terms for down-regulated genes and (d) KEGG analysis of down-regulated genes.
WGCNA and key module analysis
Glioma clinical data such as survival time and survival status from TCGA were included in WGCNA (Figure 5a). Using a scale-free network, nine modules were identified by setting the soft-thresholding power as 12 (scale free R2 = 0.94) (Figure 5b–5d). The green module was found to be most closely associated with glioma survival prognosis (correlation coefficient = 0.52, P < 0.01 with survival status; correlation coefficient = –0.29, P < 0.01 with survival time; Figure 5e–5f). A total of 501 genes were identified in the green module by drawing a scatter plot of Intramodular Connectivity vs Module Membership (Figure 6a). By setting MM >0.8 and GS >0.4, 19 hub genes were identified from the green module: KIF23, MELK, CDK1, ASPM, CDC20, BUB1, CCNB2, BUB1B, AURKB, NUSAP1, PBK, TPX2, TOP2A, KIF11, TTK, RRM2, NCAPH, CDCA8, and DLGAP5. KEGG pathway analysis showed that these genes were mainly involved in the p53 signaling pathway, the cell cycle, and DNA replication (Figure 6b).

Co-expression network construction and identification of the key module. (a) Hierarchical clustering dendrogram of samples from TCGA-LGGGBM RNA-seq data. (b) Analysis of the scale-free fit index and the mean connectivity for various soft-thresholding powers. (c) Testing the scale-free topology when β = 12. (d) Dendrogram of genes with dissimilarity based on topological overlap. (e) Correlation between module eigengenes and clinical traits. Each cell contains the correlation and P-value and (f) Gene significance across different modules.

Identification of hub genes and KEGG functional annotation of the core module. (a) Scatter plot of genes in green module and (b) KEGG analysis for genes within the green module.
Diagnostic and prognostic value of hub genes in Oncomine, CGGA, and TCGA databases
From the 19 genes selected above, four (CCNB2, NCAPH, CDCA8, and DLGAP5) were screened that have rarely been studied before to validate their diagnostic and prognostic value. Based on the Oncomine database, the mRNA expression levels of all four genes were shown to be significantly increased in glioma samples compared with normal samples (P < 0.01, Figure 7a). These hub genes were significantly up-regulated in high-grade glioma tissues, and their IDH wild-type level was also higher than that of the mutant in the CGGA database (P < 0.05, Figure 7b–7c) and TCGA database (P < 0.05, Figure 7d–7e). Kaplan–Meier curves indicated that the expression of these genes was associated with poor patient prognosis (P < 0.01, Figure 8). ROC curves revealed their high diagnostic value in identifying glioma (Figure 9: CCNB2 area under the curve [AUC]: 0.967; NCAPH AUC: 0.919; CDCA8 AUC: 0.879; and DLGAP5 AUC: 0.947) based on the TCGA-LGGGBM dataset. Univariate and multivariate Cox analyses showed that these genes could be considered independent clinical prognostic factors based on TCGA cohort (Table 3).

Verification of key genes in multiple databases. (a) CDCA8, DLGAP5, NCAPH, and CCNB2 expression levels between glioma and normal tissues in the Oncomine database. (b–c) Expression of CDCA8, DLGAP5, NCAPH, and CCNB2 with different grade gliomas and IDH mutation status in the CGGA database and (d–e) Expression of CDCA8, DLGAP5, NCAPH, and CCNB2 with different grade gliomas and IDH mutation status in TCGA database.

Kaplan–Meier survival curve of DLGAP5, CDCA8, NCAPH, and CCNB2 based on the CGGA dataset (a) and TCGA dataset (b).
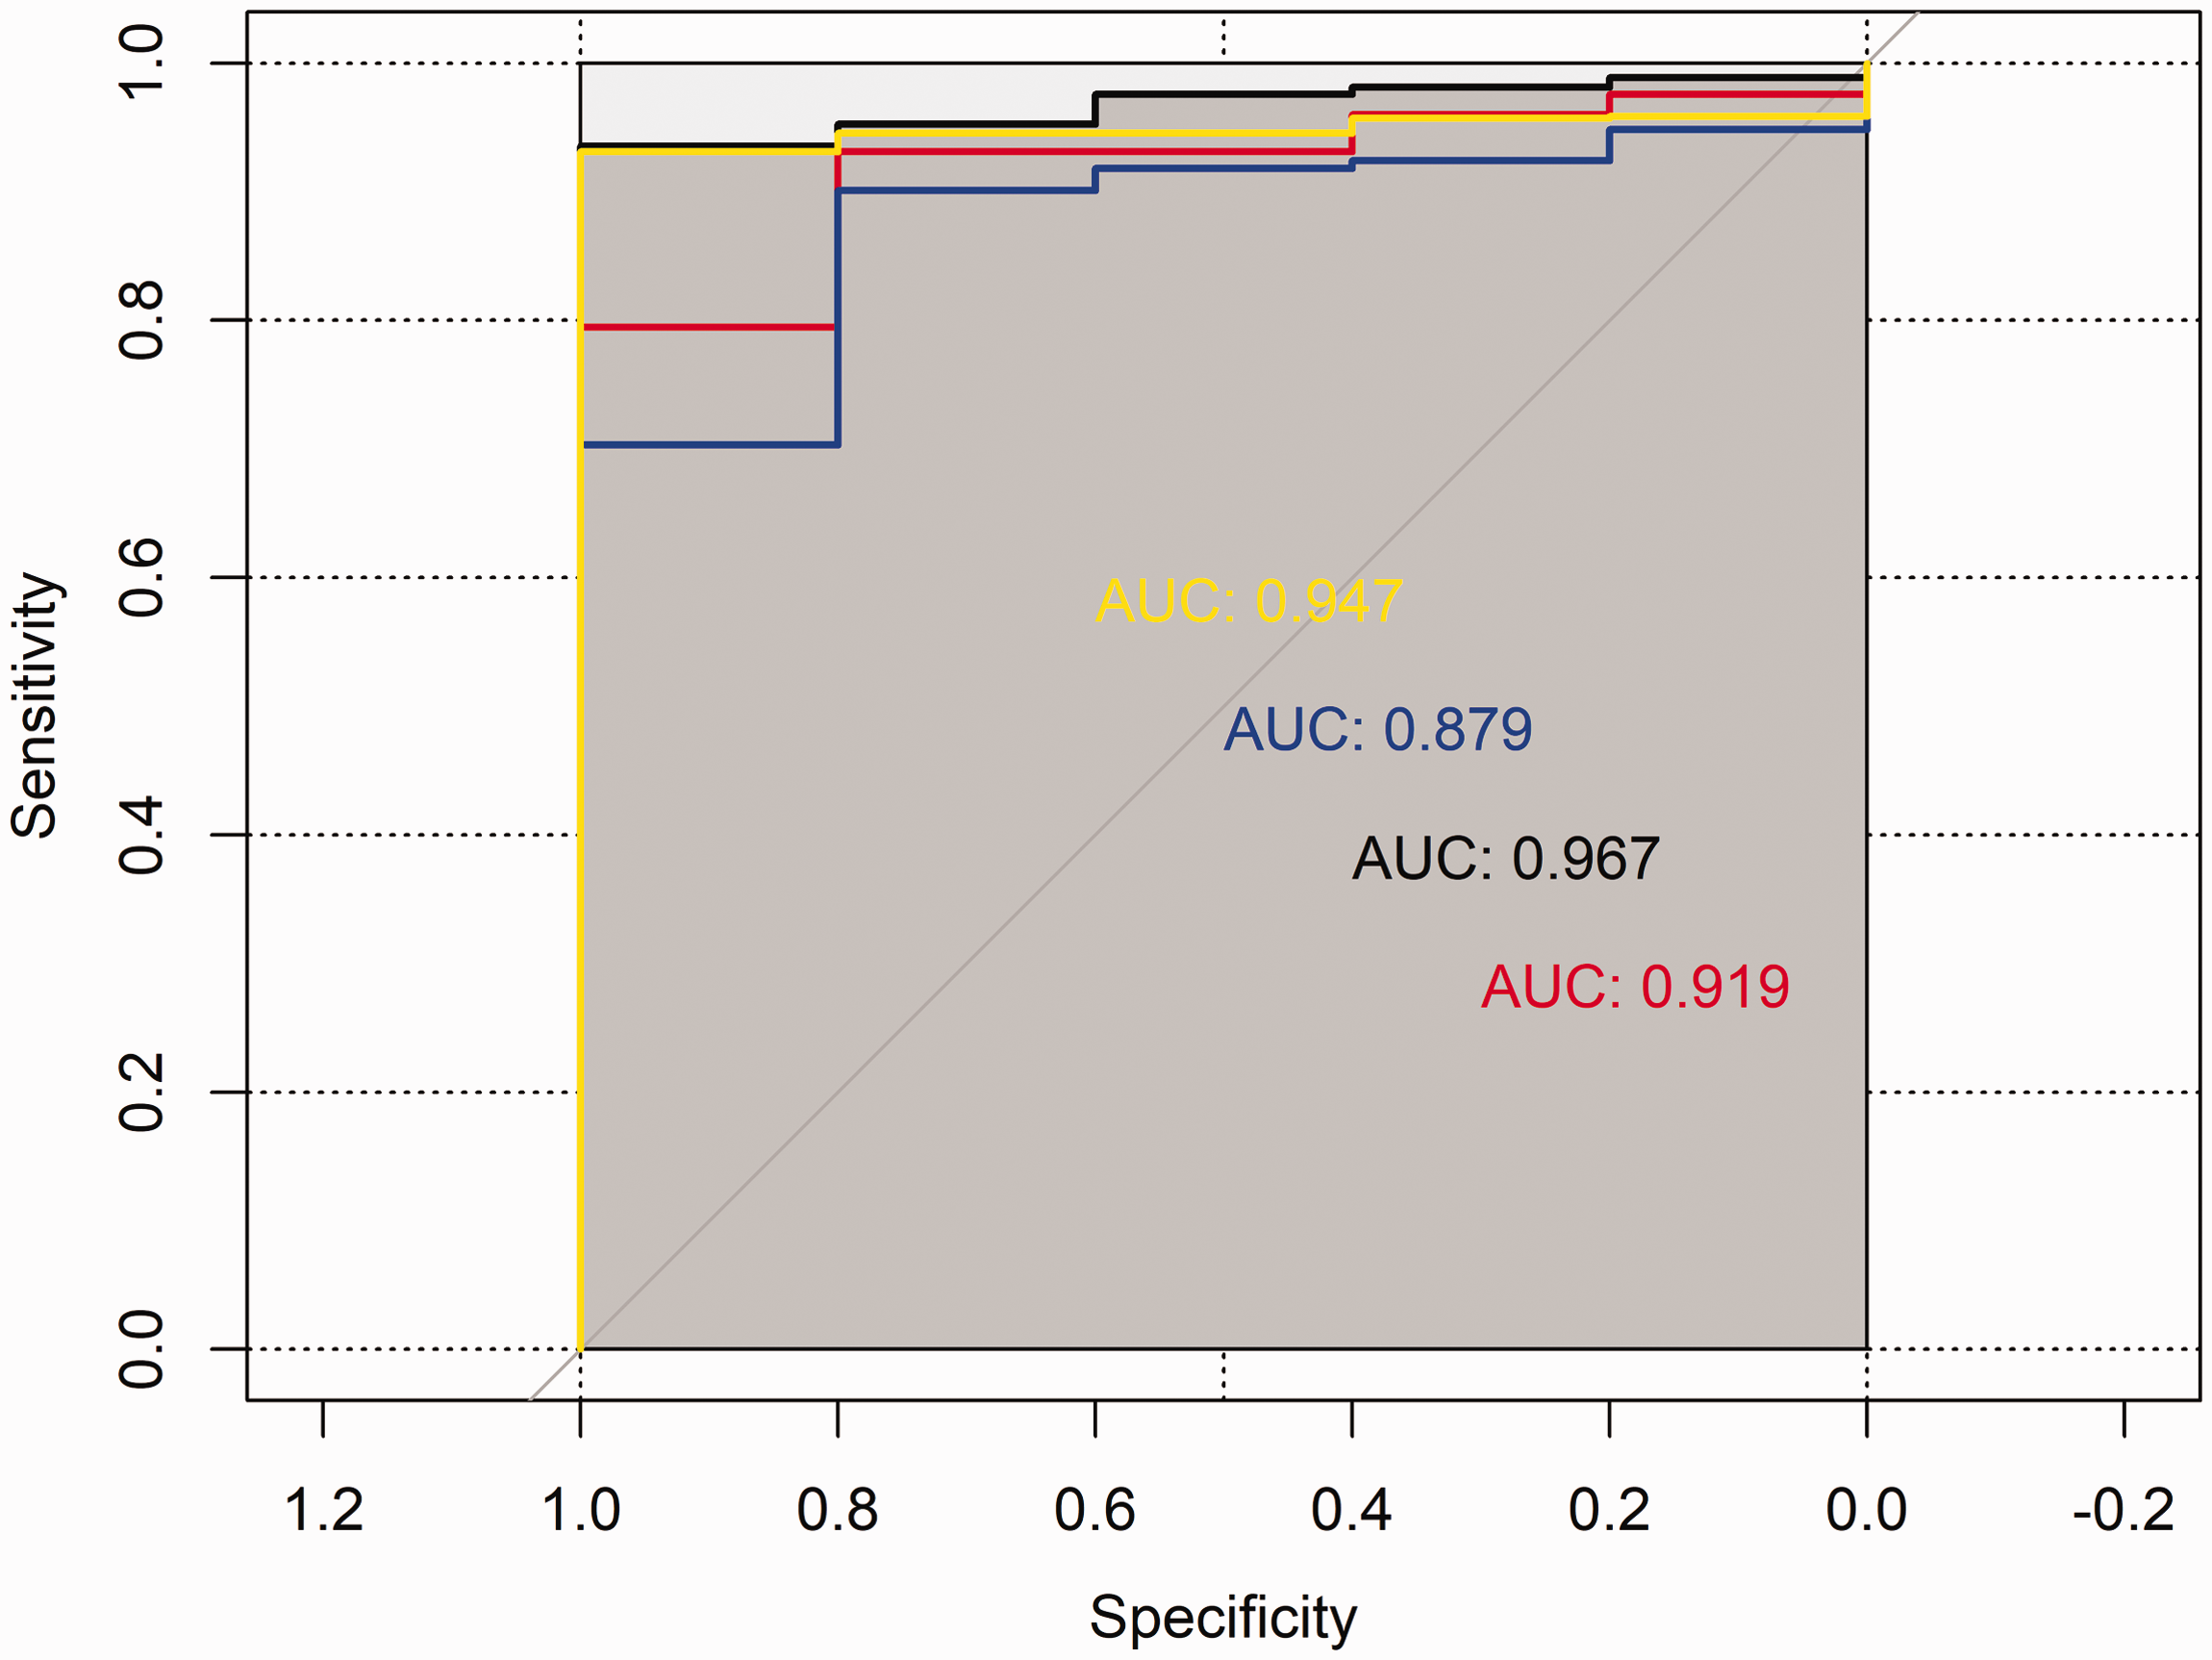
ROC curves for CCNB2, NCAPH, CDCA8, and DLGAP5.
Univariate and multivariate survival analysis of overall survival probabilities with respect to hub gene expression based on TCGA datasets.

95% CI, 95% confidence interval; HR, hazard ratio; IDH, isocitrate dehydrogenase; CDCA8, cell division cycle associated 8; NCAPH, non-SMC condensin I complex subunit H; DLGAP5, disks large-associated protein 5; CCNB2, cyclin B2.
Methylation analysis of key genes
DiseaseMeth v.3.0 was used to verify the methylation levels of DLGAP5, CDCA8, NCAPH, and CCNB2 in glioma and peri-tumoral normal tissues. Mean methylation levels of DLGAP5, CDCA8, and NCAPH were significantly lower in glioma compared with peri-tumoral normal tissues (P=), while methylation levels of CCNB2 were slightly higher in glioma compared with peri-tumoral normal tissues (P<0.01, Figure 10).
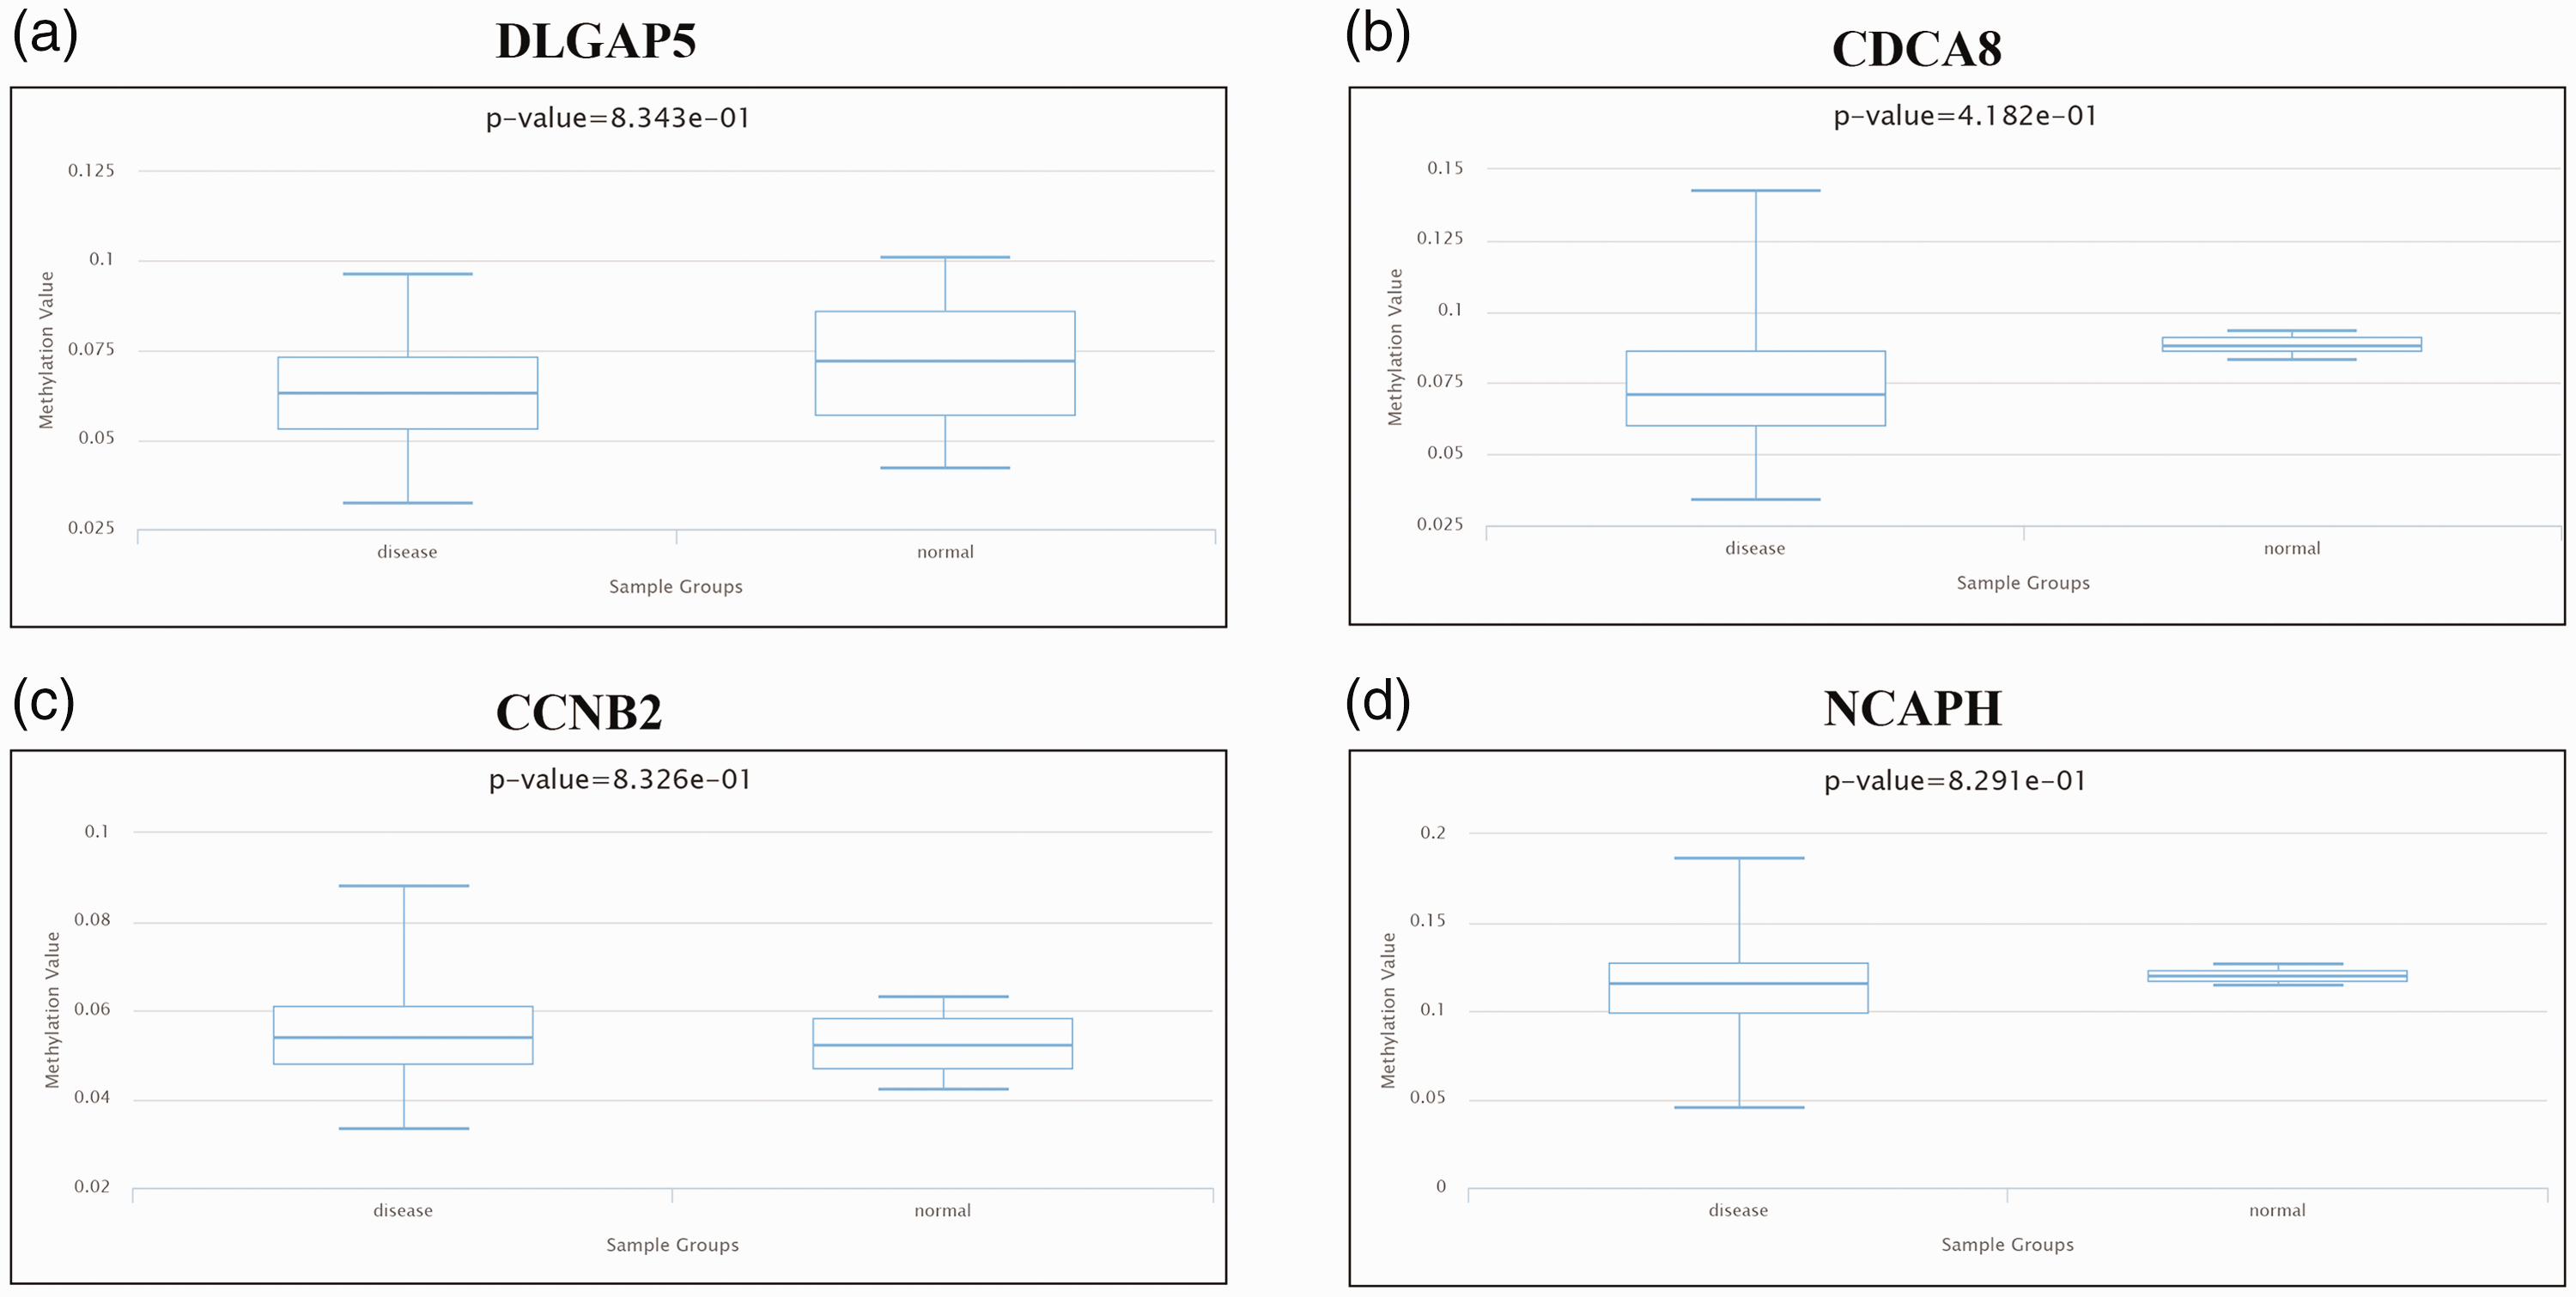
Methylation level analysis of key genes in glioma and peri-tumoral normal tissues. (a) DLGAP5; (b) CDCA8; (c) CCNB2; and (d) NCAPH.
Relationship between gene expression and tumor purity and immune infiltration
TIMER was used to explore the association of key gene expression levels with tumor purity and the infiltration of immune cells such as B cells, CD4+ T cells, CD8+ T cells, neutrophils, macrophages, and dendritic cells. DLGAP5, CDCA8, NCAPH, and CCNB2 were significantly positively correlated with tumor purity (P < 0.01). However, no correlation or only a weak association was observed between hub gene expression and immune infiltration (Figure 11).
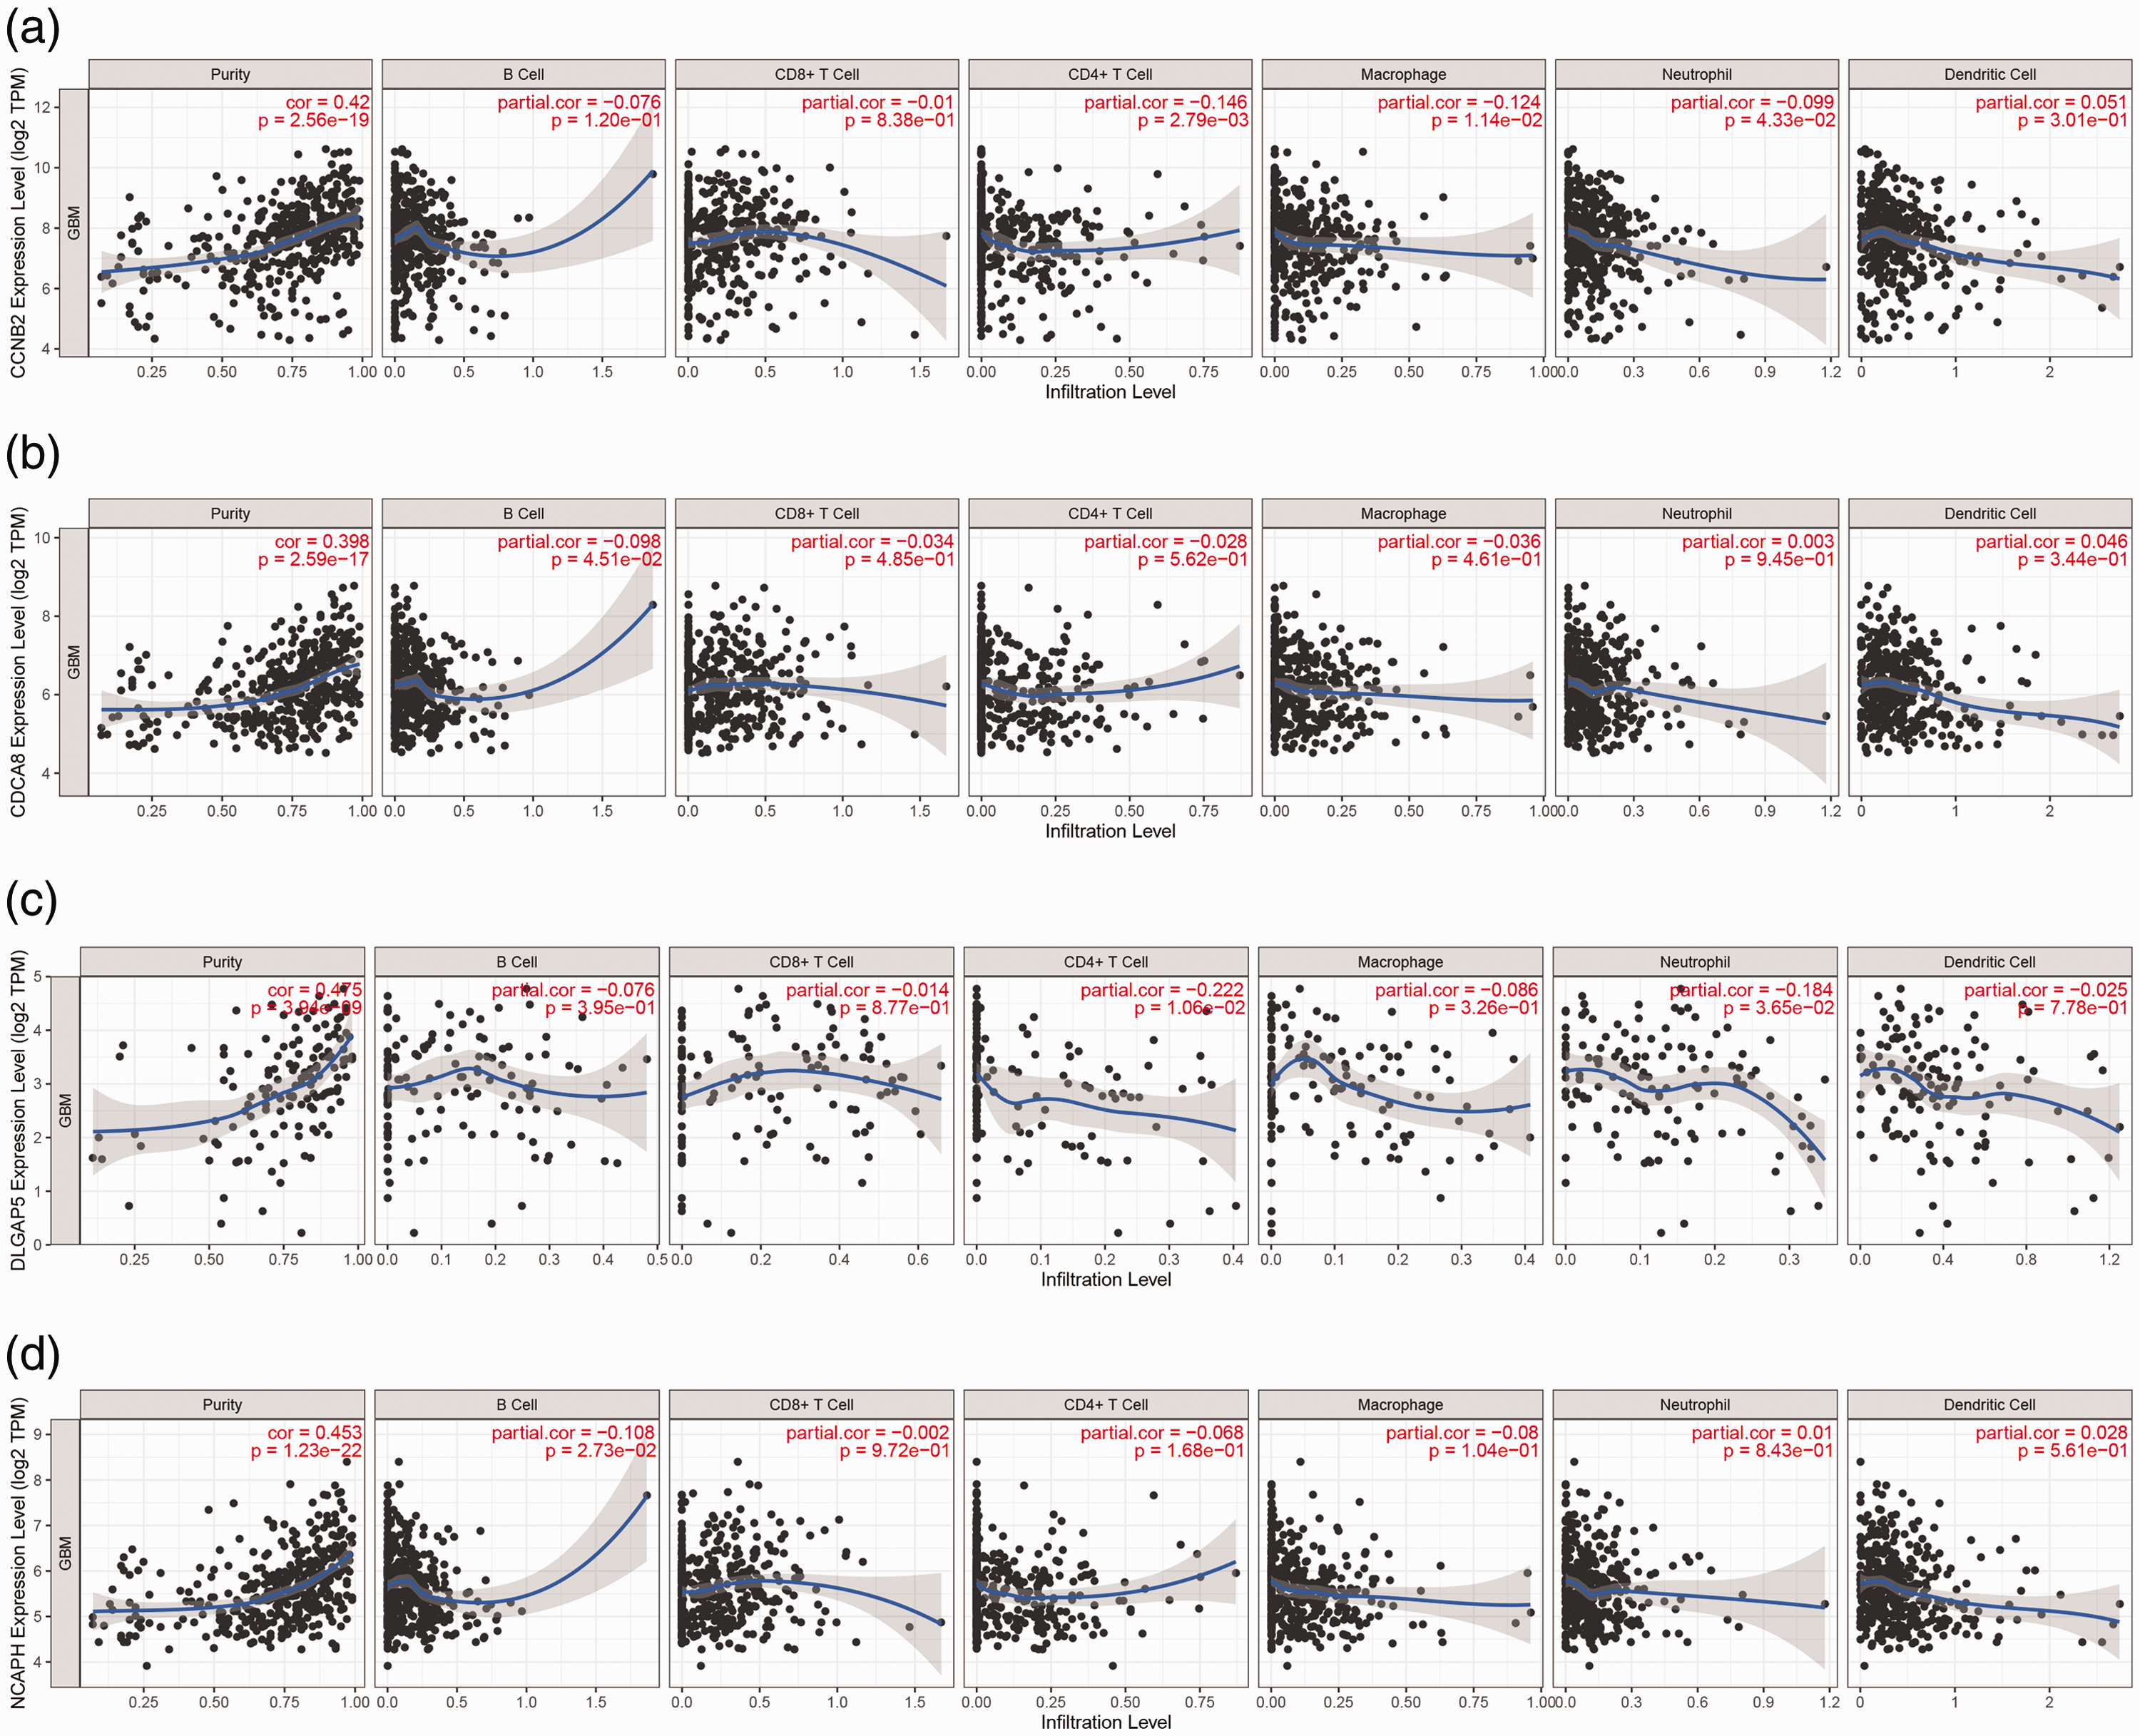
Relationship between key gene expression levels and immune infiltration in glioma. (a) NCAPH; (b) CDCA8; (c) CCNB2; and (d) DLGAP5.
GSEA and GSVA analysis of hub genes
Finally, GSEA and GSVA analyses of the potential biological function of key genes showed that DLGAP5, CDCA8, NCAPH, and CCNB2 were all enriched in KEGG_DNA_REPLICATION, KEGG_HOMOLOGOUS_RECOMBINATION, and KEGG_MISMATCH_REPAIR pathways (P < 0.01, Figure 12a–12d). These gene sets had high enrichment scores and were mainly associated with tumor development. GSVA verified that the gene sets were mainly enriched in the high expression groups of DLGAP5, CDCA8, NCAPH, and CCNB2, further suggesting that the genes promote tumor proliferation (Figure 12e–12h).

GSEA and GSVA analysis of hub genes. Gene sets significantly enriched in the high expression group for (a) CDCA8; (b) NCAPH; (c) DLGAP5; and (d) CCNB2. GSVA enrichment heatmaps for hub genes (e) NCAPH; (f) CCNB2; (g) CDCA8; and (h) DLGAP5.
Discussion
Despite treatments such as comprehensive surgery, radiotherapy, and chemotherapy, patients with glioma still have a poor prognosis. Therefore, it is essential to actively explore the pathogenesis of gliomas and identify possible molecular targets. Many such targets have been discovered with the application of high-throughput sequencing; however, inconsistencies exist between DEGs in different studies. 14 On the basis of previous work, we comprehensively analyzed hub genes associated with survival and prognosis in glioma, but which have rarely been studied or have been reported in other tumors but not in glioma,15 –19 using RRA and WGNA bioinformatics methods. A co-expression network previously constructed using WGCNA showed that some hub genes correlated with clinical traits of glioma samples in CGGA and TCGA datasets.20,21 In the current study, four GEO datasets were enrolled to screen key genes by RRA, which identified 551 significantly up-regulated and 817 significantly down-regulated DEGs in glioma compared with normal tissue samples.
GO analysis of the integrated DEGs showed that up-regulated genes were enriched in extracellular structure organization, collagen-containing extracellular matrix, and mitotic nuclear division, which are all involved in the development of glioma;22,23 furthermore, several identified KEGG pathways such as PI3K-Akt signaling, cell cycle, p53 signaling, and focal adhesion pathways are associated with glioma pathogenesis. 24 The PI3K/Akt pathway is closely involved with glioma growth, angiogenesis, and chemotherapy resistance, while TP53 mutations are associated with the epithelial–mesenchymal transition process of glioma and tumor growth. 25 This suggests that these DEGs are closely related to the development of glioma.
Following WGCNA gene co-expression network construction, 19 key genes were identified which play an important role in glioma pathogenesis. Of the four genes rarely studied in glioma that were selected for exploration of their diagnostic and prognostic value, NCAPH is closely associated with chromosome stability. Its encoded protein is a member of the Barr family, and it plays a key role in controlling cell proliferation during mitosis and meiosis. 26 Previous studies have suggested that NCAPH enhances proliferation, migration, and invasion in many cancers; for example, NCAPH expression is up-regulated and associated with poor prognosis in prostate cancer 27 and colon cancer.28,29 However, its role in glioma remains unclear.
CCNB2, a member of the cyclin family of proteins, plays a key role in the G2/M transition. It is also highly expressed in many malignancies, including human hepatocellular carcinoma where it is associated with poor prognosis. 30 Moreover, decreased CCNB2 expression was found to inhibit invasion and metastasis in bladder cancer. 31 However, its mechanism in gliomas is still unknown.
CDCA8, an important component of the vertebrate chromosomal passenger complex, is highly expressed in many malignant tumors and promotes tumorigenesis. Gao et al. found that CDCA8 knockdown inhibited proliferation and enhanced the apoptosis of bladder cancer cells. 32 Previous research also reported CDCA8 as a key mediator of estrogen-stimulated cell proliferation in breast cancer cells, 33 but its role in glioma remains unclear.
DLGAP5 encodes a microtubule-associated protein whose abnormal expression can lead to tumor development. Xu et al. reported that the overexpression of DLGAP5 was associated with poor prognosis in breast cancer, 34 while DLGAP5 expression was shown to be up-regulated in liver cancer and associated with poor prognosis. 35
In the present study, we found that the expression of CCNB2, NCAPH, CDCA8, and DLGAP5 was significantly up-regulated in glioma compared with normal tissues. In addition, the genes have been associated with high levels of wild-type IDH and high malignancy.36,37 Moreover, ROC curves suggested they are promising diagnostic biomarkers and independent prognostic predictors, and could be used as therapeutic targets for glioma.
DiseaseMeth 3.0 showed that NCAPH, CDCA8, and DLGAP5 were hypomethylated, while CCNB2 was hypermethylated in glioma samples. Furthermore, the expression of all four genes was positively correlated with tumor purity, but there was limited association with immune infiltration. GSEA and GSVA analyses showed that cell cycle-related KEGG pathways were enriched in the high expression groups of key genes, confirming their association with glioma proliferation.
In summary, using multiple bioinformatics analyses, we identified four hub genes (CCNB2, NCAPH, CDCA8, and DLGAP5) whose expression was significantly up-regulated in glioma tissues compared with normal tissues. These genes might contribute to the development of glioma, and could serve as therapeutic and prognostic biomarkers. However, further experiments are needed to confirm their biological value.
Footnotes
Ethics statement
This study was mainly conducted using public database data, without animal or human experiments, and does not involve ethical issues.
Declaration of competing interest
The authors declare that no competing interests exist.
Funding
The authors disclosed receipt of the following financial support for the research, authorship, and/or publication of this article: The research was funded by the Natural Science Key Project of Bengbu Medical College (grant no. 2020byzd065).