
Abstract
We investigated ketamine’s neuroplastic effects in healthy human subjects using integrated Positron Emission Tomography (PET)/Magnetic Resonance Imaging (MRI) measures before and 1–8 days after a single psychedelic dose of ketamine (1 mg/kg, intravenous). Eleven male participants underwent two PET/MRI scans with [11C]-UCBJ (synaptic density/plasticity), 1H-MRS (glutamate and GABA) and resting-state fMRI (intrinsic brain activity, functional connectivity), before and after ketamine. While group-level analyses showed no significant increases in PET synaptic markers, ketamine administration resulted in significantly elevated glutamate levels within the anterior cingulate cortex (ACC). Functional connectivity analyses revealed reduced coupling between the ACC and the dorsolateral prefrontal cortex (dlPFC) and increased coupling between the ACC and the amygdala in the days following ketamine administration. Our multimodal analysis revealed that participants showing an increase in [11C]-UCBJ volume distribution (VT), a putative index of synaptic plasticity, showed a correlated reduction in intrinsic activity within regions belonging to the default mode network (DMN). By linking molecular, cellular and network-level changes, our results point to the DMN as a central hub where ketamine may reshape brain hierarchies in the long term, providing new directions for understanding its therapeutic mechanisms and developing targeted treatments.
Introduction
Ketamine is a versatile compound with a tightly dose-dependent range of psychoactive effects. With increasing dosage, ketamine leads to a progression from disinhibition and alcohol-like effects to psychedelic experiences, termed dissociation in clinical contexts, and, at the highest doses, to an anaesthetic state. 1 In recent years, clinical trials have revealed ketamine to have a rapid antidepressant effect that occurs within a few hours and lasts for up to a week after a single dose, with repeated exposures extending the duration significantly. 2 These sustained clinical effects observed long after the drug has been metabolised prompt critical questions regarding their underlying mechanisms.
A substantial body of preclinical research has demonstrated that the prolonged mood-enhancing effects of ketamine, as well as other antidepressants like SSRIs and classic psychedelics, are associated with enduring neuroplastic changes. 3 Cortical neurons cultured with ketamine exhibit increases in dendritic complexity and spine density, essential components for the genesis of new synaptic connections. 4 In vivo, studies of rodents have shown that a single sub-anaesthetic dose of ketamine promotes neurogenesis in the adult hippocampus as well as an increase in dendritic spines and synaptic density within the pre-frontal cortex (PFC). These enhancements often correlate with improvements in behavioural surrogate markers of depressive symptoms.5,6 Furthermore, ketamine reliably reduces the thresholds for stimulation-induced functional modifications, such as short-term and long-term plasticity, in cortical neurons within hours to days post-administration, depending on the dose and stimulation paradigm. These modifications are linked to the re-opening of critical developmental windows, manifesting as a shortened functional recovery period following monocular deprivation 7 or the reactivation of a sensitive period for social reward learning. 8
Deficits in neuroplasticity within mood-regulating brain regions have been recognised as core features of various neuropsychiatric disorders, including depression. 9 Recent advances in positron emission tomography (PET) techniques have enabled the in vivo quantification of molecular markers of synaptic plasticity in the human brain through the validation of the radioligand [11C]-UCBJ, which binds to synaptic vesicle protein 2A (SV2A), a protein widely present in presynaptic vesicles. 10 Foundational studies using this tracer have reported significant reductions in cortical SV2A concentrations in individuals with neuropsychiatric/neurodegenerative conditions, including depression.11–13
However, despite considerable animal research indicating that ketamine’s rapid and sustained antidepressant effects stem from increased structural and functional neuroplasticity, confirming these findings in the living human brain presents significant challenges. In 2022, Holmes et al. investigated the changes in synaptic SV2A density induced by ketamine (0.5 mg/kg) using [11C]-UCBJ in depressed patients, individuals with trauma, and healthy subjects, but found no significant effects at 24 h post-administration of ketamine. Notably, a post hoc exploratory analysis revealed that ketamine did significantly increase SV2A density in the group of depressed patients with the lowest baseline SV2A levels. 14
While not directly related to the classical concept of synaptic plasticity as studied in preclinical research, measures of functional whole-brain dynamics can provide valuable insights into the intrinsic flexibility of neuronal network information processing. 15 Evidence from functional magnetic resonance imaging (fMRI) indicates that ketamine induces profound acute and sub-acute alterations in intrinsic brain activity and connectivity both within and between neural networks, resulting in lasting changes in whole-brain dynamics that are similar to those produced by classic psychedelics (for reviews see Erritzoe et al. 16 and Marguilho et al. 17 ). Acutely, ketamine was observed to reduce the brain-wide fractional amplitude of low frequency fluctuations (ALFF), a raw index of intrinsic regional neural activity extracted from blood-oxygen-level-dependent (BOLD) signal. 18 However, another study observed increases in fractional ALFF in the posterior cingulate cortex (PCC) at 1 h post-ketamine in healthy subjects, but these changes were not significant at 1 day post-treatment. 19 Many studies have demonstrated that ketamine acutely reduces resting-state functional connectivity (FC) within the default mode network (DMN)20,21 (although not universally reported 19 ), which is involved in ‘narrative’ self-experience and is hyperactive in depression.22,23 This effect is still present at 1 day after exposure to a single dose of ketamine.19,24,25 Also, ketamine reduced the anti-correlation between the DMN and other networks acutely 20 and 1 day after the infusion. 25 In depressed individuals, altered connectivity in the DMN and other high-order networks was found to correlate with improvements in depression symptomatology.26–29
Collectively, existing literature suggests that ketamine may induce neuroplastic changes linked to mood improvements in humans across multiple levels. However, a comprehensive characterisation of ketamine’s neuroplastic effects across different scales, from synaptic alterations to global brain dynamics, and the interactions between these levels remains lacking. Employing innovative multimodal neuroimaging paradigms, recent investigations have revealed intriguing relationships between molecular, cellular and whole-brain functional dynamics, with functional relevance for neuropsychiatric conditions.30–33 Using magnetic resonance spectroscopy (MRS) imaging integrated with PET, Onwordi et al. 34 observed a positive correlation between baseline concentrations of glutamate and SV2A, measured via [11C]-UCBJ, in the anterior cingulate cortex (ACC) and hippocampus of healthy subjects, which is disrupted in early psychosis. 33 In another investigation, greater synaptic density in both the PFC and striatum was associated with greater fractional ALFF of the DMN in healthy subjects, 35 but not patients with schizophrenia. 32 Examining the impact of synaptic loss on brain network function in frontotemporal lobar degeneration syndrome, it was reported that lower [11C]-UCBJ binding correlated with diminished functional connectivity, which was further linked to clinical severity. 36 Yet, despite these advances in multimodal neuroimaging techniques, there is currently very limited evidence on how pharmacological interventions, particularly ketamine, influence the relationship between molecular and whole-brain functional dynamics.
In the present study, we employed integrated PET/MRI using [11C]-UCBJ, measured from 1 to 8 days after a single psychedelic dose of ketamine (1 mg/kg) in 11 healthy subjects, to assess its effects across different levels of brain function. We hypothesised that ketamine would induce increased density of the SV2A marker of synaptic plasticity, measured via [11C]-UCBJ volume distribution (VT), in mood-regulating regions belonging to the DMN, with effects emerging up to a week following administration. The effects of ketamine on brain function were assessed using measures of glutamatergic neurotransmission (1H-MRS), regional brain activity (ALFF) and functional connectivity (FC). An exploratory multimodal analysis was conducted between [11C]-UCBJ VT and ALFF to investigate the relationship between changes in regional brain activity and synaptic plasticity induced by ketamine.
Materials and methods
Participant recruitment and screening
A total of 11 healthy male participants (mean age 32 ± 10 years) were screened and included in the study. Informed consent was obtained from all participants. Participants’ details are listed in Table 1. The inclusion criteria were as follows: participants needed to be between 20 and 60 years of age, exhibit no physical or psychiatric medical conditions, and have no history or current incidence of substance abuse. Consumption of ketamine or classic psychedelics in the 6 months preceding the beginning of the study was a ground for exclusion to avoid carry-over neuroplastic effects from previous substance exposure. 3 Of the total sample, none of the participants were naïve to classic psychedelics, while n = 7 participants were ketamine naïve. Additionally, participants were required to abstain from alcohol and illicit substance intake for at least 1 week before and throughout the study period, as assessed via urine drug screen tests and breathalyser tests on each visit. Participants were screened for contraindications to MRI or research PET scanning. Ethical approval was granted by the Brent Research Ethics Committee, London, UK, following the Declaration of Helsinki guidelines (Supplemental Data).
Demographic, drug and radiotracer characteristics for all participants.
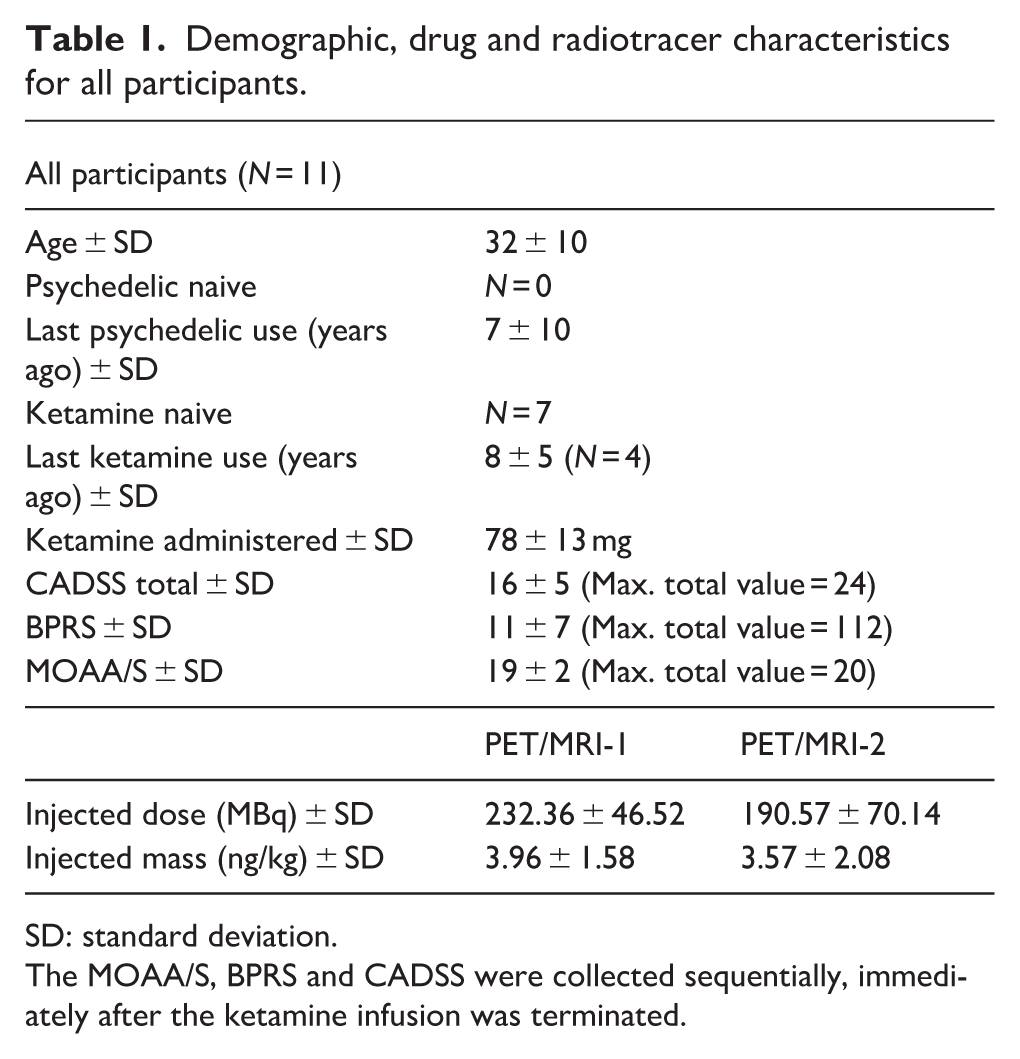
SD: standard deviation.
The MOAA/S, BPRS and CADSS were collected sequentially, immediately after the ketamine infusion was terminated.
Ketamine administration
Racemic ketamine was obtained from the St Charles Centre for Health & Wellbeing Pharmacy and administered intravenously by constant infusion over 40 min at a dose of 1 mg/kg. This dosage is sub-anaesthetic and produces a psychedelic-like experience often described as dissociative, and has confirmed antidepressant effects. 37 The amount of ketamine administered was comparable across participants (78 ± 13 mg), and all participants experienced the dissociative effects of the drug (Table 1). Vital signs (blood pressure and heart rate) were obtained before, during and after ketamine infusion.
Study design
Each participant underwent 2 PET/MRI scans, where [11C]-UCBJ was administered intravenously for the quantification of brain SV2A (Figure 1(a)). Subsequently, 1H-MRS was acquired to quantify glutamate and GABA concentrations within the ACC. Then, resting-state fMRI data were obtained to assess whole-brain intrinsic brain activity and connectivity. Participants had their first scan (i.e. PET/MRI-1) approximately 2 weeks before the ketamine infusion. Of the 11 participants, a subset of 4 participants underwent their post-ketamine scan (i.e. PET/MRI-2) 1 day after ketamine infusion. One participant had the scan 2 days after the ketamine infusion due to tracer production failure 1 day post-ketamine administration. Participants who had their second scan either at 1 or 2 days after ketamine are referred to as the Day 1–2 group (n = 5). A subset of 4 participants had their Scan 2 at 7 days after ketamine infusion. Two participants had their Scan 2 at 8 days after ketamine infusion due to tracer production failure at 7 days post-ketamine administration. Those participants are referred to as the Day 7–8 group (n = 6). This design was chosen to sample potential temporal dynamics across the 1-8-day post-infusion interval. The study was not powered to detect between-subgroup differences. Therefore, subgroup comparisons were considered exploratory and are reported in the Supplemental Data.
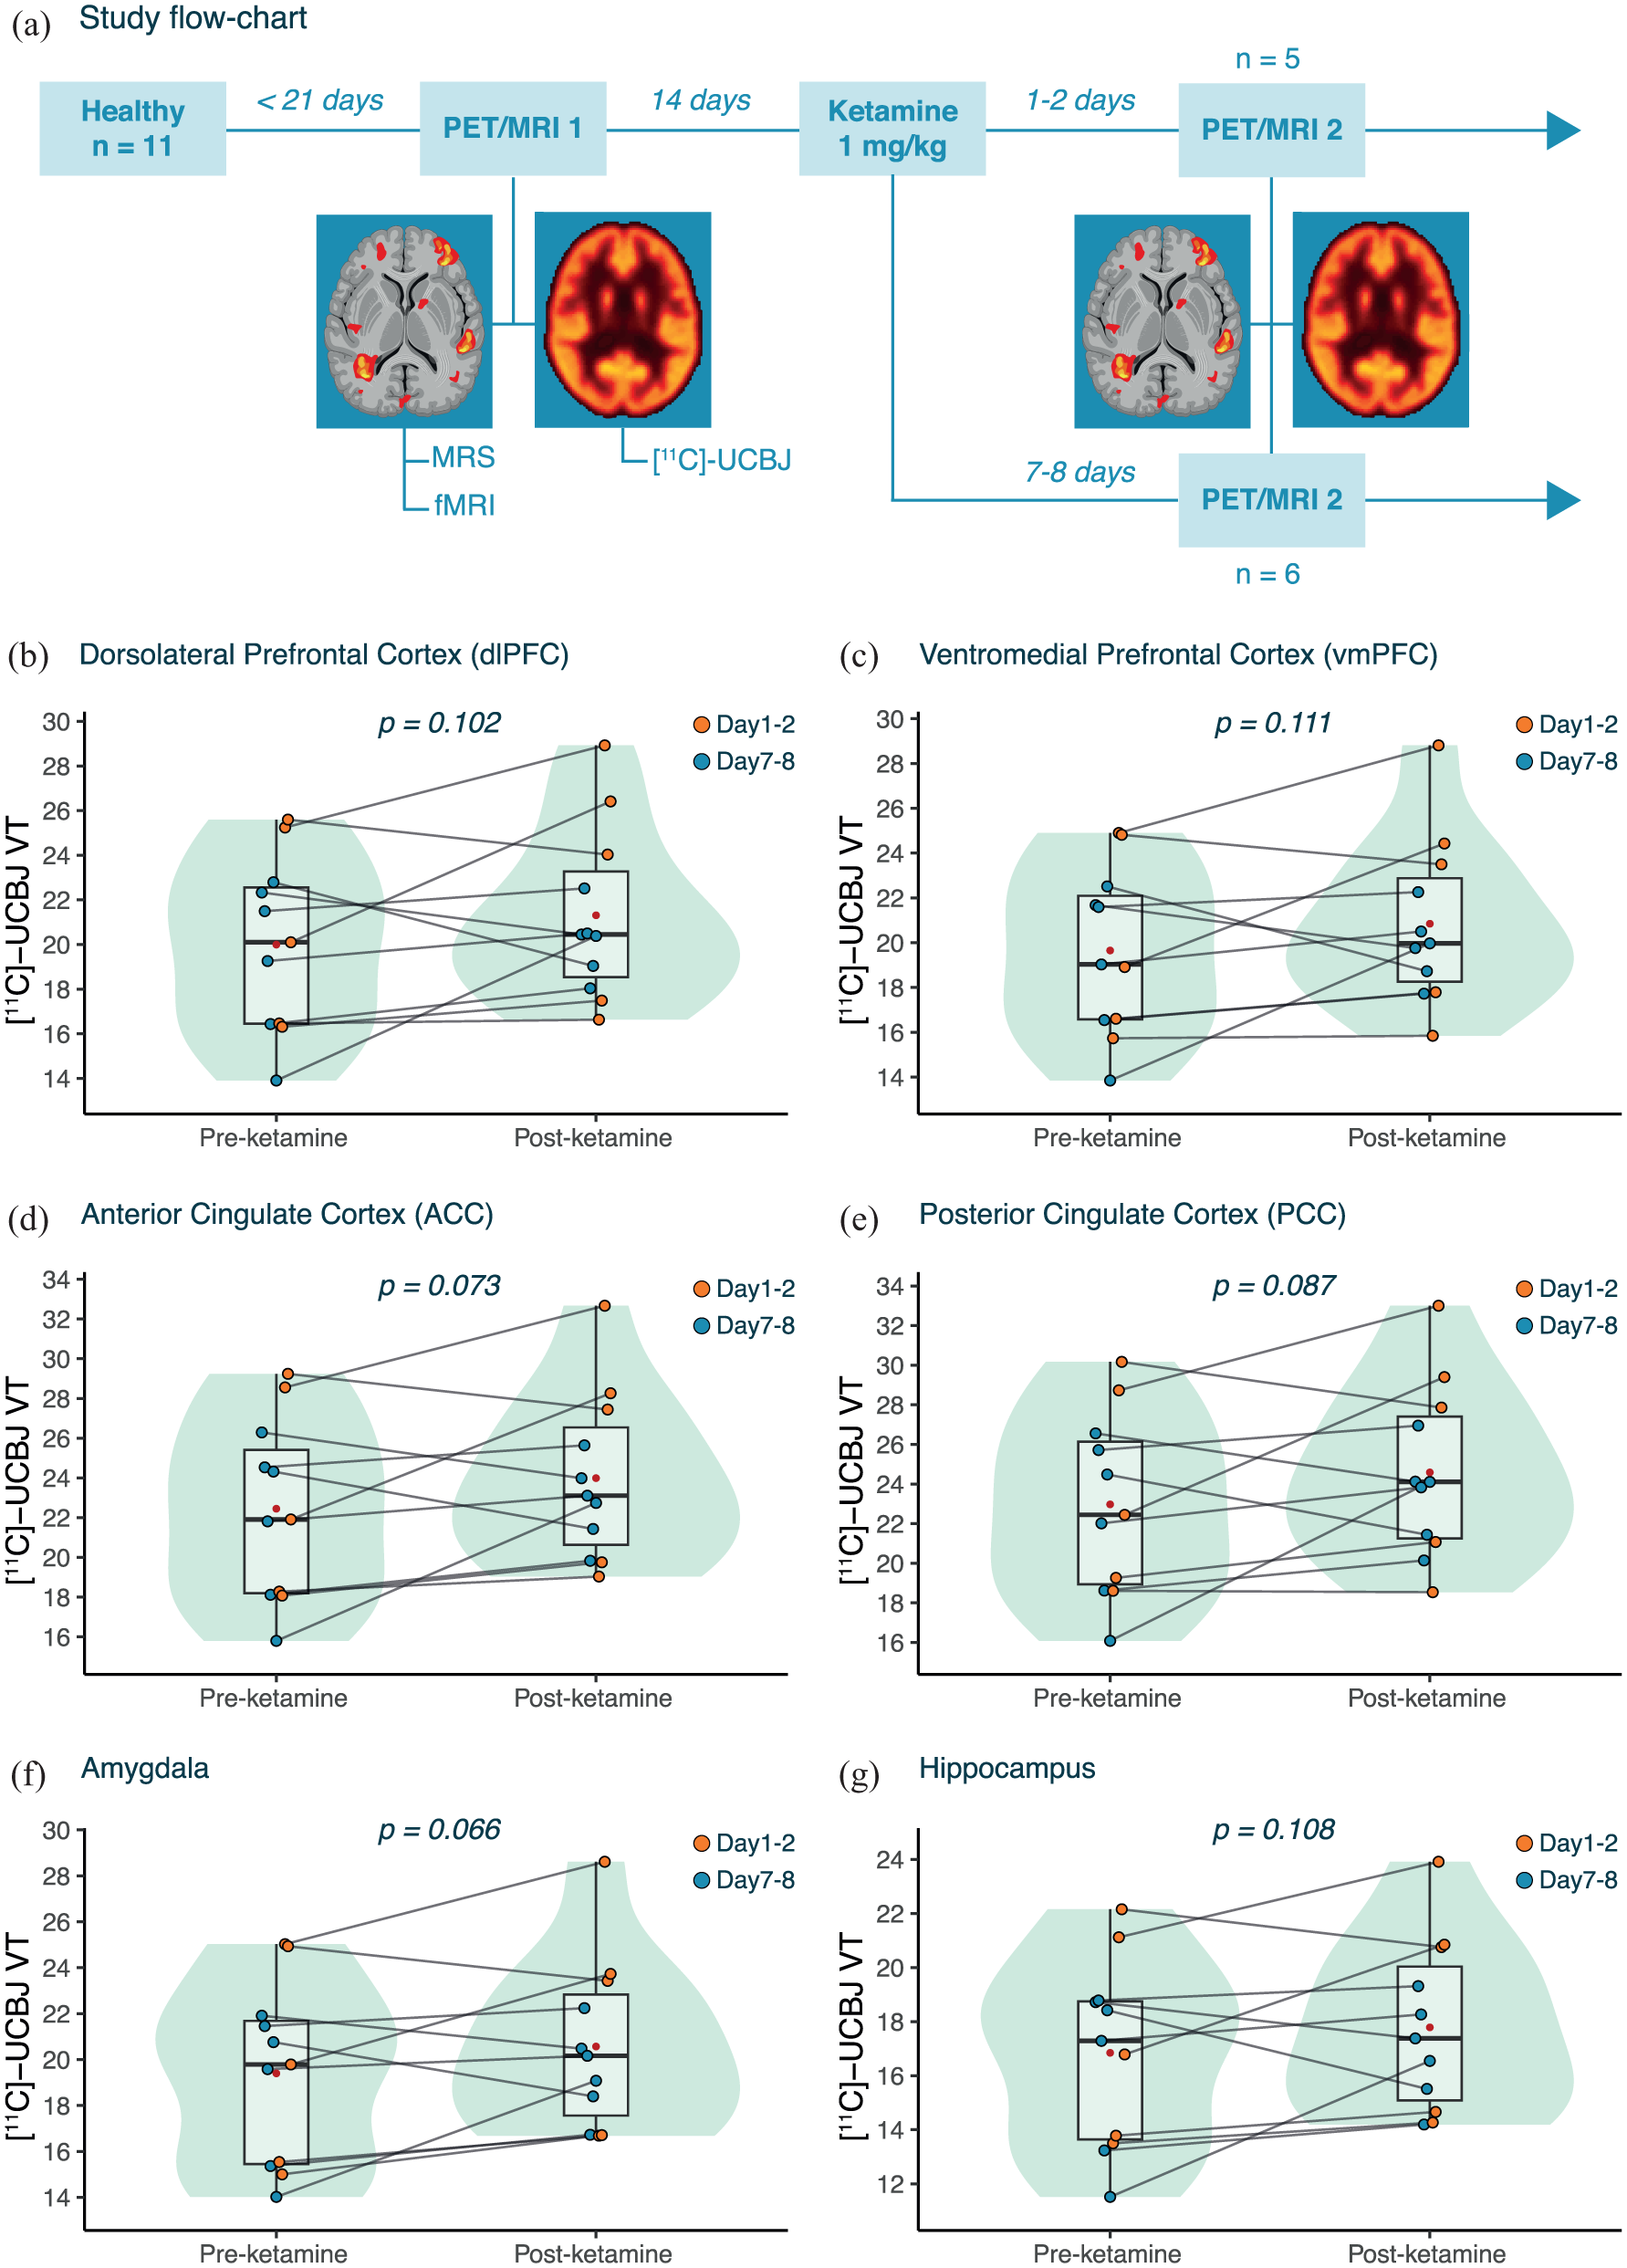
Effects of ketamine on [11C]-UCBJ VT. (a) The flowchart of the study design. (b–g) The change in [11C]-UCBJ VT in the (b) dlPFC, (c) vmPFC, (d) ACC, (e) PCC, (f) amygdala and (g) hippocampus. For each region, individual data points are shown (with data points coloured based on post-ketamine scan timing). The boxplots summarise the spread of [11C]-UCBJ VT values, showing the median and interquartile range, while the violin plot shows the distribution of the data. The mean is shown in red. All p-values are from one-sided LMM with α = 0.05.
Psychometrics
The psychological safety of participants during the acute effects of ketamine was assessed through the Brief Psychiatric Rating Scale (BPRS), 38 the Modified Observer’s Assessment of Alertness/Sedation (MOAA/S) scale, 39 and the 6-item version of the Clinician-Administered Dissociative States Scale (CADSS) (Table 1). 40 These scales were administered by the study physician immediately after completion of the ketamine infusion. Further, the Warwick-Edinburgh Mental Wellbeing Scale (WEMWBS) 41 and The Profile of Mood States (POMS) 42 questionnaires were administered at baseline, 1 week, and 4 weeks after ketamine to measure changes in well-being and mood, respectively.
PET/MRI acquisition and processing
The PET data were acquired using an integrated General Electric Signa 3 Tesla combined PET/MRI scanner with a 32-channel head coil at the Invicro Imaging Centre (now ‘Perceptive’), London, UK. The [11C]-UCBJ tracer was synthesised onsite and administered i.v. as a bolus over 20 s by the study physician. The PET scan acquisition time was 90 min in addition to 30 min of MRI scanning. For the PET modelling, the study employed the 1-tissue compartment model for reversible binding to correlate the parent plasma input function with tissue time-activity curves, producing estimates of the total VT for each predefined ROI. The fMRI data were acquired using an Echo-Planar Imaging sequence sensitive to BOLD contrast with the following settings: TR = 2000 ms, TE = 30 ms, flip angle = 80°, 3 mm × 3 mm in-plane resolution (64 × 64 matrix), slice thickness = 3.6 mm, 36 axial slices, 240 volumes, 10 min. In addition, a T1-weighted IR-SPGR sequence was acquired to provide an anatomical image (TI = 400 ms, TE = minimum, flip angle = 11°, 256 × 256 matrix, 1 mm isotropic voxels, sagittal slices). MRS data included two 1H-MRS scans: a PRESS-PROBE sequence (TE = 30 ms, 2 × 2 × 2 cm3, 96 averages) and a GABA- and GSH-edited HERMES sequence (TE = 76 ms, 2.5 × 2.5 × 3 cm3, NEX = 8). Voxels were positioned in the ACC based on previous evidence supporting its predominant role in ketamine’s mechanism of action. 43 After quality control, datasets from 2 subjects on the PRESS data were excluded, and 7 time points were excluded on the HERMES data. Thus, the data from the HERMES sequence were excluded from the main analysis (Supplemental Table 1). See Supplemental Data for full details on PET/MRI acquisition and processing.
PET analysis
Pre-defined ROIs were the dorsolateral (dlPFC) and ventromedial (vmPFC) prefrontal cortex, ACC, PCC, hippocampus and amygdala. The selection of the ROIs was based on previously published work on [11C]-UCBJ VT changes induced by ketamine within the DMN. 14 For additional analysis across regions, see Supplemental Data. The ROI-specific VTs, corrected for subregional volume, were the primary outcome measures of the study. Additional PET metrics were the Distribution Volume Ratio-1 (DVR-1), computed by dividing the ROI VT by the centrum semiovale (CS) VT (reference region) minus 1, and the plasma free-fraction (fp) corrected [11C]-UCBJ VT (VT/fp) (See Supplemental Data). For all analyses involving the combination of PET data with fMRI metrics, [11C]-UCBJ VT was selected as the main PET outcome. This choice was motivated by several reasons. First, VT was our pre-specified primary outcome measure. Also, there was a trend in the data suggesting a difference in the control region VT between pre- and post-ketamine visits, which could potentially influence DVR-1 estimates. Further, fp did not differ between sessions, indicating stable peripheral free fraction. Therefore, fp-correction was not expected to reduce session-related confounding but could have introduced additional variance. Lastly, no correlations were observed between the change in VT and the VT/fp and DVR-1 metrics, potentially due to the variance introduced by the DVR-1 and VT/fp normalisations (Supplemental Data).
fMRI functional connectivity (FC)
The mean BOLD timeseries of each fMRI scan was extracted from the same pre-defined ROIs used for PET analysis, including the dlPFC, vmPFC, ACC, PCC, hippocampus and amygdala. Brain FC was computed as the pairwise Pearson’s correlation between each ROI and the ACC, used as a seed region. The ACC was chosen as the seed region for the FC, consistent with previous investigations, 29 to test the complementary network effects of ketamine alongside its effects on glutamate concentration.
fMRI amplitude of low frequency fluctuations (ALFF)
To compute whole-brain intrinsic activity, ALFF measures were calculated using the Analysis of Functional Neuroimages (AFNI v.20.1.06) 3dRSFC module. ALFF is the power of the BOLD signal in the 0.01–0.1 Hz low-frequency range. The data in these analyses were band-pass filtered using a range of 0.01–0.1 Hz. As ALFF is sensitive to the raw values of the BOLD time series (which are arbitrary values), some normalisation of ALFF measures is standard practice. 44 In this case, Z-normalisation was used after ALFF analysis, where the mean of each participant’s ALFF image was divided by its standard deviation, to give an overall Z-score brain map for each participant (Supplemental Data).
Statistical analysis
A one-sided linear mixed-effect model (LMM) was used for within-subject analysis, measuring changes in WEMWEBS, POMS, fp, VT, DVR-1 and VT/fp measures of [11C]-UCBJ after ketamine administration (e.g. ROI_VT ~ Time + (1|Subject)). See Supplemental Data for analysis of ketamine effects across multiple regions. An interaction term was added to the model to test for the between-subject difference in [11C]-UCBJ metrics change before and after ketamine administration between participants who had their Scan 2 at 1–2 days following ketamine and those who had it at 7–8 days. For all models, the effect size was estimated using Cohen’s d. Also, the confidence of the result was estimated by computing the Bayes Factor (BF). The same statistical approach was adopted to test pre- to post-ketamine differences in ACC Glutamate concentrations (Two-sided). Pair-wise Spearman’s correlation tests were used to analyse the correlation between WEMWBS and CADSS scores, and between these psychological and the neural measures. The same test was used for correlations between [11C]-UCBJ VT, DVR-1, and VT/fp metrics and their difference following ketamine and to test for the correlation between glutamate concentrations and [11C]-UCBJ within the ACC. To account for FDR inflation due to multiple comparisons, the p-values resulting from Spearman’s tests were adjusted independently using the Benjamini-Hochberg adjustment. To measure the effects of ketamine on ALFF, we implemented a voxel-wise paired analysis using FSL’s FEAT with a second-level mixed-effects model (FLAME1). Results were thresholded at Z = 3.1, with a cluster p < 0.05.
To test for FC difference following ketamine administration, a permutation test (1000 permutations) was performed using the R coefficients resulting from Pearson’s correlation test between the mean pre- and post-ketamine fMRI scans. The p-values were corrected for multiple comparisons using Bonferroni correction across the five comparisons (i.e. α < 0.001).
To explore the correlation between the structural and functional measures acquired with PET and fMRI, respectively, a whole-brain data-driven approach was adopted. Voxel-wise Pearson’s correlations were performed between [11C]-UCBJ VT and ALFF datasets, following methods in Shatalina et al.,32,45 to explore correlations between PET and fMRI metrics in a whole-brain, data-driven approach. Statistical analyses were conducted in MATLAB 2023A and R 2024.
Results
Effects of ketamine on mood
We observed statistically significant reductions in POMS at 7 days (M: −15 ± 20; β = −14.82; p = 0.031), and 4 weeks (M: −14 ± 15; β = −13.91; p = 0.011) and a trend towards increases in WEMWBS at 7 days following ketamine (M: 6 ± 9; β = 5.64; p = 0.072), suggesting improvements in mood and wellbeing.
Effects of ketamine on [11C]-UCBJ
Our primary PET outcome measure was [11C]-UCBJ VT (See Materials and Methods). Assessments of the normality of the PET data and results from the normalised DVR-1 and VT/fp [11C]-UCBJ metrics are reported in Supplemental Data. With all subjects included in the analysis (n = 11), we observed no statistically significant increase in [11C]-UCBJ VT following ketamine administration in any of the analysed ROIs (Supplemental Table 2). Notably, there was a trend towards an increase in [11C]-UCBJ VT in all ROIs, approaching statistical significance in the amygdala (Figure 1(f); M: 7.33 ± 13.44%; β = 1.17; p = 0.066; d = 0.495; BF = 0.837) and the ACC (Figure 1(d); M: 8.53 ± 16.38%; β = 1.54; p = 0.073; d = 0.475; BF = 0.778). Also, no significant difference in the magnitude and direction of [11C]-UCBJ VT change following ketamine was detected between the Day 1–2 and Day 7–8 groups. All subsequent analyses are shown for the full sample as no significant difference in the effect of ketamine on our primary outcome [11C]-UCBJ VT was detected between the Day 1–2 and Day 7–8 groups, and to preserve statistical power.
Effects of ketamine on ACC glutamate
Ketamine produced a statistically significant increase in glutamate levels within the ACC (Figure 2(a); n = 9; M: 21.77 ± 25.35%; β = 2.92; p = 0.030, d = 0.878; BF = 2.70). There was a difference between the Day 1–2 and Day 7–8 groups in the magnitude of the pre- to post-ketamine change in ACC glutamate levels, such that the Day 7–8 group showed greater increases as compared to the Day 1–2 group (β = −4.32; p = 0.042; d = 1.662). See Supplemental Data for other MRS metrics.
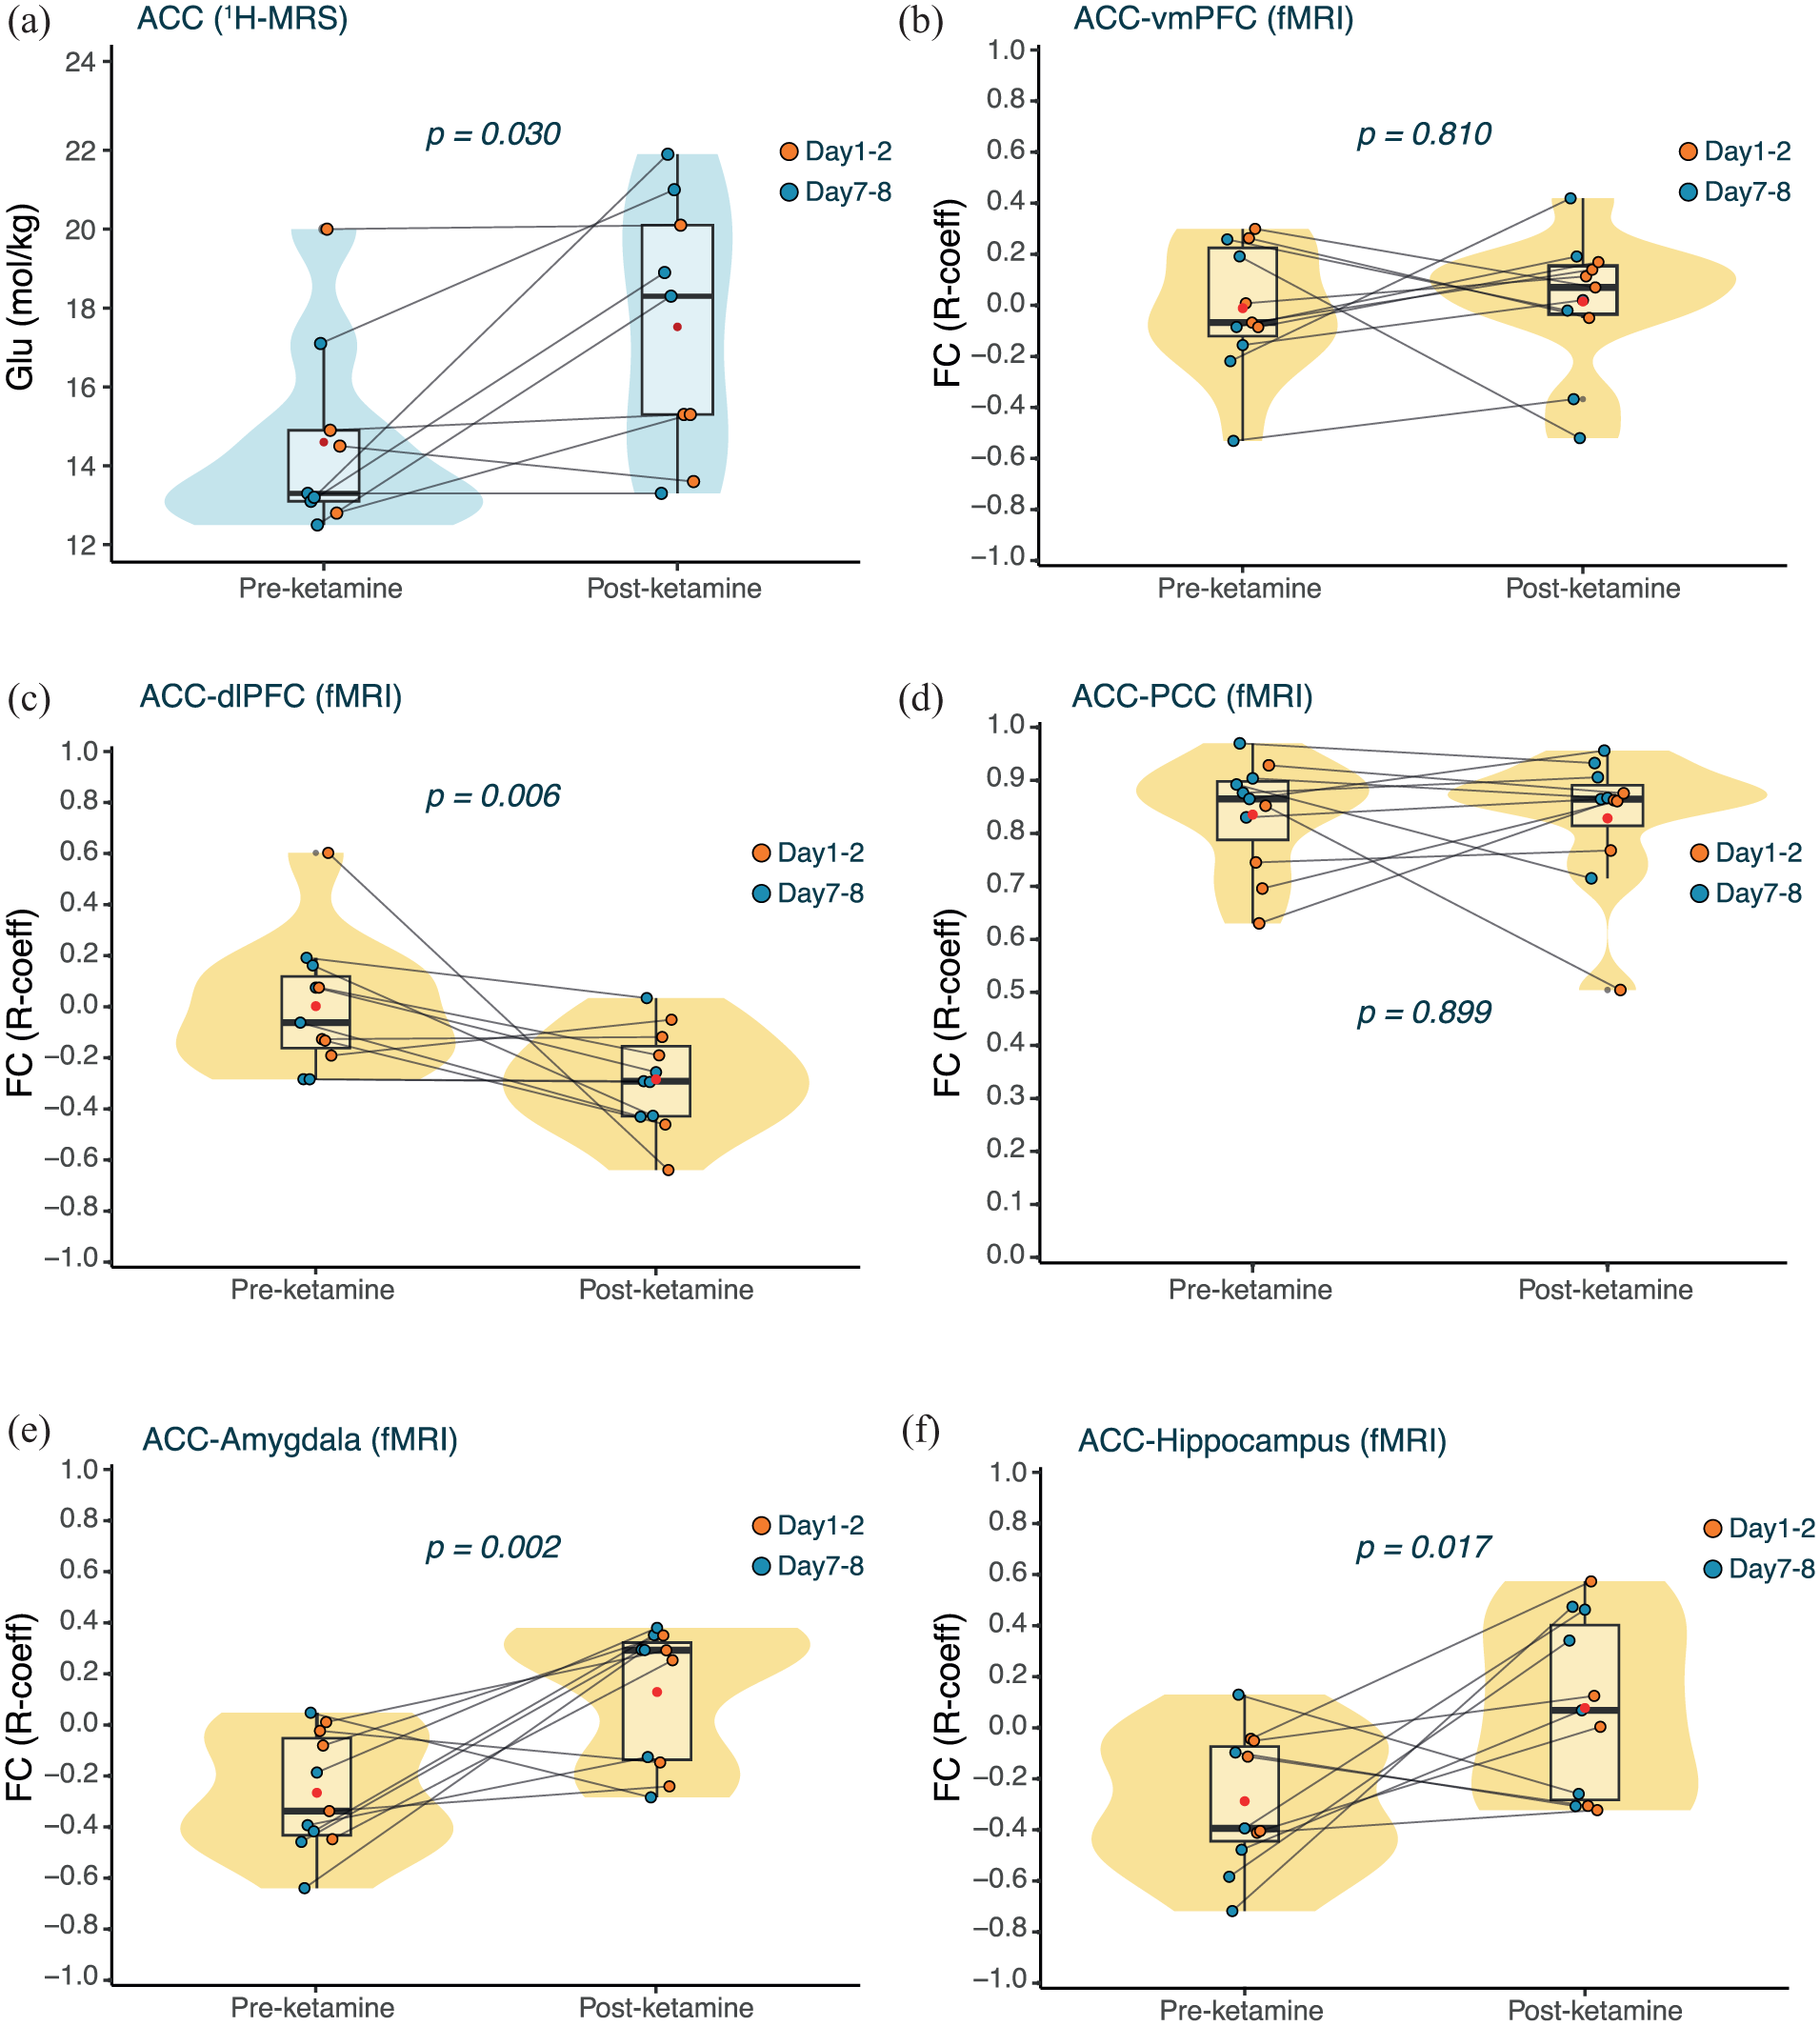
Effects of ketamine on glutamate concentration (1H-MRS) and FC (fMRI) measures. (a) Change in 1H-MRS Glutamate concentration (mol/kg) in the ACC after ketamine. The boxplot summarises the median and interquartile range, while the violin plot shows the distribution of the data before and after ketamine. The mean is shown in red. The p-value is derived from a two-sided LMM with α = 0.05. (b) Change in fMRI-derived FC between the ACC and the vmPFC after ketamine. (c) Change in fMRI-derived FC between the ACC and the dlPFC after ketamine. (d) Change in fMRI-derived FC between the ACC and the PCC after ketamine. (e) Change in fMRI-derived FC between the ACC and the amygdala after ketamine. (f) Change in fMRI-derived FC between the ACC and the hippocampus after ketamine. The boxplots summarise the median and interquartile range, while the violin plot shows the distribution of the data before and after ketamine. The mean is shown in red. All p-values are derived from permutation tests (1000 permutations) conducted on the Pearson’s correlation coefficients derived from the mean BOLD signal before and after ketamine, corrected for multiple comparisons using Bonferroni correction (α = 0.01).
Effects of ketamine on FC
To investigate the effects of ketamine on ACC-related network activity, the ACC was used as a seed region for FC analysis using our pre-defined ROIs. There was a statistically significant decrease in FC between the ACC and the dlPFC following ketamine (T-statistic = −0.29, p = 0.006, d = 1.27), suggesting a shift from weak positive correlation to anticorrelation between these two regions. Conversely, there was a significant increase in the FC between the ACC and the amygdala following ketamine administration (T-statistic = 0.39, p = 0.002, d = 1.63), suggesting a shift from weak anticorrelation to positive correlation between these two regions. We observed a similar increase in connectivity between the ACC and the hippocampus, but it did not survive correction for multiple comparisons (T-statistic = 0.37, p = 0.017, d = 1.21). All data are summarised in Figure 2(b) to (f).
Correlation between [11C]-UCBJ VT and mood changes
No statistically significant relationships were found between changes in [11C]-UCBJ VT and long-term changes in WEMWEBS and POMS in any of the analysed ROIs (Supplemental Table 7).
Correlation between ACC [11C]-UCBJ VT and glutamate
No statistically significant relationship was found between changes in glutamate and [11C]-UCBJ VT within the ACC following ketamine administration (n = 9; ρ = 0.01, p = 0.980).
Correlation between whole-brain [11C]-UCBJ VT and ALFF
Ketamine produced a statistically significant reduction in ALFF only in a small region of the occipital cortex (n = 11; FLAME-1, Z > 3.1, cluster p < 0.05; Figure 3(a)). Correlations between baseline ALFF and ∆[11C]-UCBJ VT are reported in Supplemental Data. There were significant negative correlations between ∆ALFF and ∆[11C]-UCBJ VT, suggesting that a greater positive change in VT was associated with decreased ALFF following ketamine administration. As reported in Figure 3(b), these correlations were found in regions spanning the PCC, praecuneus, parietal regions, precentral gyrus, postcentral gyrus, superior frontal gyrus, right temporal lobe, overlapping with DMN regions (n = 11).
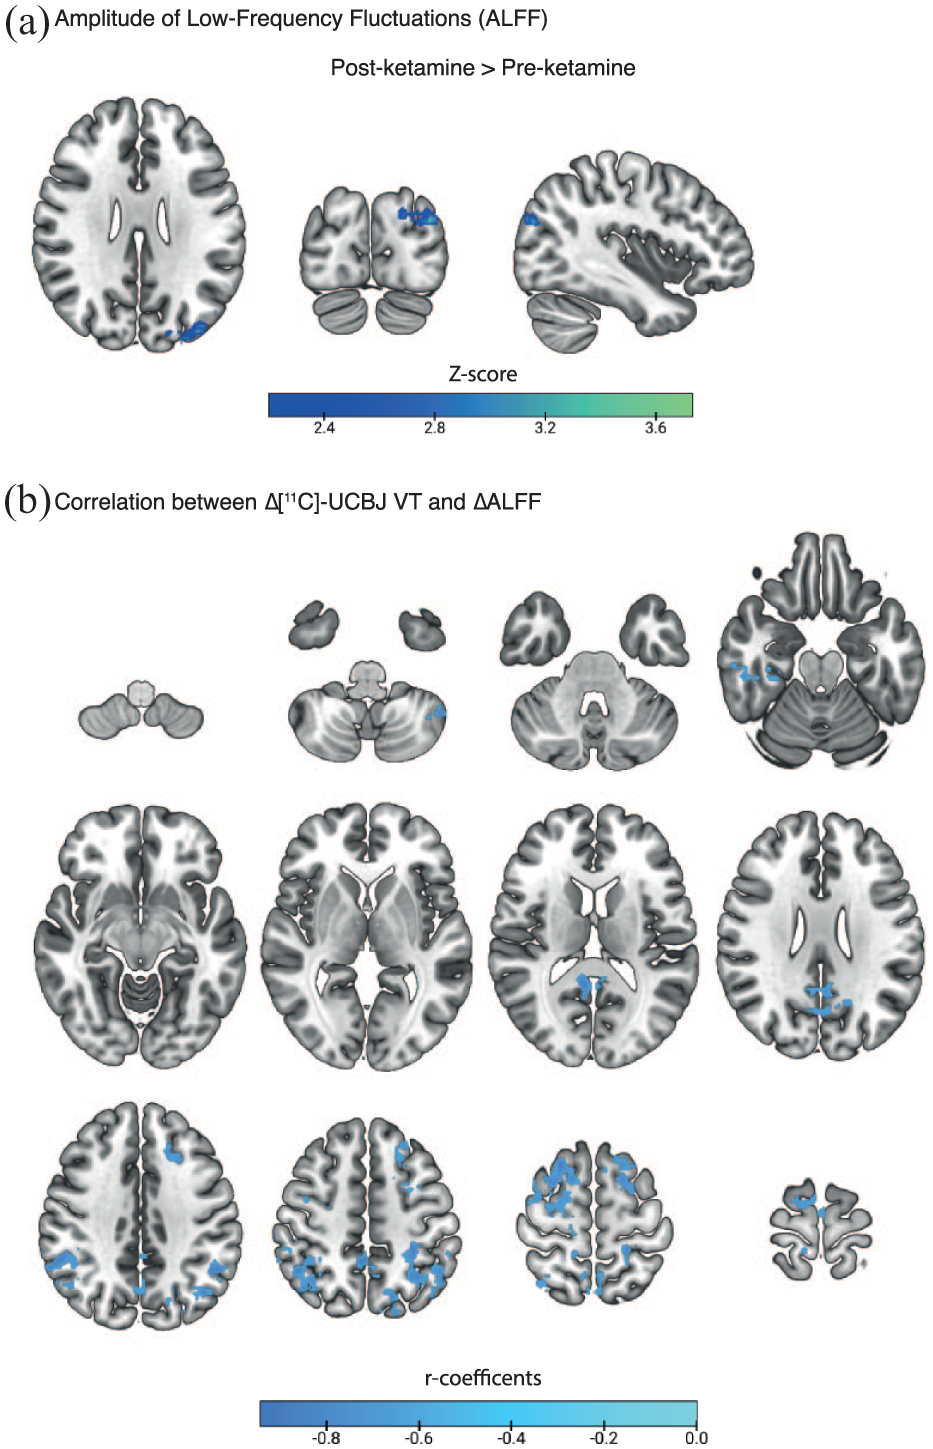
Ketamine effects on ALFF and correlation between [11C]-UCBJ VT and ALFF. (a) Change in whole-brain ALFF after ketamine. Results are derived from a voxel-wise paired analysis with a second-level mixed-effects model (FLAME1). Results were thresholded at Z = 3.1, with a cluster p < 0.05. (b) Correlation between whole-brain ∆[11C]-UCBJ VT and ∆ALFF. The r coefficient images from voxels showing significant Pearson’s correlations were transformed to t-statistical images and converted to Z-scores. Images were thresholded at Z = 2.3, with cluster extent brain thresholding applied at p < 0.05 to correct for multiple comparisons across the brain.
Discussion
A single sub-anaesthetic ketamine dose did not produce a statistically significant increase in [11C]-UCBJ 1–8 days post administration within DMN regions in healthy male participants. Additionally, no differences were found between participants scanned 1–2 days after ketamine administration and those scanned 7–8 days after, in any of the analysed PET metrics and ROIs. However, we observed a robust and sustained increase in glutamate concentrations within the ACC following ketamine administration, particularly pronounced at 7–8 days after drug. Further, we observed significant changes in functional coupling between the ACC and the dlPFC and between the ACC and the amygdala. Our exploratory, whole-brain, multimodal PET/fMRI analysis revealed that alterations in synaptic plasticity, as captured via [11C]-UCBJ VT, were inversely related to changes in intrinsic regional brain activity measured via ALFF, emerging in brain areas belonging to the DMN. Taken together, our findings suggest a complex and heterogeneous spatiotemporal effect of ketamine on neural plasticity, glutamate dynamics and functional brain activity and connectivity across different scales. Notably, we detected significant improvements in mood that were maintained for up to 4 weeks following a single dose of ketamine in our healthy adult sample. However, these changes did not correlate with changes in [11C]-UCBJ VT and the interpretability of these behavioural findings is restricted by the small sample size and the fact that our study enrolled only male healthy volunteers.
While the change in [11C]-UCBJ VT following ketamine was not statistically significant, there was a trend towards an increase in our pre-defined ROIs. The trend was further explored with an additional analysis across the pre-defined ROIs and whole-cortex (See Supplemental Data). When analysing all pre-defined ROIs collectively in a single model, we observed a statistically significant increase in [11C]-UCBJ VT after ketamine (p < 0.001). The whole-cortex analysis yielded similar significant results (p < 0.001). However, when we calculated volume-weighted averages of either the pre-defined ROIs or all cortical regions, the results mirrored our initial findings, showing a non-significant trend (p = 0.092). An in-depth discussion of this analysis is presented in the Supplemental Data. The [11C]-UCBJ DVR-1 and VT/fp normalised metrics showed no change following ketamine exposure, but those metrics had validity issues. Notably, the VT trend was also present in the CS reference region used for DVR-1, which undermines the interpretability of the DVR-1. Also, the [11C]-UCBJ VT and VT/fp did not covary following ketamine, and fp itself did not differ after ketamine, suggesting increased variance introduced by the VT/fp normalisation (Supplemental Data). Overall, our results do not provide conclusive evidence of a group-level increase in synaptic plasticity within the DMN induced by a single psychedelic dose of ketamine (1 mg/kg) in healthy human brains at 1–8 days post-administration, potentially due to high individual variability in drug neuroplastic response. Nonetheless, the presence of a trend is noteworthy, warranting replication in a larger sample size.
Our results broadly align with the study by Holmes et al., 14 which also provided inconclusive evidence regarding a unidirectional effect of ketamine (0.5 mg/kg) on synaptic SV2A within DMN regions, as measured via [11C]-UCBJ, in both healthy and depressed individuals 1 day post-drug administration. Several factors could account for the absence of sizeable changes in [11C]-UCBJ following ketamine. While we employed double the dosage of Holmes et al., 14 approximating those commonly used in pre-clinical studies 3 and the highest titration dose used in psychiatric practice, 37 the absence of a robust effect on [11C]-UCBJ suggests that changes in synaptic plasticity in humans (if they could be imaged at all) might require multiple doses to be detected via PET. This is supported by research showing that some patients require multiple ketamine doses to achieve therapeutic benefit, associated with significant structural and functional alterations.46–48 Another possibility is that ketamine’s effects on plasticity may be more pronounced in patients with depression, as supported by some clinical14,48 and preclinical observations.49,50 Also, [11C]-UCBJ binding reductions were detected in advanced 12 but not early-stage schizophrenia, 51 suggesting that [11C]-UCBJ may be more effective as a biomarker in cases of substantial neural remodelling, such as observed in severe patient populations. Lastly, multiple physiological factors may have influenced the [11C]-UCBJ VT results (see Supplemental Data for discussion on sleep).
Within the ACC, ketamine produced a statistically significant increase in glutamate concentrations, with the effect particularly pronounced in the Day 7–8 group. The glutamate ‘surge’ induced by psychedelic doses of ketamine is generally thought to be acute,52,53 not extending beyond the drug’s presence in the body, as previous studies did not detect significant changes in glutamate concentrations at 1–2 days post-ketamine in either healthy subjects or depressed patients.54,55 However, using high-resolution MRS, Li et al. 56 found an increased glutamine/glutamate ratio measured in the ACC 1 day post ketamine administration in healthy volunteers, while another study found a significant glutamate increase at 7 days. 57 Alongside our findings, the persistence of elevated glutamate from 1 to 8 days post-administration challenges the model of ketamine-induced glutamate increase as purely transient. Yet, differences in scanning sequences and acquisition methodologies across studies might account for the variability in the results. The predominant framework, largely based on pre-clinical evidence, proposes that ketamine induces an acute disinhibition of frontocortical pyramidal neurons, via suppression of inhibitory interneurons following ketamine-mediated N-methyl-D-aspartated (NMDA) receptor antagonism, triggering downstream signalling cascades that can promote synaptic remodelling over hours to days. 3 In our limited sample of healthy male participants, we did not observe an association between the ketamine-related increase in ACC glutamate and synaptic plasticity within the same region. Nevertheless, the observed persistence of increased glutamate concentrations beyond acute drug exposure is noteworthy and may point to a more enduring shift in excitatory/inhibitory (E/I) balance within the ACC following ketamine. This is relevant as dysregulation of cortical E/I balance has been proposed to contribute to depressive symptomatology, and ketamine may transiently recalibrate these processes through glutamatergic mechanisms. 58 Importantly, the ACC has been repeatedly implicated as a locus of ketamine’s antidepressant action across human neuroimaging and animal work, including evidence linking ketamine-related modulation of ACC activity and circuitry to antidepressants and anti-anhedonic effects. 43 In this context, our ACC-seeded fMRI functional connectivity analysis indicates that ketamine significantly altered ACC coupling with both the dlPFC and amygdala. Specifically, ketamine shifted the baseline anticorrelation between ACC and amygdala towards positive coupling, while shifting the weak baseline correlation between ACC and dlPFC activity towards anticorrelation. Although these findings are not a test of antidepressant efficacy in this healthy-volunteer study, the reconfiguration of ACC connectivity with fronto-limbic regions is broadly consistent with previous evidence and suggests ketamine’s therapeutic effects may involve perturbing maladaptive ACC-PFC hypersynchrony observed in depressive states and reconfiguring ACC interactions with limbic circuitry.29,43 Nonetheless, given the small sample and correlational nature of our results, these interpretations remain provisional and require replication in adequately powered clinical studies and, ideally, causal designs. At the whole-brain level, we observed a trend towards a decrease in intrinsic brain activity, measured via ALFF, which was statistically significant only in a small region of the occipital cortex. Previous studies using fractional ALFF, instead of raw ALFF, during ketamine infusion reported either global18,59 or occipital-specific19,60 reductions, aligning with our observation. Notably, one of these studies indicated that the effect diminished by 1 day post-administration, which may account for the lack of statistical significance observed in our data. 19 ALFF quantifies the power of infra-slow (0.01–0.1 Hz) BOLD signal fluctuations at the voxel level. Multimodal evidence indicates BOLD signal changes correlate with high-frequency synchronised neural activity, as measured via integrated fMRI/electroencephalography (EEG). In landmark studies, it was shown that regional ketamine-induced BOLD signal changes and connectivity patterns follow different temporal profiles of EEG desynchronisation of oscillatory activity.21,59,61 However, no clear relationships between the EEG metrics and fractional ALFF were detected during ketamine administration, suggesting a complex relationship between those metrics under pharmacological perturbation. 59 While the reduction of ALFF observed in our study might be a product of ketamine-induced perturbation of synchronous neural activity in the infra-slow range or at higher frequencies, attenuated in effect size due to the temporal distance from the infusion, more research is needed to elucidate the physiological source of this effect.
Our exploratory multimodal analysis revealed intriguing neural dynamics associated with ketamine-induced alterations of synaptic plasticity. A negative relationship was found between changes in [11C]-UCBJ VT and ALFF following ketamine, meaning that participants showing an increase in synaptic plasticity following ketamine also showed reductions in intrinsic brain activity. Interestingly, these effects emerged specifically in regions belonging to the DMN, despite our data-driven, whole-brain approach. At baseline, no correlation was observed in the same regions between [11C]-UCBJ VT and ALFF, but there was a positive correlation between these metrics in other lower-order brain regions (Supplemental Data). It has been proposed that the DMN involvement with narrative-self-referential processes makes it responsible, when overactivated, for ruminative and negative thought loops, characteristics of depressive symptomatology.22,23 Hence, similar to classic psychedelics, 62 the perturbation of DMN functioning produced by ketamine may recalibrate the network activity by flattening its apical position in the cortical hierarchy and promoting its integration with bottom-up processes. Our results also suggest that ketamine’s modulation of DMN activity is sustained in the long term and is paralleled by increases in synaptic plasticity. We speculate that the observed effect of ketamine may offer a precise spatiotemporal window for therapeutic intervention. However, our interpretation is tentative and specific hypothesis-driven approaches are required to confirm the validity of our findings.
Importantly, our experimental design presents several limitations. First, the limited sample size (n = 11) significantly constrained our statistical power and included only male subjects, limiting generalisability. Additionally, none of the participants were naïve to classic psychedelics, although most participants were ketamine-naïve and all had abstained from ketamine and classic psychedelics for at least 6 months before study entry. Participants were scanned at varying time points post-ketamine (1–8 days) to capture a comprehensive view of ketamine’s temporal effects on [11C]-UCBJ. However, this approach reduced the specificity of our group-level analyses. Limitations inherent to the [11C]-UCBJ tracer also present challenges for examining the subtle and dynamic neuroplastic effects induced by pharmacological interventions in humans in vivo. Indeed, it is likely that the spatial resolution (~2–3 mm) of [11C]-UCBJ PET imaging is insufficient to accurately capture the dynamic synaptic alterations induced by ketamine in the living brain. The [11C]-UCBJ tracer targets a pre-synaptic protein that is ubiquitously expressed across neuronal populations, failing to capture the neural population-specific effects captured by animal research. 3 Also, most of the evidence reports that ketamine primarily exerts post-synaptic effects on neuroplasticity, such as increased dendritic spine density, with only a fraction of these spines maturing into functional synapses. 10 Preclinical research indicates that sub-anaesthetic ketamine doses increase spine density by 12%–50%, with approximately 20% of these new spines developing into functional synapses. 63 This translates to an estimated 3%–10% increase in synaptogenesis, which is within the range of effects observed in our study and by Holmes et al. 14 in severe depression. However, it has also been reported that ketamine has inhibitory effects on neurotransmitter recycling and vesicle trafficking, adding further complexity to interpreting SV2A as a plasticity marker. 64 Lastly, increases in SV2A could also result from a rise in the number of vesicles at the presynaptic terminal, potentially due to Hebbian learning, or from changes in the number of SV2A molecules per vesicle. 65 Therefore, while [11C]-UCBJ is among the most precise tracers currently available for in vivo imaging of synaptic plasticity, the specific process it captures remains uncertain.
Despite these limitations, our comprehensive multimodal assessment yielded promising results, serving as a proof-of-concept for using integrated PET/MRI to characterise ketamine’s pharmacodynamic effects. While unimodal effect sizes for the main effects of ketamine on PET metrics were limited, the MRS and fMRI analyses provided novel insights into sustained ketamine effects on glutamate concentrations and network dynamics across the DMN, respectively. Our data-driven approach also highlighted the DMN regions as a key substrate for ketamine’s cross-modal effects, linking changes in synaptic plasticity markers with intrinsic brain activity, offering valuable guidance for future hypotheses with meaningful clinical potential in developing targeted interventions.
Supplemental Material
sj-docx-1-jcb-10.1177_0271678X261431447 – Supplemental material for Detecting neuroplastic effects induced by ketamine in healthy human subjects: A multimodal approach
Supplemental material, sj-docx-1-jcb-10.1177_0271678X261431447 for Detecting neuroplastic effects induced by ketamine in healthy human subjects: A multimodal approach by Claudio Agnorelli, Joseph Peill, Gabriela Sawicka, Danielle Kurtin, Ekaterina Shatalina, Kirran Ahmad, Matthew B Wall, Catarina Rua, Kate Godfrey, Natalie Ertl, Graham Searle, Katie Zhou, Martin Osugo, Brandon Weiss, Kyle T Greenway, Andrea Fagiolini, Robin Carhart-Harris, Paul M Matthews, Eugenii A Rabiner, David Nutt and David Erritzoe in Journal of Cerebral Blood Flow & Metabolism
Footnotes
Acknowledgements
We thank GE for funding support and Imperial College London for sponsorship and study governance. A special thanks to Central & North West London NHS Foundation Trust and its staff for supporting and hosting the study in the CNWL-Imperial collaborative research space, CIPPRes Clinic at St Charles Hospital. We thank the NOCLOR team for CIPPRes-site governance, CNWL’s lead pharmacists, Tf Chan and Allan Sebti, for invaluable help with study drug processes, as well as Trust Directors Drs Jo Emmanual, Jasna Munjiza and Cornelius Kelly for welcoming and hosting the Imperial-based research team in CIPPRes Clinic. We also thank all the volunteers for their participation.
Author contributions
C.A. contributed to study design and setup, data collection, statistical data analysis and manuscript writing. J.P. contributed to the study design and setup, data collection and manuscript writing. G.Sa. contributed to the data collection and manuscript writing. D.K. contributed to the PET/fMRI data analysis, figures and manuscript writing. E.S. contributed to the PET/fMRI data analysis and manuscript writing. K.A. contributed to the study design and setup, data collection and manuscript writing. M.W. contributed to study design and setup, the PET/fMRI data analysis and manuscript writing. C.R. contributed to the MRS data analysis and manuscript writing. K.G. contributed to the study setup, the PET/fMRI data analysis and manuscript writing. N.E. contributed to fMRI data analysis and manuscript writing. G.Se. contributed to PET analysis and manuscript writing. K.Z. contributed to the data collection and manuscript writing. M.O. contributed to the data collection. B.W. contributed to statistical data analysis and manuscript writing. K.T.G. contributed to study design and manuscript writing. A.F. contributed to study supervision and manuscript writing. E.R. contributed to study design and setup, study supervision, statistical data analysis and manuscript writing. R.C-H. contributed to study design and manuscript writing. D.N. and P.M. contributed to acquisition of funding, study design and setup, as well as manuscript writing. D.E. contributed to study design and setup, study management, data collection, study supervision and manuscript writing.
Declaration of conflicting interests
The authors declared the following potential conflicts of interest with respect to the research, authorship, and/or publication of this article: E.A.R., M.B.W., C.R., N.E.’s primary employer is Perceptive Inc. a contract research organisation which provides services to the pharmaceutical and biotechnology industries. M.B.W. has also received travel support and honoraria from Compass Pathways. D.E. acts as a paid scientific advisor for Aya Biosciences, Lophora Aps, Clerkenwell Health, Mindstate Design Lab. P.M.M. is a consultant for Biogen, Novartis, Nodthera, Sudo Therapeutics and GSK. He is receiving research funding from Perceptive and Biogen. All the other authors have no conflict of interest to disclose.
Funding
The authors disclosed receipt of the following financial support for the research, authorship, and/or publication of this article: GE Healthcare Global Research Organization’s Investigator-Initiated Study Program.
ORCID iDs
Data availability
Data and codes are available upon direct request to the authors. Address correspondence to Claudio Agnorelli at
Supplemental material
Supplemental material for this article is available online.