
Abstract
Arterial spin labeling (ASL) perfusion magnetic resonance imaging (MRI) with image acquisition at multiple inversion times is a noninvasive ASL technique able to compensate for spatial heterogeneities in transit times caused by collateral blood flow in patients with severe stenosis of the cerebropetal blood vessels. Our aim was to compare ASL-MRI and H215O positron emission tomography (PET), the gold standard for cerebral blood flow (CBF) assessment, in patients with a symptomatic internal carotid artery (ICA) occlusion. Fourteen patients (63±14 years) with a symptomatic ICA occlusion underwent both ASL-MRI and H215O PET. The ASL-MRI was performed using a pulsed STAR labeling technique at multiple inversion times within 7 days of the PET. The CBF was measured in the gray-matter of the anterior, middle and posterior cerebral artery, and white-matter. Both PET and ASL-MRI showed a significantly decreased CBF in the gray-matter of the middle cerebral artery in the hemisphere ipsilateral to the ICA occlusion. The average gray-matter CBF measured with ASL-MRI (71.8±4.3 mL/min/100 g) was higher (
Keywords
Introduction
Patients with ischemic stroke or transient ischemic attacks and an occlusion of the internal carotid artery (ICA) have a 5% to 6% risk of developing stroke per year (Klijn et al, 2001). In those with compromised cerebral blood flow (CBF) this risk is even higher, approximately 9% to 18% per year (Grubb et al, 1998; Vernieri et al, 1999; Klijn et al, 2000). For therapeutic decisions, it is therefore important to be able to identify patients with hemodynamic compromise who are at high risk of recurrent ischemic stroke. Numerous techniques have been developed that are capable of assessing CBF
Arterial spin labeling (ASL) is an MRI technique that can noninvasively assess CBF by magnetically labeling the arterial water spins with a radiofrequency pulse (Williams et al, 1992; Detre et al, 1992; Edelman et al, 1994; Golay et al, 2004). In clinical studies, it has been used to assess perfusion in neurodegenerative diseases, epilepsy, central nervous system neoplasms, and vascular malformations (Wolf and Detre, 2007). However, a disadvantage of ASL-MRI is that in patients with cerebrovascular disease, the quantification of CBF is hampered by the recruitment of additional blood flow through collateral pathways (Liebeskind, 2003). These alternative pathways of blood flow lead to a delayed arrival of the labeled blood bolus to the brain (Gibbs et al, 1984; Alsop and Detre, 1996; Calamante et al, 1996). As most ASL-MRI techniques acquire the labeled images at a fixed time after the initial labeling of arterial blood, it is possible that the magnetic label may not have reached the imaging plane, leading to underestimation of CBF. Recently, ASL-MRI with acquisition of a series of images at increasing delay times after the initial labeling has been introduced as a method to compensate for such blood transit delays. Although researchers have previously compared the results of ASL-MRI to established perfusion imaging techniques (Ye et al, 2000; Pell et al, 2003; Floyd et al, 2003), no such verification has been performed with ASL-MRI at multiple delay times.
The purpose of this study was to evaluate the accuracy of CBF measurements with ASL-MRI at multiple delay times in patients with a symptomatic carotid occlusion by comparing these to CBF measurements acquired with dynamic H215O PET measurements. We compared quantitative values of CBF in mL/min/100g tissue and qualitative CBF estimates, expressed as an ipsilateral to contralateral ratio, for different brain regions.
Materials and methods
The institutional review board approved the study protocol and written informed consent was obtained from all participants.
Study Population
Fourteen patients (nine men and five women, mean age 63 ± 14 years) with a symptomatic ICA occlusion were examined with both ASL-MRI and H215O PET within a timeframe of 7 days. All patients had transient or minor-disabling neurologic deficits (modified Rankin score of 0, 1, or 2) (Bamford et al, 1989) in the supply territory of the occluded ICA within 3 months before inclusion. Of the 14 patients, 1 patient had symptoms within the last 2 weeks before inclusion, 4 patients within 1 month, 7 within 2 months, and 2 patients within 3 months. Occlusion of the ICA was confirmed with intraarterial digital subtraction angiography and the stenosis grade of the contralateral asymptomatic ICA was assessed in accordance with the NASCET criteria (Fox, 1993).
Positron Emission Tomography Imaging
The PET investigations were performed on an ECAT EXACT HR+ scanner (CTI/Siemens, Knoxville, TN, USA). The characteristics of this scanner have been described earlier elsewhere (Brix et al, 1997). All subjects were scanned under standard conditions: dimmed lights and music off. All scans were corrected for photon attenuation and scatter using a 10-min transmission scan. Each study consisted of a H215O PET scan. To measure CBF, a bolus of 1100 MBq H215O (bolus injection of ∼5 secs) was administered intravenously, while simultaneously starting a 3D emission scan (25 frames over a period of 600 secs). All scans were reconstructed using FORE + 2D FBP reconstruction with a Hanning filter at Nyquist frequency. A matrix size of 256 × 256 and a zoom of 2.1 was applied resulting in voxel sizes of 1.2 × 1.2 × 2.4 mm3 and the final image resolution equalled about 7 mm FWHM. For all scans, the arterial input function was measured using an online continuous blood sampling device (Boellaard et al, 2001). Three manual arterial blood samples, at 5.5, 8, and 10 mins were taken for calibration purposes. Parametric CBF images were generated using a basis function implementation of the CBF model, including corrections for dispersion, delay, and arterial blood volume, as described earlier (Boellaard et al, 2005).
Magnetic Resonance Imaging
The ASL-MRI scans were performed on a 3 T Philips Achieva (Philips Medical Systems, Best, the Netherlands) within 7 days of the PET examination. A quadrature head coil was used for radiofrequency transmission and signal reception. Anatomical MR images were acquired using a 3D T1-weighted fast-field-echo and a T2-weighted fluid-attenuated inversion-recovery (FLAIR) sequence with the following parameters: repetition time (TR), 18 (T1), and 11,000 (FLAIR) ms; echo time (TE), 2.1 (T1), and 125 (FLAIR) ms; inversion time FLAIR, 2800 ms; matrix size, 240 × 240 with 64 (T1), and 24 (FLAIR) slices; slice thickness, 2 mm; field-of-view (FOV), 240 × 240 mm.
A pulsed STAR labeling technique with a Look-Locker-like readout strategy (Look and Locker, 1970) at multiple delay times was used for ASL-MR perfusion imaging (Petersen et al, 2006). For image acquisition, a series of 13 35° excitation pulses were applied, with increasing delay times from 200 to 2600 ms with a constant interval of 200 ms, followed by single shot gradient echo-planar-imaging readout. The perfusion-imaging slice was planned just above the ventricles through the semioval center and aligned parallel to the orbitomeatal angle. A 140-mm thick labeling slab was set 8 mm below the imaging slice. Perfusion images were obtained by subtracting the control images from the labeled images. Other parameters for MR perfusion imaging were TR/TE, 4000/23 ms; 62% partial Fourier acquisition; SENSE, 2.5; averages, 50; matrix, 64×64; FOV, 240 ×240 mm; slice-thickness, 7 mm; scan time, 5 mins.
Analysis of the acquired images was performed with custom software written in IDL, version 6.0 (Research Systems Inc, Boulder, CO, USA). The CBF was quantified using the perfusion model of Buxton et al (1998), with the adaptations as proposed by Gunther et al (2001). The equilibrium magnetization M0,a of the arterial blood was estimated by fitting the unlabeled signal in the brain tissue to a saturation–recovery curve. The CBF was calculated by a fit of the signal difference (ΔM) to the perfusion model with the following values for the physical constants: R1 (longitudinal relaxation rate of tissue), 1.2 ms; R1a (longitudinal relaxation rate of blood), 1.65 secs; λ (brain/blood partition coefficient of water), 0.9 mL/g (Herscovitch and Raichle, 1985; Barth and Moser, 1997).
Registration and Cerebral Blood Flow Analysis
The anatomical MR images were coregistered with the echo-planar ASL-MR and summed PET images. Coregistration consisted of finding a rigid transformation (three rotations, three translations) based on the maximal mutual information of the images (Maes et al, 1997). The slice corresponding to the imaging slice of the ASL-MRI examination was determined for the T1-weighted MR images. In this slice, the region of interest (ROI) selection was performed for the gray-matter in the flow territory of the anterior (ACA), middle (MCA) and posterior cerebral artery (PCA), and white-matter (Figure 1). Selection of the ROIs was performed for all subjects on the basis of established flow territory templates (Tatu et al, 1998). Areas of hyperintensities on the FLAIR MR images, depicting areas of infarction, were manually excluded from the ROIs. The obtained ROIs were subsequently transformed to the coregistered parametric PET and ASL-MR images for analysis. In this manner, the ROIs could be defined on high-resolution anatomical images, whereas the analysis was performed on PET and ASL data in the original orientation and resolution.
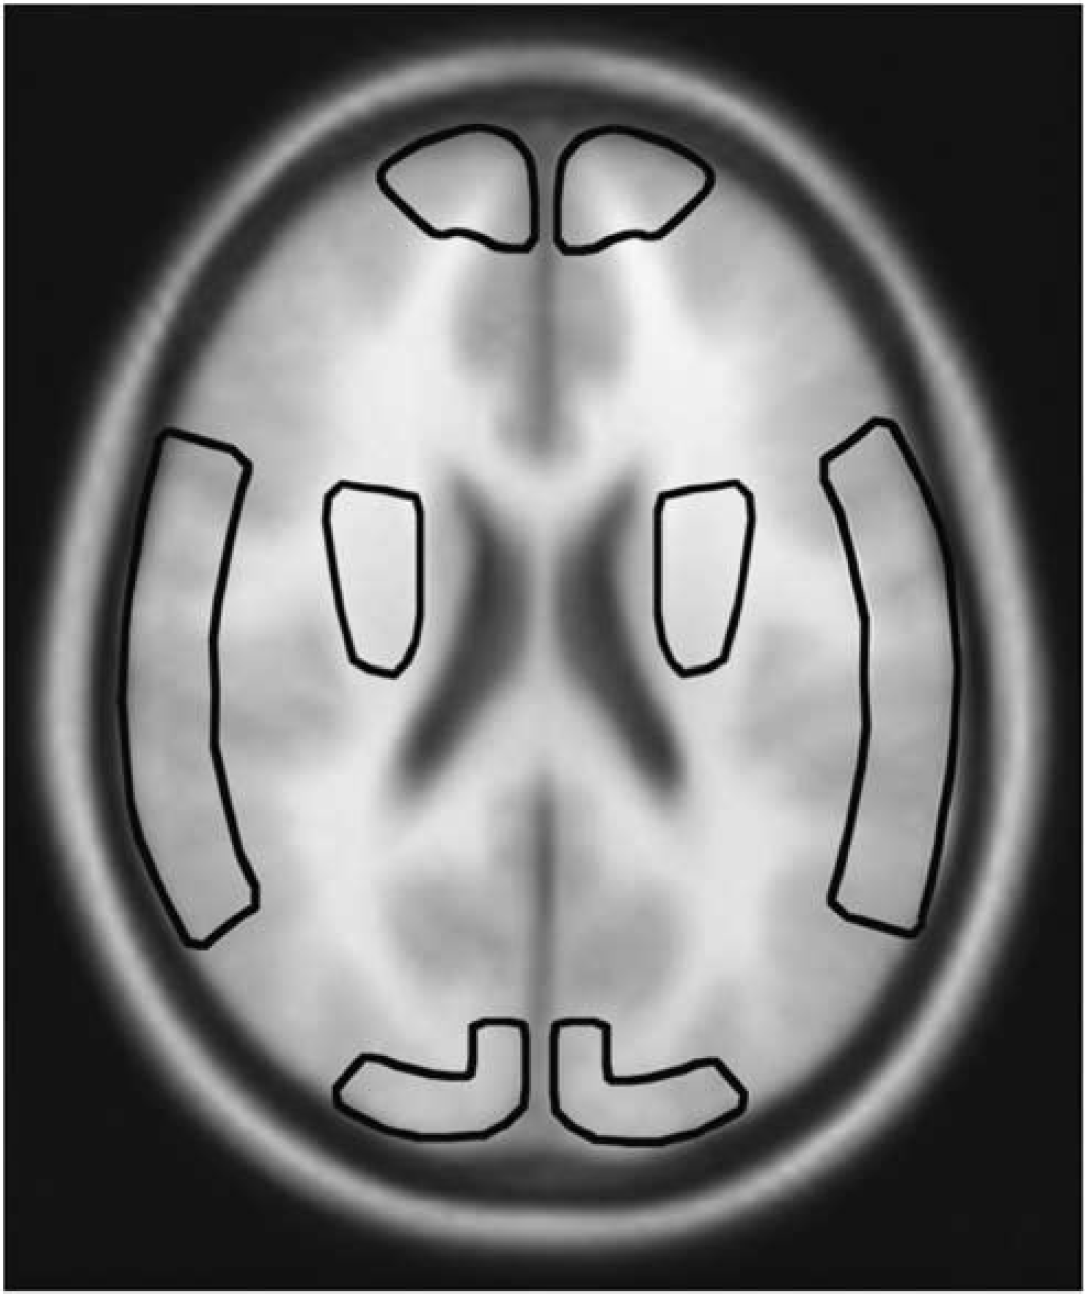
Transversal anatomical image depicting the regions of interest used for quantification of the hemodynamic parameters. In each hemisphere, a ROI was drawn in the flow territory of the ACA, MCA and PCA of the gray-matter, and in the white-matter.
Statistical Analysis
SPSS, version 16.0.1 (SPSS Inc, Chicago, IL, USA), was used for statistical analysis. The obtained CBF values, and ratios between the ipsi and contralateral hemisphere, from PET and ASL were compared with a paired
Results
The clinical characteristics of the study population are summarized in Table 1. Figure 2 shows the CBF maps of a 65-year-old female patient with a unilateral left-sided ICA occlusion obtained with ASL-MRI and H215O PET. Figure 3 shows CBF images of a 33-year-old male patient with a unilateral right-sided ICA occlusion.
Patient characteristics
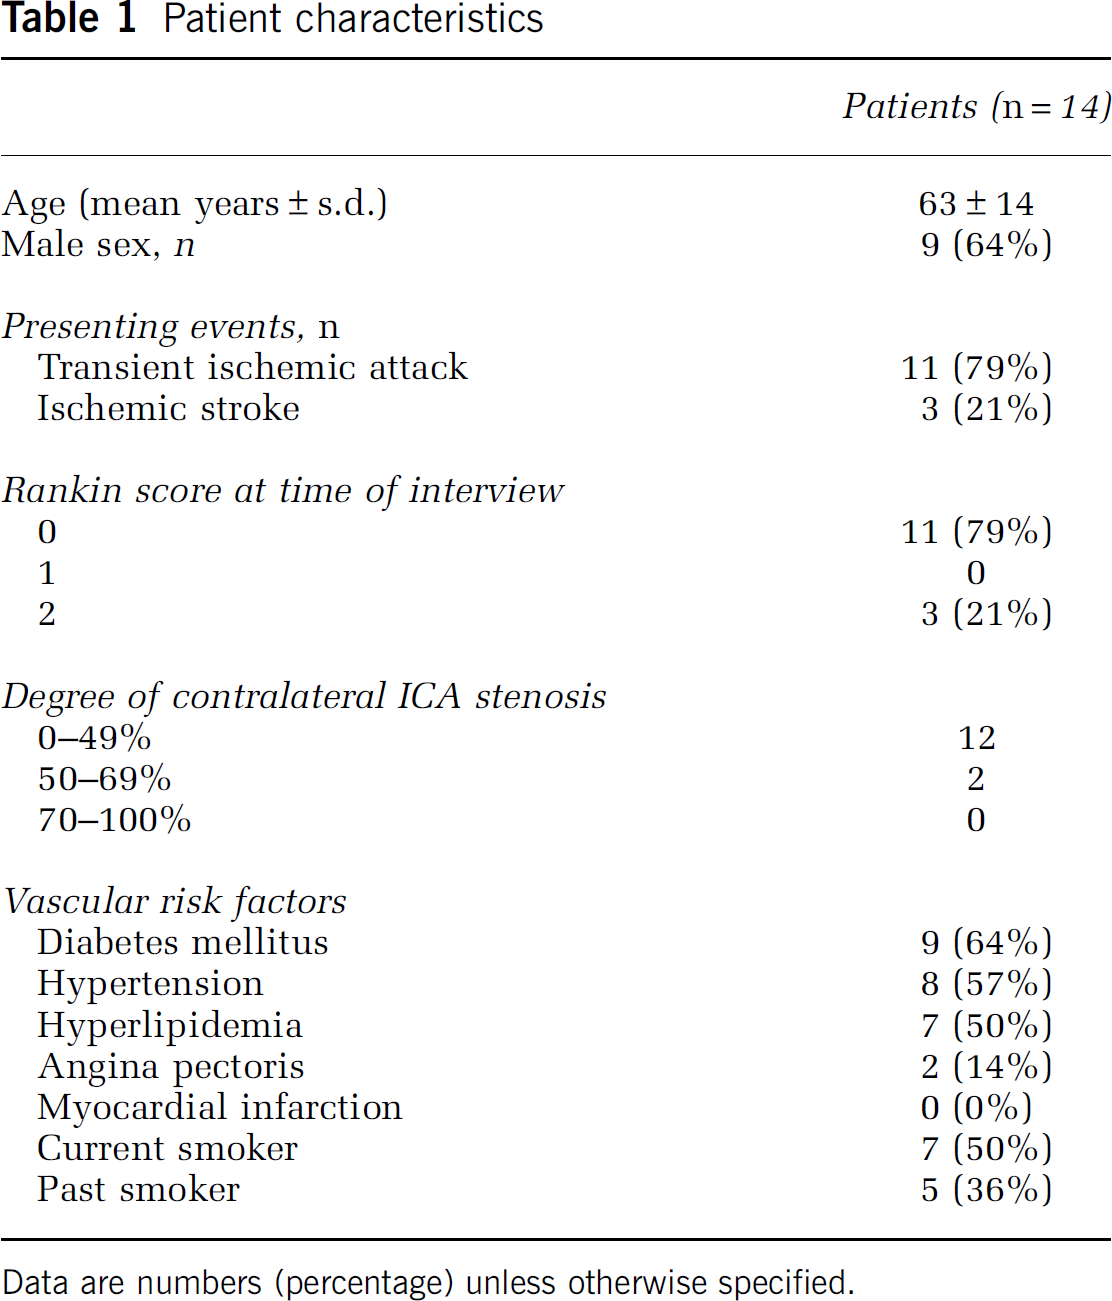
Data are numbers (percentage) unless otherwise specified.
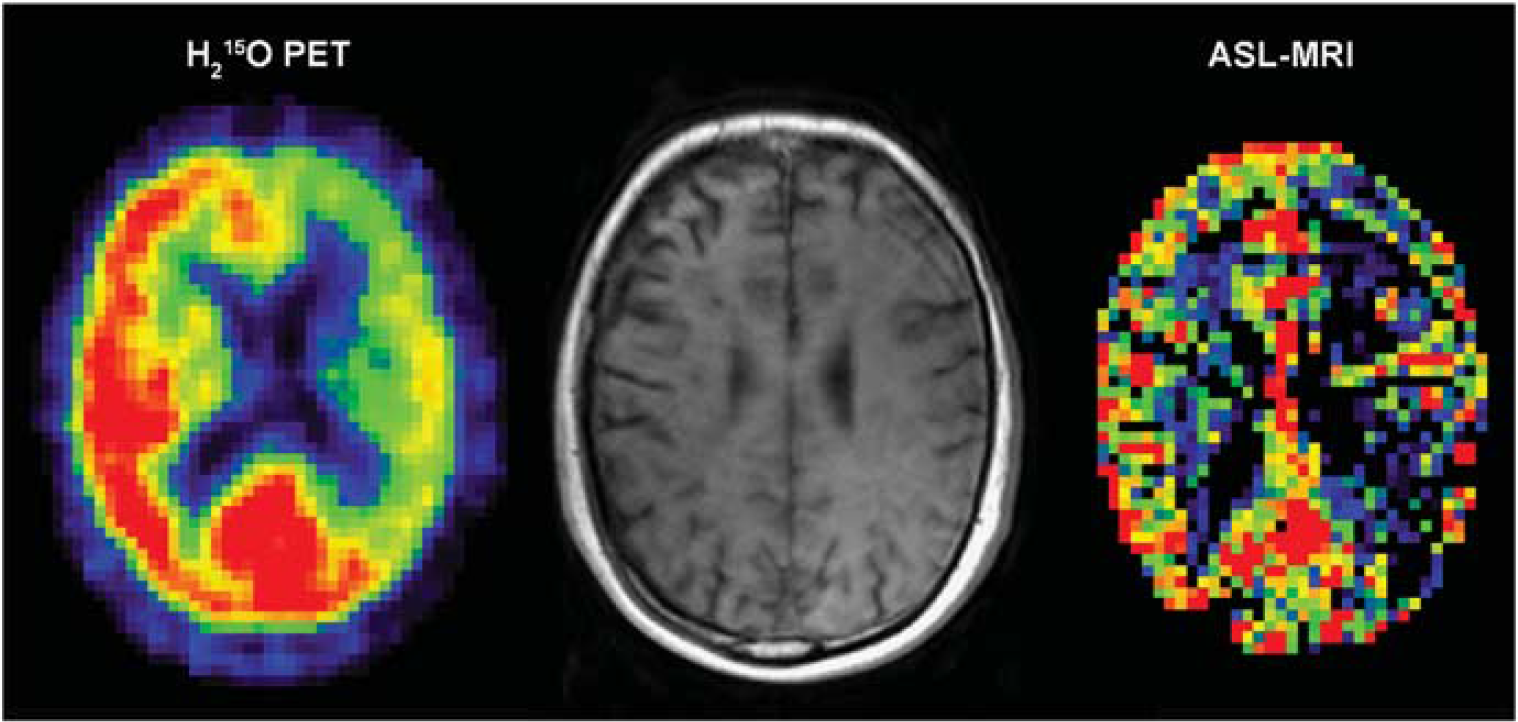
Example of perfusion images obtained with H215O PET (left) and ASL-MRI (right) of a 65-year-old female patient with a unilateral left-sided ICA occlusion.
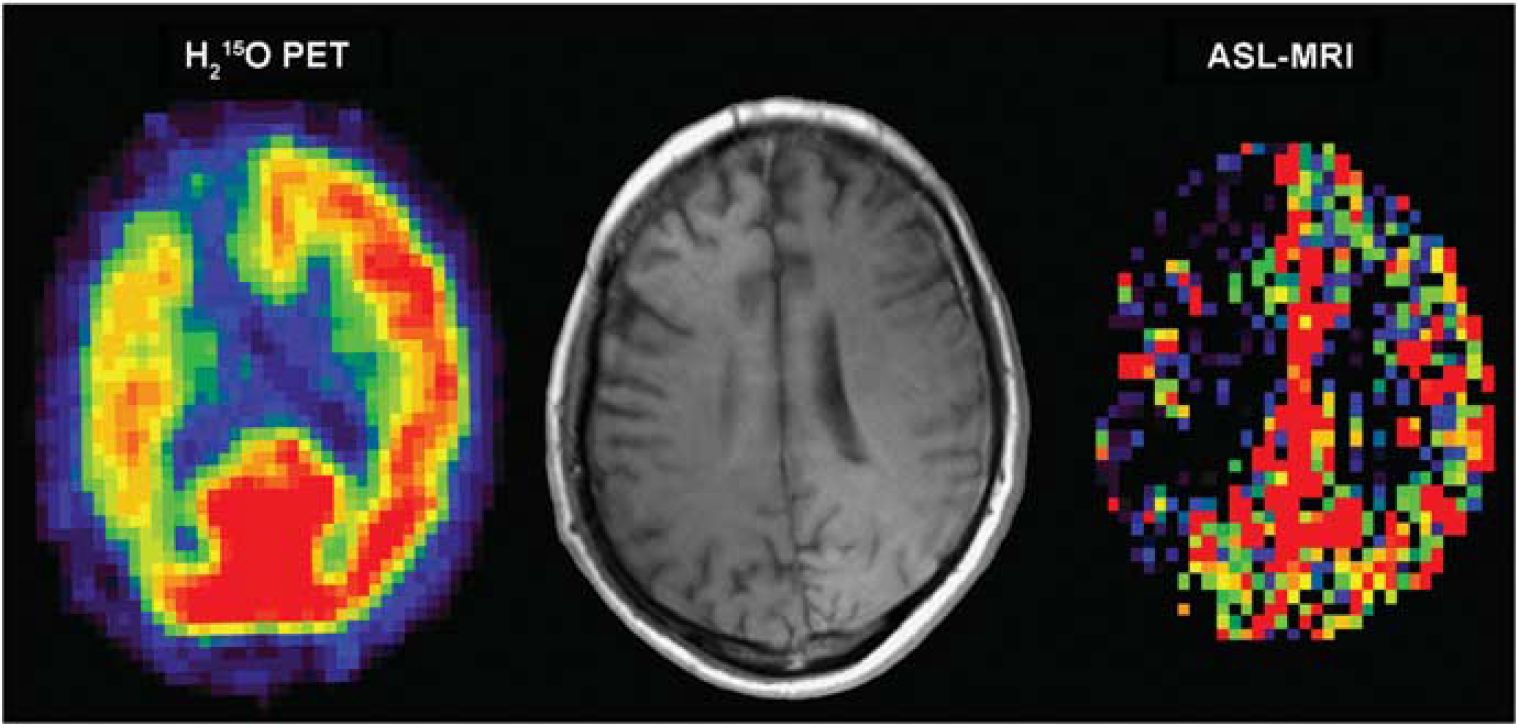
Example of perfusion images obtained with H215O PET (left) and ASL-MRI (right) of a 33-year-old male patient with a unilateral right-sided ICA occlusion.
Both H215O PET and ASL-MRI measured a significantly decreased CBF in the gray-matter of the MCA in the symptomatic hemisphere when compared with the contralateral hemisphere. The average CBF values for the hemisphere ipsilateral and contralateral to the ICA occlusion are summarized in Table 2. For H215O PET perfusion imaging, the ratio between the contra and ipsilateral hemisphere was 1.2 ± 0.1 for the ACA, 1.3 ± 0.1 for the MCA and 1.1 ± 0.1 for the PCA region The ratios for ASL-MRI were 1.2 ± 0.2, 1.7 ± 0.2, and 0.9 ± 0.1, respectively. The ratios for the middle (
Cerebral blood flow values (mL/min/100g) in patients with a symptomatic ICA occlusion measured with PET and ASL-MRI
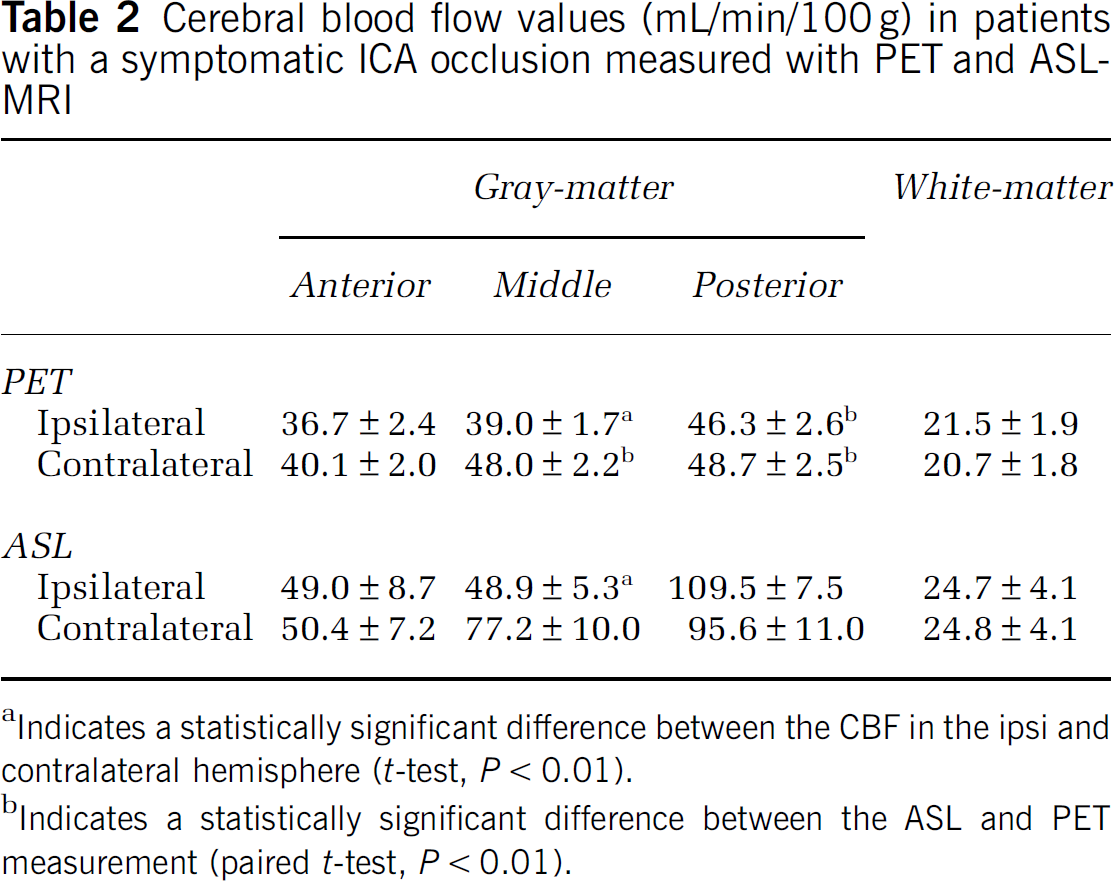
Indicates a statistically significant difference between the CBF in the ipsi and contralateral hemisphere (
Indicates a statistically significant difference between the ASL and PET measurement (paired
The average gray-matter CBF (ACA, MCA, and PCA regions) measured with ASL-MRI (71.8 ± 4.3 mL/min/100g) was 28.7 ± 3.3 mL/min/100 g (paired
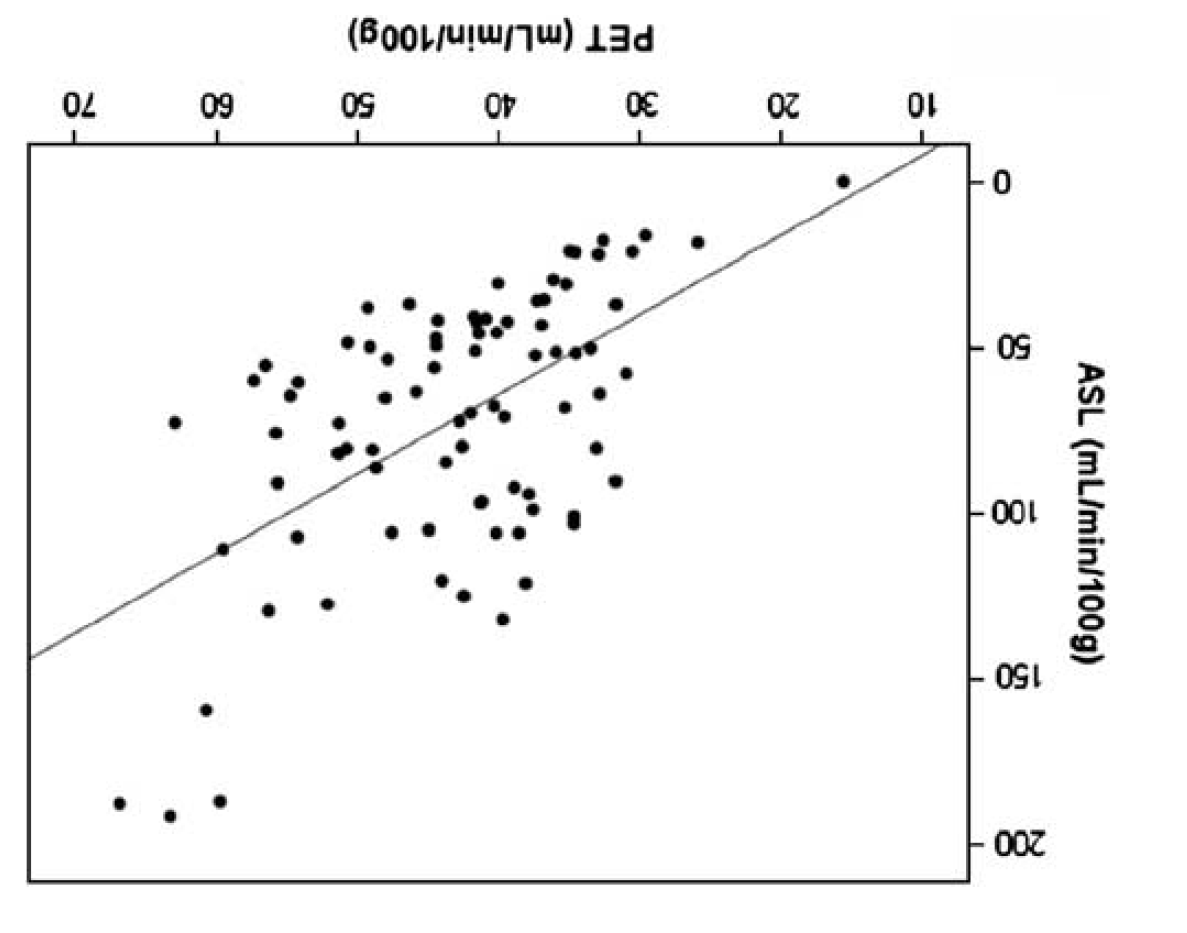
The ROI-based comparison between H215O PET and ASL-MRI CBF measurements over all ROI regions in the gray-matter of all subjects.
Discussion
This study demonstrates that CBF measurements obtained with ASL-MRI with acquisition of images at multiple delay times are correlated with quantitative CBF values derived with H21 5O PET in patients with a symptomatic occlusion of the ICA. The observed correlations differed between brain regions and were the best in the flow territory of the MCA. Furthermore, ASL-MRI was capable of depicting decreased CBF in the gray-matter of the MCA in patients with a symptomatic occlusion of the carotid artery similar to H215O PET, although an overall systematic overestimation of CBF relative to H215O PET was noted.
In an increasing number of institutions, ASL-MR perfusion imaging techniques are being added to the clinical MR protocols for routine assessment of CBF (Deibler et al, 2008a,
b
). Earlier studies have validated the various ASL techniques in both healthy volunteers and patients, and have applied the technique to assess cerebral perfusion in a wide range of neurologic diseases (Ye et al, 2000; Donahue et al, 2006; Koziak et al, 2008). Using a steady-state ASL strategy, one study found comparable CBF measurements in 12 healthy subjects when compared with H215O PET (Ye et al, 2000). In a study of 11 patients with an ICA occlusion, others found a significant correlation (
By performing multiple ASL experiments at increasing delay times between labeling and image acquisition, the accuracy of perfusion quantification in tissue with spatially variable tissue times can be enhanced (Gunther et al, 2001; Petersen et al, 2006). Using pulsed ASL with multiple small flip angle gradient echo readouts, in a similar manner as in the Look-Locker technique used for fast T1 mapping (Look and Locker, 1970), it is possible to measure the kinetics of the labeled blood and calculate CBF in a single scan. Earlier, in a study of 10 subjects, it was shown that an ASL strategy at multiple TI with and without vascular crushers (QUASAR) provided data that correlated well with DSC-MRI results (Knutsson et al, 2008). Other techniques have also been introduced to circumvent these problems associated with variable transit times for both continuous and pulsed ASL. For pulsed ASL, in which perfusion is assessed at a single inversion time point, sequences such as QUIPSS and QUIPSS II with thin-slice TI1 periodic saturation (Wong et al, 1998; Luh et al, 1999) have been introduced. To minimize effects of varying arrival times, these incorporate saturation pulses into the sequence to obtain sharply defined bolus profiles. A disadvantage is that with a fixed delay between tagging and imaging, flow may possibly be underestimated when the transit times are too long. For continuous ASL, in which labeling is performed during a few seconds at one plane, insensitivity to transit delays can be increased by using a pre-delay between the continuous labeling and the readout (Detre et al, 1998).
Although we found a significant correlation between ASL-MRI and H215O PET CBF measurements, higher absolute CBF values were found with ASL-MRI. This overestimation by ASL-MRI is consistent with earlier studies comparing ASL-MRI with image acquisition at a single inversion time to PET (Ye et al, 2000; Kimura et al, 2005), which in those studies was attributed mainly to intravascular signal. Although water is a highly diffusible tracer, it has been shown that with ASL-MRI, even when longer postlabeling delay times are used, label may still be present in the (small) feeding arteries, leading to an overestimation of CBF (Ye et al, 1997). Another possible explanation could be related to the CBF measurements derived with PET in this study. The H215O PET method used in this study was based on the assumption that delay and dispersion of the arterial blood time–activity curve between brain and radial artery was the same throughout the brain. In patients with an obstruction in the arteries feeding the brain, as seen in our patient population, and subsequent collateral blood flow through primary and secondary collateral vessels, this may not hold true, leading to a potential underestimation of CBF in comparison to the contralateral hemisphere.
In this study we found that the relation between the ASL-MRI and PET CBF measurements varied over the different flow territories of the cerebral arteries. The absolute differences in CBF were the largest in the flow territory of the posterior circulation. This may be caused by the course of the posterior cerebral arteries. The P2 segment distally from the posterior communicating artery runs almost parallel to the axial ASL-MR imaging slices. As a result, the diffusion of labeled blood into the brain may not yet be complete with label still being present in the vasculature. The perfusion model, however, assumes that labeled magnetization of inflowing blood has fully diffused into the tissue. This may lead to relatively higher CBF values in the posterior circulation when compared with brain tissue supplied by the ICA, which runs perpendicular to the ASL-MR imaging slice.
Our study showed a relatively low CBF in the MCA territory of the hemisphere ipsilateral to the ICA occlusion when assessed with ASL-MRI using interhemispheric comparisons of CBF. In a healthy brain, it can be assumed that the perfusion-like contribution coming from remaining intravascular spins may be equal for both hemispheres, as the vasculature is roughly identical on both sides. However, our study indicates that when a ratio between hemispheres is used in patients with a carotid artery occlusion to estimate hypoperfusion, ASL-MRI may overestimate the difference between the symptomatic and contralateral hemisphere in the gray-matter of the MCA. The difference in CBF ratios between ASL-MRI and PET was less in the flow territory of the ACA and PCA. We hypothesize that when using interhemispheric ratios, brain tissue with higher amounts of intravascular label, such as the gray-matter of the MCA territory, is more prone to error.
A potential limitation of our study is that we used a Look-Locker-like small flip angle gradient echo sampling strategy to acquire the series of images at increasing delay times after labeling. Although this significantly decreases scan time, making it more practical for clinical use in patients, the train of RF pulses during the readout decreases the perfusion signal. Because of this signal loss, and the natural T1 decay of the magnetized blood, we refrained from the use of crusher gradients. Crusher gradients can be used to dephase the moving spins to eliminate the signal from the large arteries. However, despite the possible overestimation of CBF because of not using crushers, there was a significant correlation between the ASL-MRI CBF measurements and the H215O PET CBF measurements. An additional limitation of the study may be the 7 days between the ASL-MRI and H215O PET examination and that both scans were performed under different environmental conditions (i.e. silence versus loudness MRI, possibly leading to a higher CBF in the auditory cortex). To control for the difference in time from symptoms to investigation, the order of both investigations were randomized.
In conclusion, CBF values obtained with ASL-MRI at multiple delay times correlated significantly with H21 5O PET, although there was a systematic overestimation of CBF by ASL-MRI. This overestimation shows that for quantitative use, ASL perfusion images should be interpreted with caution, especially when literature cut-off values for hemodynamic impairment are used which are based on other methods, such as H215O PET CBF. Still, the relative values of the ipsilateral to contralateral hemisphere in our patients with ICA occlusion are comparable to these values obtained with H215O PET. Therefore, we conclude that the noninvasive ASL-MRI measurements of perfusion are useful to depict the presence and extent of areas with hypoperfusion in the vascular territory of the middle cerebral artery in patients with symptomatic ICA occlusion.
Footnotes
Acknowledgements
JH is supported by the Netherlands Organization for Scientific Research (grant 916-76-035). RB is supported by the Netherlands Organisation for Scientific Research (VIDI grant 016-066-309). CJMK was supported by a clinical fellowship from the Netherlands Organization for Health Research and Development (grant 907-00-103) and by a grant from the Netherlands Heart Association (grant 2003B263).
The authors declare no conflict of interest.