
Abstract
Preclinical and clinical studies suggest an early and progressive deterioration in cerebral perfusion leading to delayed cerebral ischemia (DCI) after aneurysmal subarachnoid hemorrhage (SAH). Computed Tomography Perfusion (CTP) has then been investigated for DCI diagnosis and prognosis. However, spatial and temporal evolution of CTP-derived metrics have not been established, such that optimal CTP periodicity for monitoring and metrics thresholds for triggering intervention remain unclear. We developed an image processing pipeline to quantify CTP parameters’ dynamics in SAH patients. Sixty-two patients were retrospectively included. Cerebral vasospasm (CVS) occurrence was 68%, that of DCI 15%. CTP parameters displayed specific dynamics in each of the noCVS, CVS, and DCI groups. In the DCI category, CBF showed early hyperemia and global flow homogenization, followed by an increased mean and variability of TMax. These features were included in a DCI predictive model (AUC = 0.94 after bootstrapping correction). Two types of dynamics emerged in DCI patients, one characterized by high asymmetry between hemispheric parameters, the other by a rapid whole-brain deterioration of brain perfusion. In conclusion, CTP parameters’ early dynamics allow to sort SAH patients that will develop either CVS or DCI, advocating for repeating CTP examinations to adapt therapeutic strategies.
Keywords
Introduction
Aneurysmal subarachnoid hemorrhage (SAH) is a rare but severe condition, with a global incidence of 6 to 10 cases per 100,000 people annually.1,2 Affecting a young demographic, of median age of 55 years, SAH frequently leads to long-term disability, profoundly impacting patients’ quality of life.2,3 Poor outcome is associated with the initial volume of bleeding, quantified by the modified Fisher scale, 2 the severity of the patient’s initial clinical status, as assessed by the WFNS score, and the occurrence of delayed cerebral ischemia (DCI). 2
A primary goal in SAH patients management is to address the impaired cerebral perfusion that follows aneurysm rupture. 2 At ictus, the abrupt increase in intracranial pressure (ICP) causes a significant drop in cerebral blood flow (CBF).2,4–6 Between the 3rd and 15th days, DCI may occur, presenting as new neurological deficits or radiological infarcts.2,7 DCI remains an active research topic, since cerebral vasospasm (CVS) has been recognized to be an insufficient pathophysiological mechanism for explaining it.2,8,9
The pathophysiology of DCI is now understood to be more complex, involving a combination of neuroinflammation,10,11 microvascular defects,12–15 microthrombosis, 12 and blood-brain barrier disruption. 16 These factors may contribute to uneven CBF distribution, 13 brain edema, 17 and metabolic disturbances,2,18 in fine altering brain perfusion.
Computed Tomography Perfusion (CTP) has been investigated to assess cerebral perfusion in SAH patients 9 and to guide therapeutics. 19 Various commercial software are used to generate parametric maps that allow for both qualitative assessments and quantitative analysis of numerous metrics. Some studies explored the relationship between early alterations in CTP parameters and the occurrence of DCI,20–24 while others have shown that secondary changes such as increase in interhemispheric parameters ratios,25–29 reduced CBF or increased transit times,22,27,30–33 correlate with DCI.
Recent international guidelines have recommended CTP monitoring. 9 However, because of technical disparities and heterogeneity in disease presentation, defining objective CTP criteria to guide invasive angiographic or medical rescue treatments remains complex.
Herein, we retrospectively analyzed the spatiotemporal evolution of cerebral perfusion in a cohort of SAH patients. In order to allow intra and intersubject comparison, we registered CTP exams in the MNI space (Montreal Neurological Institute, 34 ) and performed segmentation using vascular atlases. Grounding analysis of CTP parameters’ dynamics on established and theoretical pathophysiological phenomena, we aimed to identify early and secondary patterns characteristic for DCI in order to provide simple and reproducible guidelines for clinical CTP monitoring.
Materials and methods
Patients
This observational study was performed according to the STROBE guidelines. We included patients admitted to our university hospital who were diagnosed with SAH resulting from a ruptured aneurysm confirmed by Computed Tomography Angiography (CTA) between June 2023 and April 2024 and underwent at least two usable CTP exams.
Patients management
All patients received health care in accordance with current recommendations. 9 Endovascular or surgical aneurysm securization was decided by neurosurgeons and neuroradiologists. Surgical procedures including external ventricular drainage (EVD), intracerebral hemorrhage evacuation or decompressive craniectomy were performed when necessary. Comatose patients were sedated and assisted with mechanical ventilation. All patients received nimodipine, administered either orally every 4 hours in a total daily dose of 360 mg, or intravenously in a dose of 2 mg/h when the oral route was not available. Patients were under clinical supervision and transcranial Doppler (TCD) monitoring to detect neurological deterioration and/or elevated velocities in the cerebral arteries. When suspected after clinical examination and/or TCD, CVS and DCI were evaluated on CT scans. In patients with CVS and/or DCI, cerebral perfusion pressure was optimized by maintaining normovolemia. A CTP-guided systemic administration of milrinone in both preventing and treating DCI was performed. Intra-arterial administration of both nimodipine and milrinone, or percutaneous transluminal angioplasty were used as a last resort.
CVS and DCI
CVS was defined as a reduction in arteries diameter of at least one-third compared to baseline caliber, measured on either CTA or Digital Subtraction Angiography (DSA). DCI was defined as a delayed ischemic neurologic deficit (DIND) or a delayed cerebral infarction (DCIn). 7 DIND was characterized by focal neurological impairment or drop in the Glasgow coma scale of at least two points, unexplained by other cause. DCIn was identified as a new infarction on CT or magnetic resonance imaging (MRI) scans, excluding early brain injuries seen within the first 72 hours postaneurysm rupture, and not attributable to other cause.
Patients categories
Three categories of patients were defined:
noCVS, including patients who presented neither CVS nor DCI; CVS, including patients who presented CVS but no DCI; DCI, including patients who presented DIND and/or DCIn.
Neuroimaging
Various imaging modalities were part of routine clinical practice. MRI was performed with a Siemens Healthineers device (1.5 Tesla, T1w, T2w, and FLAIR sequences). CTP data were acquired using GE Medical Systems device (24-slice scanner, GE Healthcare, Milwaukee, Wisconsin) with a slice thickness of 5 mm. Parametric maps of cerebral blood flow (CBF), time-to-maximum (TMax) and mean transit time (MTT) were computed using Perfusion4D software (General Electric, revo_ct_22bc.50). The basilar artery was manually selected as the arterial input function and the venous outflow was automatically determined. All images were anonymized and exported for post-processing.
Image registration
For each series, DICOM raw images were converted to NIFTI (Neuroimaging Informatics Technology Initiative) format using SPM12 software (Statistical Parametric Mapping, http://www.fil.ion.ucl.ac.uk/spm). NIFTI files were then registered into the MNI space using ANTsPy library
35
and Python software. To perform image registration, one reference anatomical series was selected for each patient. T1w MR images were preferred. If T1w series were not available, T2w or FLAIR series were used. For each exam, we computed the following transformation fields:
CTP to anatomical CT (Tx1 transformation); anatomical CT to reference MRI (Tx2 transformation); reference MRI to MNI atlas (Tx3 transformation).
All transformations were obtained with rigid and elastic transformations using the “SyN” method (ANTsPy library). Transformations Tx1, Tx2 and Tx3 were then consecutively applied to the original parametric maps, as illustrated in Figure S1. When MRI was unavailable or distorted, Tx3 transformation was not performed and the high-resolution scCT template 36 was used as the target template in Tx2 transformation instead. Finally, image registration quality was assessed by the authors. Anonymized and normalized perfusion maps have been made publicly available on Dryad open data publishing platform (https://doi.org/10.5061/dryad.0zpc86784).
CTP analysis
Our analysis pipeline was developed in Matlab (The MathWorks, Natick, CA, USA, v2024b). Parametric volumes were segmented using an arterial atlas 37 including eight arterial territories: bilateral anterior cerebral arteries (ACA), middle cerebral arteries (MCA), posterior cerebral arteries (PCA) and vertebro-basilar arteries (VBA). Perfusion parameters were analyzed both within individual arterial territories and at the “whole-brain” scale, defined as the aggregate of the ACA, MCA and PCA territories (excluding VBA territories, underrepresented within the 12 cm-wide CTP acquisition window). The 5 mm slice thickness was hence suited for these macroscopic scale analyzes. For each region of interest (ROI) and each exam, the average of the perfusion parameters (TMax, MTT, CBF) was calculated as well as the associated coefficient of variation (CV, ratio of the standard deviation over the mean value of the parameter within the ROI). To quantify the variations of these metrics as a function of time, their first derivative was calculated; when more than two samples were available in the studied time window the largest value of the derivative was considered in the quantitative analyzes. To investigate cerebral perfusion dynamics following SAH at the group level, data were referenced to the ruptured aneurysm symptoms onset date (severe headache, loss of consciousness, vomiting, etc) (Day 0) and individual patterns were overlaid. Similarly, for further investigations in the DCI group, individual patterns were also referenced to the DCI diagnosis date. A group trend was obtained by applying a moving average with a span window of 1.5 days. The group trends were analyzed at the global scale by linear regression and the resulting slopes and r2 were reported. Day-to-day variations were also described.
Data interpolation
To analyze the evolution of cerebral perfusion across all patients, a sufficient number of exams per subject and a homogeneous time sampling was needed. To satisfy this requirement, simulated data were generated as follows. We calculated the spacing in days between successive CTP acquisitions. For intervals exceeding 1.5 days, simulated perfusion maps were created using voxel-wise linear interpolation between original maps, with corresponding timestamps assigned. Finally, the interpolated maps were registered to the MNI space using the ‘Translation’ method in the ANTsPy library.
Statistical analysis
Several metrics were derived from CTP maps: whole-brain average, CV and their first time derivatives. Exploratory analyzes were performed by conducting one-way analyzes of variance (ANOVA). Homogeneity of variances between groups was qualitatively and statistically assessed (Levene’s test) beforehand. When a significant main effect of patient group was found, Post-Hoc comparisons were evaluated using the HSD Tukey test. Binary classifiers of DCI versus non-DCI patients were evaluated using logistic regression models. Models’ predictive power was measured by calculating the pseudo − R2,38 the area under the curve (AUC), the sensitivity, specificity and accuracy.
Stukel tests were performed to assess for misspecification and adjust model fitting when needed. A logit link function was used by default unless the Stukel test was statistically significant. In this case, a probit link function was used instead (see Supplemental Equation 1). To account for potential overfitting, a bootstrapping validation was conducted.
39
1000 random datasets were generated from our original dataset. A logistic regression model was fitted for each of them and a corresponding AUC (noted AUCbootstrap) was calculated. Each model was then tested on the original dataset and provided another AUC value (noted AUCbootstrap/real), finally a correction was applied on our initial AUC estimation (
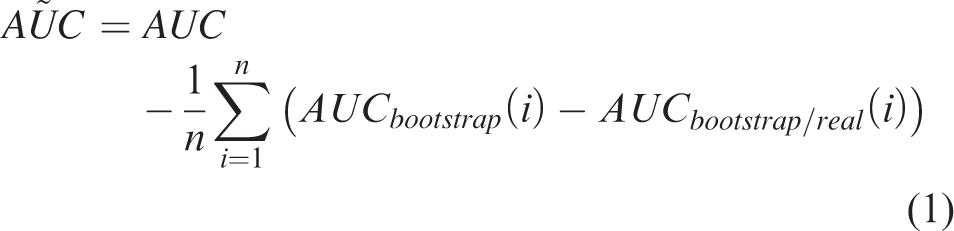
Statistical analyzes were conducted under Matlab.
Ethical considerations
The present study was approved by Montpellier ethics committees (2018-IRB-MTP-02-11) in accordance with French regulation (Law n° 78-17-Loi informatique et libertés and General Data Protection Regulation n°2016/679). There was no invasive procedure in addition to French ICUs standard of care. Information regarding this study were provided to the patients and/or their family and they could opt out of it, according to French law.
Results
Study population characteristics
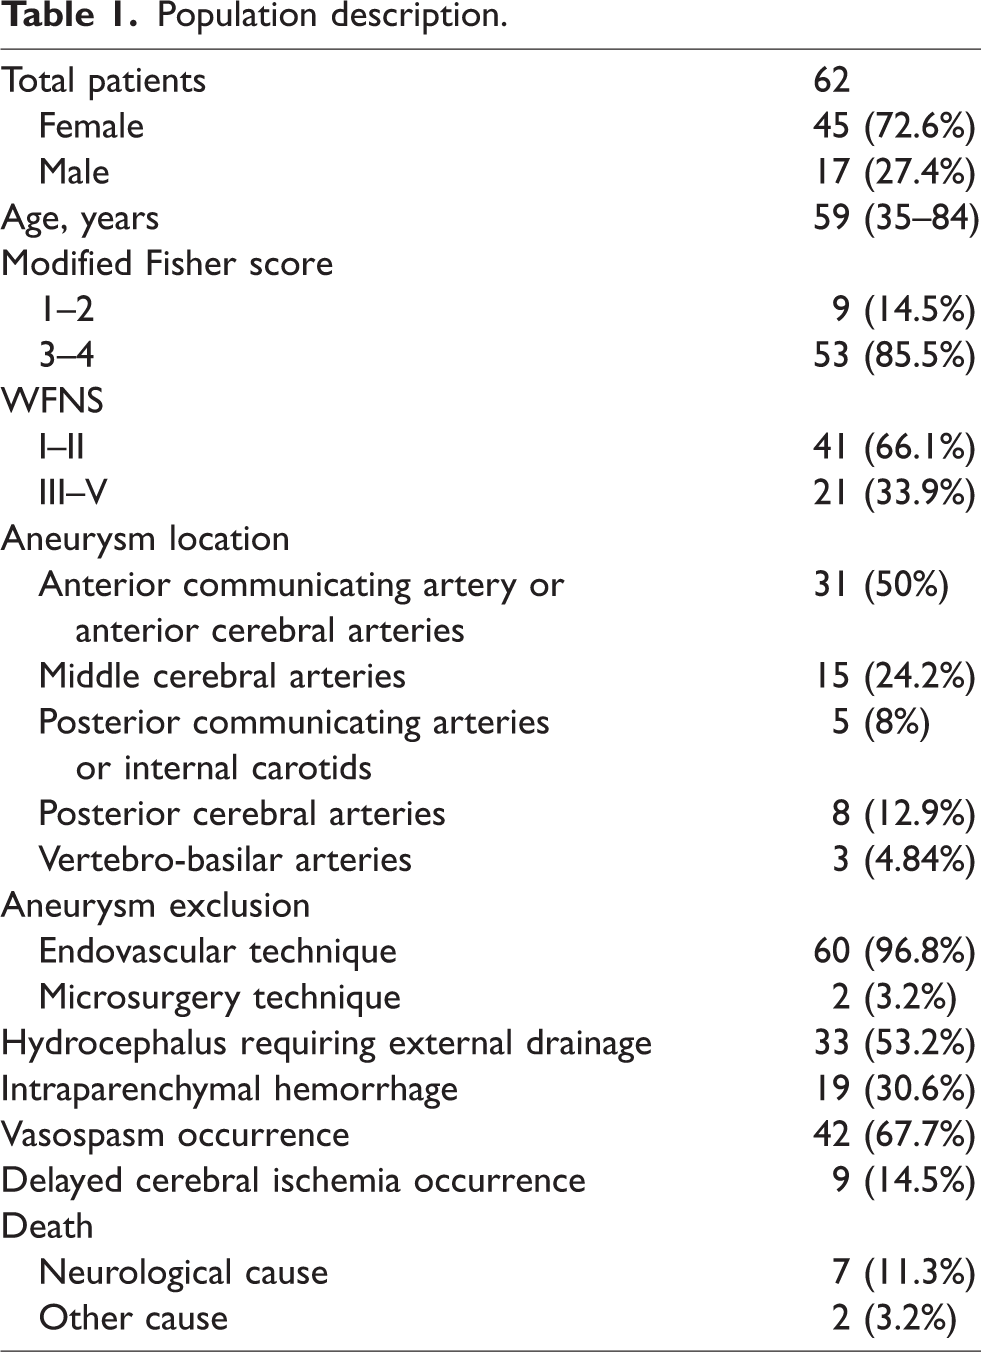
62 patients were included in this study and their details are presented in Table 1. 72.6% of patients were women, the mean age was 59 years. Modified Fisher grade 3 or 4 accounted for 85.5% of patients, WFNS grades III-V for 33.9%. Nineteen patients (30.6%) presented intraparenchymal hematoma, four of them (6.5%) underwent neurosurgical evacuation and three (4.8%) required a craniectomy. Nine patients died during their stay, for seven of them this issue was associated with a dramatic deterioration of cerebral perfusion (S030, S034, S049, S053, S075, S084, S088).
Population description.
Neurological events
Forty-two patients (67.7%) were diagnosed with CVS. The left-most boxplot in Figure S2 illustrates the delay between the onset of SAH symptoms and CVS diagnosis, showing that CVS occurred between two and thirteen days post-SAH, with a median of 6 days. The locations of CVS were evenly distributed in all six main arterial ROIs, and no statistical relationship with the aneurysm location was found. Nine patients (14.5%) were diagnosed with DCI between five and fifteen days following SAH (Figure S2.b). CVS occurred with a similar delay in the DCI and non-DCI populations (see red dots in Figure S2, mean delay of 7 and 6.14 days, respectively). All patients diagnosed with DCI also suffered from CVS.
CTP parameters dynamics in patients categories
The dataset included 291 original exams, corresponding to 873 parametric maps. The average delay between successive CTP exams was 2.8 days, ranging from 0.6 to 13.1 days. In total, 302 simulated exams (906 parametric maps) were added to this dataset leading to 4.69 original and 4.89 simulated exams per patient on average.
CTP parameters’ dynamics following SAH
We analyzed all available CTP exams in the three categories of patients (noCVS, CVS, and DCI). Figure 1 illustrates individual patterns and the group trend for whole-brain mean TMax and CBF. Patterns for MTT are shown in Figure S3. The text insets indicate the slope and r2 values resulting from a linear regression on the group trend.
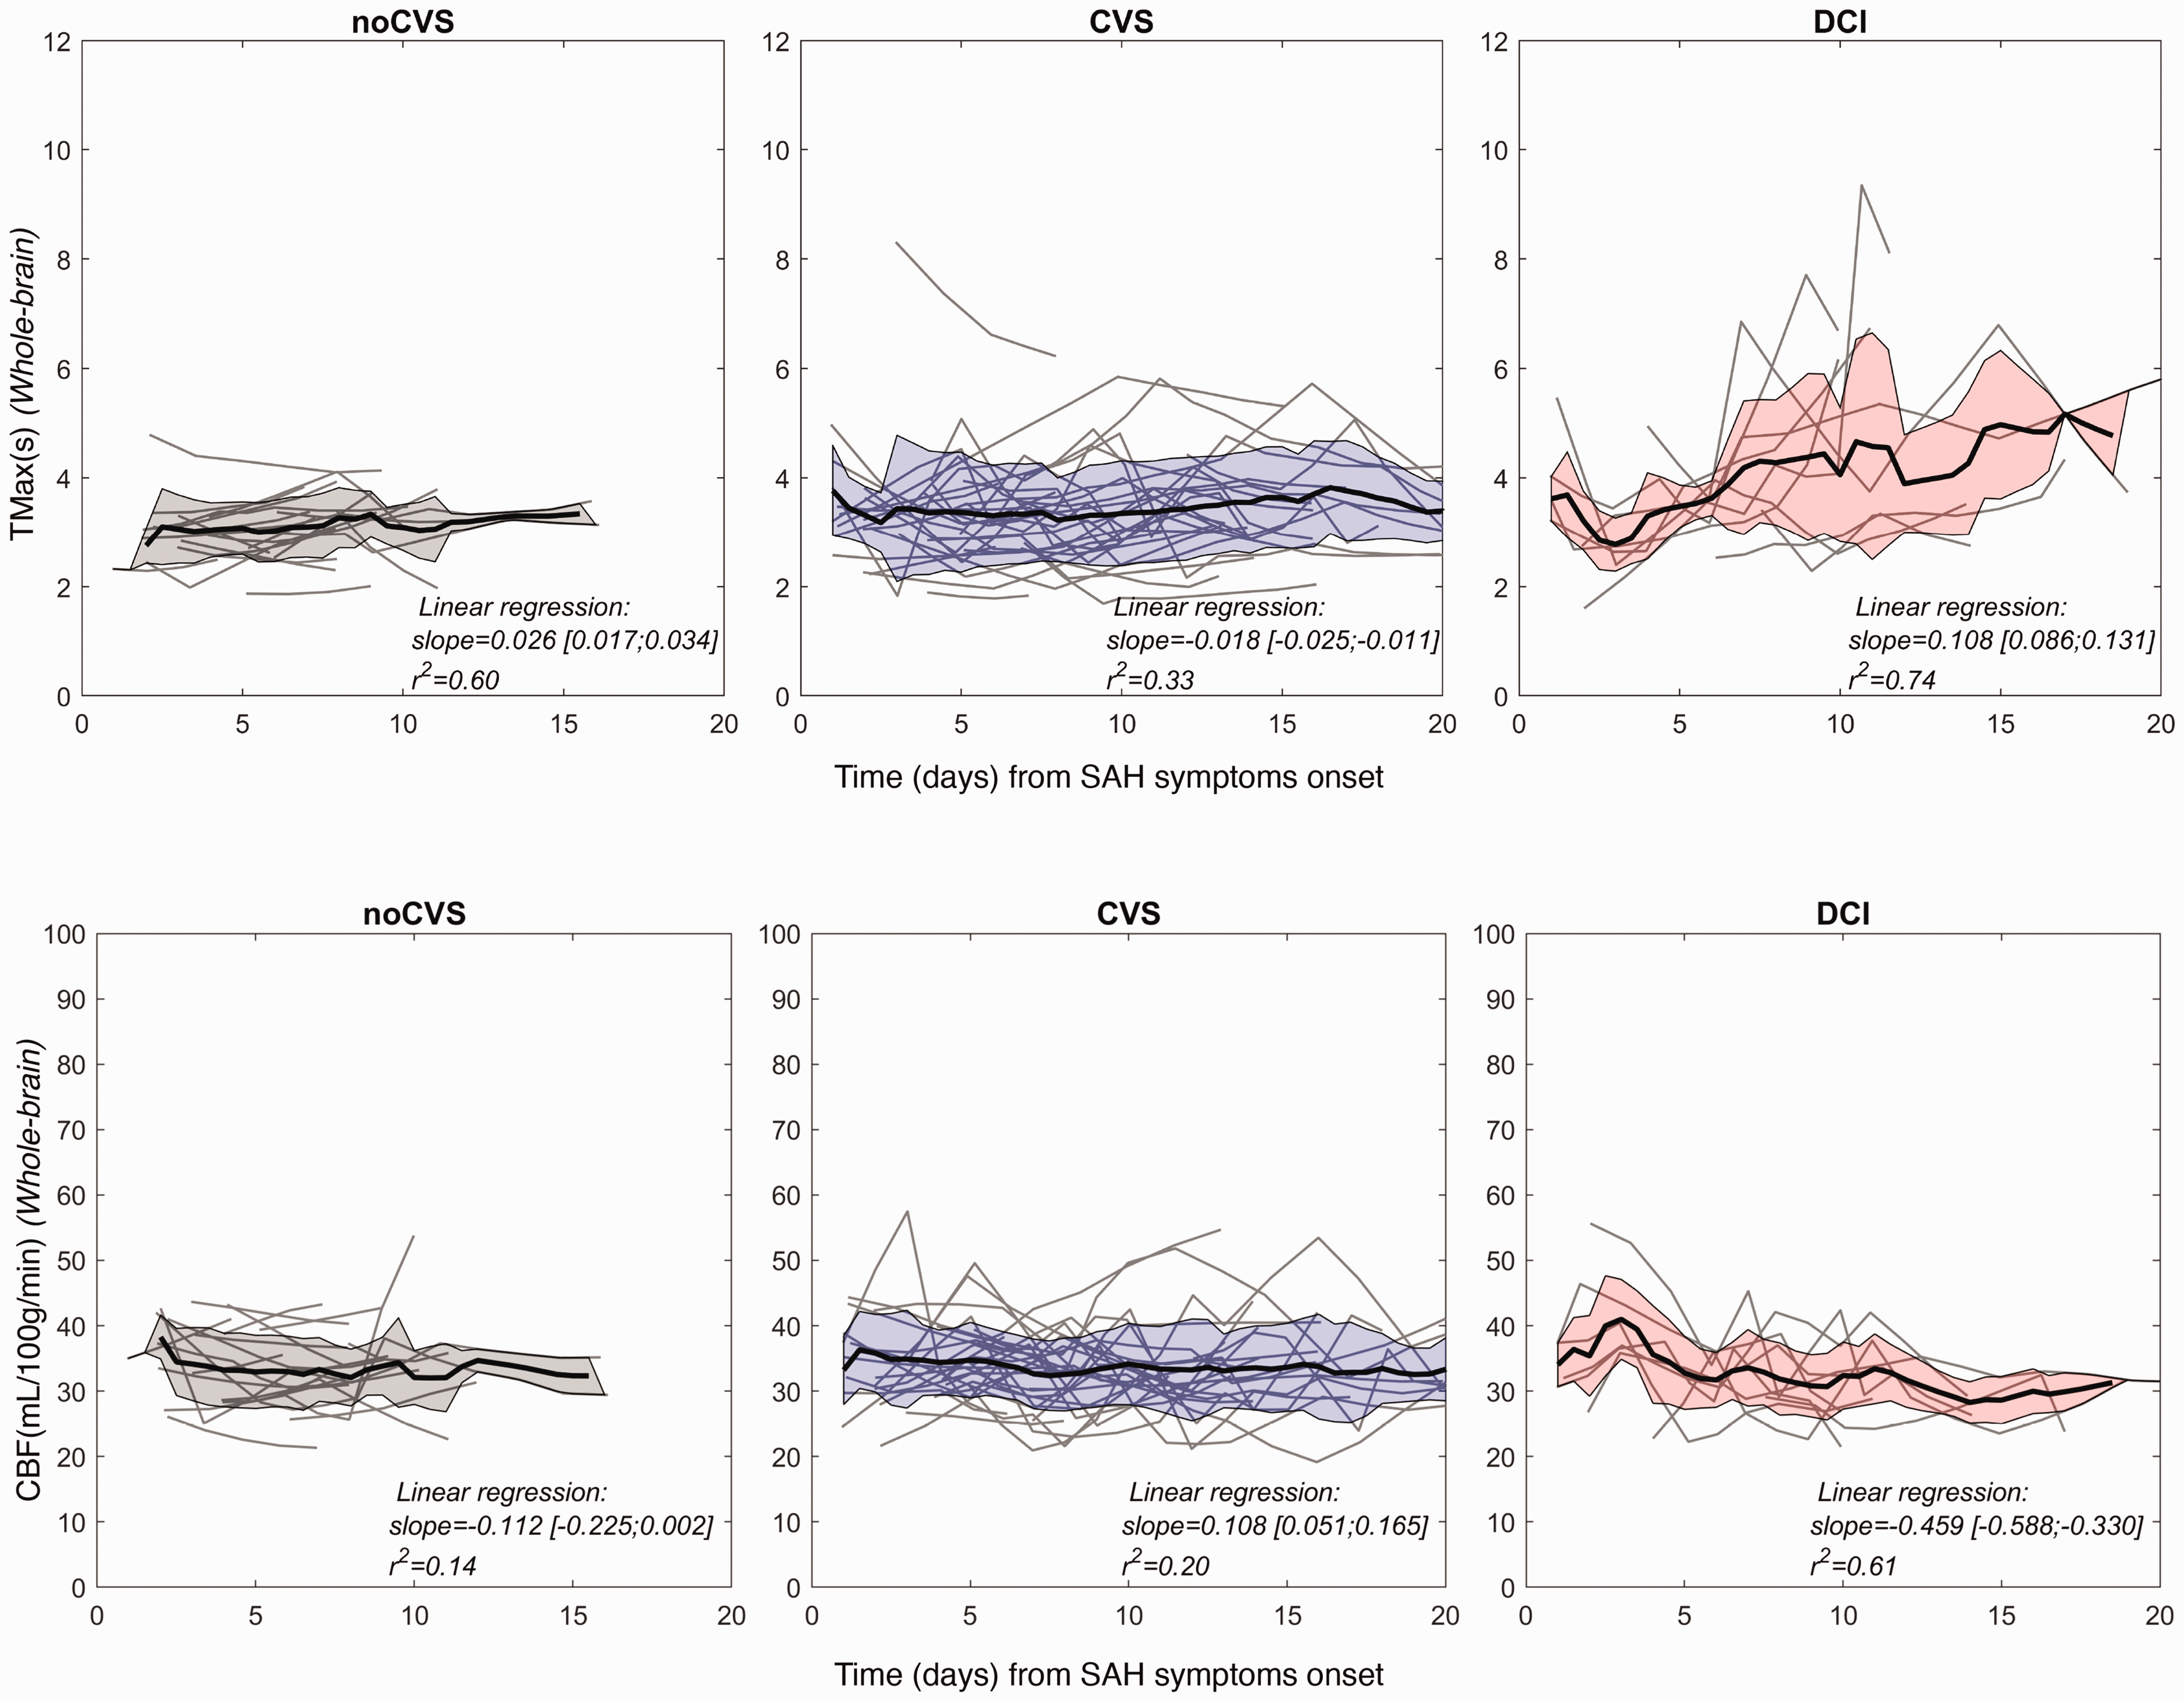
CTP parameters dynamics in the three patients categories noCVS, CVS and DCI. Top row: TMax, bottom row: CBF. Left panels: noCVS group. Middle panels: CVS group. Right panels: DCI group. Data from individual subjects are represented as thin lines and a moving average (span window of 1.5 days) was applied to obtain the group trend (thick black curve). The shaded areas represent the inter-subject standard deviation.
In the noCVS group, both mean trend and individual traces for all parameters showed moderate temporal variability (slope = 0.03, r2 = 0.60). In the CVS group, the mean trends also remained flat over time (slope < 0.01, r2 = 0.35), while parameters showed larger inter- and intra-patient variability. In the DCI group, a large temporal variability could be observed for both TMax and MTT. This observation was assessed by a one-way ANOVA which confirmed a significant main effect of group on the standard deviation of TMax (F(2,58) = 25.79, p < 0.001) and MTT (F(2,58) = 13.26, p < 0.001). Regarding CBF, a significant main effect of group was also noted (F(2,58) = 4.73, p < 0.01) with the largest standard deviation being observed in the CVS group. The group trend of the temporal evolution of cerebral perfusion in the DCI group showed positive slopes for TMax and MTT (slope = 0.11, r2 = 0.74 and slope = 0.19, r2 = 0.84 respectively) and a negative slope for CBF (slope =−0.46 and r2 = 0.61). Nonetheless, temporal evolution was not monotonous. At the initial stage, between day 0 and day 2, perfusion metrics were comparable to those in the CVS group.
However, mean TMax and MTT gradually decreased and CBF increased. Then, around day four on average, TMax and MTT gradually increased and CBF decreased. To quantify this rapid evolution in the early phase a one-way ANOVA was conducted on the absolute amplitude of the first derivative of all perfusion parameters and revealed a significant main effect of group for CBF only (F(2,38) = 4.85, p < 0.05). The absolute amplitude of the first time derivative of CBF between day 0 and day 4 (Figure 2(a)), reached 2.21, 3.31, 7.15 (in units of mL/100 g/min/day) on average respectively in noCVS, CVS and DCI groups. This rapid increase yielded a mean CBF of 40.99 ml/100g/mn at day 3 in the DCI group, while it stayed at 34.14 and 34.89 in the noCVS and CVS categories respectively.
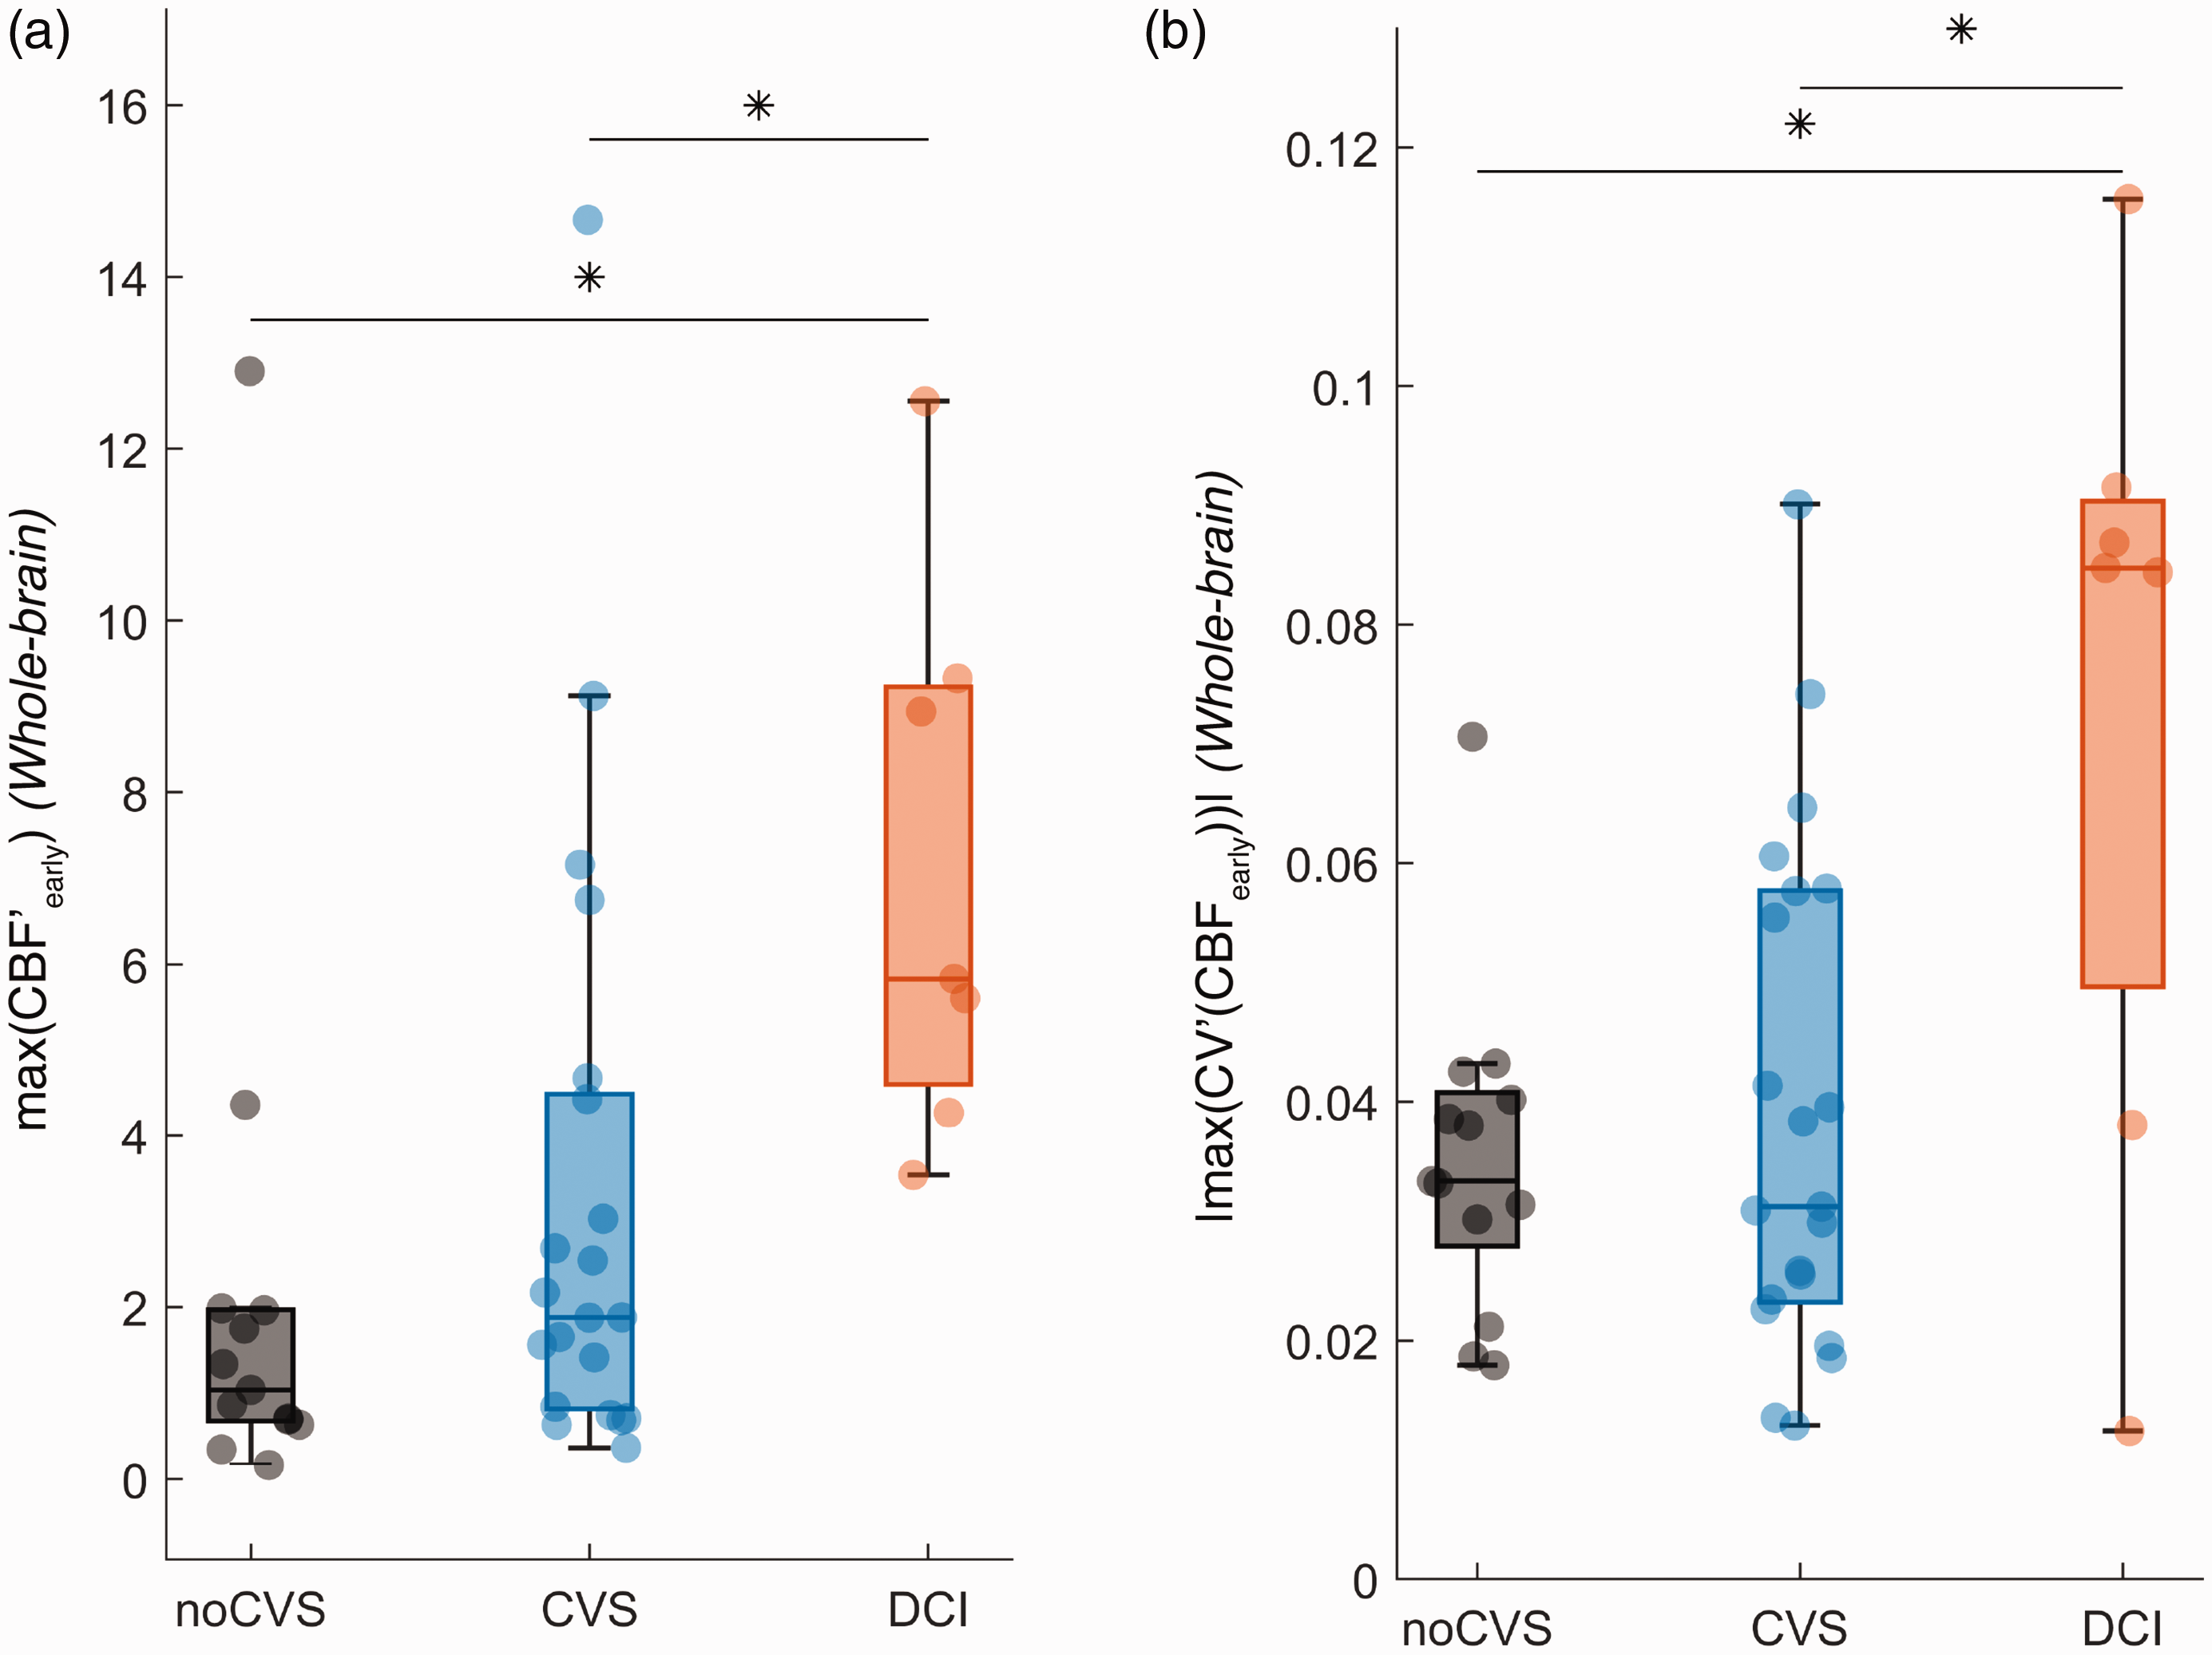
Box plot of the maximum absolute value of the first time derivative of CBF (panel a.) and the coefficient of variation of CBF (panel b.) respectively. The considered time window was [day 0-day 4]. Horizontal lines and asterisks indicate statistically significant pairwise comparisons after a significant main effect of group was demonstrated by a one-way ANOVA.
To explore perfusion spatial dispersion, we computed the CV of each parameter in each exam. Results are shown in Figures 3 and S4. In the noCVS group, CVs remained stable for all parameters. In the CVS and DCI groups, group trends for MTT exhibited high initial CVs which then rapidly decreased. A comparable yet less pronounced drop can be seen for TMax and CBF. To quantify this early drop in CV, we narrowed our analysis time window to days [0–4] and conducted a one-way ANOVA on the first derivative of the CV which revealed a significant main effect of group for all three parameters (F(2,29) = 21.93, p < 0.001 for TMax, F(2,29) = 3.46, p < 0.05 for MTT and F(2,29) = 5.19, p < 0.05 for CBF). Post-hoc tests failed to indicate statistically significant differences between group means for MTT. For both TMax and CBF the early drop in CV was larger in the DCI group compared to the other groups. Corresponding statistics are summarized in Table S1.
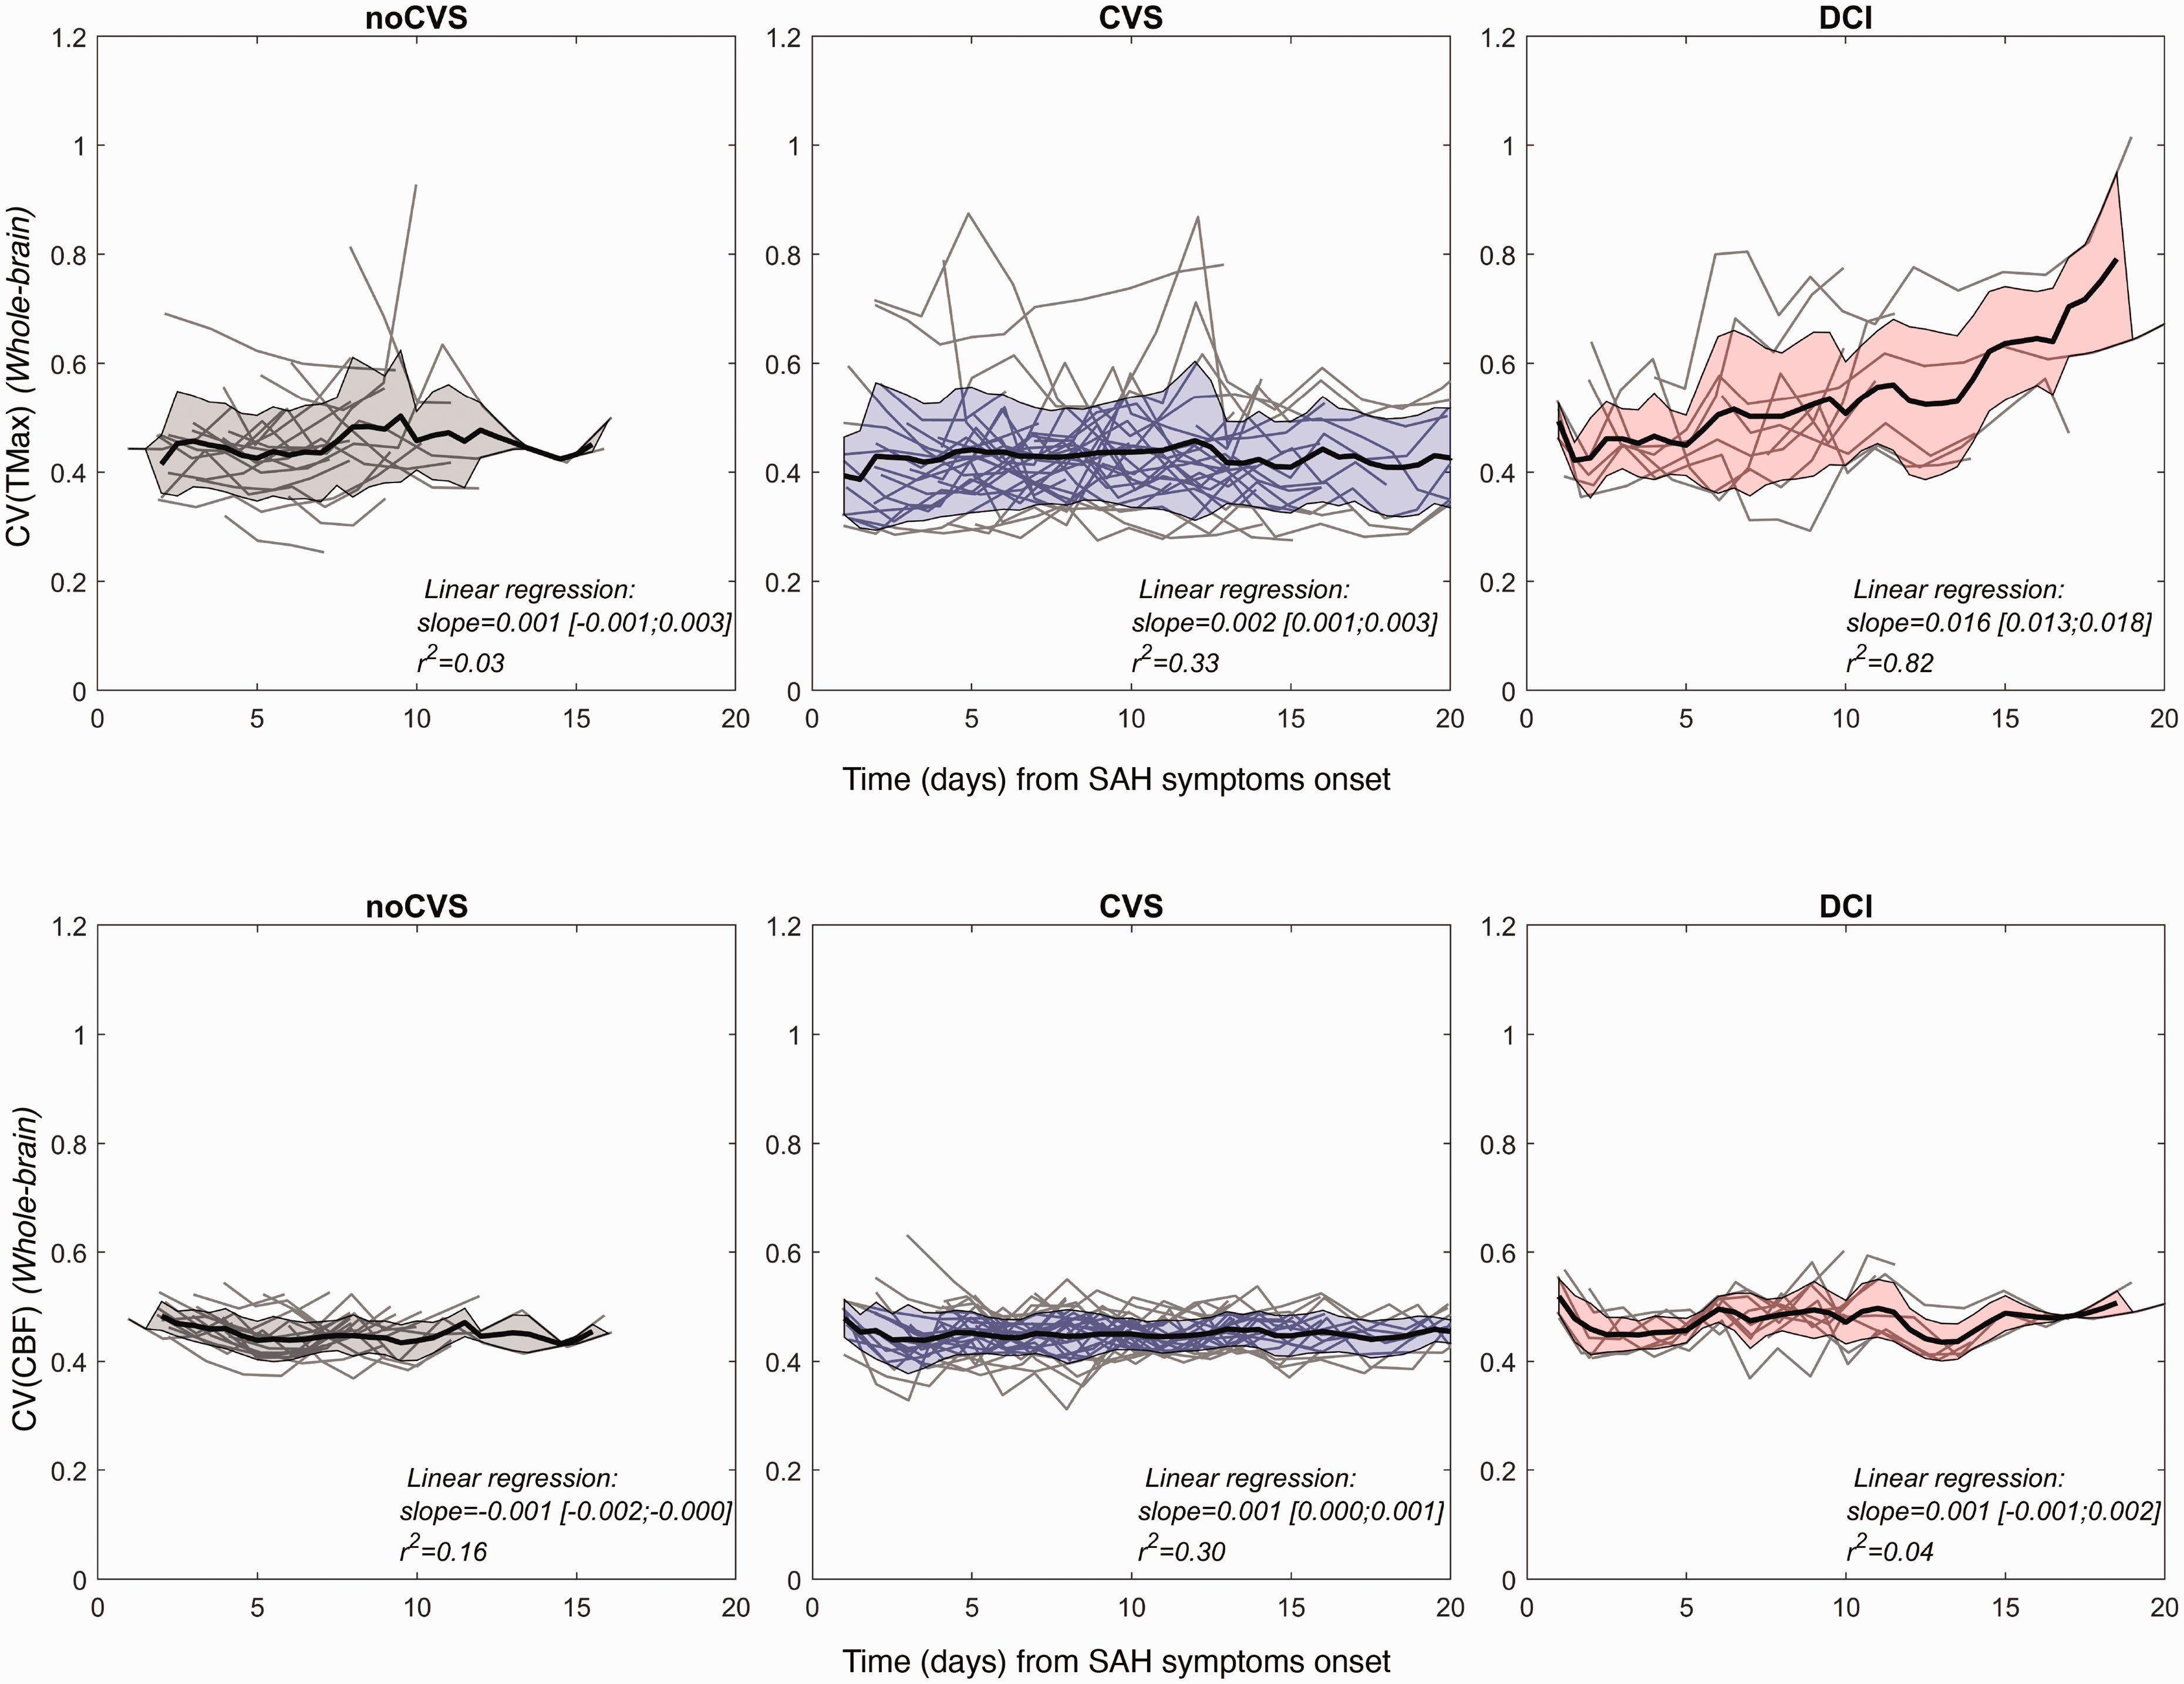
Dynamics of coefficients of variation of CTP parameters. Top row: CV(TMax). Bottom row: CV(CBF). Left panels: noCVS group. Middle panels: CVS group. Right panels: DCI group. In each panel, gray lines illustrate individual patterns, thick black curve represents a moving average (span window of 1.5 days)) and shaded area represent the inter-subject standard deviation.
In the DCI group, following this initial drop of CV, two other features could be noted. First, for TMax parameter, CVs showed a gradual increase which is absent from the other groups (linear regression: slope = 0.02 s/day and r2 = 0.82). Second, at day 10, which is the median delay between SAH and DCI diagnosis (Figure S2), CV patterns exhibit a local maximum particularly marked for MTT (local maximum identified between day 7 and day 11.5, with a median of 10.5 days for all DCI patients) and followed by a rapid decrease. Figure 2(b) illustrates the distribution of these metrics at the early stage for CBF and for the three groups of patients.
CTP parameters’ dynamics preceding DCI
We represented the evolution of perfusion parameters in the whole brain for DCI patients zeroing time at DCI diagnosis (Figure 4). This showed that in the four days preceding DCI, mean TMax and MTT progressively increased, and CBF progressively decreased. This was accompanied by a gradual increase in CV (TMax) over the same period (Figure 4(d)). We computed the first time derivative of CTP parameters in the time window starting at day four and ending either at DCI diagnosis date for DCI patients or day twelve for the other patients. A one-way ANOVA on the absolute amplitude of this first time derivative showed a significant main effect of group for all three parameters (F(2,54) = 12.64, 8.58, 4.14 for TMax, MTT and CBF respectively, p < 0.05 for all parameters). Post-hoc comparisons demonstrated larger amplitudes of the first derivative of all CTP parameters in the DCI group compared to the noCVS (MD = −0.79, −1.76, 5.82, for TMax, MTT and CBF respectively), and for TMax and MTT compared to the CVS group (MD = −0.46, −1.07, for TMax and MTT respectively).
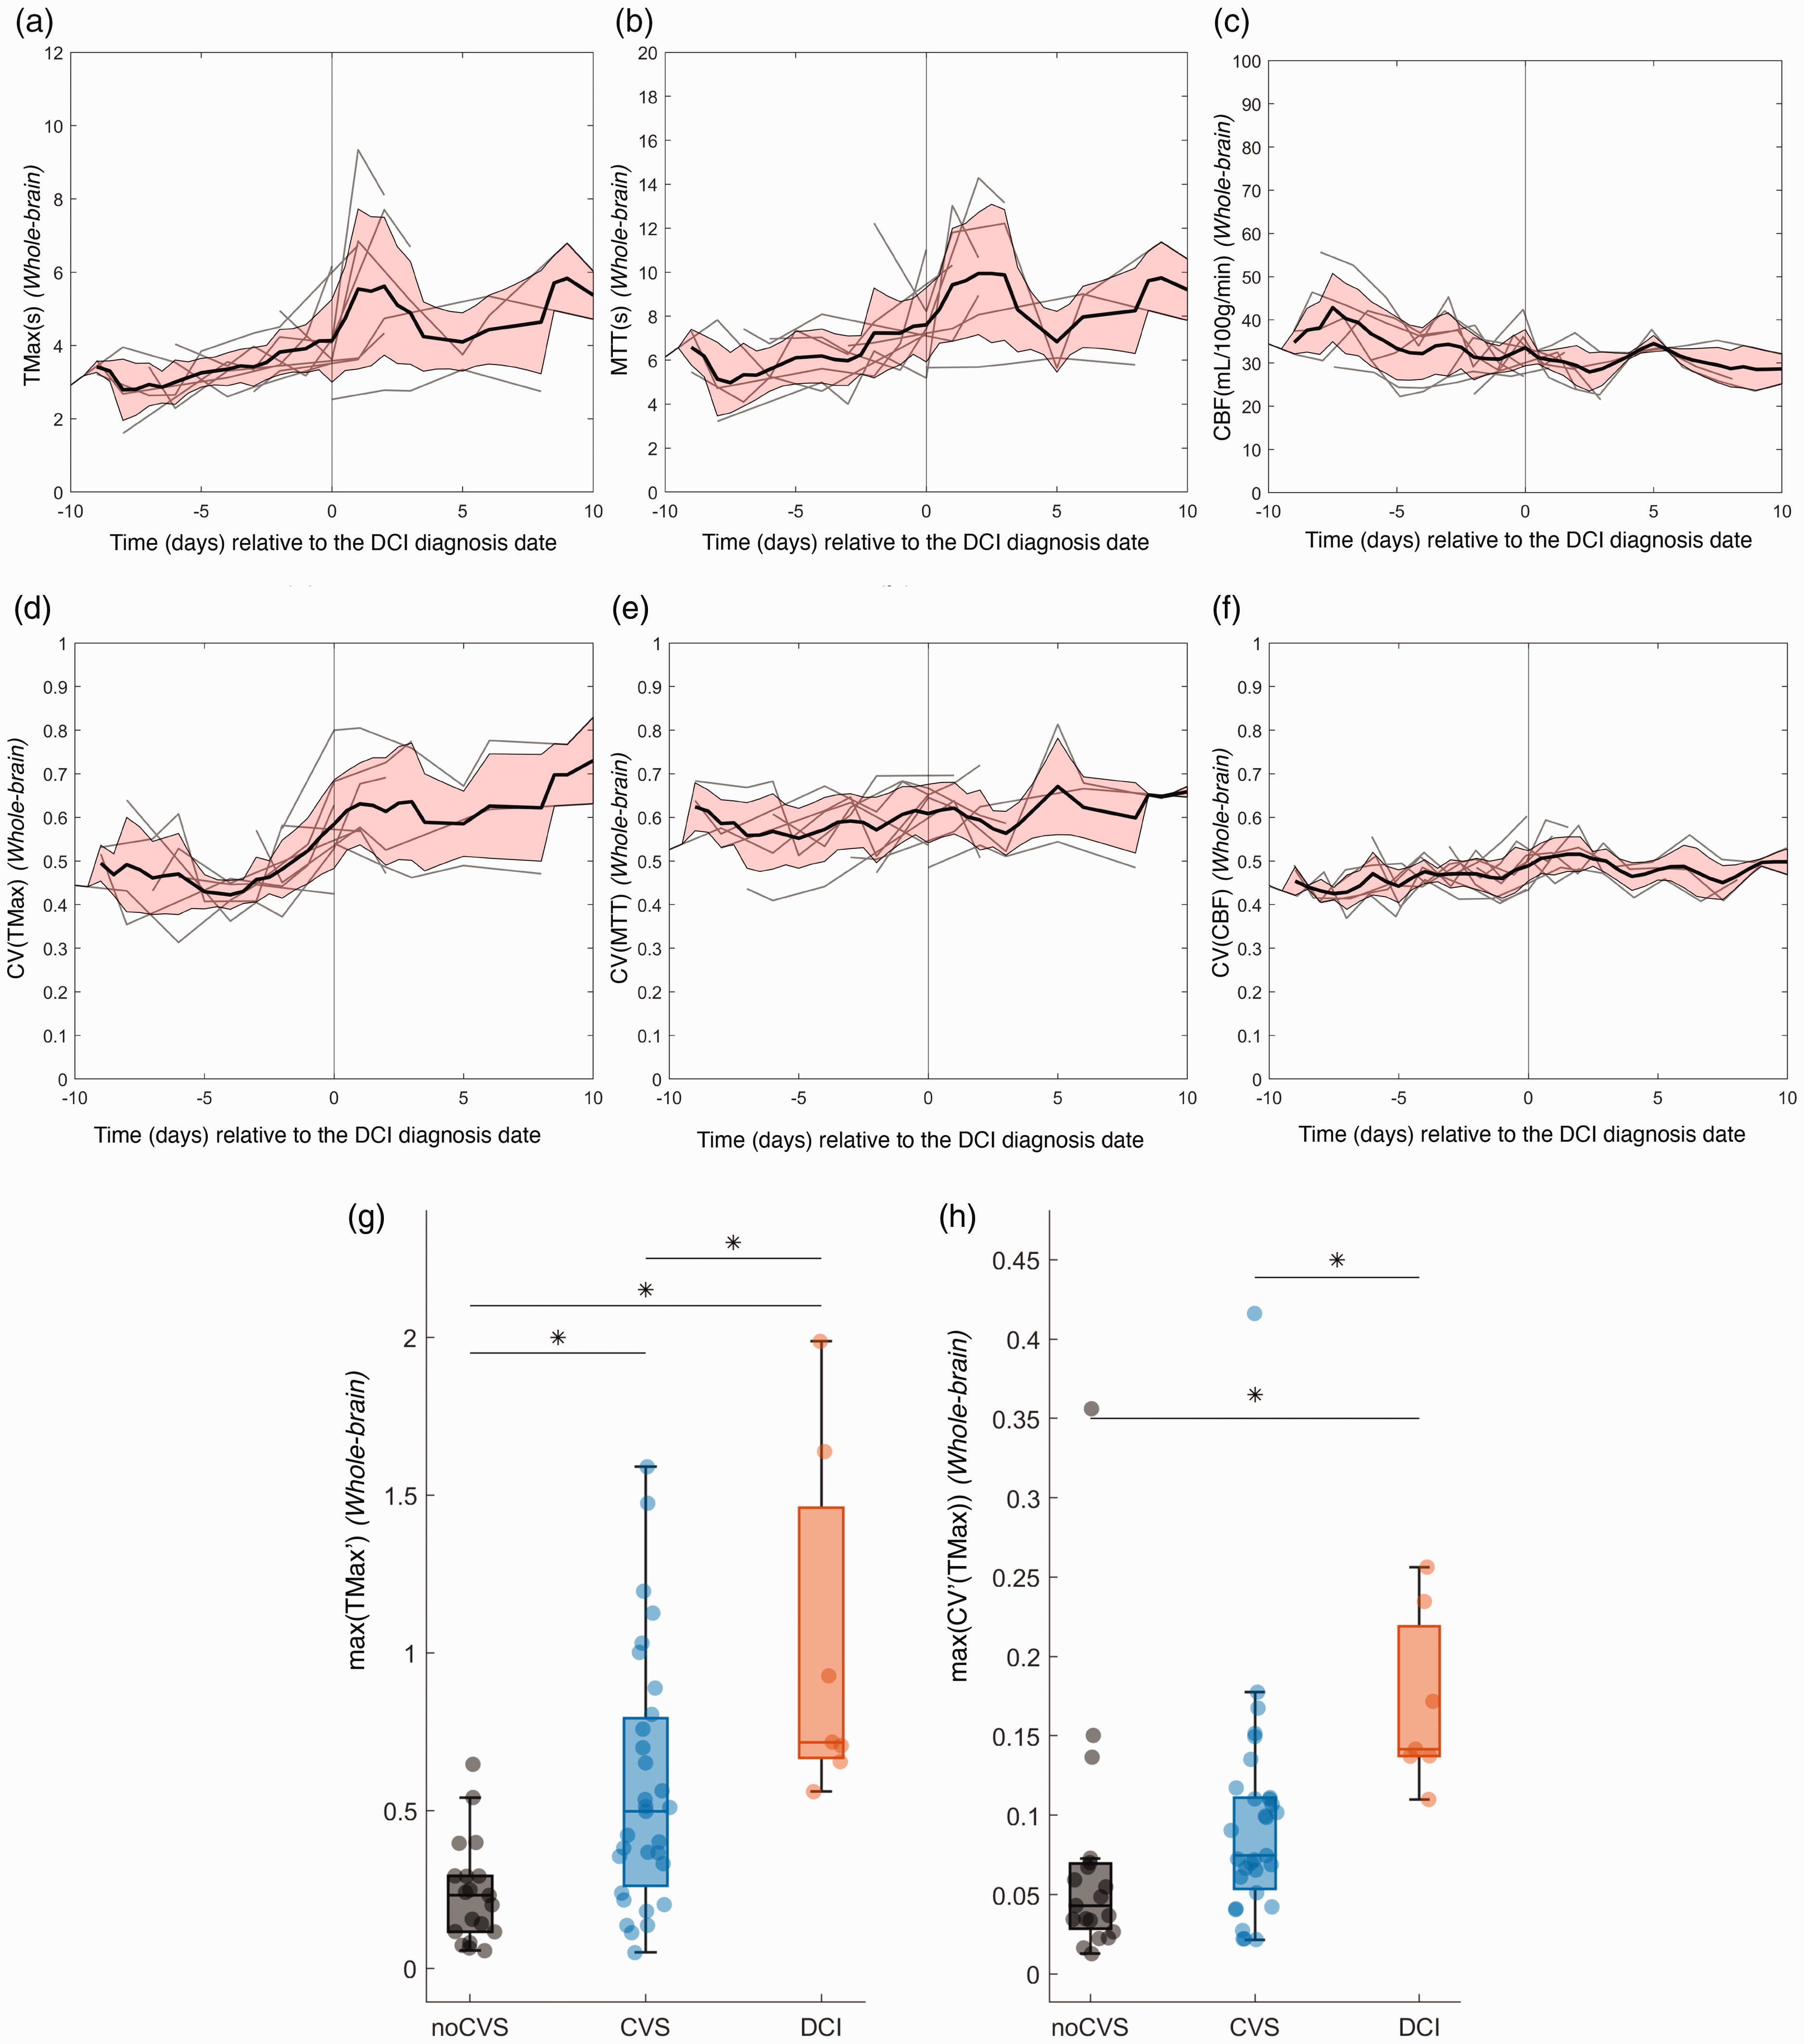
Dynamic evolution of TMax (a), MTT (b), CBF (c) and the corresponding coefficient of variation (panels (d), (e), (f), respectively) for DCI patients only, with data centered on DCI diagnosis date. Box plot of the maximum value of the first time derivative of TMax (g) and the coefficient of variation of TMax (h), respectively. The considered time window started at day 4 to either the DCI diagnosis date for DCI patients or day 12 for the other patients. Horizontal lines and asterisks indicate statistically significant pairwise comparisons after a significant main effect of group was demonstrated by a one-way ANOVA.
Similar analyses were conducted by considering the first time derivative of the CV of each parameter. Again, a one-way ANOVA showed a significant main effect of group for all three parameters (F(2,54) = 4.88, 5.80, 7.07 for TMax, MTT and CBF respectively, p < 0.05 for all parameters). Post-hoc comparisons demonstrated larger amplitudes of the first derivative of all the CV in the DCI group compared to the noCVS (MD = −0.10, −0.078, −0.043, for TMax, MTT and CBF respectively), and for TMax and MTT compared to the CVS group (MD = −0.07, −0.11, for TMax and MTT respectively). Figure 4(g) and (h) illustrates the distribution of these metrics for TMax in the three groups of patients.
Intra-individual dynamics: focus on the DCI group
At the individual scale, cerebral perfusion exhibits rapid and complex spatiotemporal variations, as illustrated in Figure S5. To further explore these intra-individual evolutions, we generated individual traces for TMax, MTT and CBF across the different arterial ROIs. Figure 5 illustrates the corresponding TMax and CBF curves for three characteristic patients from the DCI group (data for all subjects are shown in Figures S6 and S7).
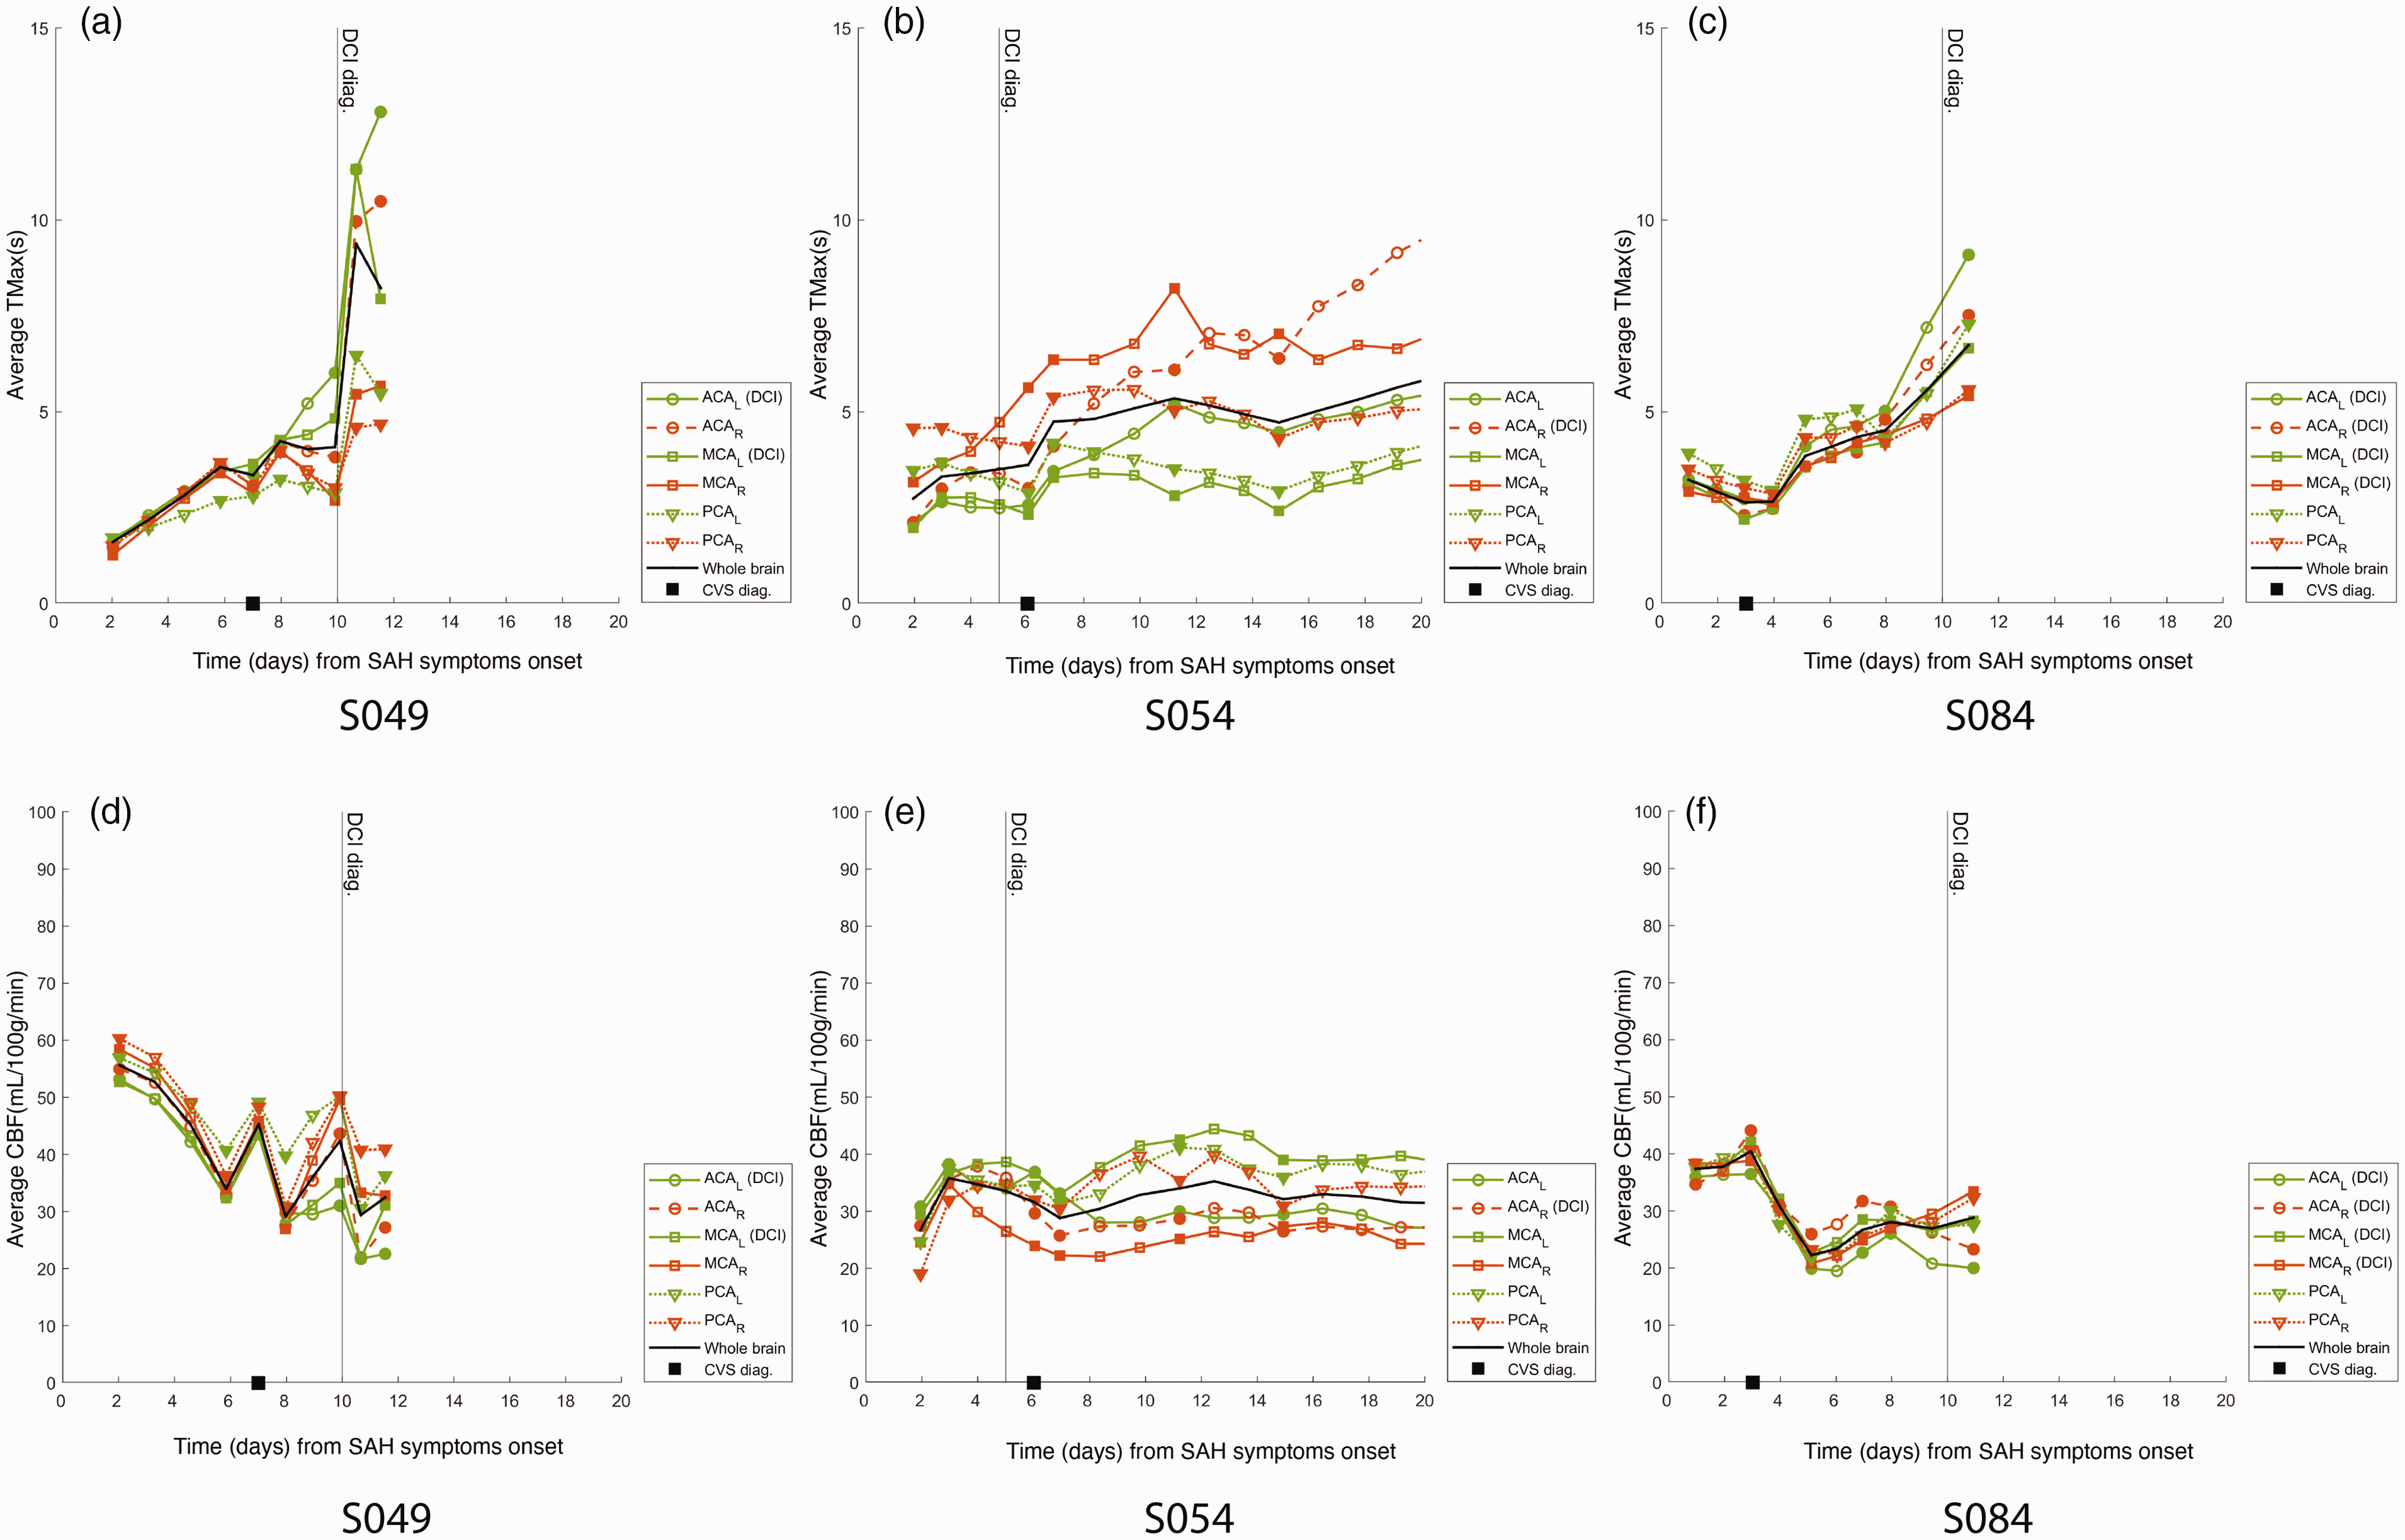
Evolution of TMax (top row) and CBF (bottom row) for three DCI patients in the ACA, MCA and PCA territories, and in the entire brain (black curve). Panels (a., d.), (b., e.) and (c., f.) respectively for patients S049, S054 and S084. Filled symbols represent original data, empty symbols represent interpolated data.
TMax dynamics followed two patterns. In a first subcategory of patients (S030, S049, S084, S088), TMax started from low values (no ROI showed mean TMax above 5 s) and progressively increased in all vascular ROIs until DCIn was diagnosed and responsible for all four patients’ death. In a second subcategory (S076, S051, S054), TMax had high early values, that secondarily either lowered (S076) or not. In this latter case (S051, S054), TMax showed high interhemispheric asymmetry, and DCIn ultimately was diagnosed in the ROIs with the highest values. In the remaining two patients (S055 and S075), early CTP data were not available, however TMax showed interhemispheric asymmetry and DCIn was diagnosed in the high TMax ROIs.
Traces from Figure 5 suggested that TMax values in different ROIs follow similar temporal patterns in single patients. Cross-correlation of TMax value in every ROI was hence performed for each exam and all patients (Figure S8). Pearson correlation coefficient was positive and ranged from 0.57 to 0.86. The strongest correlation was found between the homolateral MCA and ACA territories (r = 0.86). ACA territories also exhibited high correlation (r = 0.82). MCA territories were less strongly correlated (r = 0.59). Similar analyses on MTT and CBF data yielded comparable results, with average correlation coefficients of r = 0.78 (ranging from r = 0.65 between the left-MCA and the right-ACA to r = 0.88 between the right-ACA and right-MCA territories) for MTT, and r = 0.84 (ranging from r = 0.77 between the right-ACA and the right-PCA to r = 0.91 between the right and left PCA territories) for CBF.
CTP dynamics towards DCI
Early stage parameters
To investigate whether cerebral perfusion at the acute phase can help predict DCI occurrence, we first narrowed our analysis to the exams acquired between day 1 and day 4. Binary logistic regression classifiers were used to assess the prediction potential of different metrics for segregation between DCI and non-DCI patients: the Fisher score, the WFNS score and for the three perfusion parameters, the CV and the maximum of the first derivative within the time window were considered. The maximum of the first derivative of CBF (max(CBF′)) was identified as the only significant predictor (Estimate = 0.170, SE = 0.092, t = 1.844, p < 0.05) with an AUC of 0.76. The resulting receiving operator characteristic (ROC) curves for the max(CBF′) and WFNS parameters are shown in Figure 6. A multivariate model combining WFNS and max(CBF′) was tested and provided significant predictability (pseudo −R2 = 0.25) with an improved AUC of 0.85. A Stukel test was performed and suggested that the model was not misspecified (pStukel = 0.52). The statistics of this Early − model are given in Table S2. For this model, the optimal operating point corresponds to a specificity, sensitivity and accuracy of 0.7, 0.92 and 0.87, respectively.
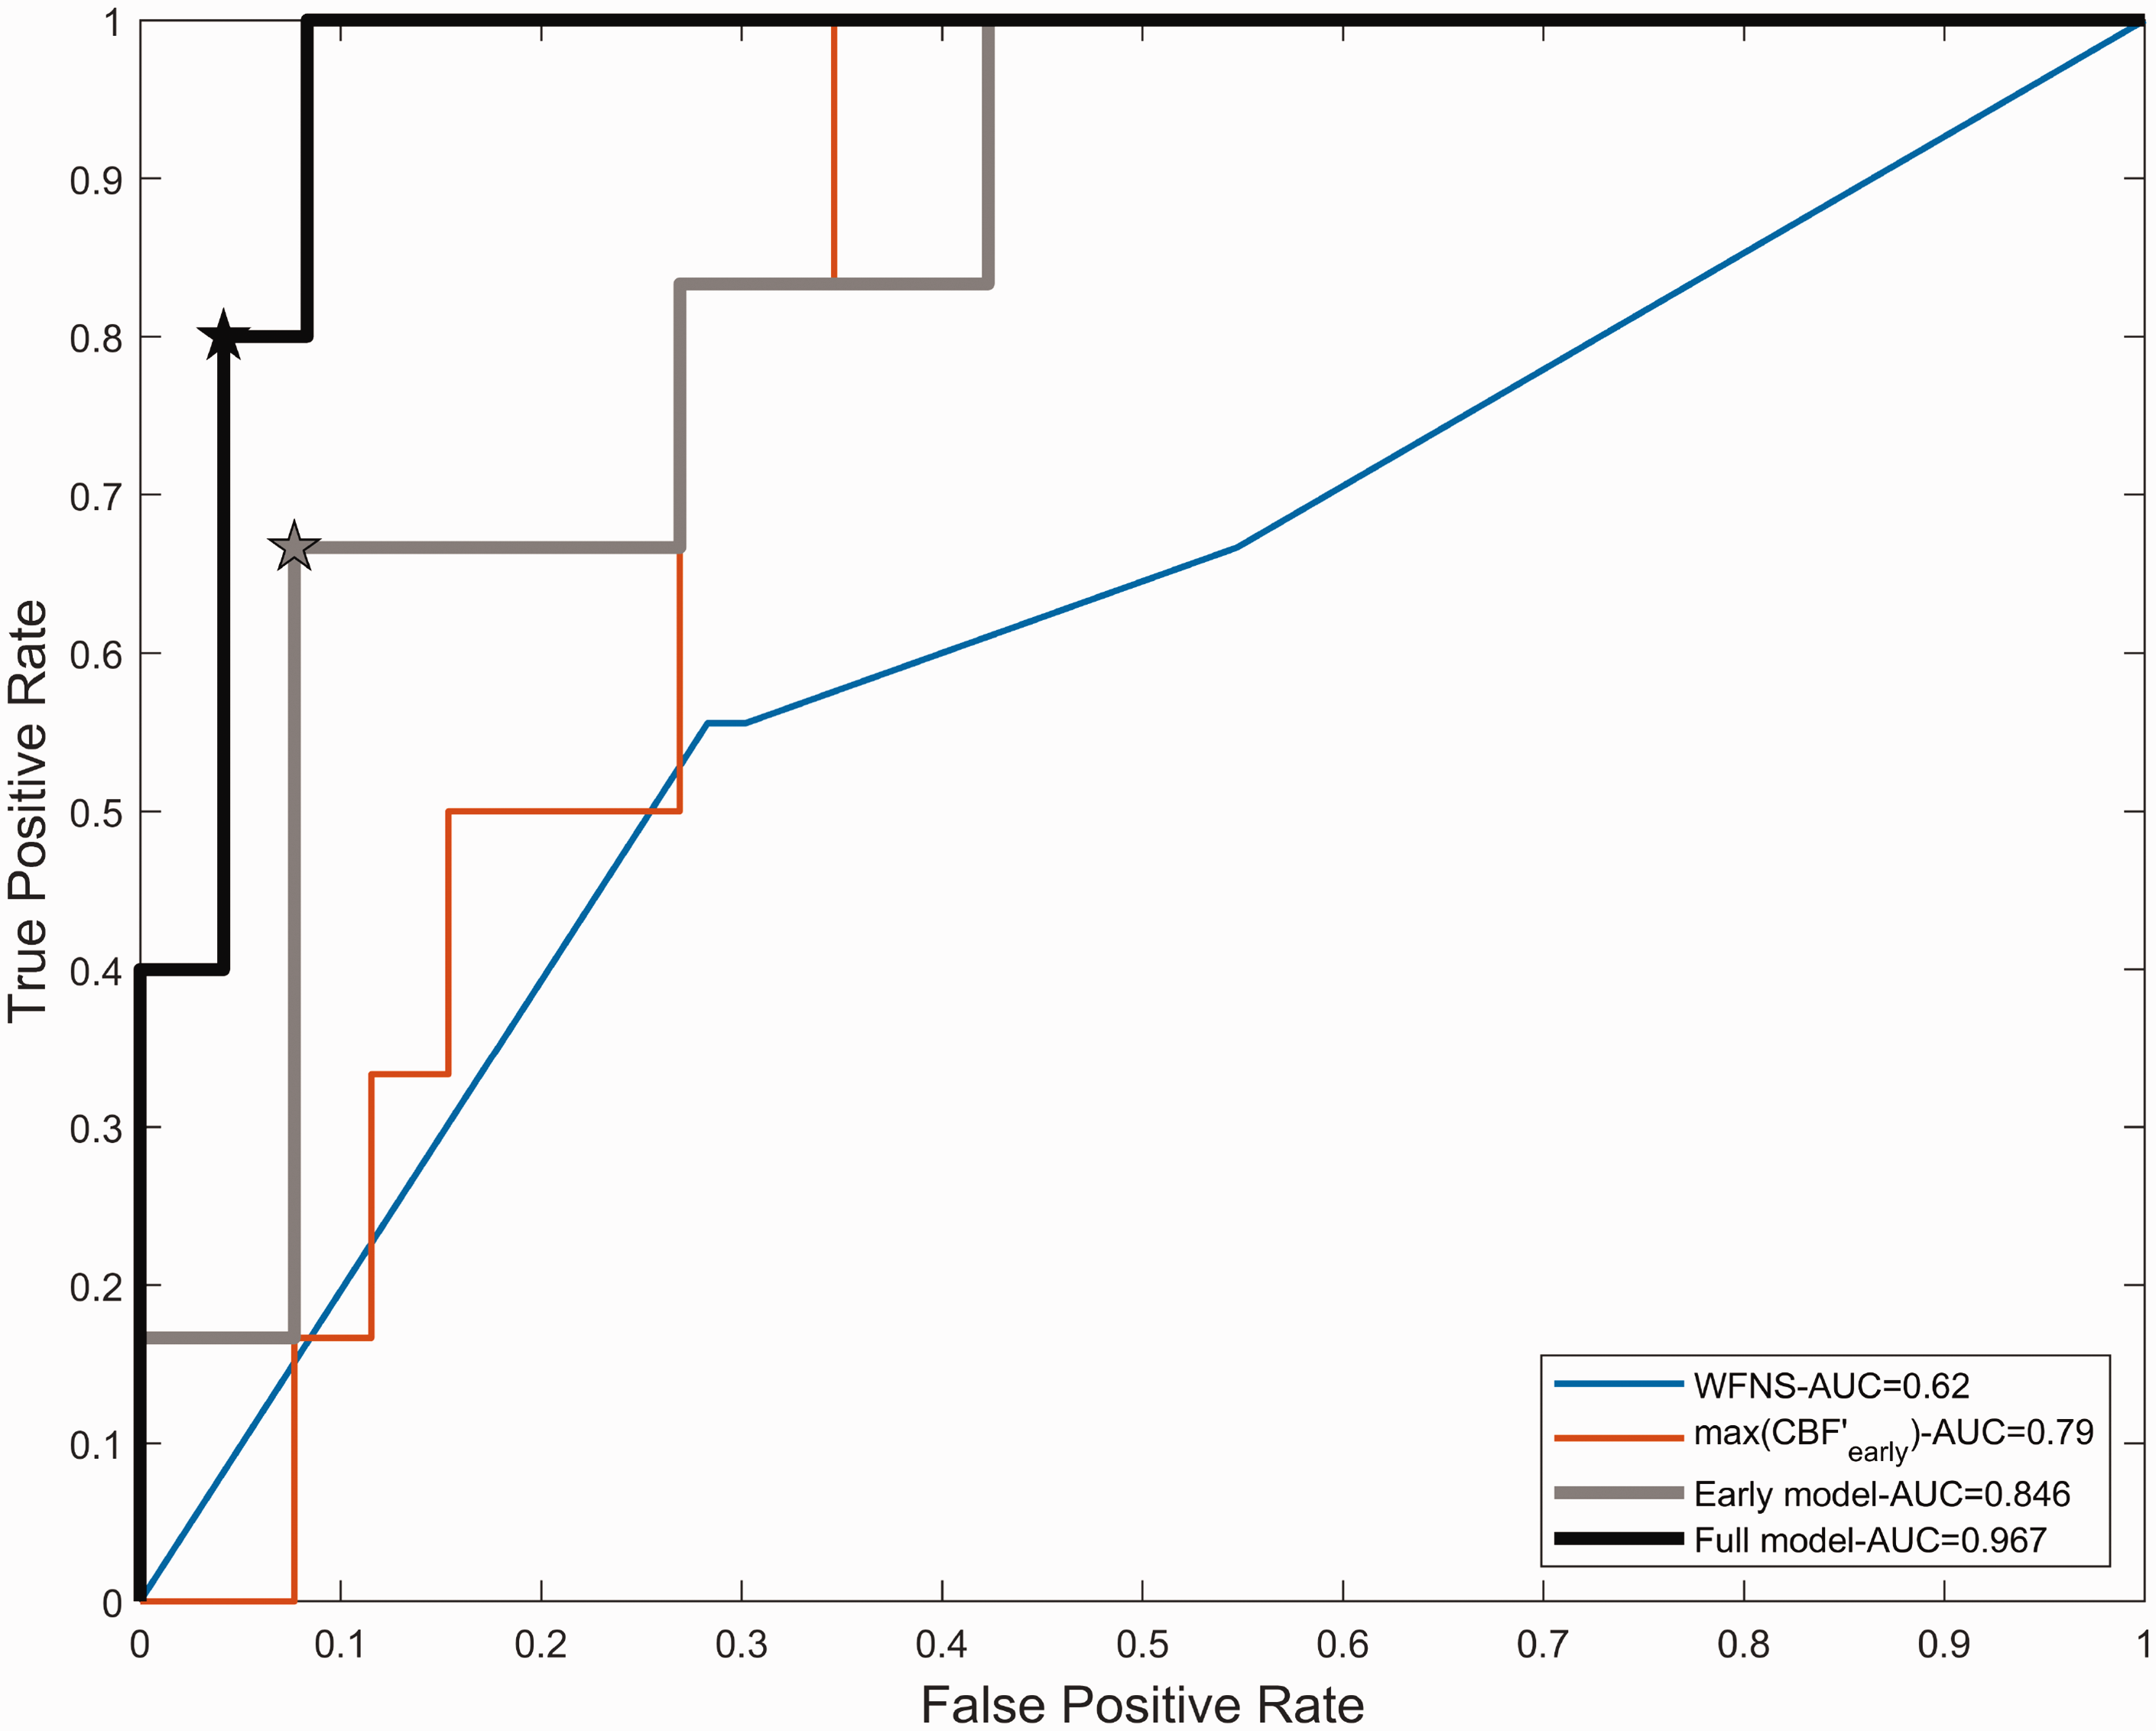
Receiver Operating Characteristic curves for the prediction of DCI obtained with WFNS alone (thin blue curve), max(CBF′early) alone (thin red curve), the so-called early model comprising both WFNS and max(CBF′early) (thick gray curve) and the so-called full-model including WFNS, max(CBF′early) and max(TMax′) as parameters. Stars indicate the optimal operating points.
Parameters’ dynamics
A multivariate logistic regression model was then built to include both the initial clinical (WFNS score), early CTP parameters characteristics (ie. Day 1-Day 4, max(CBF′early) and the temporal dynamics of CTP parameters after day 4 (ie. (max(Tmax′))). The classification performance of this model is shown by the thick black line in Figure 6. This classification model was statistically significant (pseudo − R2 = 0.54, χ2- vs. constant model: F = 14.5, p < 0.05) with a larger AUC than the so-called Early − model (Full model, AUC = 0.97,
Discussion
Summary
The present study describes the evolution of cerebral perfusion in patients diagnosed with SAH. It aimed at helping the prediction of DCI, as well as better understanding its underlying mechanisms.
We have replicated the observation that a majority of SAH patients (67.7%) experience CVS with a peak occurrence around day six. 2 We also showed again that CVS and DCI occurred in all brain regions and could not be directly related to the initial aneurysm location. This corroborates the hypothesis that DCI is more likely a global cerebral response than a direct reaction of the insulted tissues surrounding the ruptured aneurysm. 40
Our pipeline for CTP data registration and analysis allowed to describe the spatiotemporal dynamics of CTP parameters. Although considering real data only would be preferred, the generation of synthetic data provided a relevant help in inferring temporal dynamics. Results showed an early increase in CBF followed by secondary decrease in this parameter’s value, and a secondary increase in TMax and MTT, all specific to the DCI population of patients. This allowed to build a predictive model for DCI, including the WFNS score, the early variation of CBF, quantified by the maximal first time derivative amplitude max(CBF ′), and the secondary variation of TMax, quantified by the maximal first time derivative amplitude max(TMax′). This model enabled classification of DCI patients with an AUC of the corresponding ROC reaching 0.97 (0.94 after bootstrapping correction) and an accuracy of 93%.
CTP parameters’ dynamics
Group trends
In the noCVS group, no modification of CTP parameters over time could be detected, and cerebral perfusion heterogeneity was also stable, consistent with unaltered brain perfusion. In the CVS group, even though parameters were comprised in the same range and temporal variability remained low, spatial dispersion was transiently higher at the early stage, as measured with CV(MTT). This advocates for a transient alteration of cerebral perfusion taking the form of mesoscopic transit time heterogeneity in this category of patients.
Finally, in the DCI group, CTP parameters dynamics and distributions behaved differently. At the early stage, results showed an early increase in CBF, as measured by the positive CBF′, accompanied with transient perfusion heterogeneity rapidly homogenizing, revealed by a reduction in CVs of all parameters. This increase in CBF results in values exceeding those attained in the other groups, suggesting early hyperemia. Secondarily, TMax and MTT progressively increased in the days preceding DCI, as shown by the peak in their first time derivative amplitude, while CBF decreased, all indicating perfusion reduction. Meanwhile, CV(TMax) increased, signaling a concomitant increase in perfusion spatial heterogeneity.
Explanatory pathophysiological hypothesis
These results can be fitted in a putative pathophysiological framework. Indeed, SAH leads to early brain perfusion alteration through elevated ICP.2,4–6,41,42 In this context, perfusion heterogeneity can increase at the microscopic and mesoscopic scales because of microvessels obstruction and opening of arteriovenous shunts.43,44 We suggest that such heterogeneity can be measured at the mesoscopic scale with CTP by quantifying CV, which increased in CVS and DCI patients. We also propose that either the early pathological phenomena leading to perfusion heterogeneity, or this heterogeneity itself13,15,45 being reversible or not, triggers processes ultimately leading to CVS.
When early perfusion alterations are irreversible, brain hypoxia may lead to pathologically elevated CBF. 13 Our results tend to corroborate this prediction, showing early hyperemia, as measured by CBF, in DCI patients. This hyperemia, stemming from either adaptive behavior to definitive perfusion defects or altered blood flow regulation, 46 could in turn worsen perfusion and its heterogeneity,47,48 by increasing bloodbrain barrier damage, edema, or microvascular shunt.13,15 We indeed observed at the mesoscopic scale increases in TMax, MTT, CV(TMax), and a decrease in CBF, during the days preceding DCI.
Single-patients data
Even though CTP parameters’ whole-brain dynamics proved informative, we also propose a finer description and highlight two behaviors in DCI patients. The first one is characterized by high inter-hemispheric asymmetry in parameters’ values, as suggested by others.25,26,29 In these cases, spatially localized infarction occurred in the arterial territories displaying high TMax or MTT. The other behavior is defined by a rapid deterioration of brain perfusion from near normal values as measured with every CTP parameter, affecting the whole brain, and resulting in brain death in all of our cases.
To further describe intra-individual parameters’ distributions, we computed their cross-correlation matrix for every patient from all categories. Strong correlations were observed between the considered arterial ROIs. A larger dispersion was noted for high values of TMax and MTT reflecting the local singularities of cerebral perfusion disturbances. A strong correlation was found between the homolateral MCA and ACA territories (r ≥ 0.82 for TMax, MTT, and CBF), attributed to their shared arterial inflow. Bilateral ACA territories also exhibited high correlations (r ≥ 0.84 for TMax, MTT, and CBF), emphasizing the role of the anterior communicating artery. In contrast, the bilateral MCA territories were less strongly correlated (r ≤ 0.7 for TMax, MTT, and CBF). These observations strengthen the hypothesis of a global behavior of cerebral bloodflow. As a result, analyzing the mean parameters at the whole-brain scale provides a reasonable estimation of the state of cerebral perfusion and was used to compare perfusion dynamics in our three groups of patients. However, for a detailed analysis, this interdependence should be taken into account.
DCI prediction
We used the insights from the qualitative and quantitative description of cerebral perfusion dynamics to predict the occurrence of DCI. When considering early CTP metrics only, results suggested that the early variation of CBF (CBF ′, interpreted as the amplitude of the initial hyperemia) had the largest prediction potential. However, the predictability of DCI remained weak from a clinical point of view, reasonably because only part of the pathophysiological phenomena are taken into account. We therefore accounted for the dynamics of cerebral perfusion and included the secondary deterioration of cerebral perfusion, using the peak amplitude of the first derivative of TMax prior to DCI. This led to a satisfying prediction of DCI in our group of patients.
Limitations
Limitations regarding this study should be addressed. First, the retrospective nature of this work may be of concern. However, classification of patients was based on prospectively collected data, such that the associated bias is low. Second, the number of included patients is only moderate. Yet, it is quite consequent considering this is a monocentric study, and there was no patient’s exclusion due to other cause than an insufficient number of exploitable CTP exams. Hence, we believe that results can be generalized to the SAH population without a priori restriction. Finally, we did not consider potential confounding factors, such as intracranial pressure, in CTP parameters analysis. However, this strengthens the robustness of the model, and alleviates further potential confusion introduced by relatively late, i.e after neurosurgical and medical therapies have started, ICP measurement.
Consideration on cost and risk
CTP monitoring comes with health care costs and irradiation-related risks. These concerns have been raised in the literature, and therefore studies have been exploring them. Cost-efficiency modeling comparing CTP versus TCD based strategies for diagnosing DCI suggested that a CTP-based strategy would improve clinical outcome and reduce health care cost. 49 Taking into account induced brain cancers and cataract confirmed higher quality-adjusted life years. 50 This latter study did not model repeated CTP for close monitoring, however it did use very high irradiation-induced cancer and cataract probabilities. Hence, it is reasonable to anticipate that a better prediction and early diagnosis of CVS and DCI, although requiring several CTP, will come at a low cost-efficiency ratio and lead to higher quality-adjusted life years.
Conclusion and perspectives
In this retrospective monocentric study, we showed that the dynamics of CTP parameters allowed to predict the occurrence of DCI in SAH patients. We also suggested that these dynamics corroborate current pathophysiological hypotheses for DCI, including an early alteration of brain perfusion, measured as an increased mesoscopic transit time heterogeneity, quantified by the coefficient of variation of MTT, followed by inappropriate cerebrovascular response resulting in hyperemia. Secondarily, brain perfusion deteriorates, measured as an increase in TMax, ultimately leading to DCI. We described two characteristic behaviors in the DCI patients population, one showing high interhemispheric asymmetry in perfusion parameters, the other secondary rapid whole-brain perfusion deterioration. Using only two metrics derived from CTP parameters, the amplitude of the first time derivative of blood flow CBF′ reflecting the early perfusion alteration, and the amplitude of the first time derivative of TMax, TMax′, as an indicator for secondary deterioration, we built a comprehensive predictive model for DCI. We hence suggest that CTP monitoring comprising at least two exams at the early stage, for instance day 0 and day 2 to measure early CBF variation, and exams spaced 2 days apart from one another during the high-risk period, for example at days 5, 7 and 9 to measure secondary increase in TMax, would allow DCI prediction and early diagnosis. Future work could then focus on triggers for rescue interventions and on fundamental aspects to identify causal mechanisms leading to DCI, in an effort to develop new therapeutic strategies.
Supplemental Material
sj-pdf-1-jcb-10.1177_0271678X251361254 - Supplemental material for Spatiotemporal dynamics of computed tomography perfusion (CTP) parameters following aneurysmal subarachnoid hemorrhage (SAH)
Supplemental material, sj-pdf-1-jcb-10.1177_0271678X251361254 for Spatiotemporal dynamics of computed tomography perfusion (CTP) parameters following aneurysmal subarachnoid hemorrhage (SAH) by Vivien Szabo, Quentin Mesnildrey, Cyril Dargazanli, Florentin Kucharczak, Alexandre Kobbai, Pierre-François Perrigault and Kévin Chalard in Journal of Cerebral Blood Flow & Metabolism
Footnotes
Ethics approval
The present study was approved by Montpellier ethics committee (2018−IRB−MTP −02 − 11) in accordance with French regulation. There was no invasive procedure in addition to French ICUs standard of care, patients or their family were informed of the study and could opt out of it, according to French law.
Data availability
Funding
The author(s) disclosed receipt of the following financial support for the research, authorship, and/or publication of this article: Vivien Szabo is supported by the Fondation Bettencourt Schueller, sponsor of the CCA-Inserm-Bettencourt program.
Acknowledgements
We would like to thank our entire medical team of intensive care physicians and anaesthesiologists, as well as all the neurosurgeons, neuroradiologists and rehabilitation specialists involved in the care of the patients.
Declaration of conflicting interests
The author(s) declared no potential conflicts of interest with respect to the research, authorship, and/or publication of this article.
Authors’ contributions
Supplemental material
Supplemental material for this article is available online.
References
Supplementary Material
Please find the following supplemental material available below.
For Open Access articles published under a Creative Commons License, all supplemental material carries the same license as the article it is associated with.
For non-Open Access articles published, all supplemental material carries a non-exclusive license, and permission requests for re-use of supplemental material or any part of supplemental material shall be sent directly to the copyright owner as specified in the copyright notice associated with the article.