
Abstract
Spreading depolarizations cause cortical electrical potential changes over a wide spectral range that includes slow potentials approaching the direct current (or 0 Hz) level. The negative direct current shift (<0.05 Hz) is an important identifier of cortical depolarization and its duration is a measure of potential tissue injury associated with longer lasting depolarizations. To determine the feasibility of monitoring the full signal bandwidth of spreading depolarizations in patients, we performed subdural electrocorticography using platinum electrode strips and direct current-coupled amplifiers in 27 patients with acute brain injury at two neurosurgical centers. While large baseline direct current offsets developed, loss of data due to amplifier saturation was minimal and rates of baseline drift throughout recordings were generally low. Transient negative direct current shifts of spreading depolarizations were easily recognized and in 306/551 (56%) cases had stereotyped, measurable characteristics. Following a standardized training session, novice scorers achieved a high degree of accuracy and interobserver reliability in identifying depolarizations, suggesting that direct current-coupled recordings can facilitate bedside diagnosis for future trials or clinical decision-making. We conclude that intracranial monitoring of slow potentials can be achieved with platinum electrodes and that unfiltered, direct current-coupled recordings are advantageous for identifying and assessing the impact of spreading depolarizations.
Keywords
Introduction
Monitoring of spreading depolarizations (SD) for research and, increasingly, as a potential target and guide for neurointensive care in patients with stroke and traumatic brain injury1,2 poses unique methodological challenges in clinical neurophysiology. The electrocorticographic (ECoG) technique originally adopted by Strong et al., 3 using linear subdural electrode strips, was borrowed from methods to evaluate patients with refractory epilepsy who were candidates for surgical treatment. In such patients, ECoG recordings from surgically placed electrode grids and strips are evaluated to determine the seizure focus for resection and define the borders of eloquent regions of cerebral cortex to maximize functional sparing from the procedure. 4 Such preoperative recordings evaluate cortical activity in the frequency range of local field potentials that reflect functional activity, as well as pathologic activity including seizures and fast ripples. These activities occur at frequencies up to 200 Hz or more and are recorded with AC-coupled amplifiers which, due to capacitive coupling in the amplifier, filter slow (<0.1 Hz) and direct current (or 0 Hz) potentials. 5
SDs, by contrast, can induce changes in both slow and higher frequency bands. Particularly, the hallmark of SD is a negative DC shift in the milli-Hertz range (≤0.05 Hz) that reflects the mass breakdown of electrochemical membrane gradients and reaches up to 20 mV in amplitude.6–8 The depolarization block of synaptic activity, along with subsequent factors, 9 further cause suppression of cortical activity, known as spreading depression, in the functional range of 0.5–70 Hz. Thus, with AC-coupled (>0.5 Hz) recordings, Strong et al. identified spreading depression episodes in five of 14 patients with acute brain injury. 3 This frequency band alone, however, does not reliably identify all SDs, since (1) a depolarization wavefront propagating perpendicular to the axis of an electrode strip will result in near-simultaneous depression along the strip, making it indistinguishable from other causes of synchronous depression; (2) determination of spread is uncertain when depolarizations propagate to only one or two electrode locations; and (3) depolarizations can occur in injured tissue where baseline suppression of cortical activity (i.e. isoelectricity) precludes the possibility for spreading depression. In these cases especially, recording of the DC shift is essential for identification of SD.
The limitations of traditional AC-coupled techniques for SD monitoring have been partially overcome by the use of amplifiers with higher time constants, i.e. lower limit of high-pass filtering.10,11 With a lower limit of 0.02 Hz, the slow roll-off of the attenuation curve of the filter allows for detection of slow potential changes (SPCs) that reflect the negative DC potential shifts of SDs. 12 That is, filtering at 0.02 Hz distorts the waveform and substantially attenuates the amplitude of the negative DC potential shift, but the resulting SPC signals its occurrence. Thus, detection of SPCs overcomes the problem of false negatives encountered with recordings of only higher (0.5–70 Hz) frequency bands by distinguishing between different causes of depressed activity in individual recording channels and allowing identification of SDs in electrically silent tissue. AC-coupled ECoG with a lower limit of 0.02 Hz is therefore currently considered the minimum standard for clinical SD monitoring. 13 However, the waveform distortion and amplitude attenuation of SPCs obtained even with this lower filter limit degrades the signal-to-noise ratio and precludes recording of the true cortical DC potential.
A few studies have now highlighted that it is possible to make unfiltered, full-band recordings with DC-coupled amplifiers from platinum electrodes in patients.14–18 DC recordings are the gold standard in animal studies, particularly because the duration of depolarization, measured by the DC shift, reflects the potential to induce permanent neuronal damage.14,19–23 For clinicians, recording the unfiltered DC shift may thus provide further diagnostic information beyond the mere presence of SD by distinguishing shorter events (∼2 min) from longer ones that signal metabolic insufficiency and developing excitotoxic injury.14,17,24 Another potential advantage is a high signal-to-noise ratio of DC shifts, compared to AC-coupled SPCs, which may facilitate rapid and unambiguous bedside recognition of events. Despite this promise, prior clinical studies have only used DC recordings as an adjunct to AC-coupled ECoG, and reporting of DC data has been mainly anecdotal, raising questions of whether DC-ECoG can be used as a reliable, stand-alone technique. In particular, DC-ECoG introduces its own difficulties and new questions for SD recording and assessment. These include the problems of baseline drift and offset with platinum electrodes, which may interfere with data acquisition and review, and the need for monopolar data acquisition to assess DC waveforms. Here we address these and other basic issues to evaluate the feasibility and advantage of DC-coupled ECoG for clinical SD monitoring.
Methods
Patients were consecutively enrolled in prospective observational studies at two centers of the Co-Operative Studies on Brain Injury Depolarizations, the University of Cincinnati Medical Center (UCMC; n = 15, June 2012 to July 2013) and the University of New Mexico (UNM; n = 12, December 2013 to May 2015). Inclusion criteria were the clinical decision for neurological surgery to treat acute traumatic brain injury or cerebrovascular disease, and age ≥ 18 years. Studies were approved by the University of Cincinnati and University of New Mexico Institutional Review Boards as protocol numbers 08-06-12-01 and 10-159, respectively. Written informed consent for research was obtained from patients' legally authorized representatives and protocols were conducted in accordance with the Helsinki Declaration of 1975 and as revised in 1983.
At the conclusion of neurosurgical procedures to treat injuries, an electrode strip was placed subdurally on the surface of viable peri-lesion cortex judged to be at highest risk for secondary injury.9,10,15 The strip contained six platinum electrodes with 10 mm spacing between contacts (Wyler, Ad-Tech Medical, Racine, WI or Auragen, Integra Epilepsy, Plainsboro, NJ). After surgery, patients were transferred to the intensive care unit where continuous ECoG was recorded. At both centers, recordings were obtained in a monopolar fashion using DC-coupled amplifiers. Scalp references for the intracranial leads were provided by a subdermal platinum needle (Grass Technologies, Warwick, RI; UCMC) or Ag/AgCl surface (Rhythmlink Sticky Pad, Columbia, SC; UNM) electrode placed at the mastoid. Platinum needle electrodes were secured with collodion-saturated gauze. At UCMC, recordings were made with the g.USBamp amplifier (Guger Technologies, Graz, Austria) and custom data acquisition software based on BCI2000, a brain–computer interface tool written in C+ + to support a variety of data acquisition systems.15,25 The amplifier has an input impedance >100 MΩ and a single electrode input range of ±250 mV, providing a total dynamic range of ±500 mV. The sampling rate was set to 1200 Hz for acquisition (frequency range: 0–600 Hz) and traces were down-sampled to 200 Hz for analysis. At UNM, recordings were made at a sampling frequency of 256 Hz (frequency range: 0–128 Hz) with the Component Neuromonitoring System 200 (CNS-200, Moberg Research, Ambler, PA), which has an amplifier with input impedance of 100 MΩ and range of ± 244 mV. Data were recorded without filtering.
Data processing and analysis
At both sites, ECoG recordings were exported from the acquisition devices and imported to LabChart software (ADInstruments, Inc., Colorado Spring, CO) for off-line scoring and analysis. Recordings were first scored in entirety for the occurrence of each unique SD wave occurring along the electrode strip. For this purpose, recordings were displayed in duplicate as (a) monopolar displays of slow potentials and (b) sequential bipolar derivations of high-frequency activity (0.5–50 Hz band-pass) of successive electrode pairs (1–2, 2–3, etc.). Monopolar traces could be displayed as either raw DC potentials (Figure 1, top traces) or with a 0.01 Hz digital high-pass filter. Filtering at 0.01 Hz zeroes the signal baseline and reveals SPCs, which are distortions of the negative DC shift of SD, as explained above.11,12 Individual SD waves occurring on the electrode strip were then identified by (a) the simultaneous occurrence of a negative DC shift (or SPC) and depression of high-frequency spontaneous activity on at least one electrode, and (b) sequential occurrence of either depression period or DC shift at a minimum of two electrodes, evidencing spread of the wave (Figure 1).
Representative full-band (DC-coupled) recordings of spreading depolarizations. (a) Two spreading depolarizations are observed propagating across the full electrode strip from electrodes 6→1, as evidenced by negative DC shifts and depressions of 0.5–50 Hz spontaneous activity. Analysis focused on electrode 3 and included comparison of depression periods (lower traces) in monopolar (electrode 3 versus reference, gold) and bipolar (electrode 3 versus 4; green) channel derivations. (b) In total, 416 (43%) of 967 spreading depolarizations did not propagate to electrode 3, as shown in this example.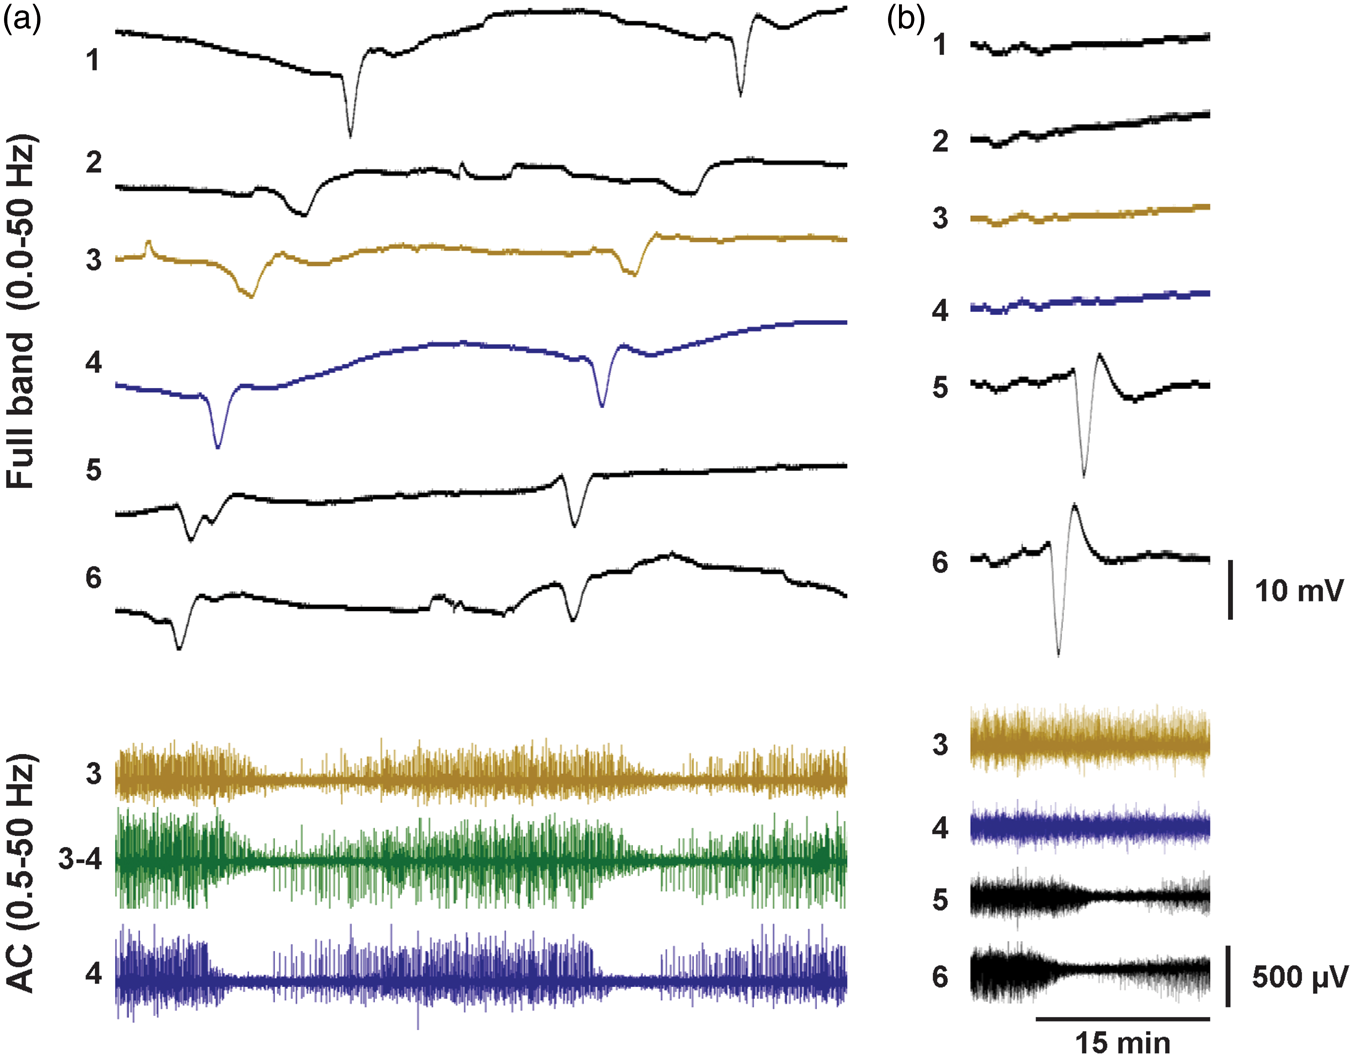
The characteristics of each SD were then quantified at a single electrode (electrode 3) for each patient. If the SD occurred on electrode 3, the following measures were taken: (1) amplitude and (2) duration of the raw, unfiltered DC shift in the monopolar trace, (3) depth and (4) duration of spontaneous activity depression in the monopolar trace of electrode 3, and (5) depth and (6) duration of spontaneous activity depression in the bipolar derivation of electrode 3 minus 4. DC shift durations were measured from the initial negative deviation from baseline until recovery to the same level, and amplitudes were measured from the same start point to the peak negativity. DC shifts of SD were not scored if the waveform was atypical, e.g. lacking a predominant sharp negative potential, if the baseline potential surrounding the waveform was severely drifting, or if the wave was contaminated by artifact.
Depressions of spontaneous activity (0.5–50 Hz) were measured by computing the integral of the total power of the 0.5–50 Hz signal. Because the raw integral increases indefinitely over time, a 60 s decay time constant was applied to the power signal used in the integral calculation. The integral therefore reflects a moving window of only recent activity, allowing the value to remain constant through time when total power remains constant, and to decrease or increase from this steady level when cortical activity changes. Depression durations were measured from the start of decrease of the power integral to the start of its recovery. Depth of depression is expressed as the fraction of the baseline power integral that is lost at the time of maximal depression [(Intbase – Intmax depr) / Intbase]. For assessment of bipolar traces, we scored only continuous depression periods to which electrode 3 or both electrodes 3 and 4 contributed, as judged by examination of the monopolar recordings; depressions solely attributable to activity on electrode 4 were excluded.
To assess DC signal offset and drift, mean values and slopes were computed for 2 min data segments every 4 h throughout recordings to achieve an unbiased and representative sampling.
In vitro electrode tests
To test electrode polarization, impedance, and drift, a six-contact platinum electrode strip (Wyler, AdTech Medical, Racine, WI) and Ag/AgCl reference electrode were submerged in a 100 ml beaker filled with 0.9% saline. A ± 5 nA current source was connected across the lead electrodes and reference for current-induced polarization tests, and the reference was connected to the current return node (i.e. ground) of the current source. The voltage response was recorded with a precision instrument amplifier (LT1167, Liner Technology) with gain = 25.7 and a 34401A digital multimeter with 0.33 Hz sampling. Impedance measurements were made using the same current source and the frequency of the output was adjusted using a function generator (Agilent 33220A). The current source was connected to a 5 kΩ current-sensing resistor and to the load (Pt electrode and Ag/AgCl reference electrode in saline) in series. The voltage across the current-sensing resistor and the load was first amplified and then measured with an oscilloscope (Tektronix TDS3052C). The current through the load was calculated as the measured voltage across the resistor divided by the amplifier gain and 5 kΩ resistance. The load impedance was then calculated as the measured voltage divided by the amplifier gain and the measured current. Potential drift was measured with a DC-coupled instrumentation amplifier (AD8220, Analog Devices) with gain = 25.
Novice scoring and interobserver reliability
To determine whether health care providers without ECoG experience could learn to recognize SD in DC-coupled recordings, 13 volunteers were recruited from the neurosurgery and neurology staff and faculty at UNM under an IRB-approved protocol. Subjects were administered a 30 min standardized presentation describing the characteristic features of SD and the use of LabChart Reader (ADInstruments, Inc.) for data review. A 30 min group practice session was then conducted using a 24 h sample patient dataset. For testing, subjects were then given a USB stick with the required software and four 24 h (96 h total) testing samples from three patients at UNM. The ground truth of SD occurrences in these datasets was determined by experienced reviewers (APC and CWS) according to criteria described above. Other artifactual events were defined to serve as a true negative denominator. For each subject, the true positive rate (TPR), false positive rate (FPR), and kappa statistic (a summary statistic of overall testing accuracy) were calculated as well as the overall mean values. Krippendorff alpha was used as a measure of interobserver reliability both among subjects and as compared to the ground truth. Statistical analysis was performed using SAS.
Results
DC-coupled ECoG recordings were obtained in 15 patients with traumatic brain injury at UCMC and 12 patients at UNM with aneurysmal subarachnoid hemorrhage (n = 8), traumatic brain injury (n = 2), or ischemic stroke (n = 2). Median age was 53 years (interquartile range (IQR): 32–61) and 16/27 (59%) patients were male. Recording durations per patient were 78 h (median; IQR: 32–101) at UCMC and 128 h (79–172) at UNM. Based on standard review of these recordings by established methods,10,26,27 a total of 967 unique SDs were observed traversing at least two electrodes of the six-contact subdural recording strip. These events occurred in 22 (81%) patients, for whom the median depolarization count was 28 (IQR: 8–84).
DC offset and drift
We first examined ECoG recordings to determine the stability of baseline potentials within the input range of the DC-coupled amplifiers. Representative 12 h traces from single monopolar recording channels show the wide range of sustained DC offsets, as well as significant fluctuation of baseline potential over this time scale (Figure 2(a)). Faster, transient changes (minutes or less) superimposed on this background include DC shifts of SDs, artifacts, and possibly other slow signals of biologic origin.
Baseline direct current (DC) offset and drift. (a) Twelve hours of raw DC recordings from three different patients are shown as representative examples of baseline potential offsets and drifts. The offset level is shown at left. Among artifacts and other transients, the negative DC shifts of spreading depolarizations are observed in the first and third traces (arrows). Histograms of DC offset potentials (b) and DC drift rates (c) at UCMC and UNM were compiled based on assessments made every 4 h throughout recordings.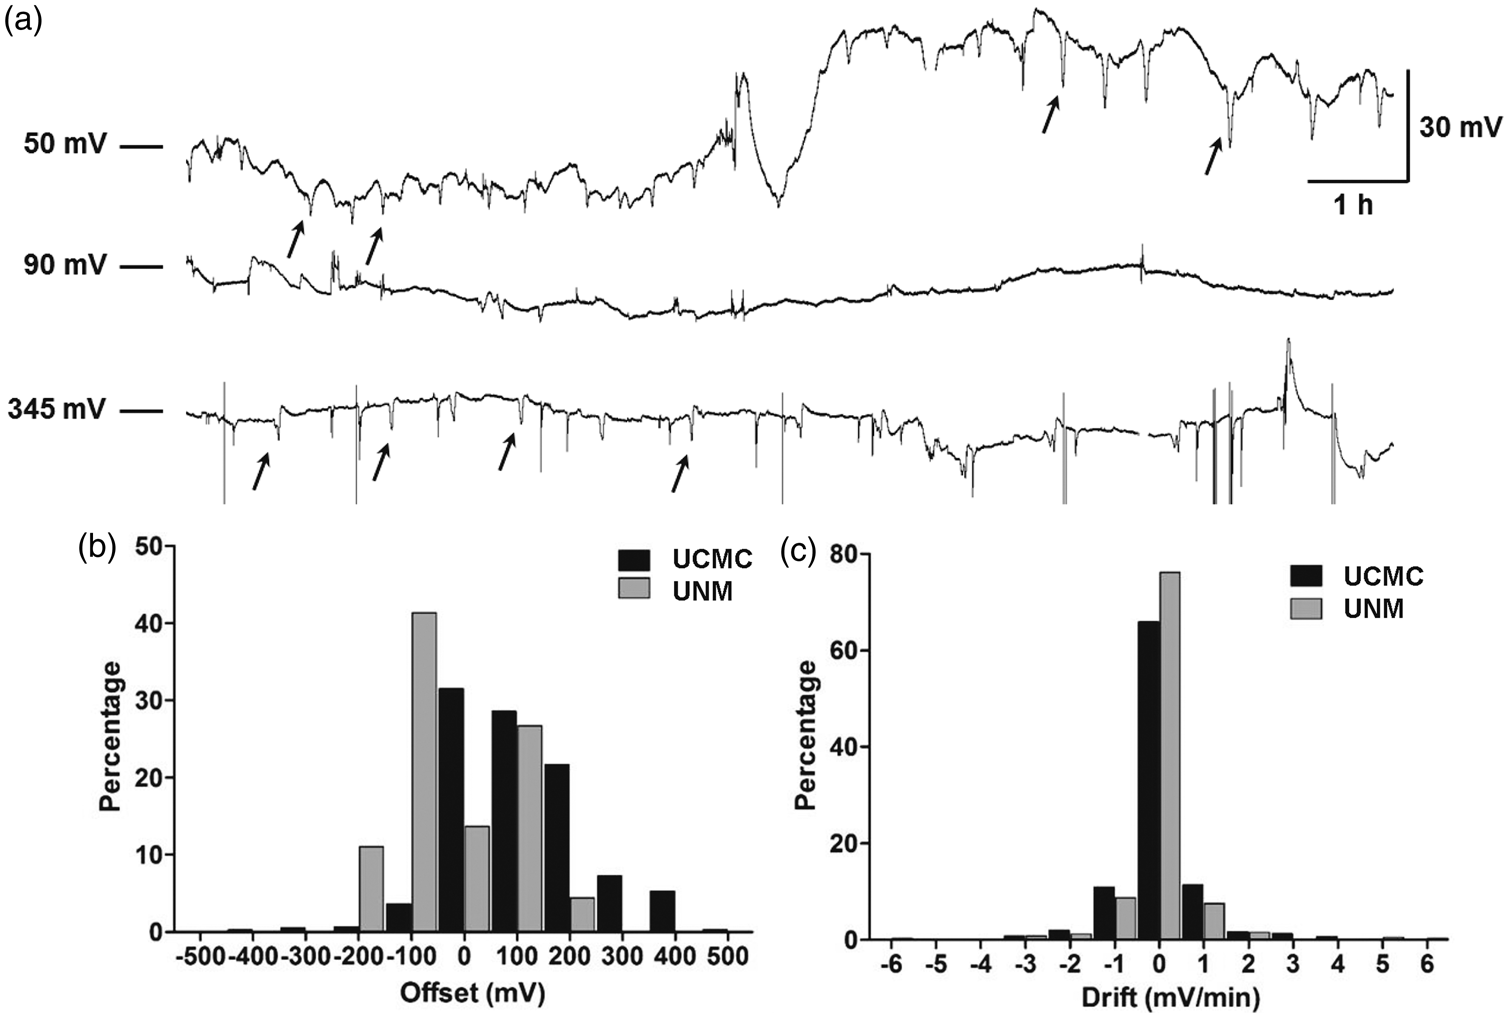
Figure 2(b) shows that the distributions of offset potentials differed significantly between the two study centers (p < 0.001, Mann–Whitney U-test). Offsets at UCMC were predominantly positive (median: 84 mV, IQR: 24–186), while UNM offsets were centered around zero (median: -50 mV, IQR: -104 to 70). The differences may partly reflect the use of platinum needle references at UCMC, compared to nonpolarizable Ag/AgCl references at UNM. At UCMC, extreme values in excess of ±250 mV were recorded when the reference electrode was accidentally disconnected, but there was no loss of data due to the wide dynamic range of the g.USBamp amplifier. At UNM, 2.2% of recordings were lost when offsets exceeded the ±250 mV limit of the CNS-200 amplifier. When large shifts in DC offset were observed, they generally occurred together on all channels of the electrode strip. Rates of DC drift were generally low at both centers, with 63 and 75% of values within the limits of ± 0.5 mV/min, and 83 and 88% within ± 1.5 mV/min (Figure 2(c)). Drift was evenly distributed between positive and negative directions, and there was no significant change over seven days in drift (ANOVA: F (27,592) = 0.87, P = 0.65) or DC offset (ANOVA: F (27,592) = 0.40, P = 0.99).
DC shifts of SDs
We next examined how reliably the DC shifts of SD could be observed and measured. For a representative and unbiased sample, we examined traces from a single, predetermined electrode (electrode 3) across all patients. Of the 967 SDs that were identified based on propagation between at least two electrodes on the strip, 551 (57%) propagated to electrode 3, while the others were observed at other electrodes only (cf. Figure 1(a) and (b)). Of the 551 SDs at electrode 3, the DC shifts of 56 (10%) could be clearly identified, but could not be scored due to waveform distortion by concurrent artifacts. For another 189 (34%) SDs, the DC shifts did not have a typical waveform that could be scored. Some lacked a prominent negative initial phase, while others were distorted by a shifting or steeply drifting baseline potential (Figure 3(b) and (c)).
DC shifts of spreading depolarizations and platinum electrode characterization. (a) DC waveforms typical of spreading depolarizations had a prominent initial negativity and were quantified for duration and amplitude as shown by dashed lines. For 44% of all spreading depolarizations occurring on a given electrode, DC shift durations and amplitudes were not measured because waveforms were atypical or were corrupted by artifact. (b) Examples of atypical DC shift morphologies from two different patients. Despite having different morphology, atypical waveforms were clearly attributable to spreading depolarizations considering (1) the simultaneous onset of depressed spontaneous activity, (2) their expected timing relative to spreading depolarizations evidenced on other electrodes, and (3) recurrence of the same atypical waveform at the same electrode in connection with multiple spreading depolarizations, as shown. Another atypical waveform example is the DC shift of the first spreading depolarization at electrode 5 in Figure 1(a). (c) DC shifts attributable to spreading depolarization but corrupted by artifact were identified similarly by (1) and (2) above, but unlike atypical DC shifts, they differed from other DC shifts occurring on the same electrode and the artifact component of the waveform was often present across multiple electrodes. At the electrode illustrated in (c), typical DC shifts of spreading depolarizations were observed throughout the recording as illustrated by the gray traces. In another instance (black trace), however, a large negative artifact occurred synchronously across all electrodes at the time recovery of the DC shift would be expected. (d, e) Results of electrode potential drift and current-induced polarization tests, respectively. Traces show responses of the six individual electrodes.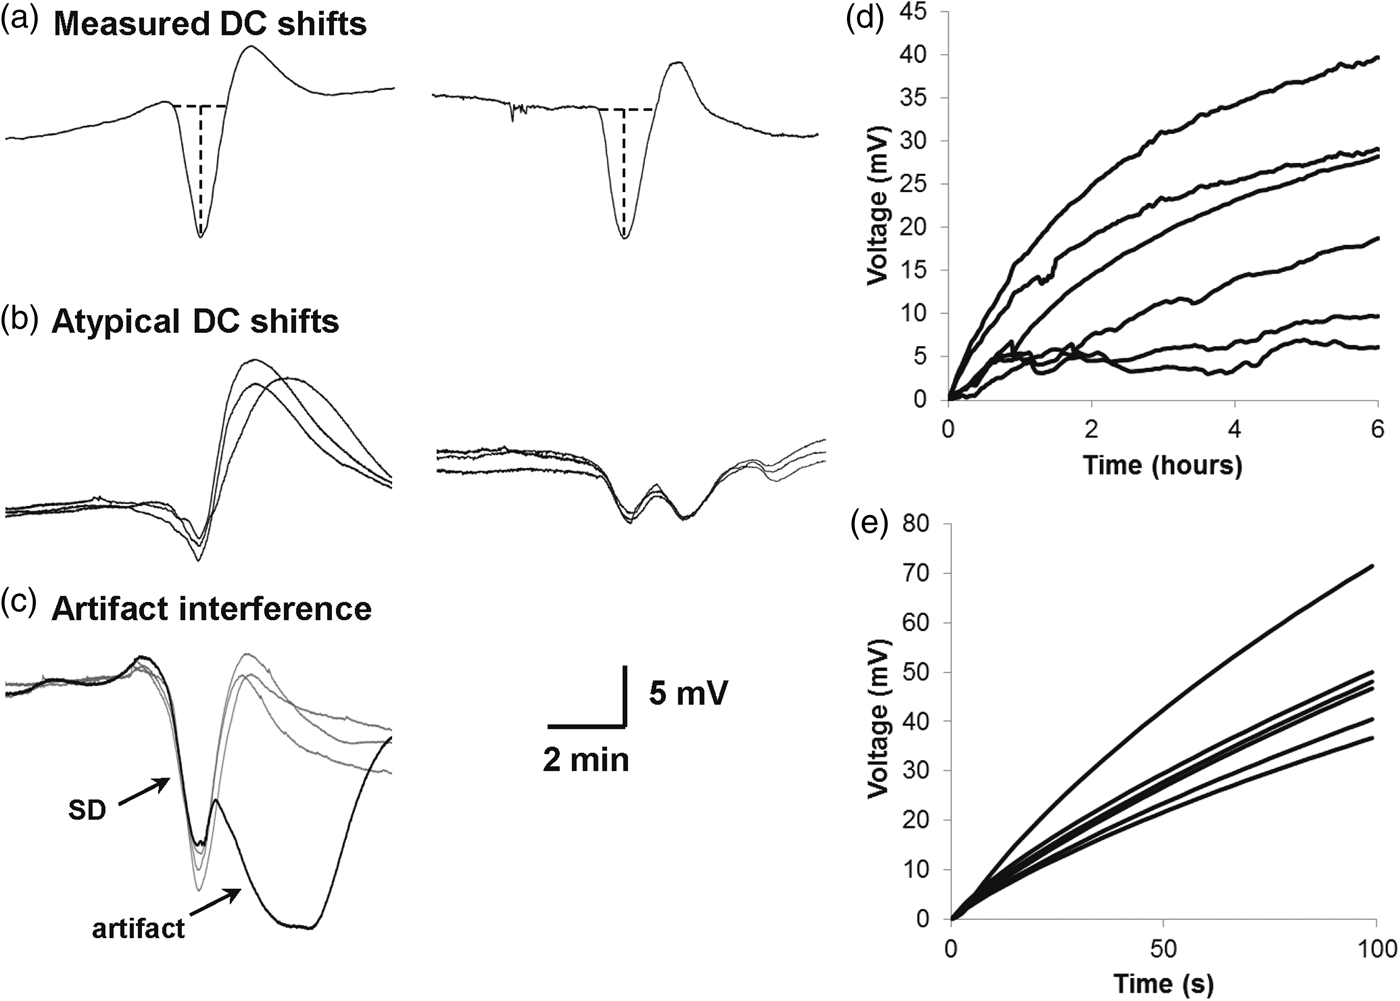
The remaining 306 (56%) SDs at electrode 3 had typical DC waveforms similar to intracortical micropipette recordings in animals (Figure 3(a)). For these, the median DC shift duration was 1 min 48 s (IQR, 1:40 to 2:02) and the median amplitude was 4.77 mV (IQR, 3.77 to 8.79) (n = 14 patients). Results were similar when treating each of the 306 events as statistically independent: the median duration was 1 min 53 s (IQR, 1:37–2:35) and median amplitude was 4.82 mV (IQR, 2.90–7.49). Using a previously defined cutoff of 3 min,15,24 49 (16%) events were considered prolonged.
Platinum macroelectrode characterization
A major factor in the stability and reliability of DC recordings is the electrode material, which determines behavior at the electrode–electrolyte junction. In particular, electrode polarization can induce potential drift as an unwanted artifact and is caused by a charge distribution that develops at the electrode–electrolyte interface. The resulting impedance can further change with the frequency and density of passing current, which affects the electrode's capacity to transfer signals at a given frequency. To understand the behavior of platinum ECoG macroelectrodes, we tested their characteristics using a benchtop setup.
In 0.9% NaCl, electrodes had a baseline offset of 294 ± 37 mV. Thereafter, potentials drifted a further 22 ± 13 mV from baseline over 6 h (Figure 3(d)). Drift was most severe initially, but decreased to a rate of 0.035 ± 0.029 mV/min at the end of this period. The passage of current also affects electrode polarization and in theory can be a further cause of baseline potential instability. Figure 3(e), showing the voltage responses of electrodes to application of 5 nA current, demonstrates that this effect is considerable. After 100 s of current application, the average net potential drift was 48.9(±12.1) mV, corresponding to 9.8(±2.42) MΩ resistance. Polarization impedance was tested using an equivalent circuit model to interpret measured impedance. Results showed an impedance of 2.3(±0.4) kΩ at 40 Hz that increased steeply to 1.80(±0.06) MΩ at 0.1 Hz and then 11.47(±0.23) MΩ at 0.01 Hz. 28 The phase differences for the electrodes were -69 ° (±8) at 40 Hz and -74 ° (±4) at 0.01 Hz. These results confirm the expected polarizable behavior of platinum and indicate a capacitive characteristic with poor conductive charge transfer that contrasts with the resistive property of Ag/AgCl electrodes.
Spreading depressions of spontaneous activity
DC shifts are analyzed using monopolar traces, since temporal overlap of waveforms occurring at two electrodes results in superposition and distortion in bipolar recordings. This raises the question of whether monopolar recordings are also suitable for assessment of SD-induced depressions of spontaneous electrical activity. We therefore compared the characteristics of depression periods for the 551 SDs recorded at electrode 3 with both a remote, inactive reference (monopolar) and using electrode 4 as reference (bipolar) (Figure 4).
Bipolar depression durations depend on spreading depolarization propagation pattern. Three spreading depolarizations recorded from the same patient all had different propagation patterns, with spread from 3→4 in (a), simultaneous occurrence in (b), and spread from 4→3 in (c). Boxed regions of power integral traces show the measured depth and duration of depression periods. In this case, durations were longer for bipolar than monopolar traces when there was temporal offset between depolarizations at the two electrodes. In other instances, such as with a long depression at electrode 3 but short depression at 4, the opposite can be true.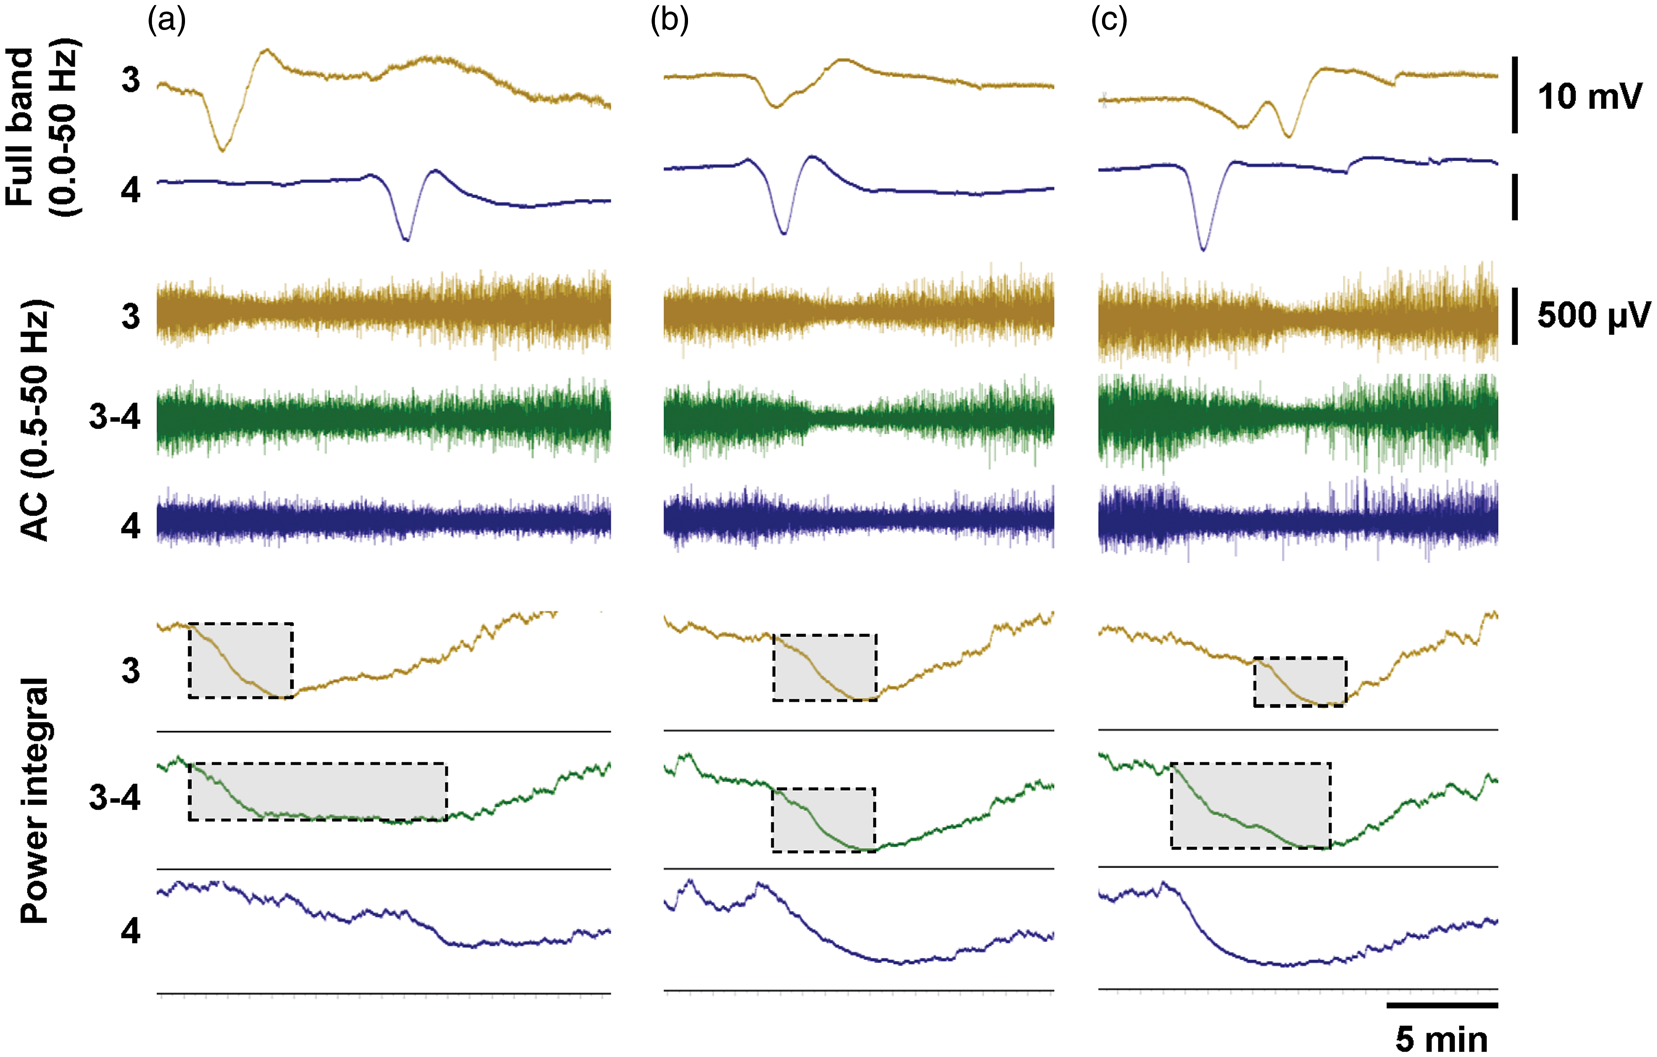
An advantage of bipolar channels was that they are less susceptible to artifact, which, when present in monopolar channels, cancels out from subtraction in the bipolar derivation. Thus, for 39 SDs (7%) in seven patients, depression periods could be measured in bipolar but not monopolar traces due to artifact. For 48 SDs (9%), artifact prevented scoring in both configurations. On the other hand, for 27 SDs (5%) in three patients, depressions were evident only in monopolar channels. This occurred when the negative lead (electrode 4) of the bipolar channel had no SD and baseline spontaneous activity was substantially larger than that of electrode 3. The converse scenario of observable depressions in bipolar but not monopolar recordings occurred for only five SDs (1%) in one patient. Therefore, apart from the effect of artifact rejection, bipolar derivations do not appear to confer advantage in detection of SD-induced depressions of spontaneous activity.
In other cases, depression periods could not be scored because (i) no baseline spontaneous activity was present (i.e. isoelectricity; n = 28, 5%), (ii) depression periods persisted from previous SDs (n = 6, 1%), (iii) ongoing seizures were present (n = 13, 2%), or (iv) recordings were stopped or started during SD (n = 7, 1%). Finally, for 52 SDs (9%) in seven patients, spontaneous activity was present but depressions were not evident in either bipolar or monopolar channels.
For the remaining 326 SDs (59%) in 14 patients, both monopolar and bipolar channels exhibited depressions periods that could be measured and compared. Depression durations for the two were strongly correlated (R2 = 53.3%, p < 0.001) (Figure 5(a)), but in many cases substantial discrepancies were observed. For instance, when SDs appeared at electrodes 3 and 4 with considerable delay (slow apparent propagation), shorter depression periods in monopolar channels summed to produce longer depressions in the bipolar channel (Figure 4(a) and (c) versus (b)). In other instances, monopolar depressions were longer. This occurred when recovery from depression at electrode 4 developed during sustained, ongoing depression at electrode 3, resulting in a shorter bipolar (3–4) than monopolar (3) duration. These differences produced up to fourfold differences in depression durations, in both directions, when assessing bipolar versus monopolar channels. However, these discrepancies observed for individual SDs disappeared when total depression durations for all SDs were calculated for each patient. There was no significant difference between total depression durations measured from monopolar versus bipolar channels (170 ± 184 versus 171 ± 174 min, p = 0.96, paired t-test), and these measures were very strongly correlated (R2 = 0.924, p < 0.001, Figure 5(a) inset).
Comparison of ECoG depressions assessed in monopolar versus bipolar recordings. Comparison of depression durations (a) and depths (b) between assessments made in monopolar (electrode 3 versus reference) and bipolar (electrode 3 versus electrode 4) channels. Each data point represents one spreading depolarization. Depression depths of 1 represent complete suppression to isoelectricity, where 0 represents no depression. The inset of (a) shows total depression durations (TDD) for each patient in minutes. (c) and (d) compare depression durations to DC shift durations measured at electrode 3.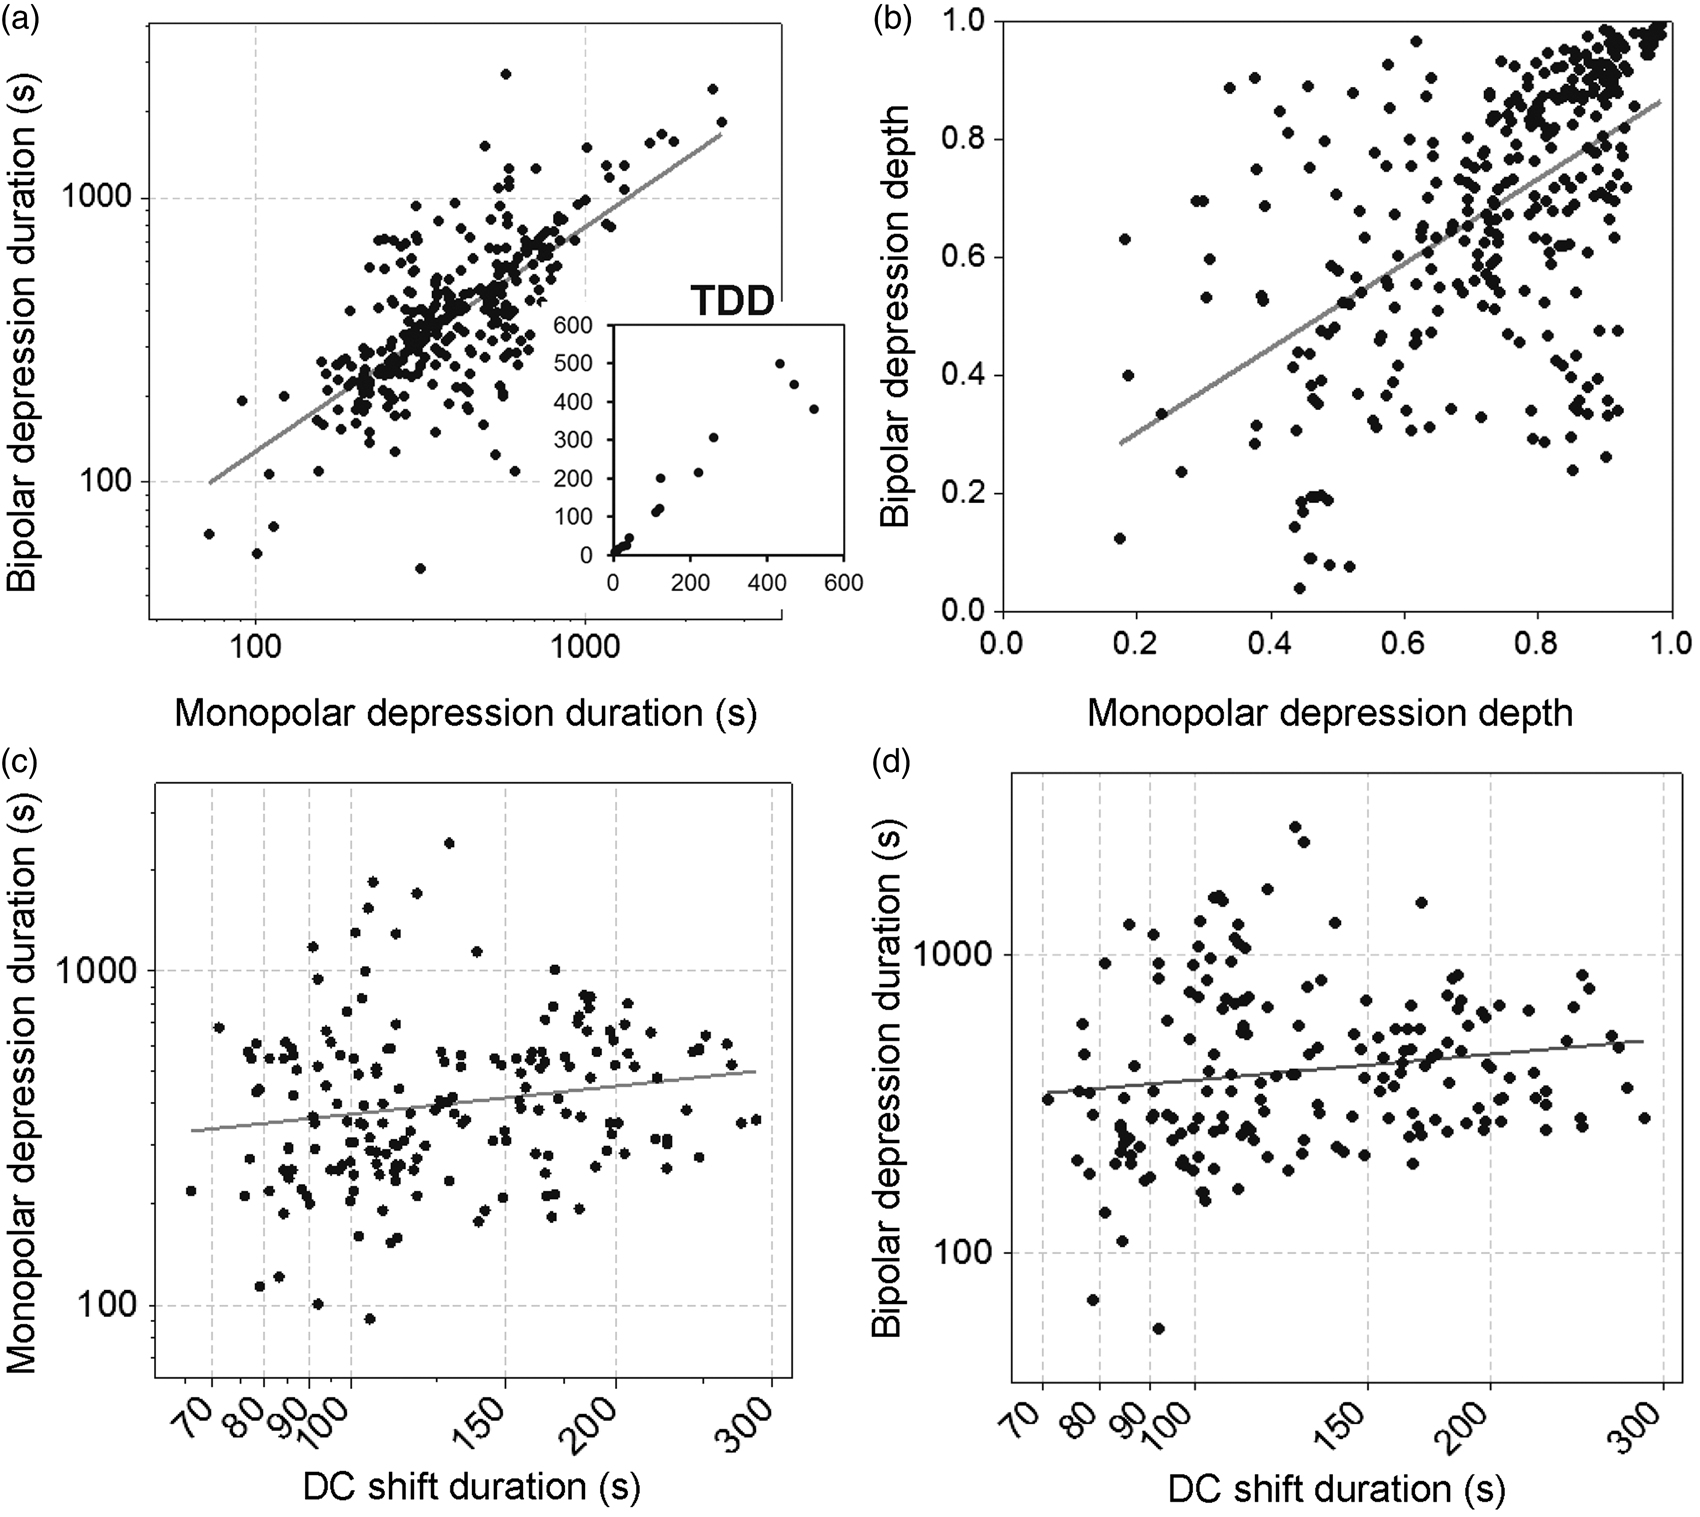
Depths of depression were also assessed. For individual patients, the median depth of depression measured in monopolar channels was 72% (IQR: 61–79), which did not differ from bipolar channels (median: 68%, IQR: 54–78; n = 13 patients, p = 0.66, paired t-test). Thus, across all SDs within a patient recording, the extent of depression was similar in both recording configurations. However, for individual SDs, the depth of depression differed considerably for monopolar and bipolar channels, as shown in the scatterplot of 326 SDs (Figure 5(b)). The regression line (y = 0.16 + 0.72*x) is close to unity, indicating general equivalence between the measures, but the degree of correlation is low (R2 = 31.1%, p < 0.001). That is, some SDs exhibit strong depression in monopolar traces, but only moderate depression in bipolar traces, and vice versa. This is easily explained by different relative amplitudes of baseline spontaneous activity and different degrees of depression at two electrodes, which may either enhance or attenuate the net depression observed in bipolar recordings compared to a monopolar recording from only one active electrode.
We hypothesized that DC shift durations would be more tightly correlated with monopolar than bipolar depression durations. However, examining 182 SDs with measures for all three variables, DC shift durations at electrode 3 were not significantly correlated with either monopolar (R2 = 0.004, p = 0.37, n = 182 SDs) or bipolar (R2 = 0.000, p = 0.93, n = 182) measures (Figure 5(c) and (d)). Correlations were stronger when individually analyzing patients with >10 SDs. R2 values ranged from 0.082 to 0.437 for monopolar and 0.071 to 0.291 for bipolar durations, but again there was no evidence of stronger correlations for monopolar recordings. The lack of significant correlations for either recording configuration is likely due to the lack of more prolonged DC shifts in this sample of typical SDs, compared to previous studies that showed strong correlations.17,24
Reliability of SD identification
We found that review of raw DC data for identification of SDs was generally feasible and straightforward. During review, signals of 20 min to several hours duration were maintained in the display view, even with shifting baselines, by use of a continuous autoscaling function. Identification of SD by propagating DC shifts between electrodes was relatively simple and was in fact more reliable than interpretation of multiphasic SPCs in high-pass filtered bipolar recordings (Figure 6). This was due to the stereotyped monophasic negative DC shifts, which had a much higher signal-to-noise ratio compared to bipolar SPCs.
Unfiltered DC recordings facilitate identification of spreading depolarizations. Clinical monitoring of spreading depolarizations requires amplifiers with a lower frequency limit down to at least 0.01 or 0.02 Hz. Such recordings are reviewed in bipolar channel derivations, as shown here by applying a digital high-pass filter to DC recordings (upper traces). Phase reversals of slow potential changes (SPCs) identify the electrode with active depolarization, but deciphering SPCs and their propagation can be challenging in some cases. Unfiltered DC recordings have higher signal-to-noise ratios and can resolve ambiguities, and are also simpler to interpret due to their monopolar display (lower traces). (a) illustrates a case in which SD clearly occurs at only two of three electrodes (lower) but is preceded by noise that is not easily resolved from SPCs in high-pass filtered recordings. (b) shows a similar case where noise contamination is a problem in the high pass but not the DC traces. In (c), the near-simultaneous onset of SPCs could be mistaken for artifact, but monopolar DC traces clearly show the spread of a DC shift from electrode 3 to electrodes 2 and 4.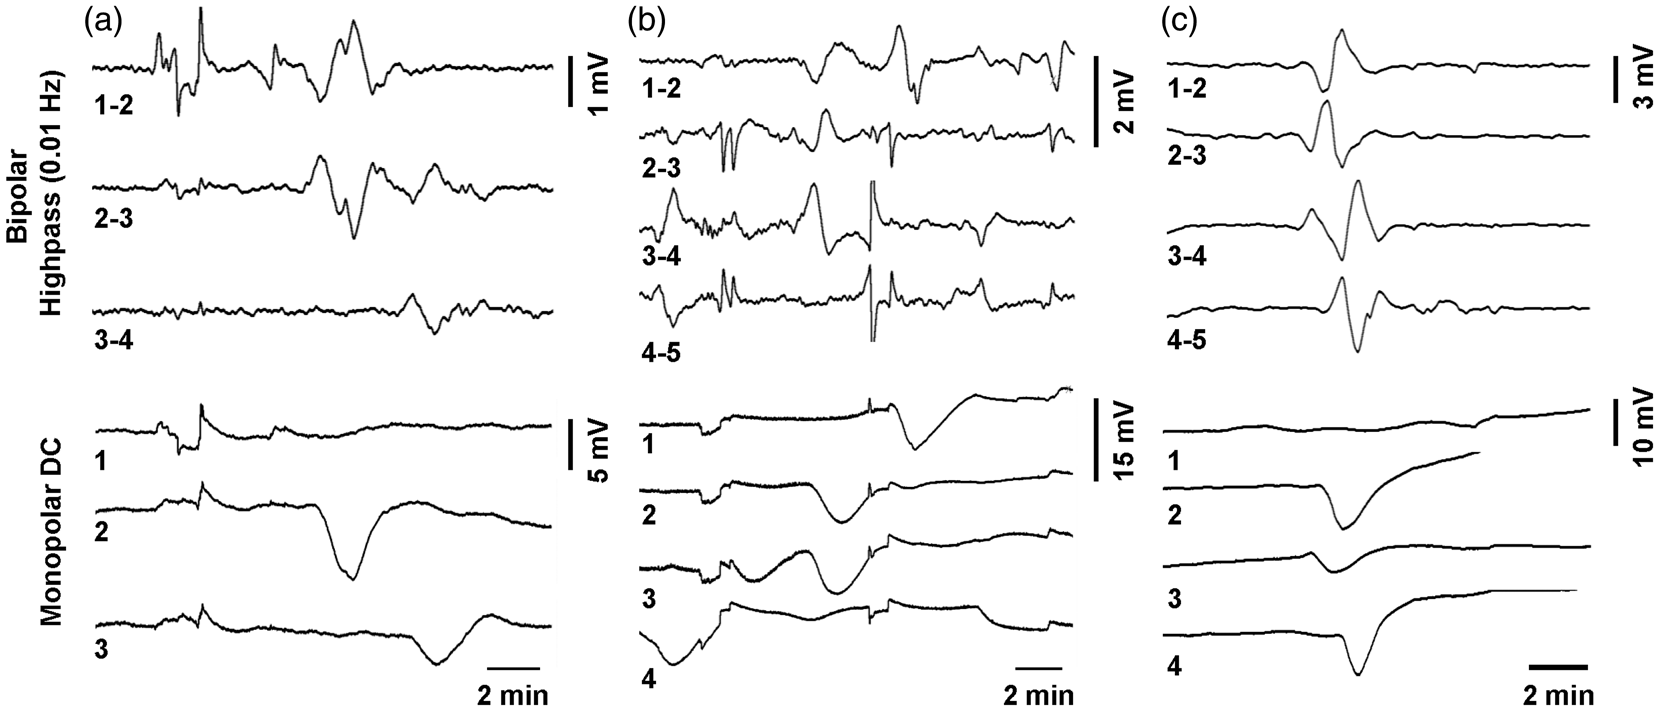
Considering the advantages of DC recordings, we sought to determine whether nonspecialized personnel could be trained to reliably identify SDs. Thirteen subjects with no prior experience in SD or ECoG underwent 60 min of training and were then asked to independently identify SD events in 96 h of DC-coupled ECoG. The recordings contained 44 SDs as the ground truth determined by experienced reviewers and were selected to be representative of clinical experience, with 48 h considered “easy” and another 48 h considered “moderately difficult.” Of the 13 subjects, nine returned scoring of the data. Overall accuracy for identification of SD was very good, with average TPR for subjects of 82.1%, FPR of 0.3%, and kappa statistic of 0.872 (kappa > 0.81 is considered to be “very good” agreement). As a measure of interobserver reliability, Krippendorff alpha was 0.847 for all subjects and 0.853 when the ground truth scoring is further included. Krippendorff alpha of 0.81–1.0 is considered “near perfect” agreement, 29 and the minimal increase in alpha with inclusion of the ground truth attests to the high reliability of the novice scoring.
Discussion
DC-ECoG has theoretical appeal because of the full-band nature of electrical potential changes induced by SD, and we have shown anecdotally that intracranial DC recordings can be implemented in practice.14–18 Here we were motivated to examine this methodology more fully as a basis for broader clinical adoption and to understand the implications for recognition and measurement of SDs relative to current standard practice. 13 Analyzing continuous long-term DC-ECoG recordings from 27 patients, we found that DC-ECoG is not only a suitable alternative to the use of AC-coupled amplifiers with a low frequency limit, but in fact offers several distinct advantages and is fully compatible with consensus standards for scoring SD.
Practical evaluation of DC recordings and implications
The main potential pitfall of DC recordings is baseline offset and drift, which would require constant adjustment of the amplitude display range (rezeroing of the baseline) for signal review, and furthermore could exceed the input range of the amplifier, causing loss of data. In practice, however, these problems were not encountered when using amplifiers with a differential input range of at least ±250 mV and Ag/AgCl or platinum scalp electrodes as reference. In data review and scoring, the problem of shifting baseline was easily addressed by use of a continuous autoscaling function for the raw DC channels, such that signals were maintained in an interpretable range. Another pitfall in monopolar data acquisition is loss of data if the reference electrode is dislodged, but this was largely avoided by use of collodion to secure the reference. Collodion is commonly used in continuous EEG applications and is safe, given appropriate precautions against exposure to ethyl ether vapors. Another protection against saturation and data loss is a wide dynamic range of the amplifier, as with the g.USBamp, which allowed data acquisition even when the reference was disconnected and offset potentials increased to >300 mV. Simultaneous acquisition of bipolar signals is another option to safeguard against a displaced reference, but in our experience was not necessary.
With reliable data acquisition and review, signals can then be examined for the propagating negative DC shifts of SD. In addition to identifying SDs, the durations of DC shifts have diagnostic value as measures of tissue metabolic status and degree of excitotoxic injury induced by SD.14,30–32 To objectively assess the ability to measure DC shifts, we examined traces from a single, predetermined electrode across all patients as a representative sample, thereby avoiding bias from selecting the most stable or interesting signals. Of all SDs observed on the subdural strip, we found that 57% propagated to a given location, i.e. electrode 3. Among the DC shifts observed at electrode 3, 56% had typical waveforms that could be scored for amplitude and duration. In other cases, DC shifts were clearly identifiable, but had atypical shapes due clearly to artifact or baseline drift in some cases, and perhaps geometric variation of electrode contact with underlying cortical gyri in others.
The fact that only 57% of all SDs were observed at a given electrode location implies a clear advantage to the use of subdural strips compared to intraparenchymal depth electrodes. 33 While strips sample 50 cm across the cortical surface, depth arrays measure only a single cortical location and may not detect ∼43% of SDs occurring in the vicinity. Taken further, these data might suggest that even single electrode strips undersample brain pathology, particularly in patients with extensive injury spanning multiple lobes, and may justify the use of multiple electrode strips or even grids in different anatomic regions. The decision for more extensive monitoring must reflect the balance of risk and benefit to the patient, and may be justified in clinical trials that initiate therapeutic interventions or other clinical decisions on the basis of SD monitoring.
High-pass filtering at 0.02 Hz with AC-coupled amplifiers significantly attenuates the amplitude of DC shifts, such that AC-SPCs have threefold smaller amplitudes. 12 Here we found that unfiltered DC shifts have a median amplitude of 4.77 mV, but even larger values in the range of 7.2–10.8 mV have been reported previously.15,17 The large amplitudes confer high signal-to-noise ratios, which, coupled with the typical, monopolar, and primarily monophasic waveforms, greatly simplify recognition of SDs (Figure 6). This was confirmed by the ability of novice ECoG scorers to identify SDs after a brief training session on the characteristics of SDs in monopolar DC recordings. The very high degree of accuracy (as judged by the kappa statistic of 0.87) and interobserver reliability (as judged by Krippendorff alpha of 0.853) suggest that physicians without neurophysiology specialization can be trained to at least recognize SDs and distinguish them from confounding biologic or artifactual changes in ECoG signals. Although no direct comparison with AC-coupled recordings was performed, our experience suggests that DC-coupled recordings were essential in obtaining these impressive results and may be a significant step toward integrating rudimentary SD assessment into the daily bedside routine. Current evidence suggests that several SD measures, all accessible at the bedside depending on clinician training and experience, have utility in clinical diagnosis and prognosis, including (1) recognizing the presence (or absence) of SDs; (2) distinguishing temporal clusters of repetitive SDs from more sporadic, isolated events; (3) distinguishing SDs with short versus prolonged depression periods; and (4) identifying SDs in isoelectric cortex. Other more summary measures and DC shift durations require more extensive data manipulation and off-line analysis, given the limitations of presently available monitoring software. A current review article summarizes these scoring procedures and interpretations for the various measures of SD. 13 Further research is needed to determine the relative value of candidate measures in clinical treatment and decision-making.
Bipolar versus monopolar assessment of spreading depression
In addition to DC shifts, depressions of spontaneous cortical activity are another characteristic feature for identifying SDs and measuring their impact on tissue energy metabolism. The current standard is to assess spreading depression in bipolar channels derived from two active leads. 13 This is because, in theory, depressions may be more identifiable if they occur at both electrodes of a recording channel, rather than just one as in a monopolar recording. 34 For intracranial ECoG, however, we found in general no advantage of bipolar versus monopolar recordings in assessing either the degree or duration of spreading depression. Measurements for individual SDs often varied considerably between the two configurations, but were not consistently greater or lesser for either; addition of a second active electrode in the bipolar derivation could either augment or dilute effects observed in a single active electrode. Similarly, neither configuration was better correlated with the duration of negative DC shifts. Thus, aside from the slight advantage of artifact rejection achieved in bipolar recordings, monopolar and bipolar are equally suitable for identifying and measuring spreading depression in ECoG. The difference is that monopolar recordings are more spatially specific, while bipolar recordings provide a more summary measure of a broader extent of cortex. Importantly, these results are likely to only apply when (i) the remote reference electrode for monopolar recording carries signals of considerably smaller amplitude than the lead electrode, as occurs with ECoG referenced to scalp EEG, and (ii) SD affects most or all of cortex generating the signal on the lead electrode. These conditions are not met when monitoring SD with only scalp EEG recordings, where bipolar derivations are likely superior.16,35
Use of platinum electrodes for DC recordings
The use of full-band recordings with DC-coupled amplifiers has been advocated in scalp EEG applications, since the brain generates slow potentials below the conventional EEG range (0.5–70 Hz) in many physiologic and pathophysiologic states, including cognition, sleep, and seizures.36,37 Such recordings are made with Ag/AgCl electrodes and chloride-containing gel that allow free current flow from medium to electrode. The electrode interface therefore is nonpolarizable and behaves in a resistive manner that is ideal to record slow potentials without distortion. Due to the toxicity of silver, however, Ag/AgCl electrodes are unsuitable for intracranial recordings. 38 The alternative is polarizable electrode materials such as platinum or steel that, due to a capacitive nature, generate offset potentials and may filter signals at the electrode–tissue interface. These characteristics have been described previously28,39–41 and were confirmed here with the same electrodes used clinically.
Based on these considerations, it has been assumed that polarizable electrodes are not suitable for DC recordings. 39 However, Ikeda et al. showed that platinum and even stainless steel can perform to a certain degree like Ag/AgCl in slow potential recordings, if the electrode surface area is large and the amplifier input impedance is sufficiently high.40,42 In practice, several studies have used these materials to record cortical slow potentials, such as the Bereitschaftspotential and ictal DC shifts.43–47 However, these studies used AC amplifiers with ∼0.01 Hz low-frequency limits. To our knowledge, the present study and our previous reports15–18 are the first to examine the performance of platinum subdural electrodes with DC-coupled amplifiers that do not filter baseline potentials. Our results show that while a large offset potential develops initially, baseline drift was minimal thereafter and seldom interfered with recognition of the DC shift of SD. Indeed, the long-term voltage drift of platinum is similar to Pt/IrOx and Ag/AgCl, 48 and Tallgren et al. found specifically that platinum electrodes have very little noise, similar to Ag/AgCl, in the low frequency range of SD (>2 mHz). 39 Platinum is superior in this regard to steel, which is not recommended despite being less expensive. While SDs measured here had mainly short duration DC shifts, we previously observed sustained potential shifts lasting up to 15 min,14,15,17 which further suggests the fidelity of platinum electrodes to track the brain's slow potentials. Nevertheless, it is possible that the capacitive characteristic of platinum causes some degree of filtering and distortion of these slow waves, and this deserves further study.
Conclusions
Clinical monitoring of SD in patients with acute brain injury can be achieved reliably with DC-coupled amplifiers using platinum subdural electrodes referenced to a scalp electrode in monopolar data acquisition. Without the waveform distortion and amplitude attenuation of SPCs recorded with AC-coupled amplifiers, monopolar DC waveforms offer the advantage of direct interpretation of DC shifts for simpler identification of SD and to assess the metabolic burden imposed on the tissue at the recording site (i.e. DC shift duration). Such techniques are fully compatible with standards for scoring and classifying SD and may facilitate rapid bedside detection of events. While use of AC-coupled amplifiers with low frequency limit of at least 0.02 Hz remain a minimum acceptable standard for clinical SD monitoring, DC-coupled amplifiers confer clear advantages and should be used when possible.
Footnotes
Funding
The author(s) disclosed receipt of the following financial support for the research, authorship, and/or publication of this article: We further thank Howard Yonas, MD for financial support through the UNM Department of Neurosurgery. Research was funded by the US Army CDMRP PH/TBI Research Program (Contract No. W81XWH-08-2-0016 to JAH) and the University of New Mexico Department of Neurosurgery. JPD acknowledges support by Deutsche Forschungsgemeinschaft (DFG DR 323/5-1 and DR323/6-1), the Bundesministerium für Bildung und Forschung (Center for Stroke Research Berlin, 01 EO 0801; BCCN 01GQ1001C B2) and Era-Net Neuron 01EW1212.
Acknowledgments
We thank Mark Krasberg, PhD for assistance with data processing, and Li Luo, PhD for assistance with statistical analysis.
Declaration of conflicting interests
The author(s) declared no potential conflicts of interest with respect to the research, authorship, and/or publication of this article.
Authors' contributions
JAH conceived and designed the study; analyzed the data; and drafted, edited, and approved the manuscript.
CL conducted and analyzed in vitro studies and edited and approved the manuscript.
JMH contributed to data collection and analysis and edited and approved the manuscript.
JAW developed the DC data acquisition system at UCMC, contributed to data collection, and edited and approved the manuscript.
GLE contributed to data collection and edited and approved the manuscript.
NA contributed to patient enrollment and monitoring and edited and approved the manuscript.
CWS contributed to data analysis and edited and approved the manuscript.
BF contributed to patient enrollment and monitoring and edited and approved the manuscript.
JPD contributed to study design and edited and approved the manuscript.
APC conceived and designed the study, collected and analyzed the data, and edited and approved the manuscript.