
Abstract
Repetitive hypoxia (RH) exposure affects the initiation and progression of cognitive dysfunction, but little is known about the mechanisms of hypoxic brain damage. In this study, we show that sublethal RH increased anxiety, impaired learning and memory (L/M), and triggered downregulation of brain levels of glucose and several glucose metabolites in zebrafish, and that supplementation of glucose or glucosamine (GlcN) restored RH-induced L/M impairment. Fear conditioning (FC)-induced brain activation of and PKA/CREB signaling was abrogated by RH, and this effect was reversed by GlcN supplementation. RH was associated with decreased brain O-GlcNAcylation and an increased O-GlcNAcase (OGA) level. RH increased brain inflammation and p-Tau and amyloid β accumulation, and these effects were suppressed by GlcN. Our observations collectively suggest that changes in O-GlcNAc flux during hypoxic exposure could be an important causal factor for neurodegeneration, and that supplementation of the HBP/O-GlcNAc flux may be a potential novel therapeutic or preventive target for addressing hypoxic brain damage.
Introduction
A continuous oxygen supply is critical for maintaining normal brain functions. Cerebral hypoxia is the state wherein the oxygen supply is insufficient to maintain normal brain activity. General causes of cerebral hypoxia include decreased cerebral blood flow, respiratory problem, ischemic stroke, traumatic brain injury, an umbilical cord occlusion of fetus, heart or pulmonary problems, and sleep apnea (SA).1–3 When brief and subacute hypoxic insults are repeatedly applied, sustained brain damage may develop as repeated stress accumulates.4,5 In particular, repetitive intermittent hypoxia, which is often associated with SA, has been studied for its deleterious effects on cognitive function, including memory loss, anterograde amnesia, and learning disabilities.3,6,7
Chronic hypoxia may contribute to impairing glucose metabolism via multifactorial processes, including sympathetic nerve activation, oxidative stress, inflammation, and hormonal changes. 8 Data from multiple studies have shown that normal glucose metabolism in the brain is important for memory consolidation and retrieval, and that altered glucose metabolism is directly associated with cognitive dysfunction. 9 Research has also established a link between systemic metabolic dysfunction (e.g., diabetes) and dementia or neurodegenerative diseases. 10 Furthermore, altered cerebral glucose metabolism is closely associated with neurodegeneration, Alzheimer’s disease (AD) and synaptic dysfunction as a result of changes to vascular systems, glucose metabolism, insulin signaling, and β-amyloid (Aβ)/tau. 11 AD and neurodegeneration, in turn, influence glucose metabolism by inducing behavioral changes, memory disturbances, and hypothalamic dysfunction, resulting in a vicious cycle of deterioration. 12 Therefore, identification and exploration of one or more master controlling factor(s) underlying these bidirectional interactions may suggest new therapeutic approaches for the treatment of AD or cognitive dysfunction.
About 2–5% of metabolic glucose enters the hexosamine biosynthetic pathway (HBP); a final product of this pathway is UDP-GlcNAc, which induces glycosylation and O-GlcNAcylation of proteins. Considerable evidence indicates that dysregulation of glucose metabolism into HBP flux and subsequent O-GlcNAc cycling disturbance contributes to the pathogenesis of many neurological disorders.13–15 O-GlcNAcylation is regulated by the reciprocal activities of O-GlcNAc transferase (OGT) and O-GlcNAcase (OGA). 16 Global knockout of OGT or OGA yields embryonic or perinatal lethality, respectively, in mouse,17,18 highlighting the biological importance of these factors. Glucosamine (2-amino-2-deoxy-D-glucose, GlcN) directly enters HBP to increase O-GlcNAcylation. Our group and others have shown that GlcN exerts anti-inflammatory, antioxidative, and antiapoptotic effects in vitro and in vivo.19–21 In addition, GlcN has been shown to have protextive effects against ischemic or hypoxic injury in neonatal rat ventricular myocytes (NRVMs), rat hearts, and mice.22–24 Our previous studies demonstrated that GlcN exerts a neuroprotextive effect in the rat middle cerebral artery occlusion ischemia model through inhibition of neuroinflammation in the post-ischemic brain. 21 Furthermore, our recent investigation demonstrated that zebrafish (Danio rerio) exposed to acute hypoxic condition induces cognitive dysfunction, and GlcN protexts zebrafish from hypoxia-induced lethality and cognitive dysfunction. 25
Our group and others have shown that zebrafish are an attractive animal model for studying hypoxia. For example, brain injury and cognitive dysfunction responses following severe O2 deprivation have been described and characterized using adult zebrafish.25,26 In the current study, we newly developed a repetitive hypoxia (RH) model using subacute O2 deprivation to mimic chronic RH. Using this approach, we explored the effects of exposure to chronic RH on anxiety, cognitive function, AD pathologies, and brain inflammation in zebrafish, and further assessed the potential protextive effects of GlcN.
Materials and methods
Chemicals and reagents
Reagents were purchased from Sigma Chemical (St. Louis, MO) or Amresco (Cochran Road, OH) otherwise noted.
Zebrafish handling
All experimental procedures and animal care/handling were carried out according to the ‘Inha University Institutional Animal Care Use Committee’ guidelines. Reporting of animal experiments follows the Animal Research: Reporting of In Vivo Experiments (ARRIVE) guidelines. 27 3–6 months old wild-type zebrafish (Danio rerio, AB strain) were supplied by Fishzzang (Jinchun, Korea) and maintained at 28.0 ± 1.0 °C with a 12-h light/12-h dark cycle. Tap water was passed through a multistage filtration system equipped with a sediment filter, a pre-carbon filter, membrane and a post-carbon filter, and a fluorescent UV-light sterilizing filter was equipped to the aquarium containers (Zebrafish AutoSystem, Genomic Design, Seoul, South Korea). Water in the container was aerated continuously and maintained at a pH between 6.5 and 7.5. Zebrafish were fed flake food (TetraBits; Luzerne, Singapore) three times a day using an automated fish feeder (AF012; DoPhin, Korea). Where indicated, zebrafish were euthanized by decapitation following cold exposure (0–4°C). All of experiments and measurements were performed in a blinded and randomized manner.
Hypoxia exposure
Adult zebrafish were placed in a sealed glass chamber connected to two connectors: one allowed nitrogen gas inflow and the allowed inlet gas outflow during nitrogen perfusion. All incubation solutions were pre-equilibrated to either normoxia (control) or hypoxia for at least 10 min before use. Zebrafish were transferred into pre-equilibrated water and exposed to normoxia or hypoxia for 5 min. Subset of zebrafish were subjected to intraperitoneal injection of GlcN, Glc, Thiamet G or PBS for control at 2 h before hypoxia exposure. Following hypoxia exposure, zebrafish were returned to tank under normoxic conditions. The dissolved oxygen (DO) levels were measured by using an oxygen meter (YSI Model 7800, Ohio, USA).
Behavioral test
The behavioral test was performed during the same time frame each day (between 10:00 am and 5:00 pm). Fish from both sexes (∼50:50 male:female ratio) were used for each experimental group.
Novel tank test
To determine the anxiety level, zebrafish were individually transferred from the original tank to a novel test tank. The front surface of the tank was divided into three virtual layers using thin pieces of sticky tape. 5 min after the zebrafish was placed in the test tank, the fish were videotaped for 5 min and their vertical positions were analyzed using ToxTrack software (https://toxtrac.sourceforge.io). 28
Fear context memory test
Inhibitory avoidance learning was assessed under dark conditions as described previously. 25 In brief, a zebrafish was placed in a dark compartment of shuttle chamber (18.5 cm long x 7.0 cm wide x 10.0 cm high). After 3 min of acclimation, the flashing light was activated on the side of the compartment and allow the zebrafish access to the opposite compartment. The zebrafish immediately crosses the chamber in response to flashing light. After the zebrafish crossed the door, a small stone was dropped in front of the fish and zebrafish was gently pushed back into the dark compartment. At 3 min intervals, the process was repeated twice, consisting 3 trials. At each trial, crossing time delay of zebrafish was measured up to 300 s. In order to assess the retention ability of learned avoidance response, a test session followed 2 h and 24 h after the termination of the training session, without delivery of a noxious stimulus.
Gas chromatography mass spectrometry (GC-MS)/MS analysis
To extract metabolites in brain tissues, previously used methods were modified and adopted. 29 10 mg of brain tissues mixed with 500uL of 7:3:5 v/v methanol/water/chloroform mixture. Homogenization with 2.8 mm zirconium oxide beads was performed at 5000 rpm using a Precellys 24 tissue grinder (Bertin Technologies, France). The tissue lysate was incubated at 4 °C for 10 min and centrifuged at 4 °C and 13,000 rpm for 20 min. The supernatant was transferred to new 1.5 mL tube and evaporated under a stream of nitrogen. The dried sample was dissolved in 40 µl of methoxyamine hydrochloride in pyridine (40 mg/ml) by heating at 60 °C for 90 min. Samples were mixed with 50 µl of N-Methyl-N-(trimethylsilyl) trifluoroacetamide and incubated at 70 °C for 30 min. After derivatization, 10 µL of 250 nM Mirex-13C8 (Cambridge Isotope Laboratories, MA, USA) was added for internal standard. Samples were centrifuged at 21 °C and 13,000 rpm for 20 min and moved to the vial. For quantitative analysis of metabolites, gas chromatograph/tandem mass spectrometer analysis was performed on an Agilent 7890B gas chromatograph, equipped with a 7010 mass selective detextor triple quadrupole (TQ) mass spectrometer system (Palo Alto, CA, USA). Chromatographic separation was achieved using a DB-5MS UI (30 m × 0.25 mm I. D; 0.25 µm film thickness) from J&W Scientific (Santa Clara, CA, USA) capillary column. Injector temperature was 270 °C. The oven temperature was programmed as follows: the initial oven temperature was 60 °C for 5 min then it was increased to 300 °C with a heating rate of 10 °C/min. The final temperature of 300 °C was held constant for 10 min. The transfer line was kept at 280 °C. Helium was used as carrier gas at a constant flow of 1 mL/min. The ion source temperature was set at 230 °C. One microliter of each derivatized sample was injected in split mode (1:10). Nitrogen was used as collision gas at a flow rate of 1.5 mL/min and helium was used as a quenching gas at a flow rate of 2.25 mL/min. The ion source was kept at 230 °C. The mass spectrometer is tuned on electron impact ionization (EI) at 70 eV in multiple reaction monitoring mode (MRM).
Immunofluorescence staining
For immunofluorescent staining, zebrafish brains were fixed in 4% formaldehyde (Samchun, Korea) for 2 h at 4 °C, placed in 30% sucrose in PBS, and kept at 4° until the brains sank in the liquid (more than 12 h). The brains were frozen embedded in O.C.T compound (Sakura, Japan) on dry-ice, cut into 6-μm cross-plane sections with a cryostat (CM1800; Leica, Wetzlar, Germany), mounted onto coated slides (Matsunami Glass Ind., Ltd., Osaka, Japan), and stored at −20°C until use. For staining, the slides were incubated with heated citrate buffer (10 mM citric buffer, pH 6.0) for 5 min, rinsed in 0.1% Triton X-100 in PBS (PBS-T), and blocked with 10% normal goat serum (Jackson ImmunoResearch, West Grove, PA) in PBS-T. After being washed, the sections were incubated in PBS-T solutions containing antibodies specific for O-GlcNAc, phospho-CREB, OGT, GFAP, p65, p50 and c-Rel (Santa Cruz Biotechnology, Dallas, TX), OGA (Proteintech, Rosemont, IL), PKA-cα, β-amyloid (Cell signaling Technology, Danvers, MA), L-plastin, p-Tau (Abcam, Cambridge, UK) or S100β (DAKO, Glostrup, Denmark) at 4 °C. The sections were then rinsed with 0.1% PBS-T and incubated with a mixture of secondary antibodies, including goat anti-mouse or rabbit IgG conjugated to Alexa Flour 488 or 568 (Invitrogen, Carlsbad, CA). Cells were counterstained with DAPI (Sigma-Aldrich) to visualize nucleus. For Thioflavin S staining, brain sections were incubated in order of 70% and 80% ethanol for 5 min and stained with 1% Thioflavin S (Sigma-Aldrich) solution with DAPI for 15 min at RT. The sections were then rinsed in order of 70 and 80% EtOH for 5 min and mounted using mounting medium (DAKO, Glostrup, Denmark). The slides were examined under a confocal LSM 510 META microscope (Carl Zeiss, Jena, Germany) and analyzed using ZEN 2009 Light Edition software. For analysis confocal images, we prepared three tissue sections per animal per slide. Positive cells in whole confocal images (40×) of sectioned tissue were counted and quantified using ImageJ program.
Hematoxylin and eosin staining
Brain injury was assessed histologically by hematoxylin and eosin (H&E) staining. Briefly, zebrafish brain samples were fixed with 4% formaldehyde (Samchun, Korea), embedded in paraffin, sectioned at 5-μm thickness and mounted into slide. The sections were deparaffinized and hydrated gradually, stained with Harris hematoxylin solution and observed under optical microscope.
Statistical analysis
All the data are expressed as means with exact data points ± standard deviation (SD). Statistical significance was determined using Kruskal-Wallis with false discovery rate (FDR) by Benjamini–Hochberg method for multiple comparison test. For Fear-conditioning test analysis within a group, repeated measures nonparametric ANOVA (Friedman’s test) with FDR was used for multiple comparisons. Analysis between groups, two-way ANOVA followed by Turkey multiple comparisons test was performed. Differences were considered statistically significant at p < 0.05 with (FDR) < 0.05.
Results
Repetitive hypoxia (RH) elicits increased anxiety and cognitive dysfunction in zebrafish
To create a mild and global hypoxia model, we place zebrafish in an air-proof water chamber (i.e., hypoxia chamber) containing an extremely low level of dissolved oxygen (DO) (<0.8 mg/L), which was produced by perfusing nitrogen. Zebrafish were exposed to 1 or 5 repetitions of sublethal hypoxia (5 min each) with 1 day of rest between hypoxic exposures (Figure 1(a)). Measurement of exploration rates revealed no significant differences between the control and SH or RH groups of zebrafish (data not shown). One of well-known method to determine anxiolytic-like responses is the novel tank test. Reduced exploration, increased freezing and tend to dive to the bottom of a novel experimental tank are characteristic of anxiety behaviors.30,31 After RH exposure but not SH exposure, the total freezing time (C vs. H(5x), mean
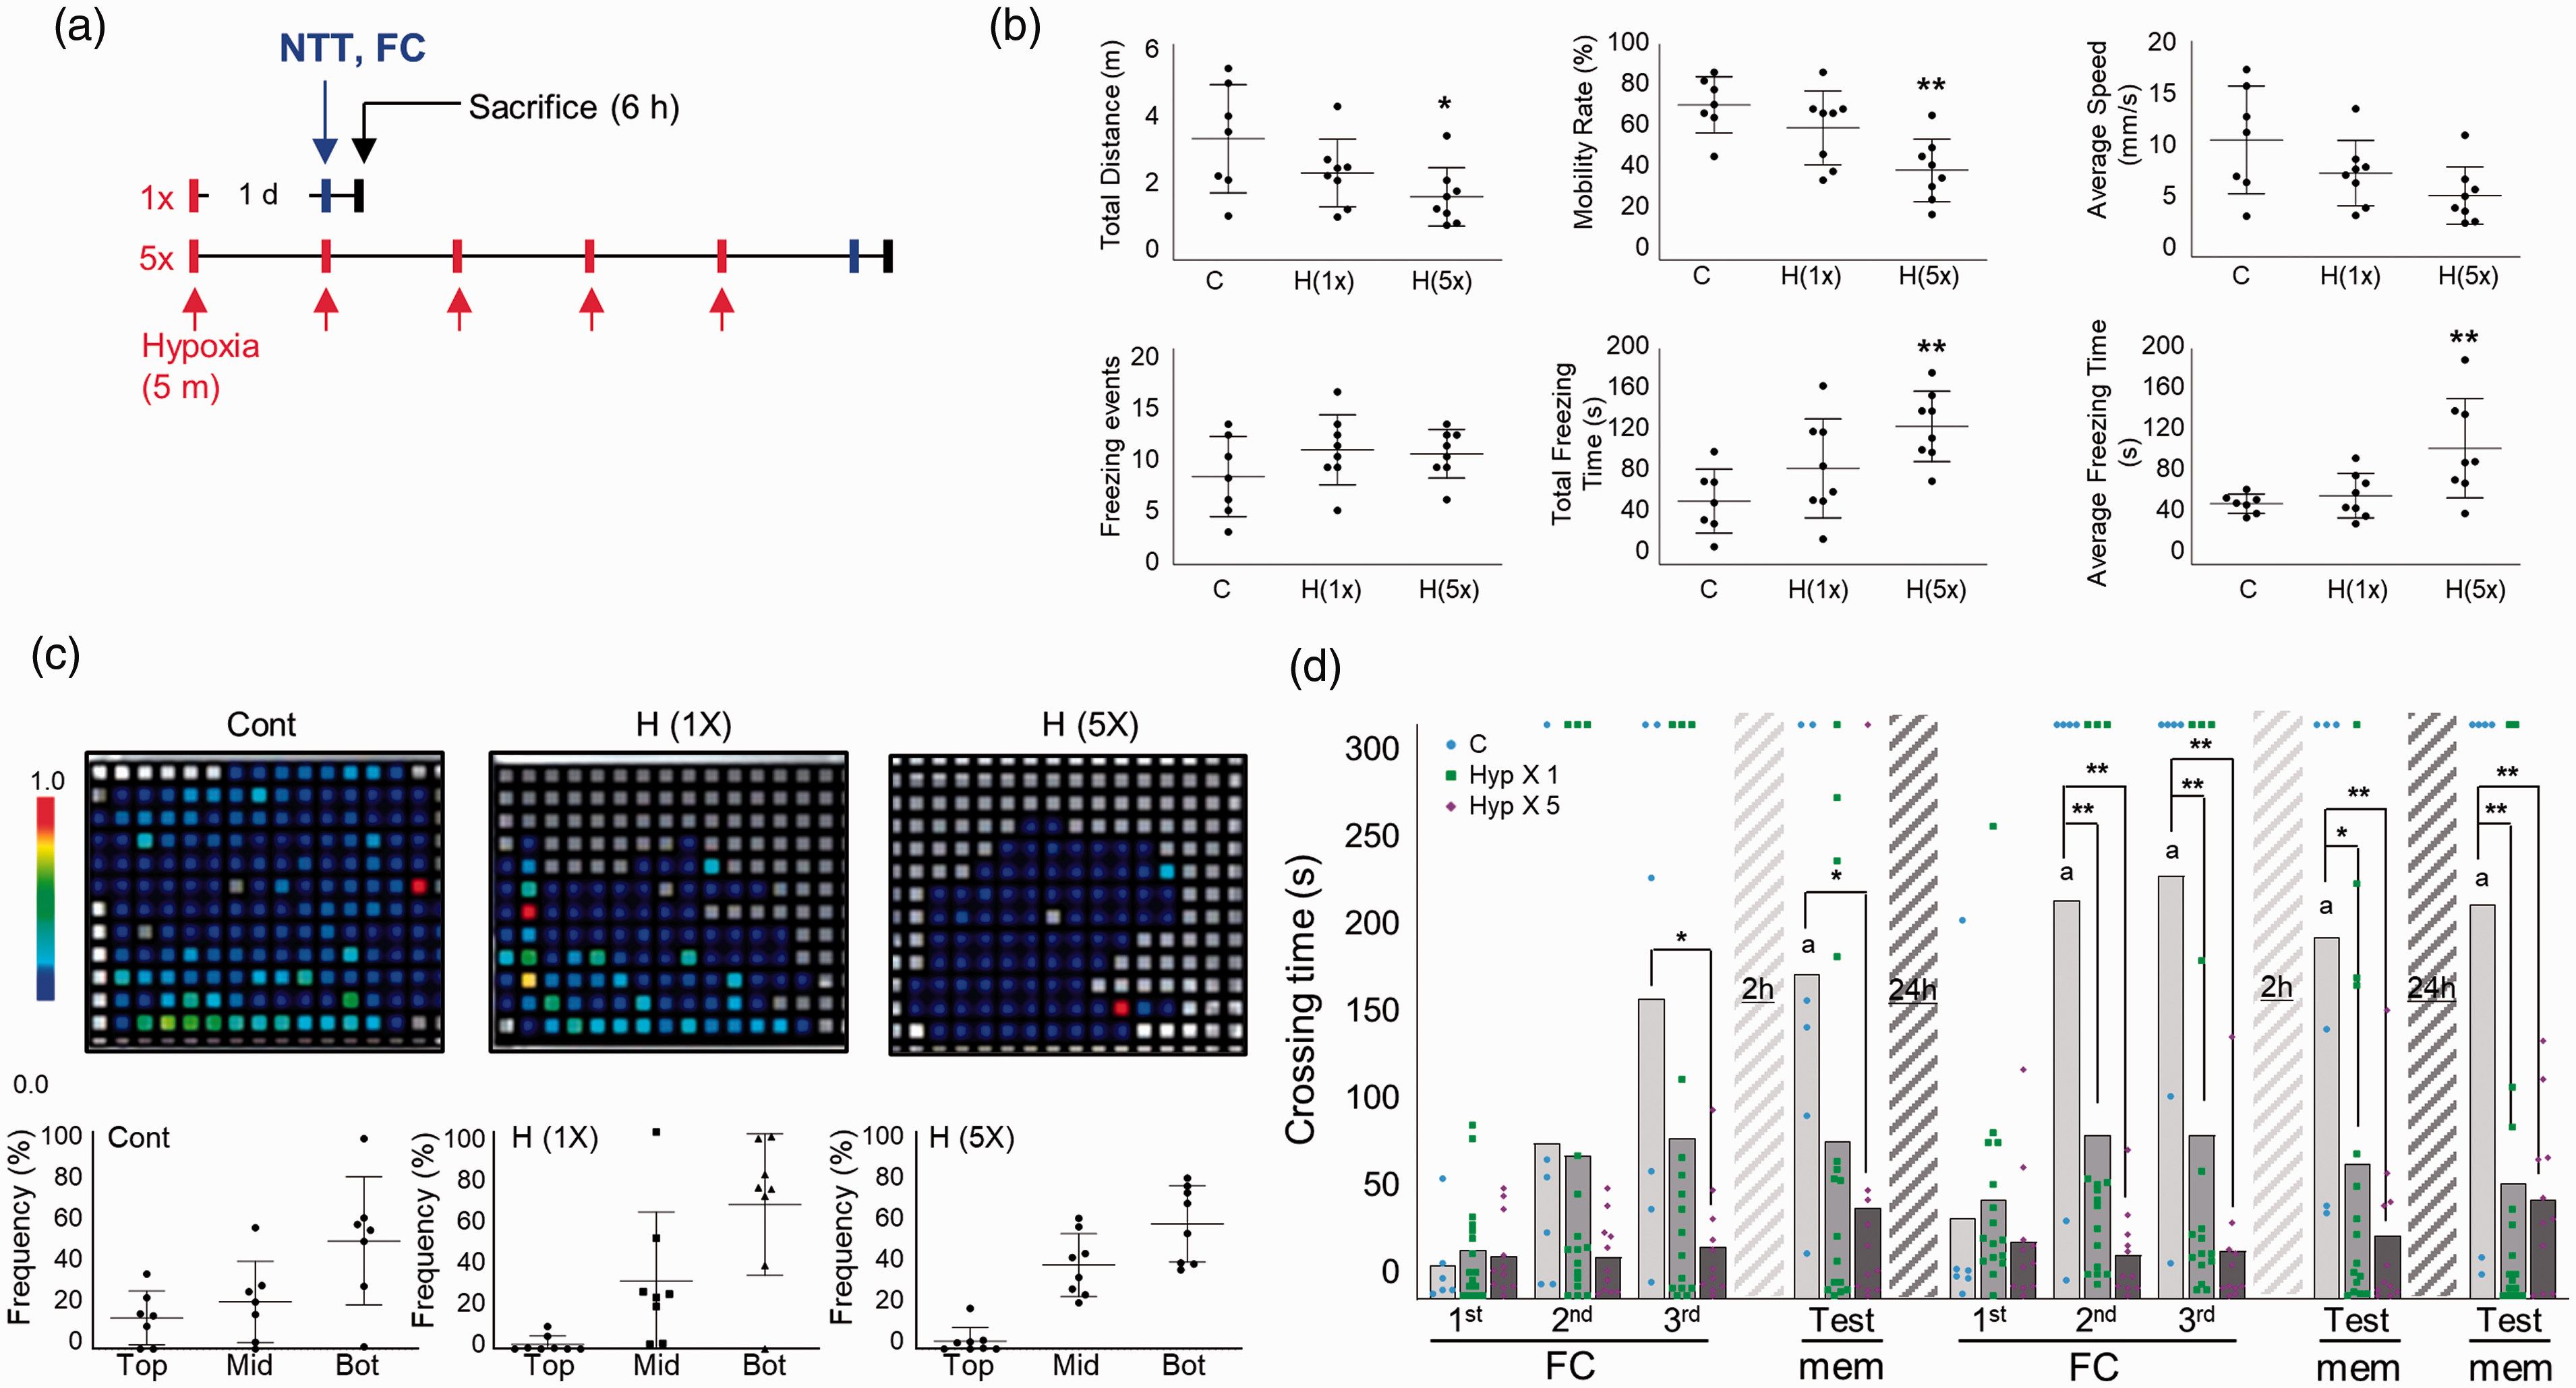
Increased anxiety behavior and L/M dysfunction induced by repeated hypoxic exposure in adult zebrafish. (a) Schematic showing the experimental design for hypoxic exposure of adult zebrafish. Novel tank test (NTT) and fear context memory test were applied at 1 day after the final hypoxia exposure and zebrafish were sacrificed at 6 h after NTT or FC. (b) In the NTT, exploration and swim performance were analyzed. Graphs demonstrate the total swimming distance, mobility rate, average swim speed, and freezing events of control and hypoxic (H) group zebrafish. Data represent mean ± standard deviation (n=7–9/group). Statistical analysis was carried out by Kruskal-Wallis with false discovery rate (FDR) multiple comparison test (*p<0.05, **p<0.01 vs. Con). (c) Representative heatmaps show the swimming distribution in the novel tank. Graphs demonstrate the frequency of zebrafish swimming in the top, middle (mid) and bottom (bot) of the novel tank. Data represent mean ± standard deviation (n=7–9/group). Statistical analysis was carried out by Kruskal-Wallis with false discovery rate (FDR) multiple comparison test. (d) The graphs represent fear context memory test (passive avoidance test). Crossing times were measured in fear conditioning (FC; three consecutive training) and memory test (mem) sessions. A test session was applied at 2 h after the first learning session. A second learning session was applied at 24 h after the first learning session, followed by two test sessions at 2 and 24 h after the second learning session. Dots represent the individual values of crossing time and bars indicate the mean crossing time (n = 6–16/group). For Fear-conditioning test analysis within a group, repeated measures nonparametric ANOVA (Friedman’s test) with FDR was used for multiple comparisons (ap<0.05 vs. the 1st FC of 1st Day). Analysis between groups, two-way ANOVA followed by Turkey multiple comparisons test was performed (*p<0.05, **p<0.01 vs. Con).
Fear-motivated passive avoidance test was used to assess learning and short-term or long-term memory in zebrafish.
25
After three consecutive training sessions (fear conditioning: FC), short-term memory was tested at 2 h. Long-term memory was tested by performing a second, identical round of three FC sessions followed by memory tests after rest periods of 2 and 24 h. Under normoxia, as the number of trials increased, the crossing time became longer and more memory retention was seen at 2 and 24 h (Friedman test; Approximate p = 0.0002, Friedman statistic = 30.75, Crossing time; FC 1st day-1st FC vs. 2nd day-memory vs. 3rd day-memory, mean
RH induces change in several glucose metabolites in zebrafish brain
The schematic diagram presented in Figure 2(a) shows the major glucose metabolic pathways of glycolysis, the TCA cycle, pentose phosphate pathway (PPP), and hexosamine biosynthetic pathway (HBP). We measured and compared selected glucose metabolites in brains of control, SH and RH zebrafish via gas chromatography-mass spectrometry (GC-MS). To quantify the concentration of metabolites, a targeted analysis was conducted using GC-TQ-MS in the MRM mode. After normalization with identical isotope labeled standards, the levels of metabolites in brain tissues were calculated using calibration curves of authentic standards. The linear correlation coefficients (R2) for all targeted compounds were greater than 0.99, which showed analytically stable quantitative analysis. Our result demonstrated that the levels of glucose (Con vs. HYP-5x, mean
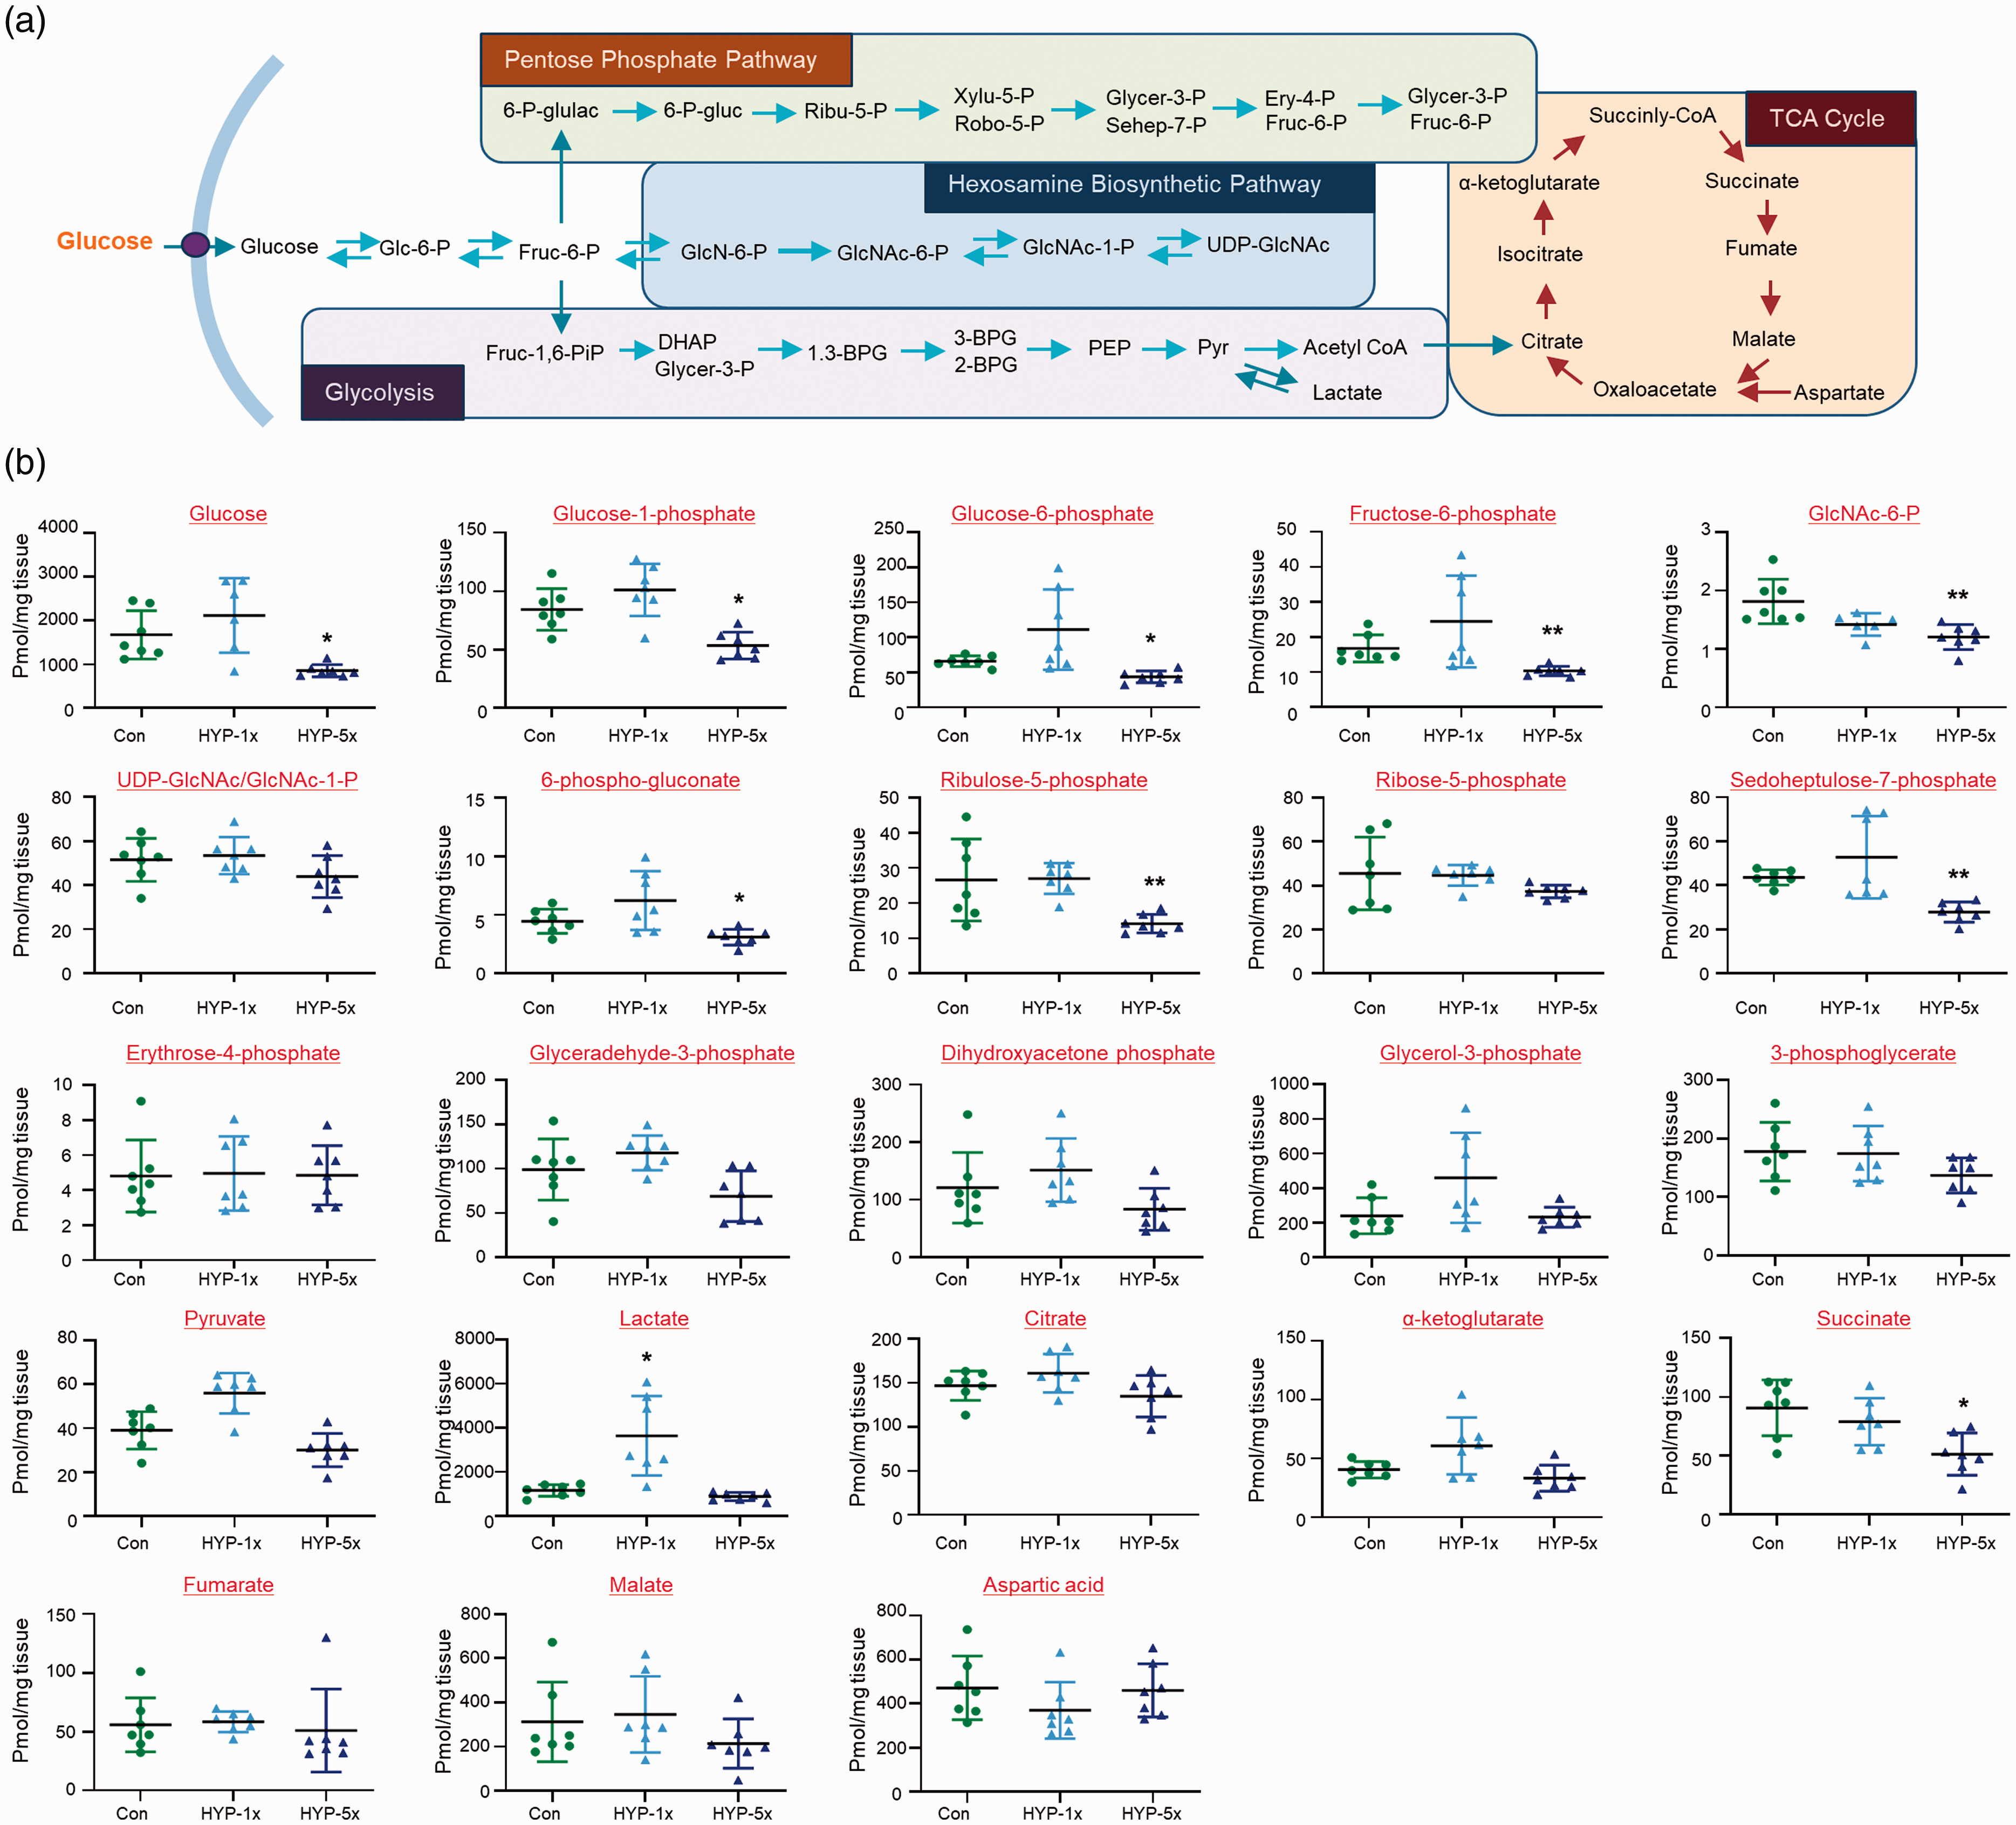
Changes of metabolites in zebrafish brains. (a) Schematic presentation of selected metabolites from glycolysis, the pentose phosphate pathway (PPP), the TCA cycle, and HBP. (b) Graphs represent quantification of selected metabolites by GC-MS/MS in brains of control normoxia (Con), single hypoxia (SH; 1×) and five repeated exposures to hypoxia (RH; 5×) groups (n=31/group). Data are represented as mean ± standard deviation. Statistical analysis was carried out by Kruskal-Wallis with false discovery rate (FDR) multiple comparison test (*p<0.05, **p<0.01 vs. Con).
Glucose or GlcN restores RH-induced L/M dysfunction through increased O-GlcNAc flux in the brain of zebrafish
Since RH reduced glucose and some metabolites of HBP in the brain, we examined the effects of HBP replenishment by GlcN. Indeed, GlcN significantly protexted the SH and RH groups against the hypoxia-related impairments in learning ability, learning potentiation, and short- and long-term memory ability (Two-way ANOVA, column factor; C vs. GlcN
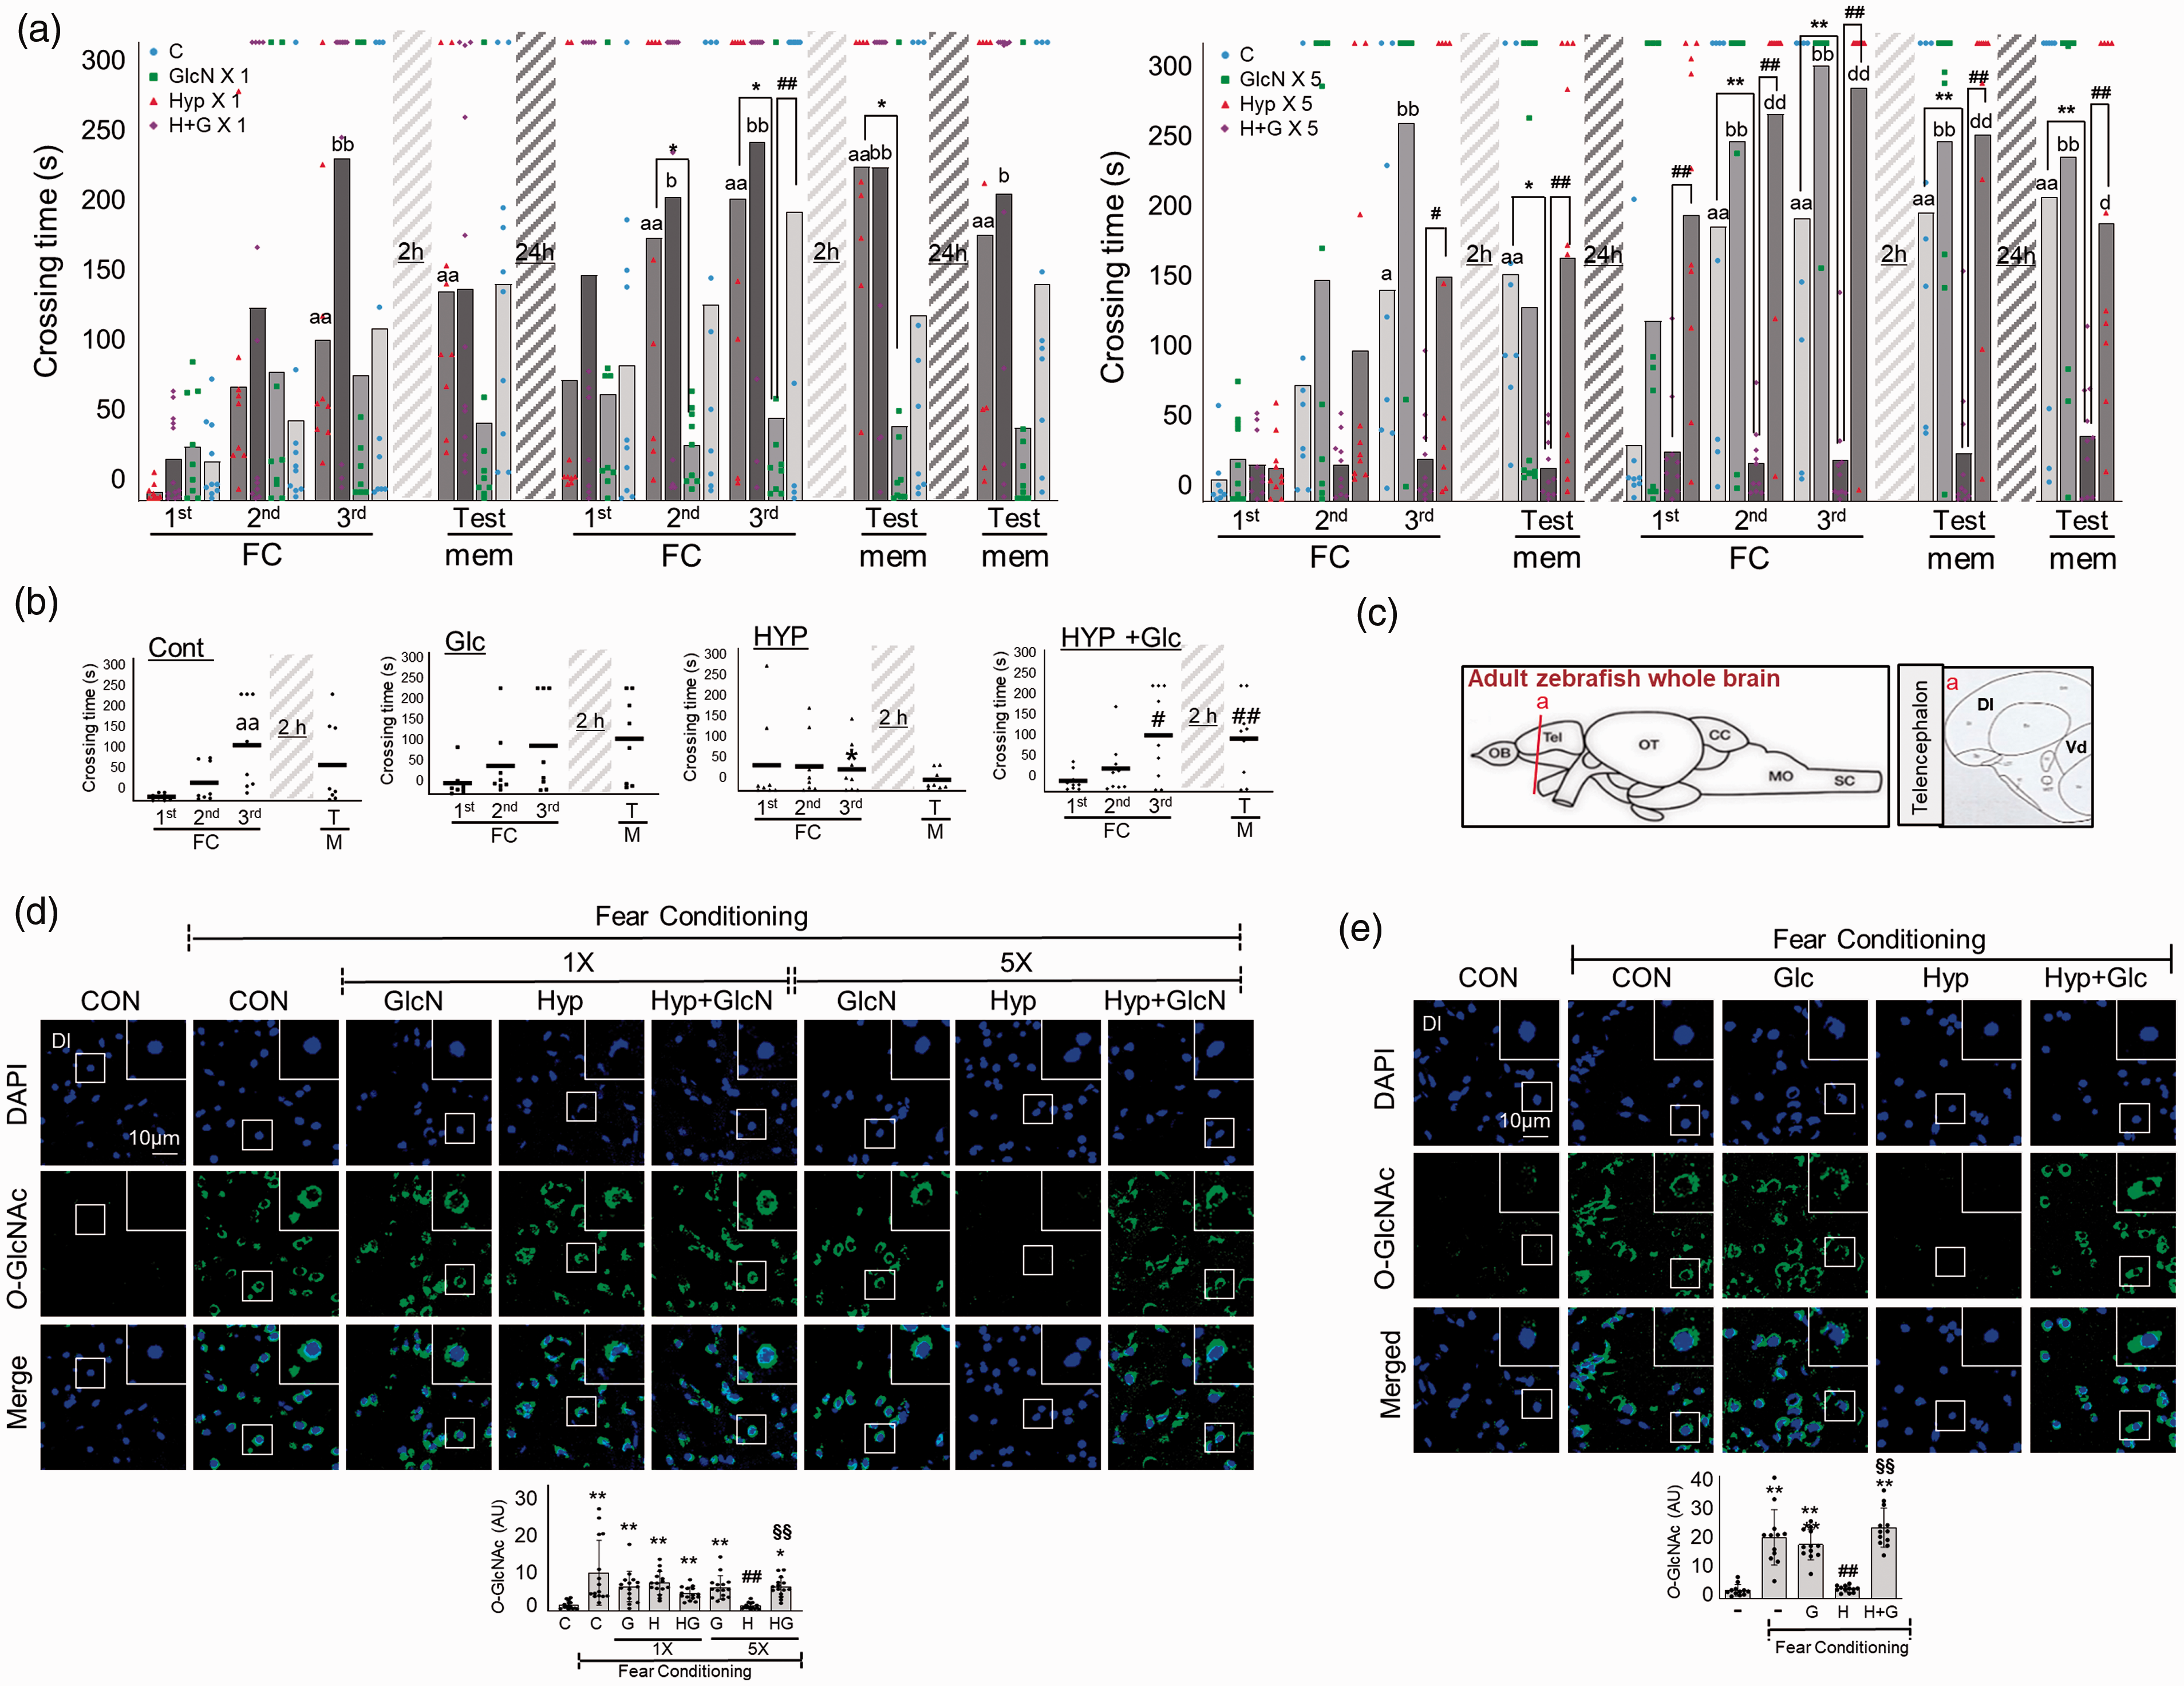
Effects of GlcN or glucose on hypoxia-induced L/M dysfunction. (a) Zebrafish were subjected to intraperitoneal injection of 200 μg/g GlcN (G) 2 h prior to each bout of hypoxia during RH. Representative results obtained from the fear context passive avoidance test for the effect of GlcN on SH (1×) (left) or RH (5×) (right). Dots indicate the individual crossing time and bars represent the mean crossing time (n=8–12/group). For Fear-conditioning test analysis within a group, repeated measures nonparametric ANOVA (Friedman’s test) with FDR was used for multiple comparisons (aap<0.05 or aap<0.01 vs. the 1st FC of Con, bp<0.05 or bbp<0.01 vs. the 1st FC of GlcN X1 or GlcN X5, dp<0.05 or ddp<0.01 vs. the 1st FC of H+G X1 or H+G X5). Analysis between groups, two-way ANOVA followed by Turkey multiple comparisons test was performed (*p<0.05, **p<0.01 vs. Con, #p<0.05, ##p<0.01 vs. Hyp X1 or Hyp X5). (b) Glucose (Glc, 1 mg/g) was intraperitoneally injected to zebrafish 2 h prior to each bout of hypoxia during RH (HYP, H). Passive avoidance tests were performed. Dots represent the individual crossing time and bars indicate the mean crossing time (n=8–9/group). Data analysis within a group, repeated measures nonparametric ANOVA (Friedman’s test) with FDR was used for multiple comparisons (aap<0.01 vs. the 1st FC of Con). Analysis between groups, two-way ANOVA followed by Turkey multiple comparisons test was performed (*p<0.05 vs. Con, #p<0.05, ##p<0.01 vs. Hyp). (c) Schematic depiction of zebrafish brain subregions; lateral zone of dorsal telencephalon (Dl) and ventral telencephalon (Vd) are shown in (a) box. (d and e) Zebrafish were intraperitoneally injected with GlcN (d) or glucose (e) 2 h prior to SH (1×) or each bout of hypoxia during RH (5×). Representative confocal images (x40) of DAPI (blue) and O-GlcNAc (green) and merged immunofluorescence staining of the Dl region of zebrafish telencephalon at 6 h after FC. Enlarged images are presented in the white boxes. Graphs represent densitometric quantification of O-GlcNAc (n=5/group in D, n=4/group in E). Statistical analysis was carried out by Kruskal-Wallis with false discovery rate (FDR) multiple comparison test. (*p<0.05, **p<0.01 vs. Cont, #p<0.05, ##p<0.01 vs. fear-conditioned Cont, §§p<0.01 vs. fear-conditioned RH.)
RH reduces FC-induced PKA/CREB activation and increases OGA level, in the brain of zebrafish
We further examined the levels of OGT and OGA in SH or RH zebrafish after FC stimulation. Unstimulated basal OGT levels were not significantly changed by SH or RH in the brain of zebrafish (data not shown). FC increased OGT expression in the DI region of control (C vs. FC+C, mean
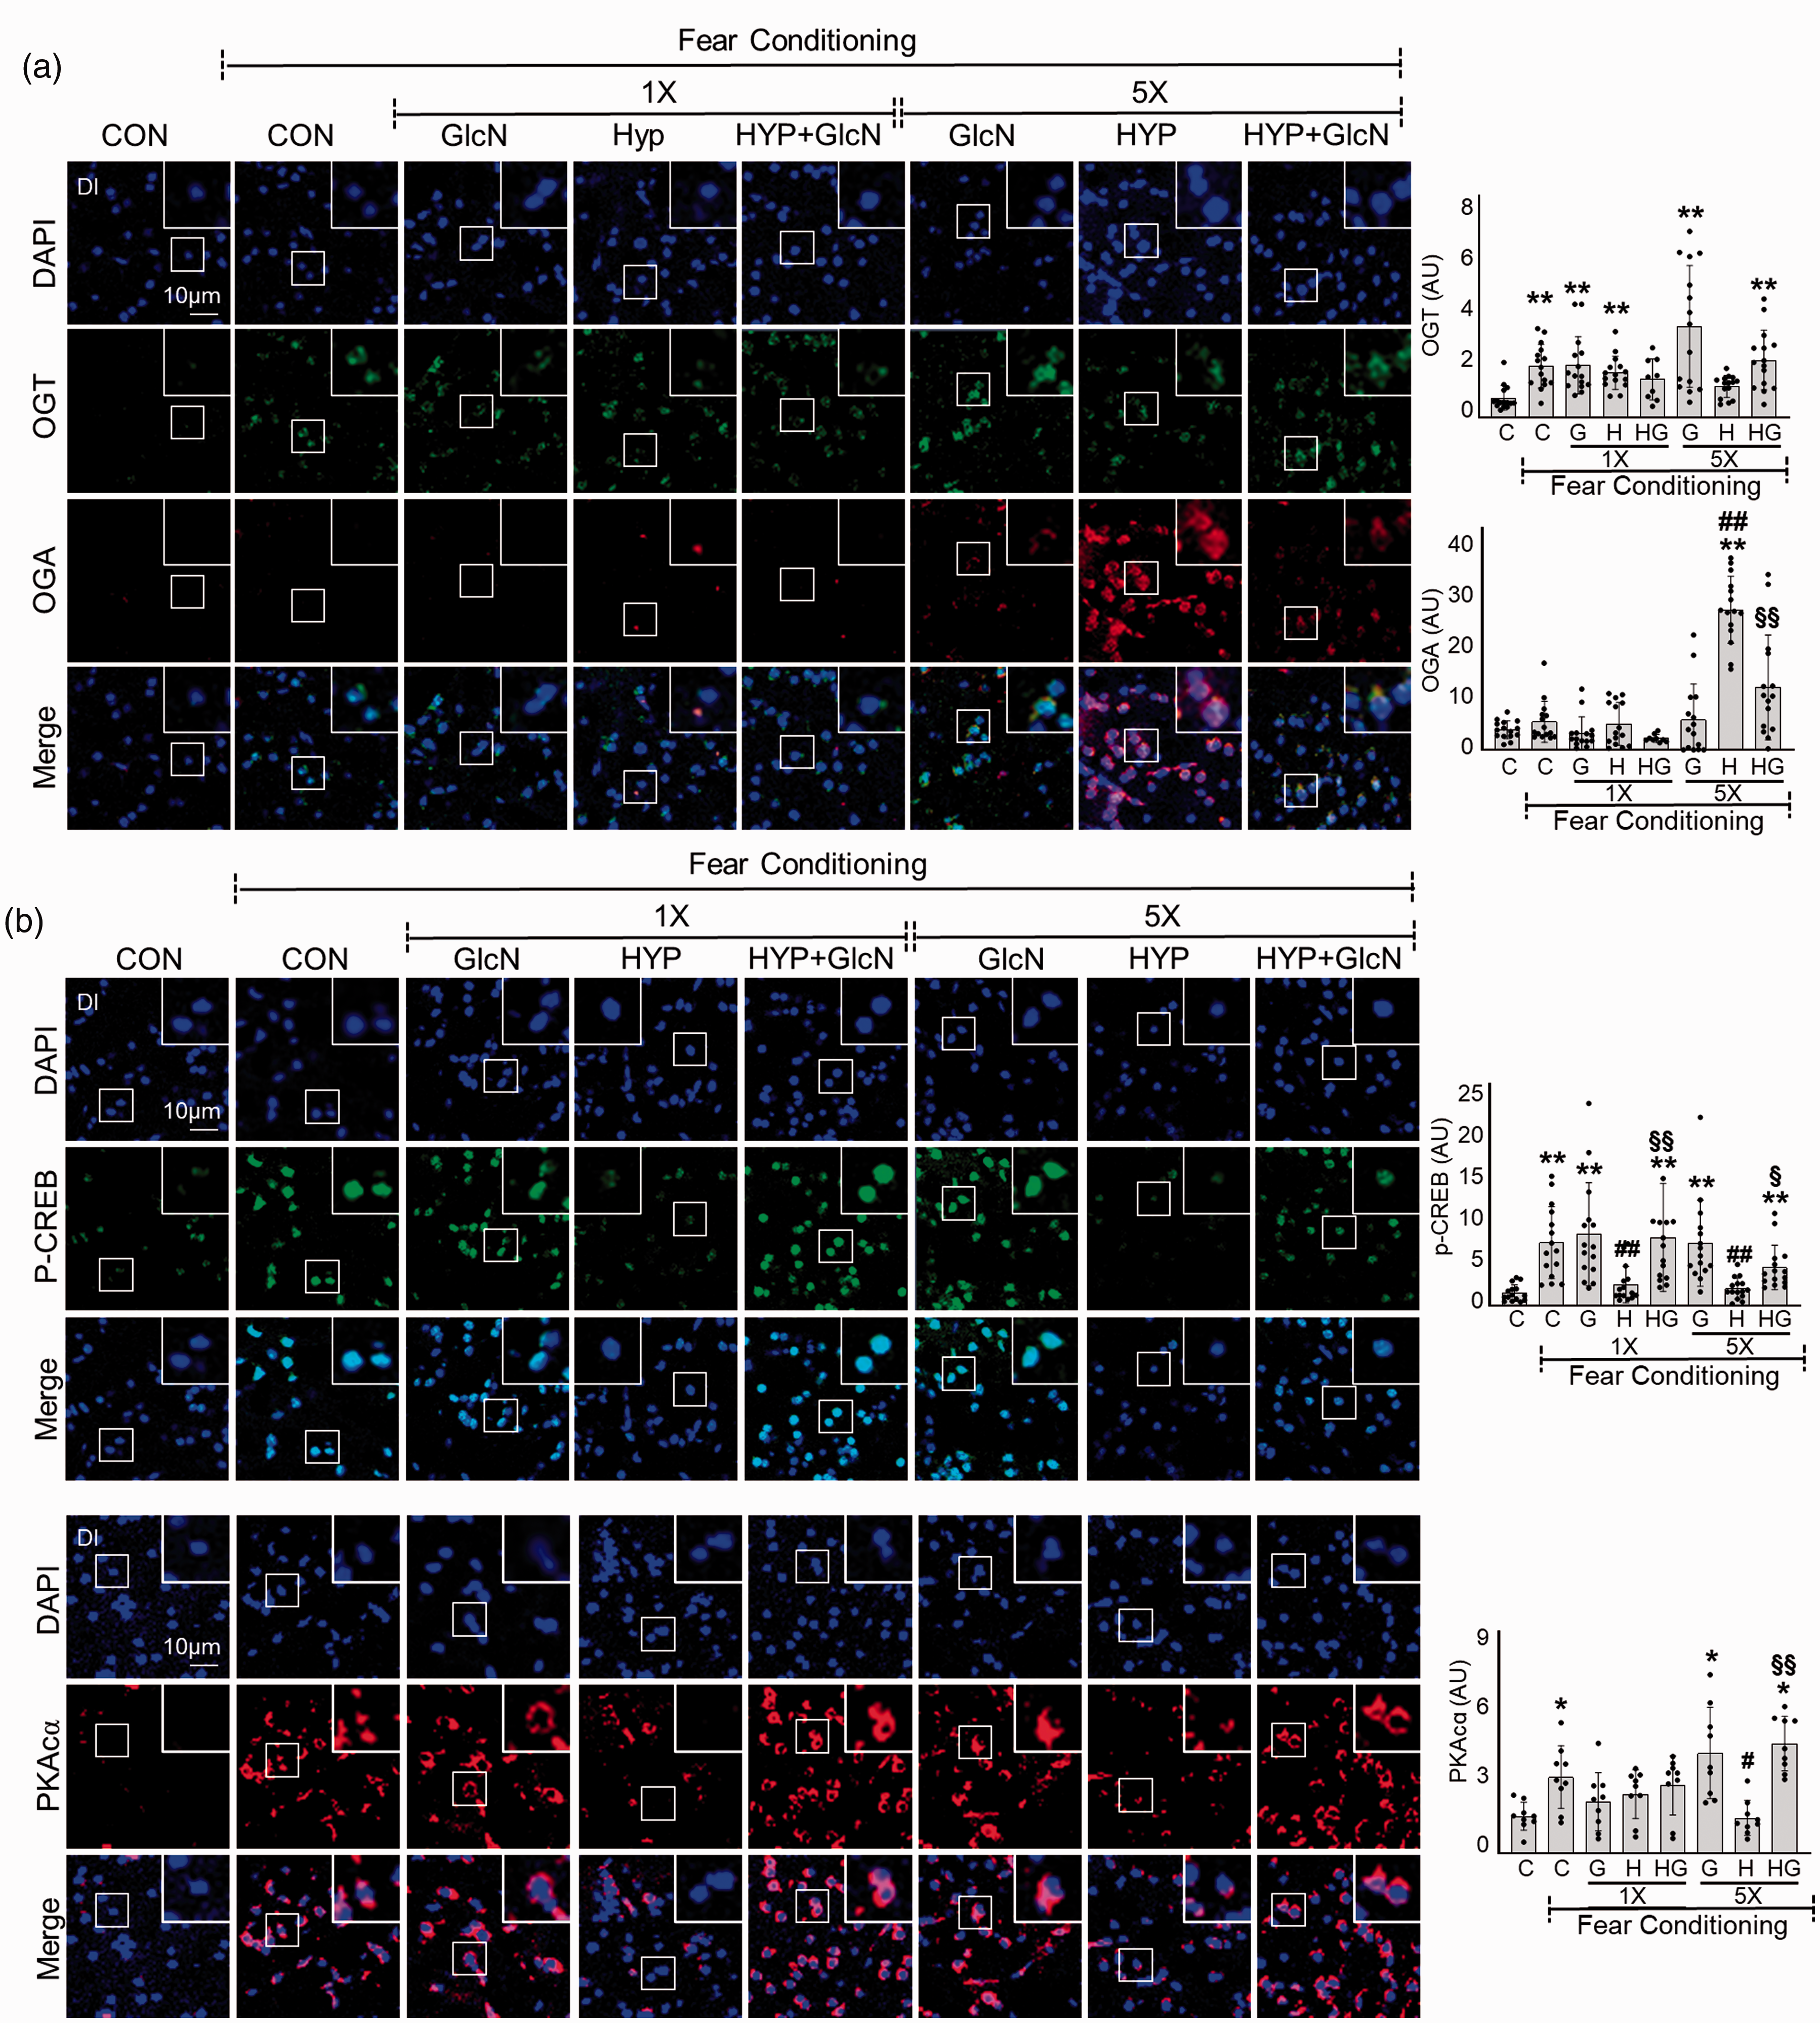
Effects of GlcN on OGA and OGT expression and PKA/CREB signaling in control, SH and RH zebrafish. Zebrafish were exposed to SH (1×) or RH (5×) with or without intraperitoneal pre-injection of GlcN (G, 200 μg/g) at 2 h prior to each bout of hypoxia. Representative confocal images (x40) of DAPI (blue), OGT (green) and OGA (red, A), and p-CREB (green,B) and PKAcα (red, B) and merged immunofluorescence staining of the Dl of zebrafish brain at 6 h after FC in the control (normoxia, CON or C), SH (1×), and RH (5×) hypoxic (HYP or H) groups. Enlarged images are presented in the white boxes. Graphs represent densitometric quantification of OGT, OGA, p-CREB or PKAcα (n=3–5/group). Statistical analysis was carried out by Kruskal-Wallis with false discovery rate (FDR) multiple comparison test. (*p<0.05, **p<0.01 vs. Cont, #p<0.05, ##p<0.01 vs. fear-conditioned Cont, §p<0.05, §§p<0.01 vs. fear-conditioned RH.)
Thiamet G restores RH-induced L/M dysfunction in zebrafish
To further explore the importance of HBP/O-GlcNAc cycling, we investigated the impact of the OGA inhibitor, Thiamet G, on RH-induced L/M impairment. Interestingly, although both 5 nM and 50 nM Thiamet G inhibited the L/M function of zebrafish, 5 nM but not 50 nM Thiamet G restored RH-induced L/M function (Two-way ANOVA, column factor; Cont vs. TG(5) vs. TG(50) vs. HYP vs. HYP+TG(5) vs. HYP+TG(50), F = 6.523, DFn = 5, DFd = 232, p < 0.0001) (Figure 5(a)). Thiamet G dose-dependently upregulated O-GlcNAcylation in response to FC in RH group (FC+RH vs. FC+RH+TG5 vs. FC+RH+TG50, mean
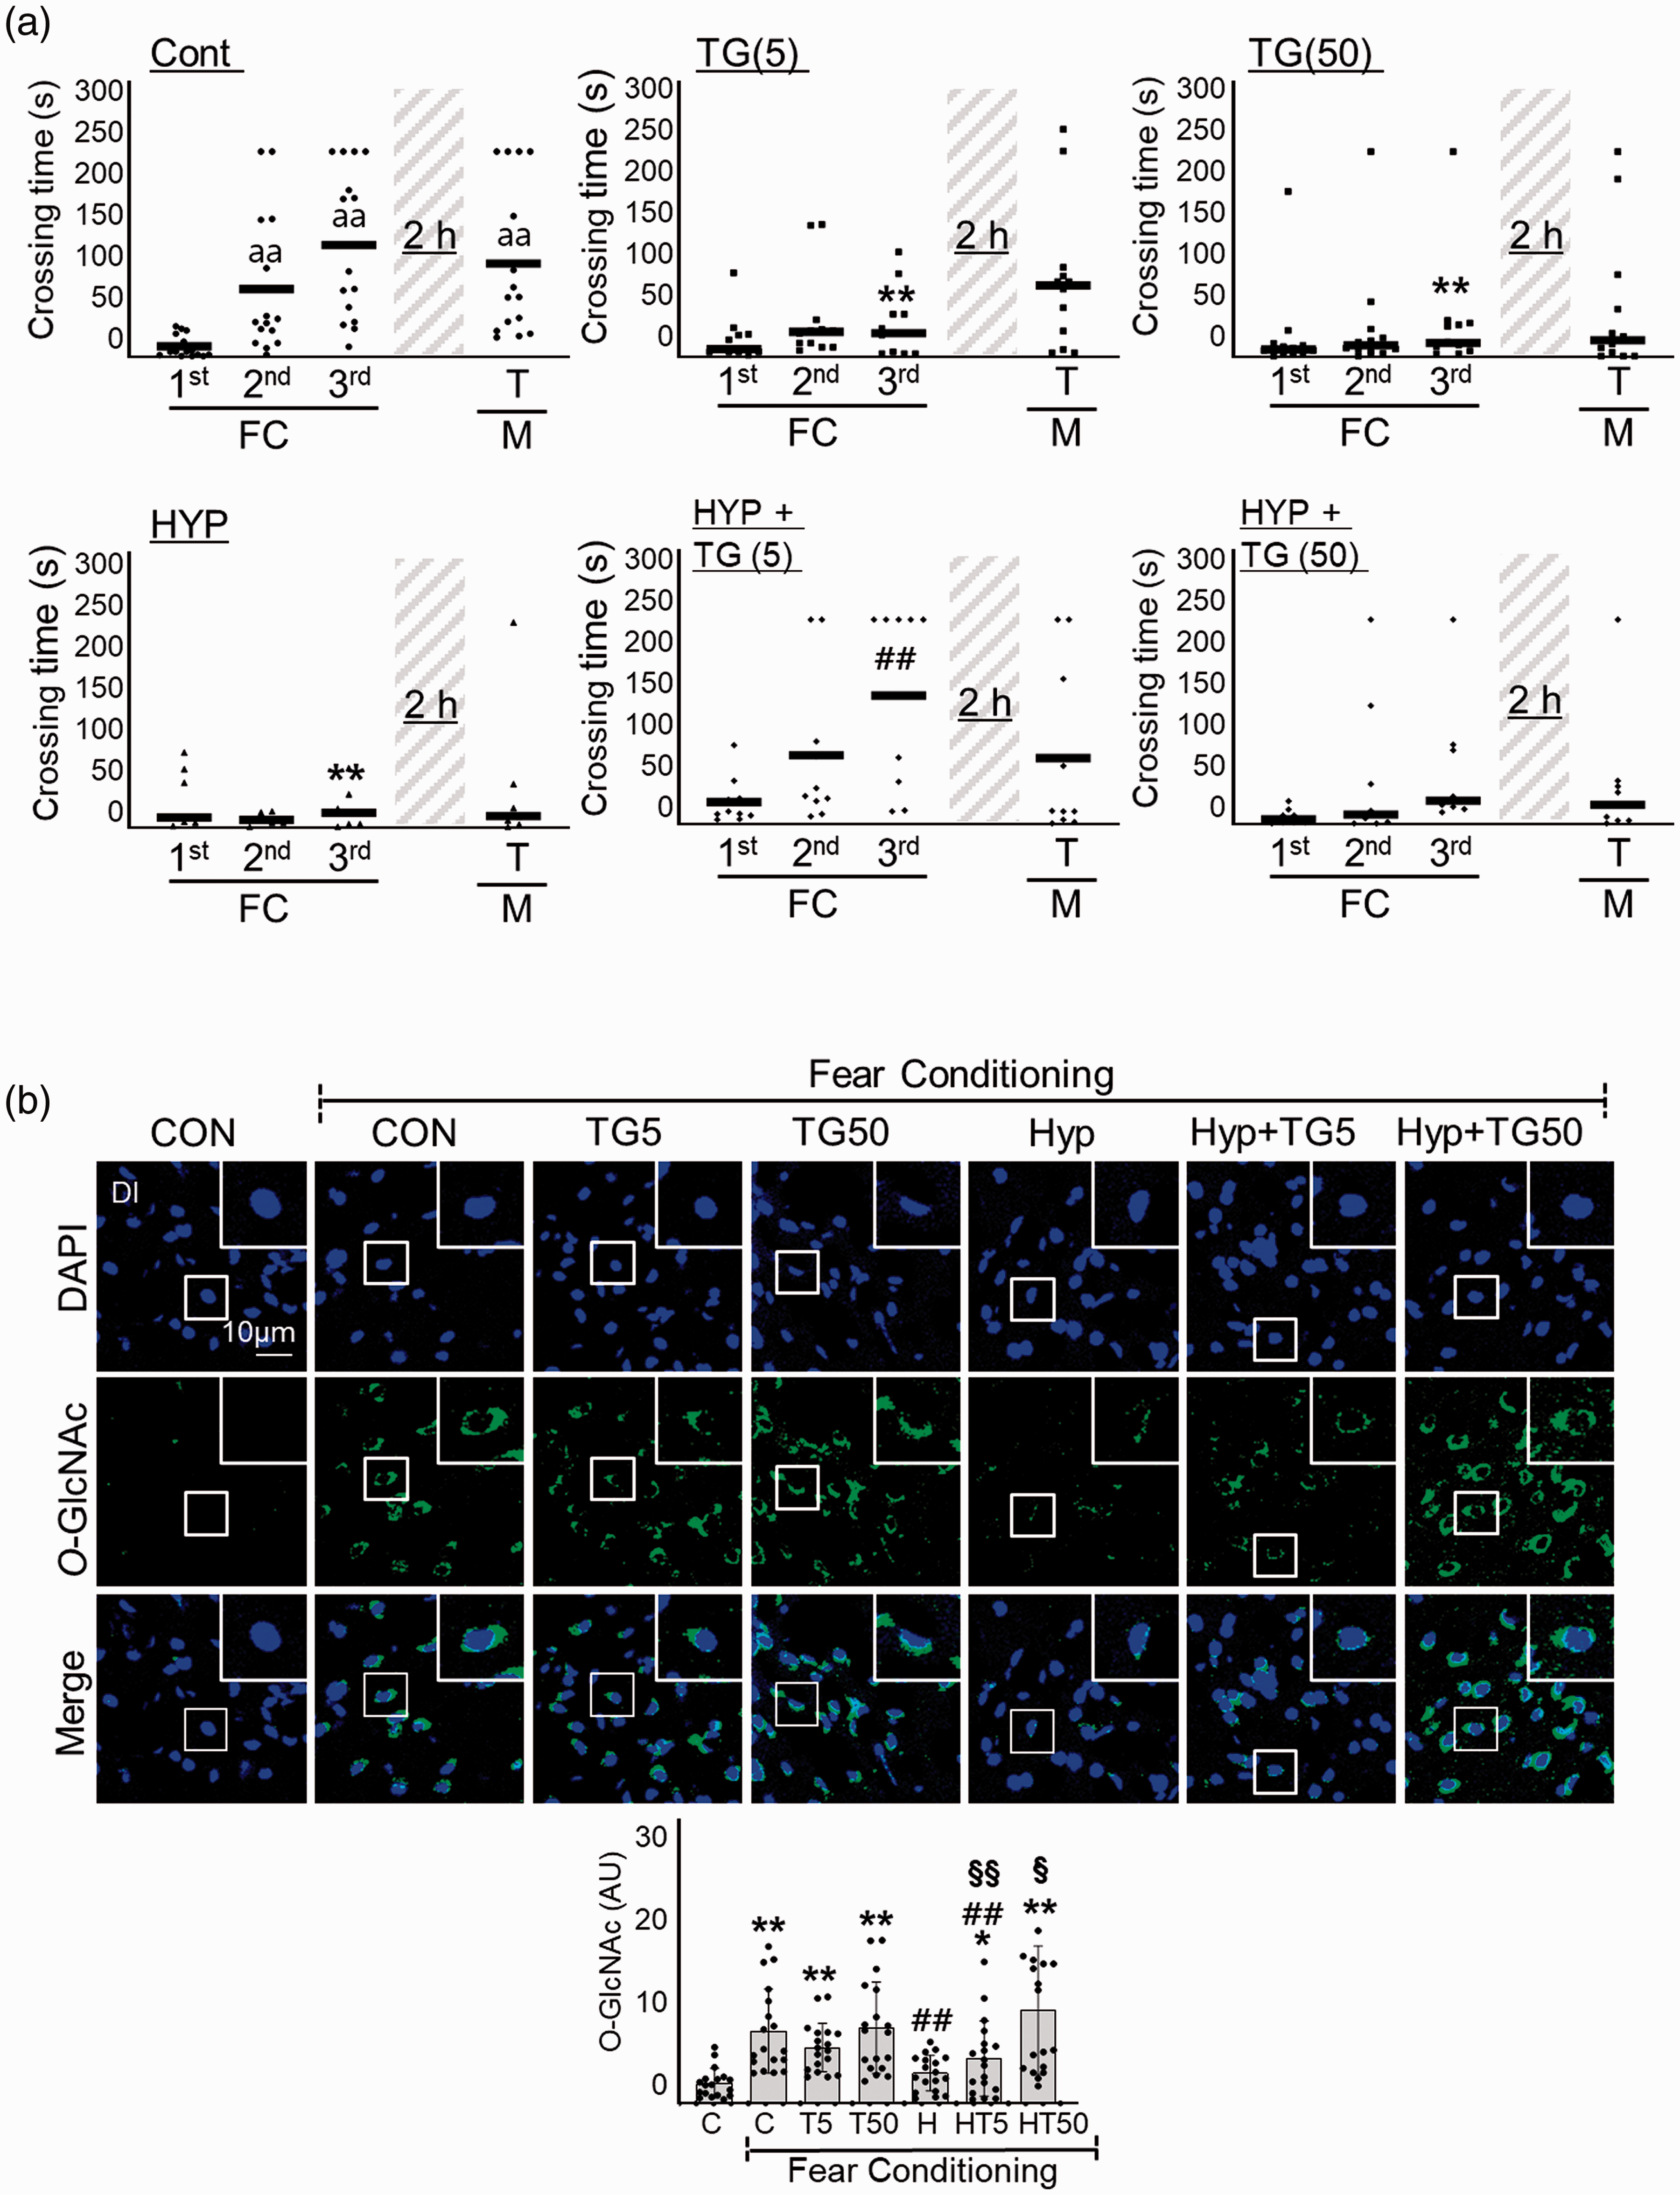
Effects of Thiamet-G on RH-induced L/M dysfunction. Thiamet G (TG, 5 or 50 ng/g) was intraperitoneally injected to zebrafish 2 h prior to each bout of hypoxia during RH (HYP). (a) L/M functions were measured by fear context passive avoidance test. Dots indicate the individual crossing time and bars represent the mean crossing time (n=7–12/group). Data analysis within a group, repeated measures nonparametric ANOVA (Friedman’s test) with FDR was used for multiple comparisons (aap<0.01 vs. the 1st FC of Con). Analysis between groups, two-way ANOVA followed by Turkey multiple comparisons test was performed (**p<0.01 vs. Con, ##p<0.01 vs. Hyp). (b) Representative confocal images (x40) of DAPI (blue), O-GlcNAc (green), and merged immunofluorescence staining of the telencephalon Dl region of zebrafish brain at 6 h of FC. Enlarged images are presented in the white boxes. Graphs represent densitometric quantification of O-GlcNAc (n=6/group). Statistical analysis was carried out by Kruskal-Wallis with false discovery rate (FDR) multiple comparison test. (**p<0.01 vs. Cont, ##p<0.01 vs. fear-conditioned Cont, §p<0.05, §§p<0.01 vs. fear-conditioned RH.)
GlcN suppresses RH-induced inflammation in zebrafish brain
We previously showed that a single acute bout of hypoxia induces neuroinflammation.
25
Here, we further explored the inflammatory responses to subacute SH or RH in the presence and absence of GlcN. Immunofluorescent staining was performed for the activated astrocyte markers, S100β and GFAP. Both SH and RH induced significant increases in cellular and fibrillary GFAP-(Vd region, C vs. SH vs. RH, mean
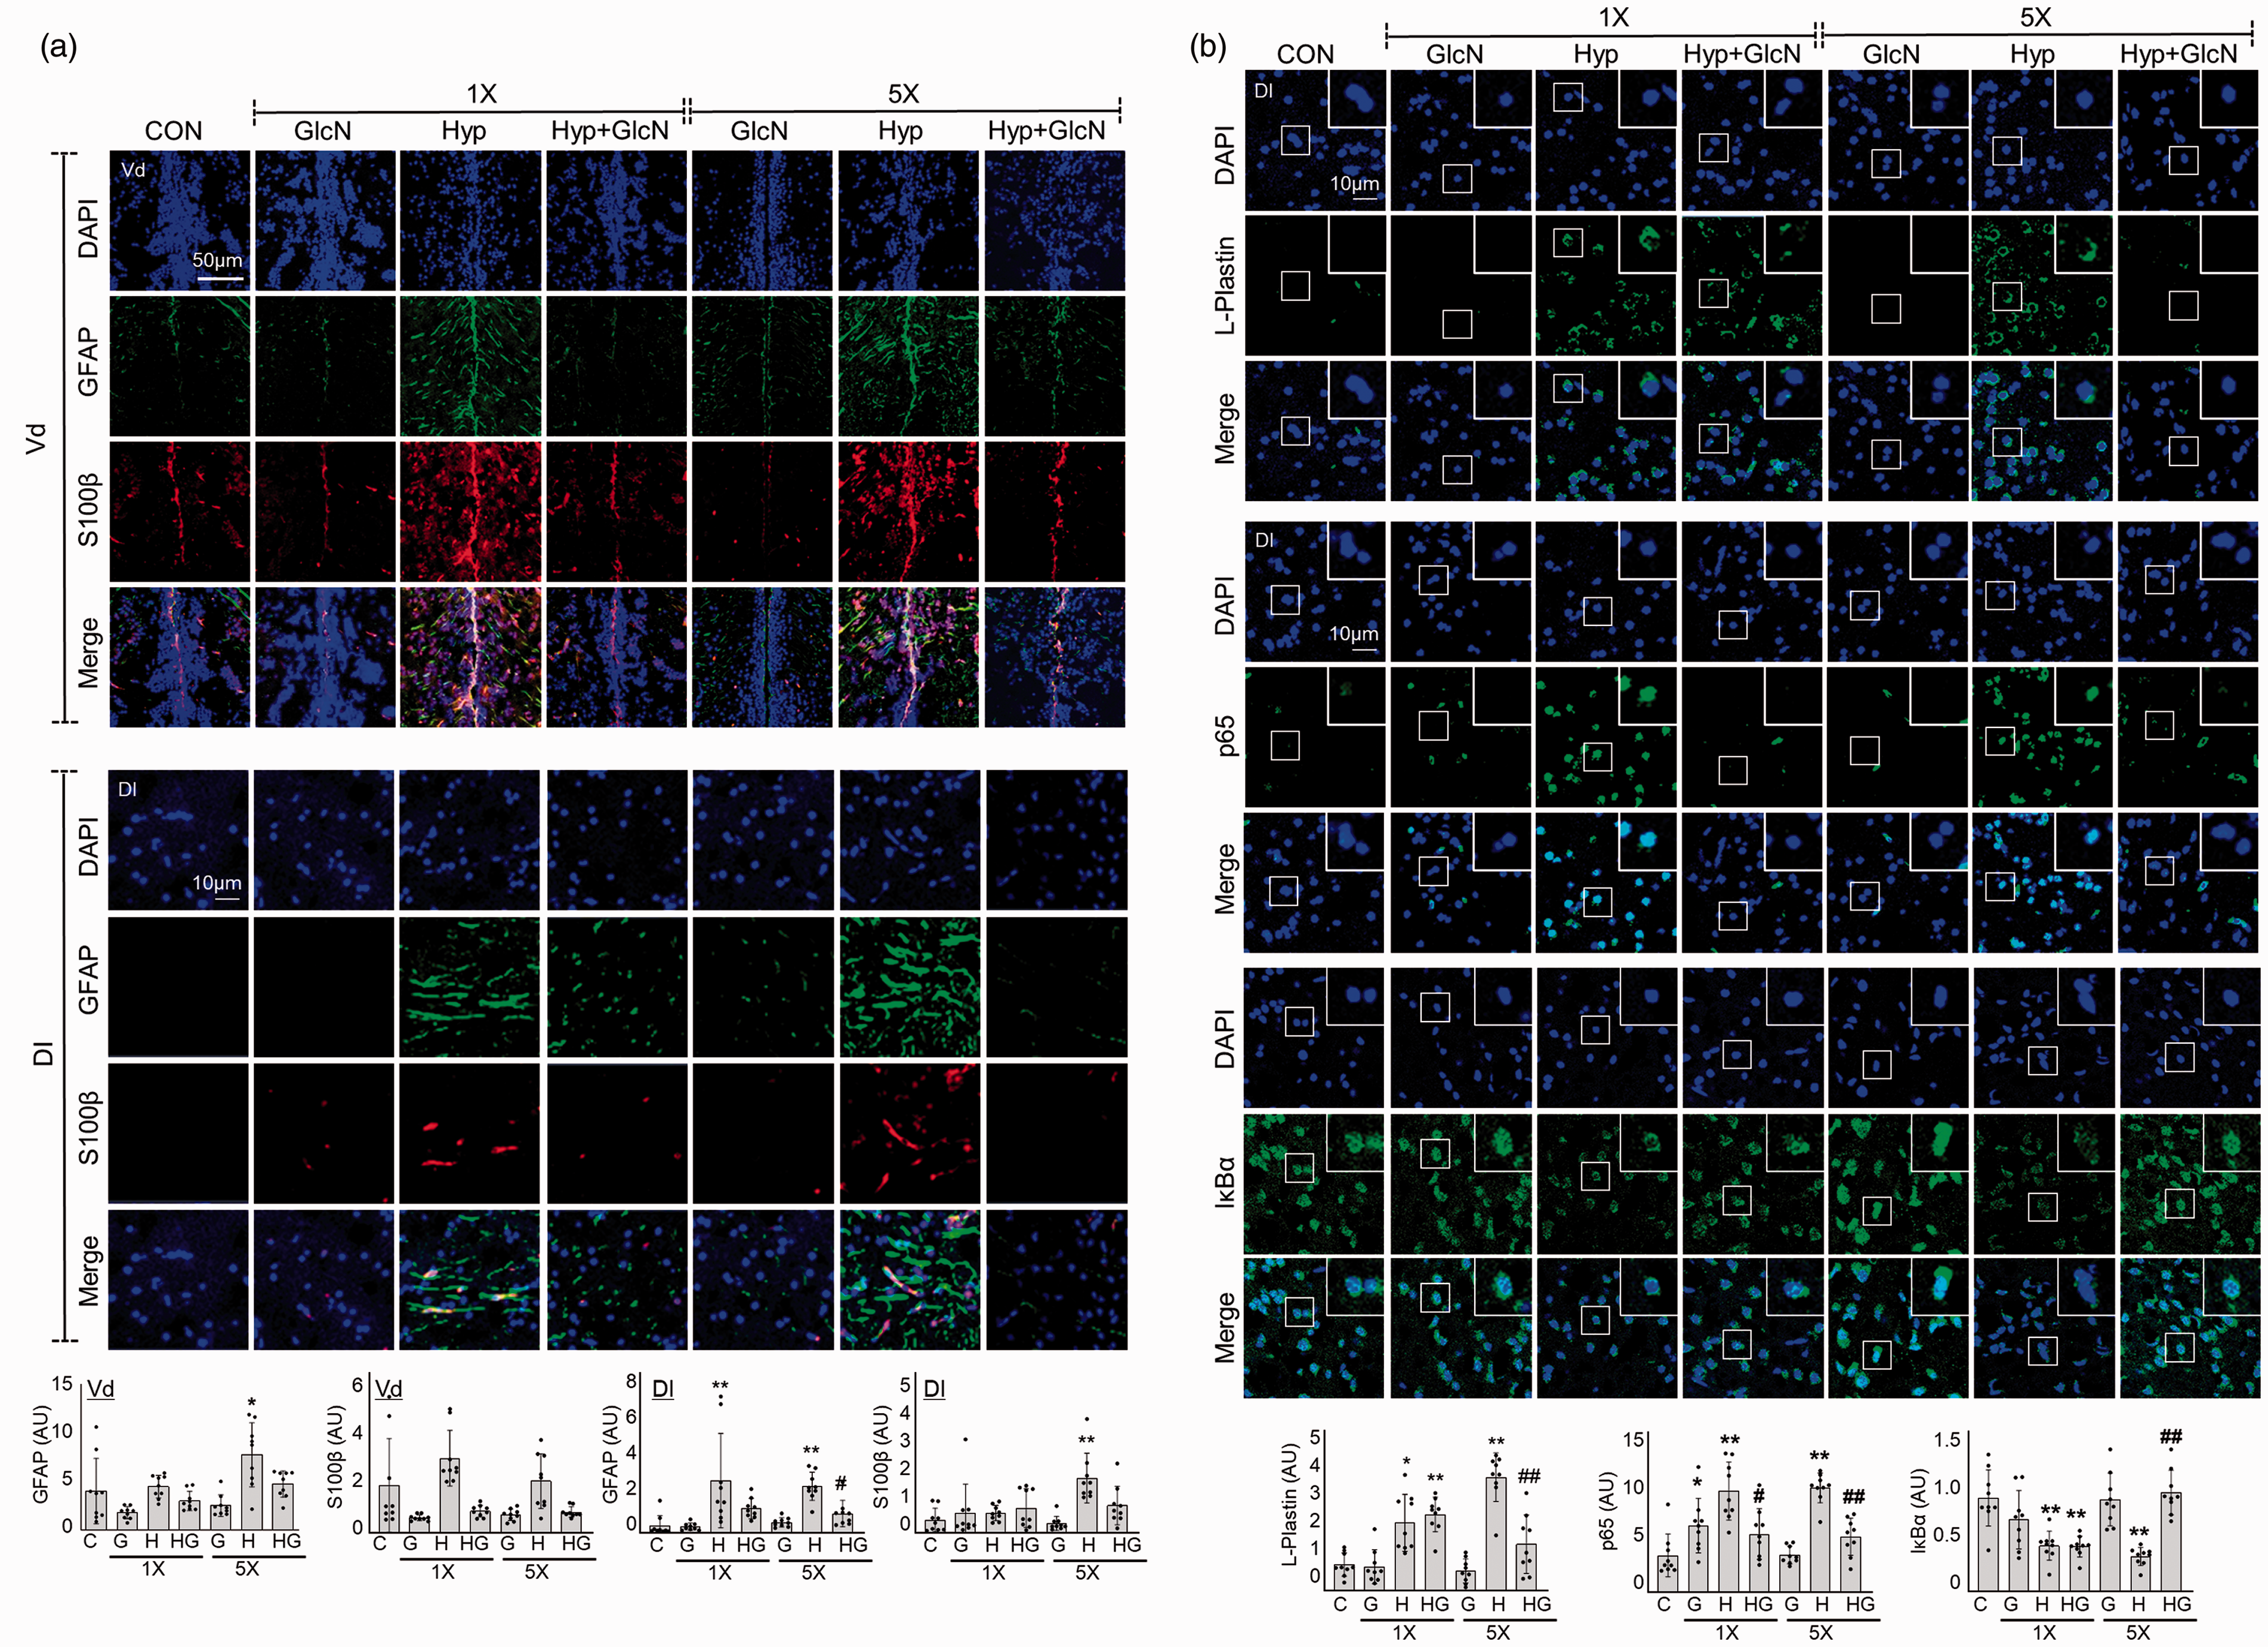
Effects of GlcN on SH and RH-induced neuroinflammation. Zebrafish were exposed to RH (5×) with or without intraperitoneal pre-injection of GlcN (200 μg/g) at 2 h prior to each bout of hypoxia during RH. (a) Representative confocal images (x40) of DAPI (blue), GFAP (green), S100β (red), and merged immunofluorescence staining of the telencephalic Vd and Dl regions of control, SH and RH zebrafish brains. Graphs represent densitometric quantification of GFAP or S100β (n=3/group). (b) DAPI (blue), p65, IκBα, or L-plastin (green), and merged immunofluorescence staining of the Dl regions of zebrafish brains. Enlarged images are presented in the white boxes. Graphs represent densitometric quantification of L-plastin, p65, and IκBα (n=3/group). Statistical analysis was carried out by Kruskal-Wallis with false discovery rate (FDR) multiple comparison test. (*p<0.05, **p<0.01 vs. Cont, ##p<0.01 vs. SH or RH.)
RH increases the accumulation of β-amyloid and p-Tau, and this effect is suppressed by GlcN
To examine the effect of hypoxia on development of AD pathologies in zebrafish, we immunostained the Dl of SH and RH zebrafish brains for β-amyloid (Aβ), p-Tau, and thioflavin S (ThioS). No significant change in Aβ or p-Tau immunofluorescence was evident following SH. In RH zebrafish brains, however, intra- or peri-nuclear p-Tau (C vs. RH: 0.4844
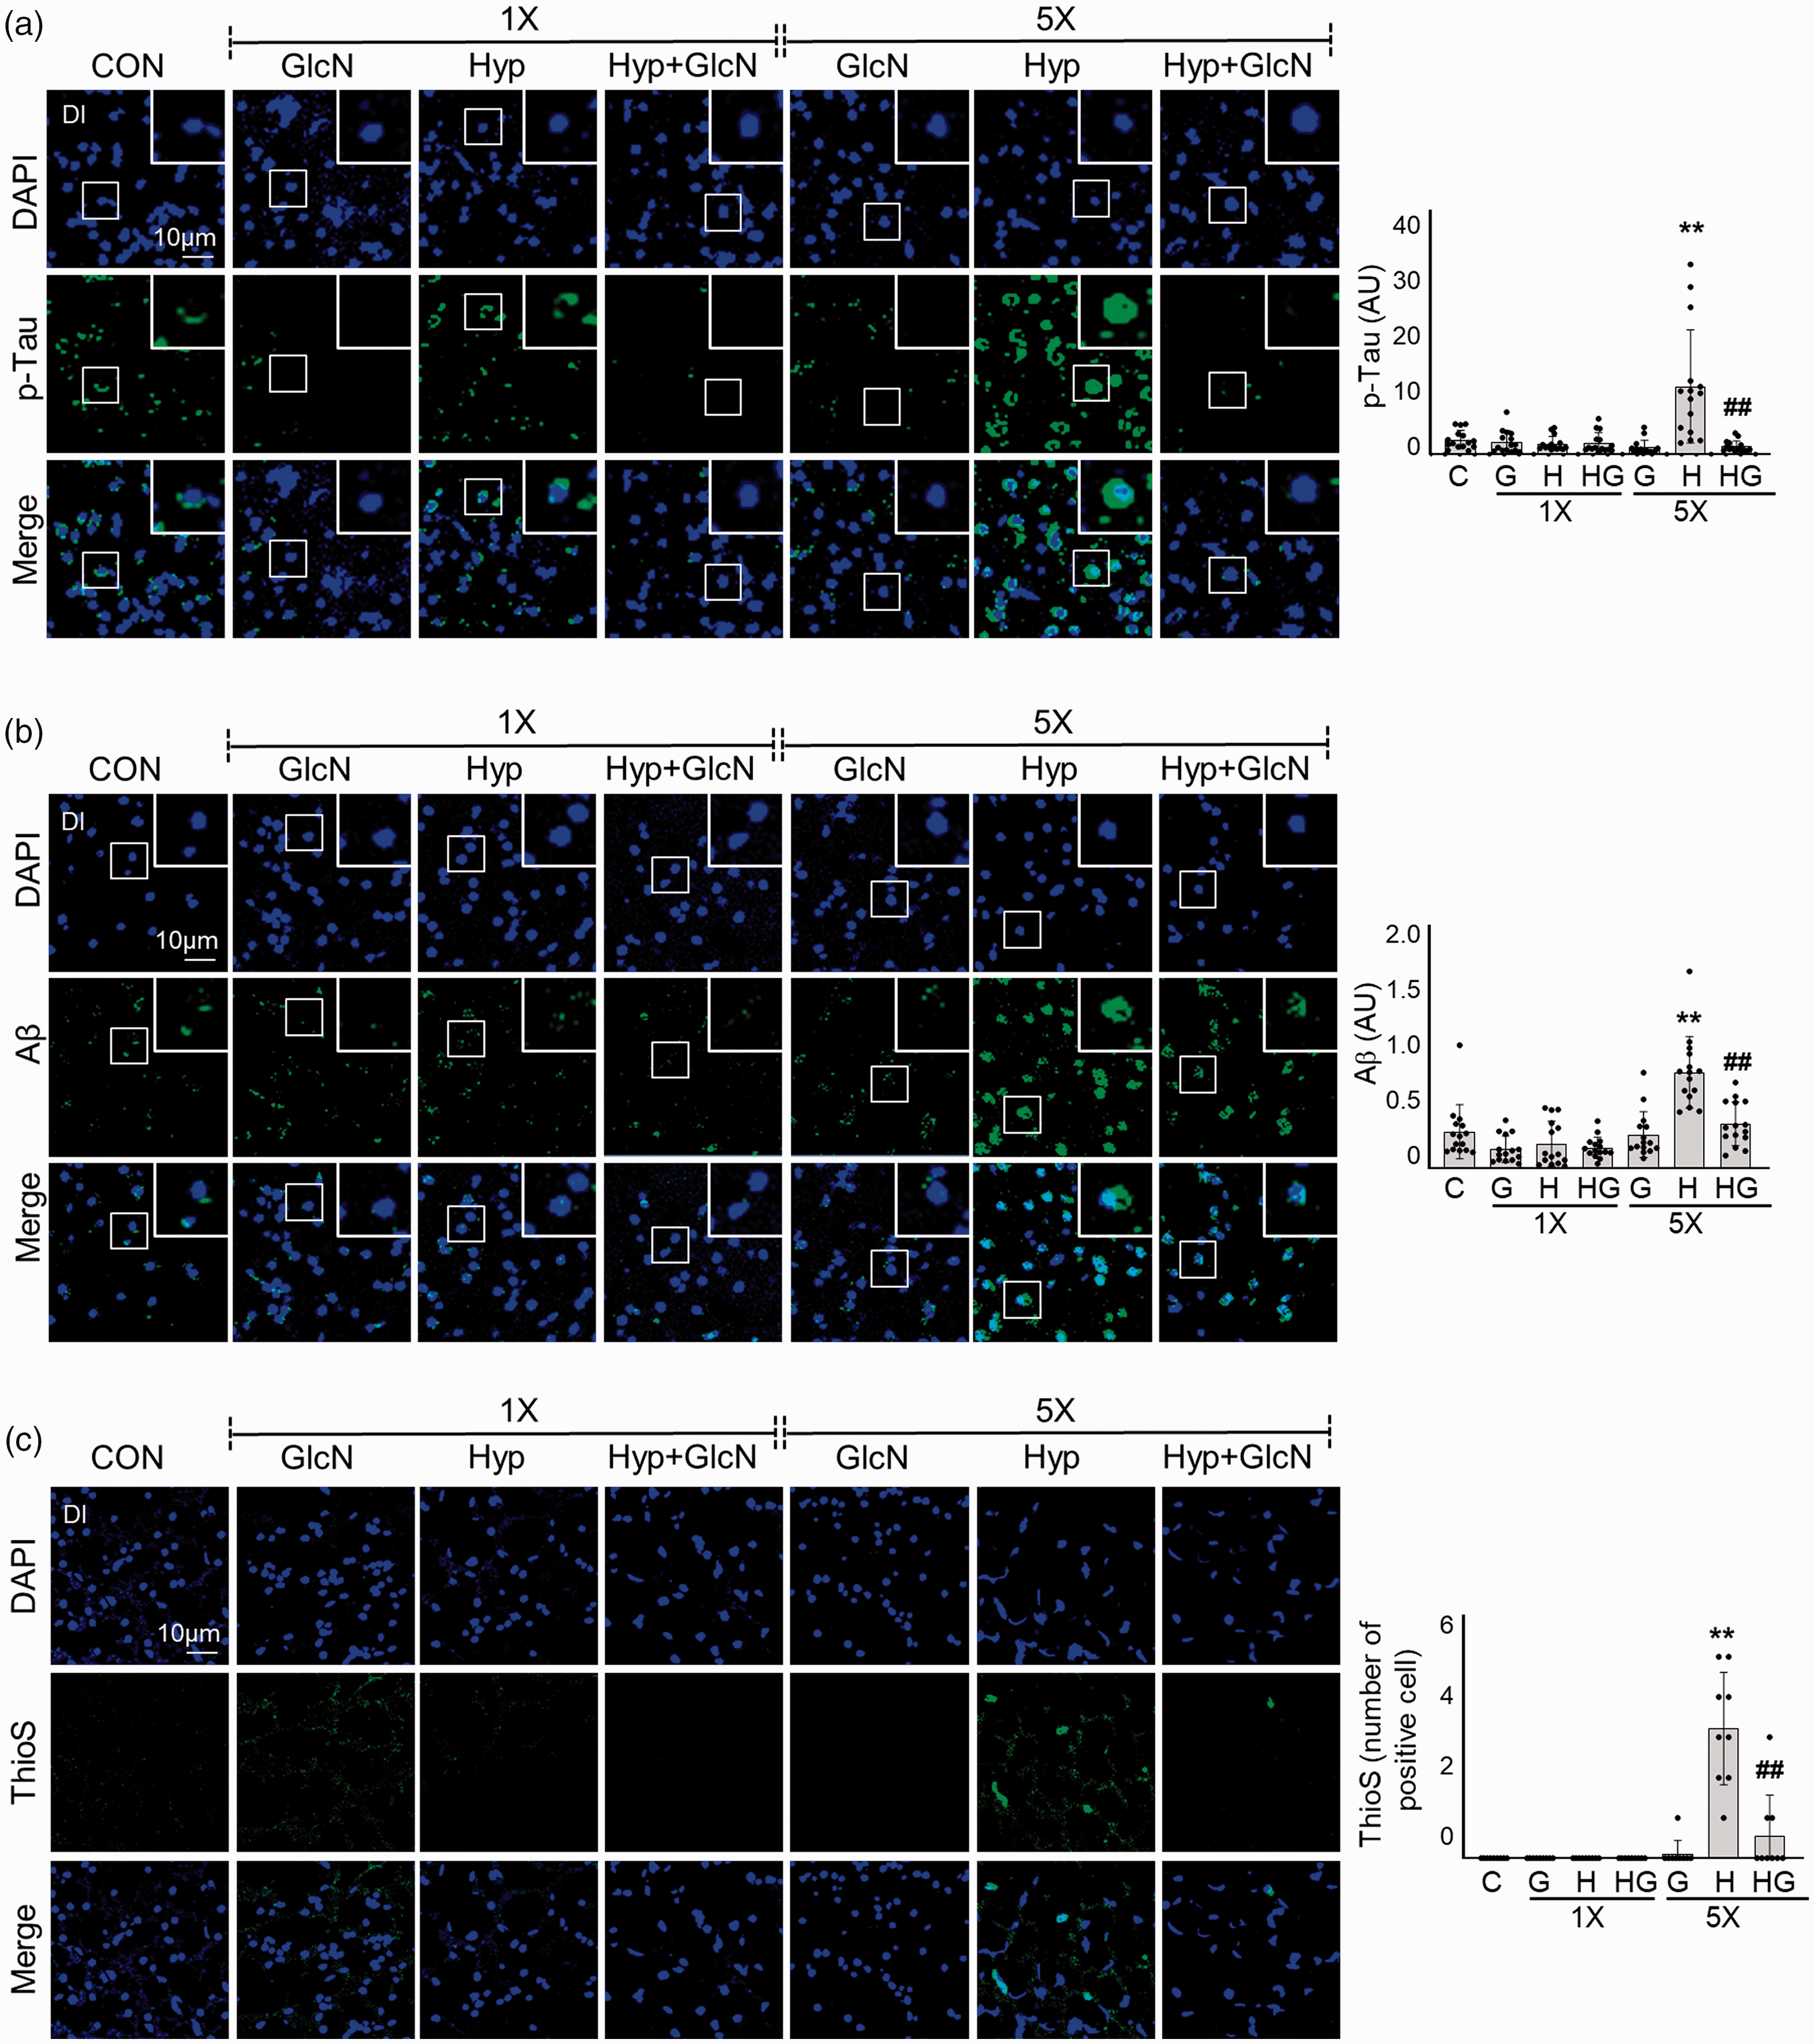
SH- or RH-induced accumulations of Aβ and p-Tau deposition and plaque formation with or without GlcN pretreatment. Zebrafish were exposed to SH (1×) or RH (5×) with or without intraperitoneal pre-injection of GlcN (200 μg/g) at 2 h prior to each bout of hypoxia. Brain sections from representative Dl regions of control, SH, and RH zebrafish were processed for immunocytochemistry using anti-p-Tau (a, green) or -Aβ (b, green) antibodies or Thioflavin S (ThioS; c, green). Nuclei were counterstained with DAPI (blue). The utilized anti-Aβ antibodies were specific for the C terminus of Aβ42. Enlarged images are presented in the white boxes. Graphs represent densitometric quantification of green images of p-Tau, Aβ, or This (n=3–5/group). Statistical analysis was carried out by Kruskal-Wallis with false discovery rate (FDR) multiple comparison test. (**p<0.01 vs. Cont, ##p<0.01 vs. SH or RH.)
Discussion
Hypoxia may have both detrimental and beneficial effects, depending on the frequency, severity, and the duration of hypoxic episodes. 32 The conventional experimental settings for applying hypoxia to animals include two major parameters: the frequency of hypoxic events and the severity of the hypoxic stimulus within each event. In a previous study, we used zebrafish to show that single exposure to global acute hypoxia induces transient dysfunction of L/M ability. 25 In the current study,we developed a sublethal but repetitive zebrafish hypoxia model to examine the long-term effects of hypoxic exposure in L/M functions and development of AD pathologies. We observed that, repeatedly (5 times) exposing zebrafish to subacute hypoxia (RH) induced irreversible cognitive deficit and the development of AD pathologies, indicating that, compared to the acute hypoxia model, this RH model offers benefits for examining chronic and long-term effects of hypoxia.
Despite long-held indications that cerebral glucose hypometabolism precedes cognitive decline or AD development, few (if any) neurochemical studies have specifically examined glucose metabolism in brain dysfunction. Our present metabolite analysis revealed that RH zebrafish, but not SH zebrafish, exhibited distinct decreases in brain glucose and downstream metabolites, including G-1-P, G-6-P, and F-6-P. RH additionally decreased the major HBP metabolite, GlcNAc-6-P, and two metabolites of the pentose phosphate pathway (PPP), ribulose 5-P and sedoheptulose 7-P. PPP activity was previously shown to be reduced after neonatal hypoxia-ischemia, and the authors suggested that decreased PPP may contribute to the increased susceptibility of the neonatal brain to oxidative stress. 33 Future studies should explore whether PPP contributes to RH-induced cognitive dysfunction, and whether replenishment of the PPP could protext against brain dysfunction after RH. In the current study, we focused more on the role of the HBP pathway in cognitive function. With regard to the mechanisms through which RH may alter glucose and its metabolites, we first questioned whether RH could decrease cerebral glucose transport. The glucose transporters GLUT1 and GLUT3 were previously reported to be decreased in AD brain, and this was found to positively correlate with decreased O-GlcNAcylation. 34 However, we did not find any significant change in the mRNA expression levels of GLUT1 or GLUT3 in zebrafish brain under SH or RH (data not shown). Indeed, another study found that hypoxia instead increases GLUT1 and GLUT3 expression to enhance neuronal tolerance. 35 Thus, it is less likely that RH decreases cerebral glucose uptake. Another potential mechanism of RH-induced glucose regulation could lie in an ability of RH to alter glucose metabolism. However, the mRNA levels of major glycolytic enzymes, including hexokinase, glucokinase, phosphofructokinase, and pyruvate kinase, were not significantly changed under SH or RH (data not shown). Thus, we do not currently know how RH regulates glucose and several of its metabolites in the zebrafish brain. Additional studies on how RH undertakes the biochemical and molecular regulation of enzymes of glucose metabolism are needed necessary to clarify how RH regulates brain glucose and its metabolites.
It is particularly noteworthy that RH decreased overall O-GlcNAcylation in the brain of zebrafish, and that this was accompanied by increased OGA levels. The link between AD and decreased O-GlcNAc flux has been described: impaired brain HBP/O-GlcNAc flux is a characteristic feature of AD brain, and inhibition of OGA to increase brain O-GlcNAcylation alleviates AD pathologies, protexts against neurodegeneration, and improves behavior.36–40 Although there are also contradictory findings demonstrating that increased O-GlcNAcylation impairs L/M ability,18,41 our previous and current work strongly support the concept that a decreased HBP/O-GlcNAc flux is detrimental to cognitive function. Those seemingly contradictory results can be reconciled by assuming that mutual regulation of OGT and OGA to maintain O-GlcNAcylation homeostasis is critical for normal brain function. If this equilibrium is tilted in either direction, normal brain function or cognition may be negatively affected. This hypothesis may be supported our unexpected observation that although GlcN and Thiamet G protexted against RH-induced L/M impairment, incubating zebrafish in high concentrations of GlcN or Thiamet G induced cognitive dysfunction and even mortality at high doses (Figure 5(d) and data not shown). This emphasizes the importance of maintaining homeostasis of the O-GlcNAc level. Therefore, our RH model has the benefit over genetic or pharmacological models, in that it enabled comparison of physiological-level brain O-GlcNAc changes during L/M functions in normal and RH-exposed zebrafish. Furthermore, the functional effects of changes in HBP flux could be monitored by assessing molecular changes related to learning process, such as the PKA/CREB signaling pathway. By using RH model, we herein provide a vital clue for the presence of positive associations between O-GlcNAcylation and PKA/CREB-regulated signaling during memory process.
Inflammation is a common consequence of a hypoxic episode, and increasing evidence indicates that post-hypoxic inflammation is responsible for exacerbating consequent brain damage. 42 The protextive effect of GlcN against RH-induced brain dysfunction is potentially associated with the regulation of brain inflammation, as indicated by the ability of GlcN to suppress astrocyte and microglia activation and brain NF-κB signaling activation induced by hypoxia. Although the underlying regulatory mechanisms are not fully understood, inflammation is known to accompanied by hypoxia and contribute to neural injury.43,44 In this study, both SH and RH induced brain inflammation to a similar degree, which were suppressed by GlcN. Although SH induced brain inflammation and mild reversible impairment of L/M function, it did not apparently decrease O-GlcNAcylation or increase OGA. This suggests that inflammation may precede alteration of the HBP/O-GlcNAc flux in this context. It is also possible that RH-induced inflammation and HBP/O-GlcNAc flux changes are independent events that individually or synergistically contribute to brain dysfunctions. Given the current controversy over whether neuroinflammation is the driving force of brain dysfunction or AD, versus it simply being a consequence of metabolic dysregulation occurring earlier in the progression of cognitive dysfunction, further research is needed to clarify the interplay between HBP/O-GlcNAc cycling and neuroinflammation in response to RH.
The present work is the first comprehensive demonstration that decreased O-GlcNAc cycling, as a combined result of OGA overexpression and decreased HBP flux, induces cognitive dysfunction after RH exposure in an adult zebrafish model. The RH-induced HBP/O-GlcNAc flux changes entail interconnected changes of glucose metabolism and neuroinflammation and might serve as an integrated mechanism for hypoxia-associated cognitive dysfunction and Alzheimer’s etiology. Our results may suggest that an evolutionarily conserved HBP/O-GlcNAc flux may be an attractive therapeutic target for hypoxia-associated neuronal dysfunction or neurodegeneration. In this context, an important avenue for future studies would be to investigate changes in profiling of O-GlcNAcylated proteins in the brain under hypoxic conditions.
Supplemental Material
sj-pdf-1-jcb-10.1177_0271678X211027381 - Supplemental material for Repeated hypoxia exposure induces cognitive dysfunction, brain inflammation, and amyloidβ/p-Tau accumulation through reduced brain O-GlcNAcylation in zebrafish
Supplemental material, sj-pdf-1-jcb-10.1177_0271678X211027381 for Repeated hypoxia exposure induces cognitive dysfunction, brain inflammation, and amyloidβ/p-Tau accumulation through reduced brain O-GlcNAcylation in zebrafish by Jiwon Park, Sunhee Jung, Sang-Min Kim, In young Park, Ngan An Bui, Geum-Sook Hwang and Inn-Oc Han in Journal of Cerebral Blood Flow & Metabolism
Footnotes
Funding
The author(s) disclosed receipt of the following financial support for the research, authorship, and/or publication of this article: This work was supported by research grants of National Research Foundation (NRF) (NRF-2020R1A2C2013345), Korea Basic Science Institute (C170200 and C180200) and Inha University of Korea.
Declaration of conflicting interests
The author(s) declared no potential conflicts of interest with respect to the research, authorship, and/or publication of this article.
Authors’ contributions
IO Han and GS Hwang designed the study and supervised the project; J Park and S Jung conducted experiments, wrote the manuscript and analyzed data; SM Kim, IY Park and NA Bui performed experiments and analyzed data. All authors reviewed the manuscript.
References
Supplementary Material
Please find the following supplemental material available below.
For Open Access articles published under a Creative Commons License, all supplemental material carries the same license as the article it is associated with.
For non-Open Access articles published, all supplemental material carries a non-exclusive license, and permission requests for re-use of supplemental material or any part of supplemental material shall be sent directly to the copyright owner as specified in the copyright notice associated with the article.