
Abstract
A valid quantitative imaging method for the measurement of amyloid deposition in humans could improve Alzheimer's disease (AD) diagnosis and antiamyloid therapy assessment. Our group developed Pittsburgh Compound-B (PIB), an amyloid-binding radiotracer, for positron emission tomography (PET). The current study was aimed to further validate PIB PET through quantitative imaging (arterial input) and inclusion of subjects with mild cognitive impairment (MCI). Pittsburgh Compound-B studies were performed in five AD, five MCI, and five control subjects and five subjects were retested within 20 days. Magnetic resonance images were acquired for partial volume correction and region-of-interest definition (e.g., posterior cingulate: PCG; cerebellum: CER). Data were analyzed using compartmental and graphical approaches. Regional distribution volume (DV) values were normalized to the reference region (CER) to yield DV ratios (DVRs). Good agreement was observed between compartmental and Logan DVR values (e.g., PCG: r = 0.89, slope = 0.91); the Logan results were less variable. Nonspecific PIB retention was similar across subjects (n = 15, Logan CER DV: 3.63 ± 0.48). Greater retention was observed in AD cortical areas, relative to controls (P < 0.05). The PIB retention in MCI subjects appeared either ‘AD-like’ or ‘control-like’. The mean test/retest variation was ~6% in primary areas-of-interest. The Logan analysis was the method-of-choice for the PIB PET data as it proved stable, valid, and promising for future larger studies and voxel-based statistical analyses. This study also showed that it is feasible to perform quantitative PIB PET imaging studies that are needed to validate simpler methods for routine use across the AD disease spectrum.
Introduction
The definitive diagnosis of Alzheimer's disease (AD) is currently based on the presence of beta-amyloid (Aβ) plaques and neurofibrillary tangles (NFTs) in the cortical brain areas at autopsy (Mirra et al, 1991). Another condition, mild cognitive impairment (MCI), is closely related to AD and characterized by either isolated memory impairment or impairment in several cognitive domains, but not of sufficient severity to meet diagnostic criteria for AD (Morris and Price, 2001; Morris et al, 2001; Petersen et al, 2001a, b). About half of MCI patients progress to AD at a rate of approximately 10%–15% per year, but approximately half do not develop AD even after follow-up periods as long as 10 years (Larrieu et al, 2002; Yesavage et al, 2002; Ganguli et al, 2004).
We and others have worked to develop in vivo amyloid-imaging agents for use with positron emission tomography (PET). This technology could allow noninvasive in vivo assessments of amyloid plaques in the brains of living humans, lead to a better understanding of amyloid deposition across the AD disease spectrum, and potentially serve as a surrogate marker of the efficacy of antiamyloid therapies (Klunk et al, 1994, 2001; Wengenack et al, 2000; Agdeppa et al, 2001; Zhuang et al, 2001).
An earlier in vivo attempt to image brain amyloid in humans with PET applied the radiotracer, [18F]FDDNP, in nine AD patients and seven controls (Shoghi-Jadid et al, 2002). At 60 to 120 mins after injection, absolute [18F]FDDNP retention in the frontal, parietal, temporal, and occipital cortical areas exceeded the reference region (pons) by 10% to 15%. Highest [18F]FDDNP retention exceeded pons by approximately 30% and was observed in the hippocampus/amygdala/entorhinal cortex area. Shoghi-Jadid et al (2002) showed significant differences in [18F]FDDNP retention between AD patients and controls as well as a significant correlation of [18F]FDDNP retention to mini-mental state examination (MMSE, Folstein et al, 1975) scores when both AD patients (MMSE 8 to 28) and controls (MMSE 28 to 30) were included in the analysis.
Our group recently reported another human amyloid-imaging study using a novel 11C-labeled PET radiotracer, [N-methyl-11C]2-(4′-methylaminophenyl)-6-hydroxy-benzothiazole. The chemical name was originally simplified to [11C]6-OH-BTA-1 (Mathis et al, 2003), but the compound has come to be more commonly known as Pittsburgh Compound-B (or PIB) (Klunk et al, 2004a). Postmortem binding assays in the frontal cortex of severe AD patients showed that PIB bound to a single high-affinity site (Kd = 1.4 nmol/L) (Mathis et al, 2003). Real-time in vivo multiphoton microscopy showed that PIB labeled individual amyloid plaques in transgenic mouse models of AD within 3 mins after intravenous injection and cleared rapidly from the normal brain parenchyma (Bacskai et al, 2003).
The first human PIB study, performed in Uppsala Sweden, included 16 mild AD patients (MMSE 18 to 28) and 9 healthy control subjects (Klunk et al, 2004a). Semiquantitative standardized uptake values (SUVs) showed a robust difference in the level and pattern of PIB retention in AD patients relative to controls in areas of the brain known to contain amyloid in AD. Pittsburgh Compound-B retention was increased most prominently in AD frontal cortex (> 2-fold, P < 0.0001), while retention was equivalent in AD and control subjects in areas known to be relatively unaffected by amyloid deposition (subcortical white matter, pons, and cerebellum; P > 0.2). Pittsburgh Compound-B retention correlated inversely with cerebral glucose metabolism determined with FDG in the parietal cortex. However, limitations of these initial PIB studies included only 60 mins of PET imaging and no magnetic resonance (MR) imaging or arterial blood sampling that would be required to perform fully quantitative PIB analyses. Similarly, Verhoeff et al (2004) studied five AD subjects and six controls in a comparative study of PIB and a new PET amyloid tracer (SB-13) based on 120 mins of PET data with venous blood (collected over 70 mins) or cerebellar data as input and no MR imaging. The authors found that both radiotracers localized in AD brain in a manner similar to that reported by Klunk et al (2004a), although SB-13 retention did not distinguish AD patients and controls as distinctly as PIB.
This report presents results of new PIB PET studies conducted at the University of Pittsburgh that extend the initial proof-of-concept studies to include in vitro analyses of binding kinetics, fully quantitative imaging and subjects with a diagnosis of MCI. This work was performed to further validate the utility of the PIB PET methodology across the AD disease spectrum. The Pittsburgh PIB data were evaluated using compartmental modeling and graphical analyses of fully dynamic data (e.g., arterial plasma and PET data) over 90 mins. An overall goal was to determine an appropriate quantitative methodology for this novel amyloid-imaging PET radiotracer.
Materials and methods
In Vitro Binding Kinetics
The in vitro binding kinetics were examined to evaluate the reversibility of PIB binding to AD brain tissue. Postmortem brain tissue was obtained and binding studies were performed as previously described (Klunk et al, 2003) with detailed modifications given below. For the determination of the off-rate (koff), 1.2 nmol/L [3H]PIB (61 Ci/mmol; custom synthesized by American Radiolabeled Chemicals, St Louis, MO, USA) was incubated with 100 μg of tissue in 0.5 mL of phosphate buffered saline (PBS) (pH 7.0) for 60 mins to reach binding equilibrium. Pittsburgh Compound-B dissociation was initiated by the addition of 5 mL of PBS containing 1 μmol/L unlabeled PIB (to block rebinding). Dissociation of PIB was stopped at various times from 2 mins to 4 h by filtration through a Whatman GF/B glass filter via a Brandel M-24R cell harvester (Gaithersburg, MD, USA) followed by rapid washing with 3 mL PBS. The filters were counted in Cytoscint-ES after thorough vortexing and sitting overnight. Background binding was determined in the presence of 1 μmol/L unlabeled PIB from the beginning of the experiment. All assays were performed at room temperature (~21°C) in triplicate and koff was determined, as described by Bylund and Yamamura (1990), based on an exponential fit to the curve of [3H]PIB bound versus time.
Human Subjects
All subjects were recruited after evaluation at the University of Pittsburgh Alzheimer's Disease Research Center (ADRC). Participants received an extensive neuropsychiatrie evaluation that included a medical history and physical exam, neurologic history and exam, semistructured psychiatric interview and neuropsychological assessment (Lopez et al, 2000). All AD patients met NINDS-ADRDA criteria for Probable AD and DSM-IV criteria for Dementia of the Alzheimer's Type (McKhann et al, 1984; DSM-IV 1995) and scored between 18 and 26 on the MMSE. The diagnosis of Probable AD was determined by consensus at a conference attended by clinical staff, neurologists, psychiatrists, and neuropsychologists. The MCI patients received the diagnosis of MCI-amnestic (single cognitive domain; n = 3: MCI-1, 3, and 5) or MCI-other (amnestic plus other cognitive domains; n = 2: MCI-2 and 4) at an ADRC consensus conference (Petersen et al, 2001b). Controls underwent full ADRC evaluation and scored normally on the evaluations. No exclusion was made for treatment with anticholinesterase drugs as this was not a factor in the proof-of-concept PIB studies (Klunk et al, 2004a). All subjects or their proxy provided IRB-approved informed consent for both the ADRC protocol and the PIB imaging protocol.
Radiochemical Synthesis
The radiosynthesis of PIB was initially performed (n = 7) as previously described (Mathis et al, 2003). More recently, a simplified radiosynthetic method was instituted based on the captive solvent method of Wilson and co-workers (Wilson et al, 2000; Ono et al, 2003) and used an unprotected precursor, high specific activity [11C]methyl triflate (> 3 Ci/ μmol), and neutral reaction conditions. Briefly, [11C]methyl triflate was synthesized (Jewett, 1992) and delivered in a nitrogen gas stream to a stainless-steel reaction loop at room temperature that contained 2-(4′-aminophenyl)-6-hydroxy-benzothiazole (1.5 mg) dissolved in methyl ethyl ketone (100 μL). When the loop radioactivity plateaued, the flow was halted, and the loop was maintained at room temperature for 5 mins. The contents of the loop were separated using a Prodigy ODS-Prep C18 HPLC column (Phenomenex Inc., Torrence, CA, USA) eluted with 30/70 acetonitrile/50 mmol/L triethylammonium phosphate buffer (pH 7.2) at a flow rate of 15 mL/min. The fraction containing PIB (~ 15 mins) was diluted with 50 mL of water and eluted through a Waters C18 SepPak Plus cartridge. The SepPak was washed with 10 mL of water, and PIB was eluted from the SepPak through a sterile Millipore FG filter (0.22 μm, 25 mm) with 1 mL of ethanol (absolute) into a sterile vial followed by 14 mL of normal saline. Radiochemical and chemical purities were > 95% as determined by analytical HPLC (k′ = 7.2) using a Prodigy ODS-3 C18 column eluted with 35/65 acetonitrile/50 mmol/L triethylammonium phosphate buffer (pH 7.2). The radiochemical yield averaged 25% ± 10% at end of synthesis (EOS) based on [11C]methyl iodide, and the specific activity was 4.5 ± 2.1 Ci/μmol at EOS.
Magnetic Resonance and Positron Emission Tomography Imaging
Magnetic resonance imaging was performed using a 1.5 T GE Signa scanner (University of Pittsburgh MR Research Center). Subjects were positioned in a standard head coil and a brief scout T1-weighted image was obtained. A volumetric spoiled gradient recalled (SPGR) sequence with parameters optimized for contrast among gray matter, white matter, and CSF were acquired in the coronal plane (TE/TR = 5/25, flip angle = 40°, NEX = 1, slice thickness = 1.5 mm/0 mm interslice).
The PET data were acquired on a Siemens/CTI ECAT HR + scanner in 3D imaging mode (63 parallel planes); axial field-of-view (FOV): 15.2 cm; in-plane resolution: 4.1 mm full-width at half-maximum (FWHM); slice width: 2.4 mm). The scanner was equipped with a Neuro-insert (CTI PET Systems, Knoxville, TN, USA) to reduce the contribution of scattered photons (Weinhard, 1998). Data were reconstructed using filtered back-projection (Fourier rebinning/2D backprojection, 3 mm Hann filter) and corrected for photon attenuation (68Ge/68Ga rods), scatter (Watson, 2000), and radioactive decay. The final reconstructed image resolution was approximately 6 mm FWHM (transverse and axial, data not shown).
Before PET imaging, an intravenous catheter was placed in an antecubital vein for radiotracer injection and a short catheter was inserted into a radial artery for dynamic arterial blood sampling. The subject was fitted with a thermoplastic mask that was mounted to the scanner table to minimize head motion. The subject was positioned in the scanner (quiet, dimly-lit room) with imaging planes parallel to the cantho-meatal line and primary areas-of-interest (including cerebellum) within the central 7 cm of the FOV, for which the 3D sensitivity of the tomograph is most uniform (Townsend et al, 1998). The transmission scan was followed by a 90 mins dynamic high specific activity PIB PET study (~ 1,000 mCi/μmol, 10 to 15 mCi injection over 20 sec, 34 frames: 4 × 15, 8 × 30, 9 × 60, 2 × 180, 8 × 300, 3 × 600 secs).
Arterial Input Function
Thirty-five hand-drawn samples (0.5 mL) were collected over 90 mins with 20 samples over the first 2 mins. Additional samples (2 to 3 mL) were collected at 5 to 6 times for the determination of radiolabeled metabolites (radiometabolites). The metabolite analyses underwent refinement as described below. The unmetabolized fractions were used to determine the metabolite-corrected arterial input function (Cp), as previously described (Price et al, 2001).
HPLC methods: Heparinized arterial blood (2.5 mL) was centrifuged for 2 mins at 12,900g. The resulting plasma supernatant (500 to 1,000 μL) was added to an equivalent volume of acetonitrile. This mixture was vortexed for 2 mins and centrifuged for 2 mins at 12,900g. The supernatant was injected onto the HPLC system (Waters Corp.) operated at a flow rate of 2 mL/min. Initially, a Prodigy ODS-Prep C18 analytical column was eluted with a mixture of 35/65 acetonitrile/aqueous buffer (50 mmol/L triethylammonium phosphate, pH 7.2) (k′ of PIB = 7.2). After the first 7 subjects were completed, the eluant was changed to 45% acetonitrile to elute PIB and its metabolites more quickly (k′ of PIB = 2.8). An in-line radio-HPLC detector (Raytest Corp., GABI system) was used to quantitate radiolabeled peaks.
Extraction method
As a result of the low level of unmetabolized PIB at ≥ 60 mins, a more sensitive liquid-liquid extraction method (Extraction method) was applied (n = 7). Heparinized arterial blood (2.5 mL) was centrifuged for 2 mins at 12,900g. The plasma supernatant (900 μL) was added to a mixture containing nonradioactive PIB carrier solution (300 μL, 3.2 μg/mL), pH 4.2 ammonium formate buffer (1,200 μL, 0.5 mol/L), and isopropyl ether (2,400 μL). The mixture was vortexed for 2 mins, hand shaken for 20 secs, and centrifuged for 2 mins at 12,500g. Portions (1,200 μL) of the organic and aqueous phases were counted in a gamma counter (Packard Biosciences, Inc. model 5003).
Image Alignment and Regions-of-Interest
The SPGR MR data were used for image registration and for partial volume correction of the PET data. The MR-PET image alignment was performed using automated methods (Minoshima et al, 1992; Woods et al, 1993; Meltzer et al, 2004). Data were inspected for subject motion and interframe motion was corrected using a more extensive registration procedure on a frame-by-frame basis.
After MR-PET coregistration, regions-of-interest (ROIs) were defined on the MR images and transferred to the PET data for sampling over single and multiple transverse planes (Figure 1). Regions-of-interest were drawn to sample brain areas in the same manner as that previously applied in studies of glucose metabolism, blood flow, and neuroreceptor binding. The ROIs included cerebellum (CER), subcortical white matter (SWM) pons (PON), caudate (CAU), and sensory motor (SMC), frontal (FRT), posterior cingulate (PCG), lateral-temporal (LTC), mesial-temporal (MTC), parietal (PAR), and occipital (OCC) cortices. The MTC region included amygdala, hippocampus, entorhinal cortex, and other portions of the para-hippocampal gyrus. The ROI generation was performed by WEK and JAH, using common anatomic criteria and ROI shapes, to ensure high rater-reliability (intraclass correlation coefficient (ICC) > 0.9 for PCG). Region-of-interest sampling was performed using a modified version of ROItool (CTI PET Systems, Knoxville, TN, USA) (modifications/validations by PET Facility staff).
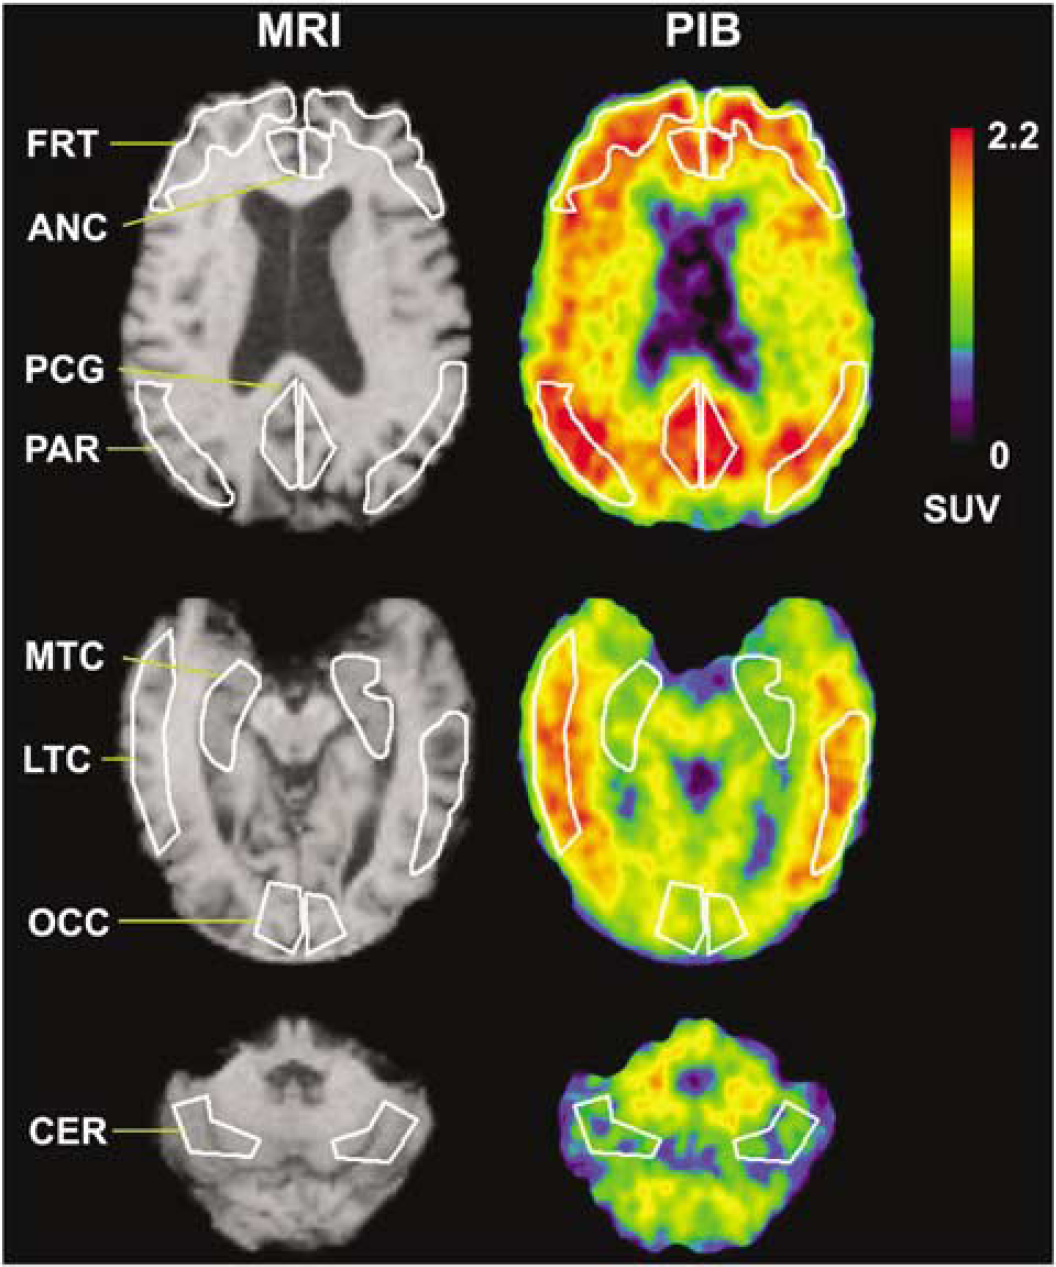
Examples of anatomical SPGR magnetic resonance (MR) images (left) and Pittsburgh Compound-B (PIB) positron emission tomography (PET) SUV images of amyloid binding (right) with example regions-of-interest (ROIs). The images were acquired for a 77-year-old male AD subject (AD-3) with moderate levels of PIB retention. Shown in white are examples of ROIs examined in this study (see Materials and methods): FRT: frontal, PCG: posterior cingulate gyrus, PAR: parietal, MTC: mesial temporal, LTC: lateral temporal, OCC: occipital and CER: cerebellum (reference region). The SUV images were summed over 40 to 60 mins after injection and normalized to injected dose and body mass.
The MR-based partial volume correction, or CSF correction, corresponded to a two-component approach that corrected the PET binding measures for the dilutional effect of expanded CSF spaces accompanying normal aging and disease-related cerebral atrophy (Meltzer et al, 1999).
Data Analysis
Tissue data: Regions-of-interest were applied to the dynamic PET data to obtain regional time-activity data (μCi/mL) based on a calibrated phantom standard. Tissue: plasma ratios also were generated by normalizing the regional PET data to the plasma data. The simplest assessment of PIB retention was performed using the purely data-driven SUV method that was determined by normalizing summed tissue radioactivity concentration (40 to 60 mins after injection) to injected dose and body mass (unitless measure, assuming 1 g/cm3 tissue density). The 40 to 60 mins interval was chosen to be consistent with previous proof-of-concept 60 mins PIB studies (Klunk et al, 2004a).
Spectral analysis: The kinetic components of PIB tissue uptake were examined using spectral analysis, a data-driven method that is not based on a specific underlying model configuration, as previously described in PET studies of neuroreceptor-binding and glucose metabolism (Cunningham and Jones 1993; Turkheimer et al, 1994; Meikle et al, 1998; Bertoldo et al, 1998). In this work, the method was used purely as an exploratory tool and not for quantification of PIB retention.
For spectral analysis, the response of the tissue to the input function (impulse response function, IRF) is described as a linear combination of exponential terms of amplitude α (mL/min mL) and exponential coefficient β (min−1). The tissue concentration is the convolution of the input function (Cp) and the impulse response function (sum of exponentials):
Compartmental Modeling: The most comprehensive model that was applied to the PIB data was a 3-tissue 6-parameter (3T-6k) configuration (see Koeppe et al, 1994):
for which CF, CNS, and CS, respectively, correspond to the free (F), nonspecifically (NS) bound, and specifically (S) bound radiotracer in brain. Parameters K1 (mL/min mL) and k2 (min−1) represent the bidirectional transport of radiotracer across the blood—brain barrier. The specific binding parameters, k3 and k4, respectively, reflect the bimolecular association rate (konBmax, min−1) and unimolecular dissociation rate (koff, min−1) of binding. The k3/k4 ratio is Bmax/Kd, where Bmax is the concentration of binding sites and Kd is the equilibrium dissociation rate constant. The association and dissociation parameters of nonspecific binding correspond to k5 (min−1) and k6 (min−1), respectively.
Analyses included reduced configurations of the 3T-6k model. For specific binding areas, a 2-tissue compartment 4-parameter (2T-4k) model was applied assuming that free and nonspecific tracer kinetics were indistinguishable, leaving only CF + NS and CS. In this case, K3 = konf2Bmax, where f2 is the free fraction of radiotracer in tissue. A 3-parameter 2-tissue model (2T-3k), consistent with irreversible binding (k4 = 0), was also applied. Nonspecific PIB retention was assessed in the cerebellum, the reference (REF) region, for which it was assumed that the concentration of free and nonspecifically bound radiotracer is representative of other regions and specific binding was negligible. The cerebellum was chosen as the PIB reference region because: (1) it has very low levels of fibrillar amyloid; (2) similarly low levels of binding of a PIB derivative ([3H]BTA-1) were observed in post-mortem binding assays of cerebellar samples of control, severe AD, and non-AD demented subjects (e.g., fronto-temporal dementia); and (3) similar in vivo PIB retention was measured in the cerebellum of controls and AD subjects in proof-of-concept PIB PET studies (Klunk et al, 2003, 2004a).
For high specific activity studies, specific binding is generally assessed using the radiotracer distribution volume (DV, mL/mL) and binding potential (BP, unitless), as both are related to Bmax and Kd. In this work, the 2T-4k model was the primary configuration used for all regions. The 2T-4k outcomes were computed as: DV = K1/k2(1 + k3/k4) and BP =(DVROI/DVREF)-1 = (Bmax/Kd)f2 (see Lammertsma et al, 1996). The DVROI/DVREF term is the distribution volume ratio (DVR) that is the regional DV value (DVROI) normalized by the nonspecific retention in the reference region (DVREF). The primary measure of PIB retention used in this work was DVR, where DVR = BP + 1. For nonspecific cerebellar data, a 2T-4k model (CF and CNS) and a 1-tissue 2-parameter (1T-2k) model (CF + NS only) were applied for which the respective nonspecific outcome measures were: 2T-4k DV = K1/k2(1 + k5/k6) and 1T-2k DV = K1/k2.
The kinetic parameters and standard errors were estimated via iterative curve fitting (see Price et al, 2001). Model fits were performed with a vascular volume term fixed to 0.05, with no positivity constraints. The performance of different configurations was assessed using the Akaike information criteria (AIC). The AIC is a goodness-of-fit parameter that is based on the residual sum-of-squares (SSQ) and the number of data points (n) and fit parameters (k): AIC = n ln(SSQ) + 2k (Akaike, 1974; Turkheimer et al, 2003). The lowest AIC indicates the best model fit with the fewest parameters. The AIC results were expressed in relative terms as percentages (AIC%). The AIC% for the best model reflects how much lower its AIC value was relative to the AIC value of the comparison model.
Graphical analyses: Two regression methods, which are appropriate for reversible in vivo kinetics, were applied to the cerebellar reference data. These graphical methods essentially describe the radiotracer kinetics in brain and plasma such that a linear relationship exists after tissue:plasma steady state is established. The Logan graphical (Logan et al, 1990) and Ichise MA1 (Ichise et al, 2002) analyses were applied over the 35 to 90 mins PET scan interval. Linear regression of the Logan variables yields slope values that are equivalent to the total radiotracer DV. Bilinear regression of the multilinear analysis-1 (MA1) variables yields two parameters; the ratio of these provides a measure of DV. The MA1 analysis has been proposed as one that is less sensitive, than the basic Logan method, to noise-induced bias in the outcome measures (Ichise et al, 2002). The performance of these analyses was assessed based on the magnitude of the linear regression correlation coefficient (r2) that reflects the extent to which the data were consistent with basic assumptions.
Statistics: Descriptive statistics included the coefficient of variation (CV% = (SD/mean)100) and correlation coefficient (r or r2). Group differences were examined using a nonparametric Wilcoxon signed rank test (one-sided, P < 0.05, exact inference) (Hollander and Wolfe, 1973). The P-values for group differences were corrected for multiple comparisons using a false discovery rate (FDR) correction (Storey, 2002). These statistical methods were applied because the assumption of normality is not required and this assumption is most likely invalid for our small samples. The Wilcoxon test minimizes the influence of outliers as it is based on rank order in the comparison groups (rather than magnitude of mean differences), this results in a minimum possible P-value or ‘floor effect’ for this data set, and yields conservative P-values that can be several-fold greater than those that would be obtained using a parametric Student's t-test. As a result, P-values for group differences will be reported relative to a single corrected P-value threshold of 0.05. The P-values reported for the correlation coefficient correspond to the Pearson's product-moment correlation. Intra-subject test/retest variability was assessed relative to the test outcome and computed as the absolute value of the percent difference between retest (R) and test (T) DVR values: Test/Retest (%) = Absolute{[(R–T)/T]100}. It is noted that this intrasubject variability measure will yield lower values for DVR than those that would be determined for BP because the denominator differs by a constant (BP = DVR–1) and for controls the test BP value approaches zero. However, no differences will arise in the statistical determination of significant group differences as DVR and BP yield identical effect sizes and significance levels. Although limited by sample size, a correlational measure of test-retest reproducibility, the intraclass correlation coefficient (ICC, Shrout and Fleiss, 1979) was also applied. The ICC has a maximum value of 1 and a lower limit of 0 for the present data; its range reflects levels of agreement: (0 to 0.1) virtually none; (0.1 to 0.4) slight; (0.41 to 0.6) fair; (0.61 to 0.8) moderate; and (0.81 to 1.0) substantial (Shrout, 1998).
Results
In Vitro Binding Kinetics
The specific binding of [3H]PIB to the human AD brain homogenate was clearly reversible with kinetics similar to those of typical neurotransmitter ligands (Bylund and Yamamura, 1990). The koff was determined to be 0.0027 min−1 (i.e., off-rate tL/2 = 252 mins) by an exponential curve fit: y = 0.1742e−0.0027x, r2 = 0.97.
Human Subjects
Table 1 lists subject characteristics. Of the five MCI subjects, MCI-2 and MCI-5 had been cognitively stable while the others had slow, mild but progressive cognitive decline. Five subjects were retested between 8 and 20 days of the baseline PIB study (Table 1).
Subject characteristics
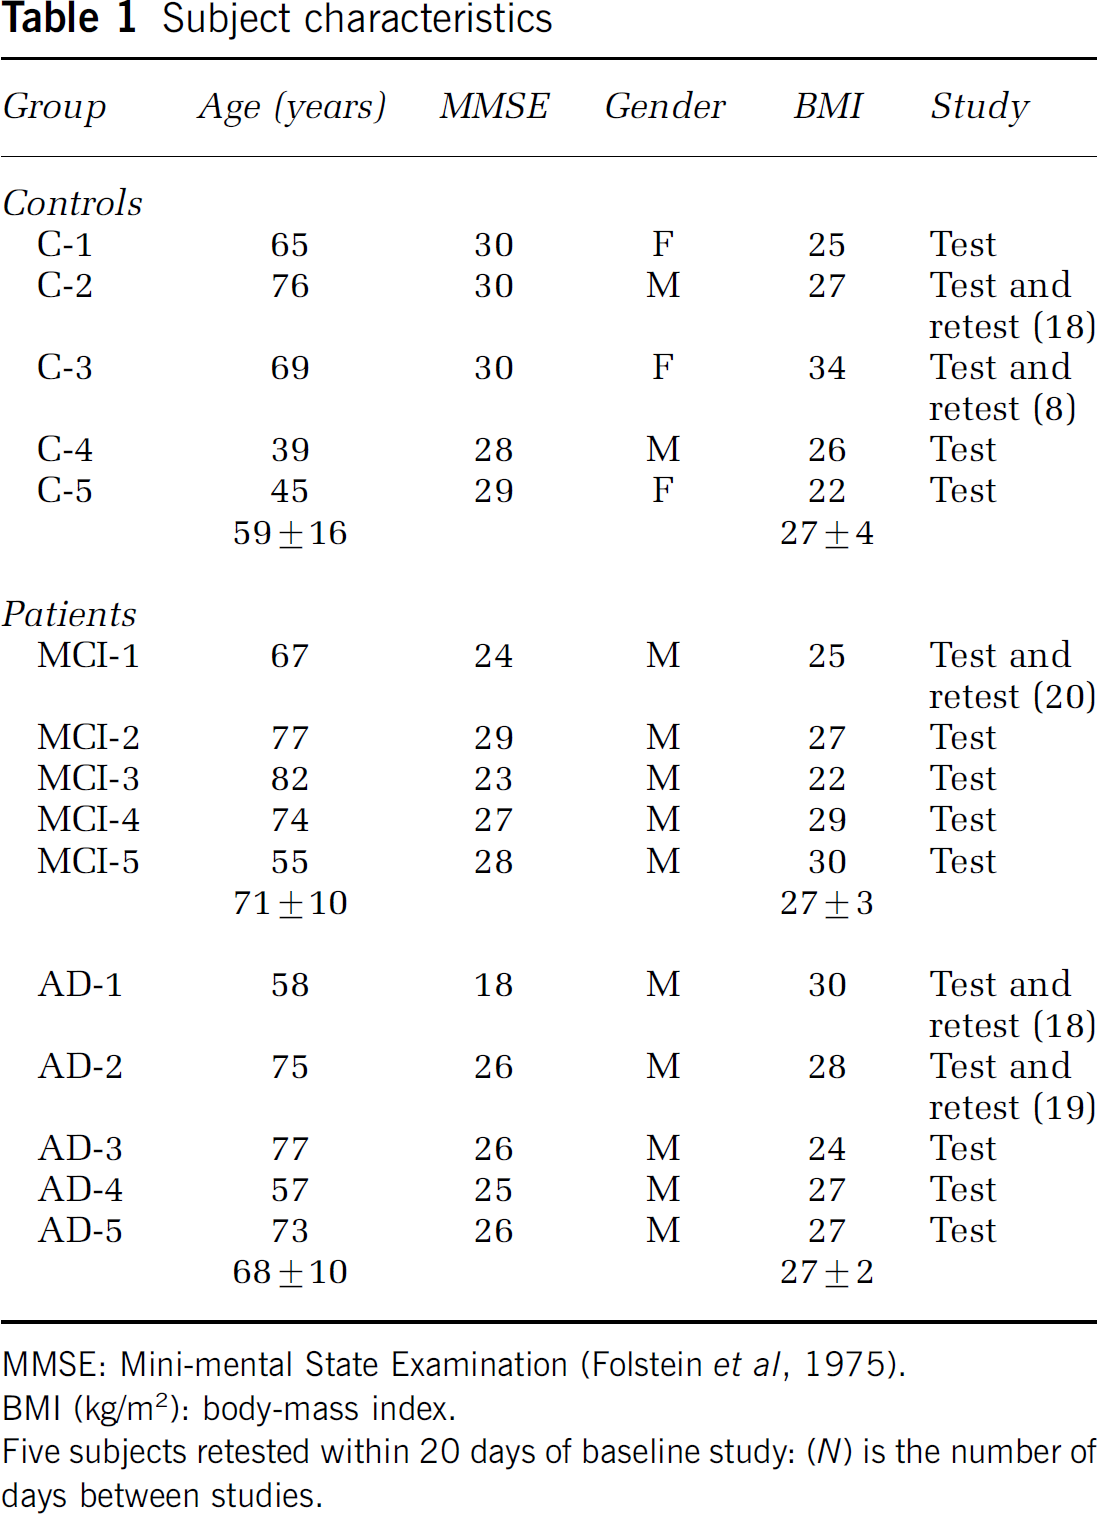
MMSE: Mini-mental State Examination (Folstein et ai, 1975).
BMI (kg/m2): body-mass index.
Five subjects retested within 20 days of baseline study: (N) is the number of days between studies.
Magnetic Resonance and Positron Emission Tomography Imaging
Table 2 lists regional CSF correction factors that were computed based on each subject's SPGR MR data. Lower CSF factors (greater corrections) were evident for cortical areas that are more susceptible to partial volume averaging between brain and CSF, relative to areas such as pons and cerebellum. No group differences were evident in the CSF factors. All DV and DVR measures were CSF corrected, while individual compartmental parameters or ratios were not (e.g, K1 or k3/k4).
CSF correction factors
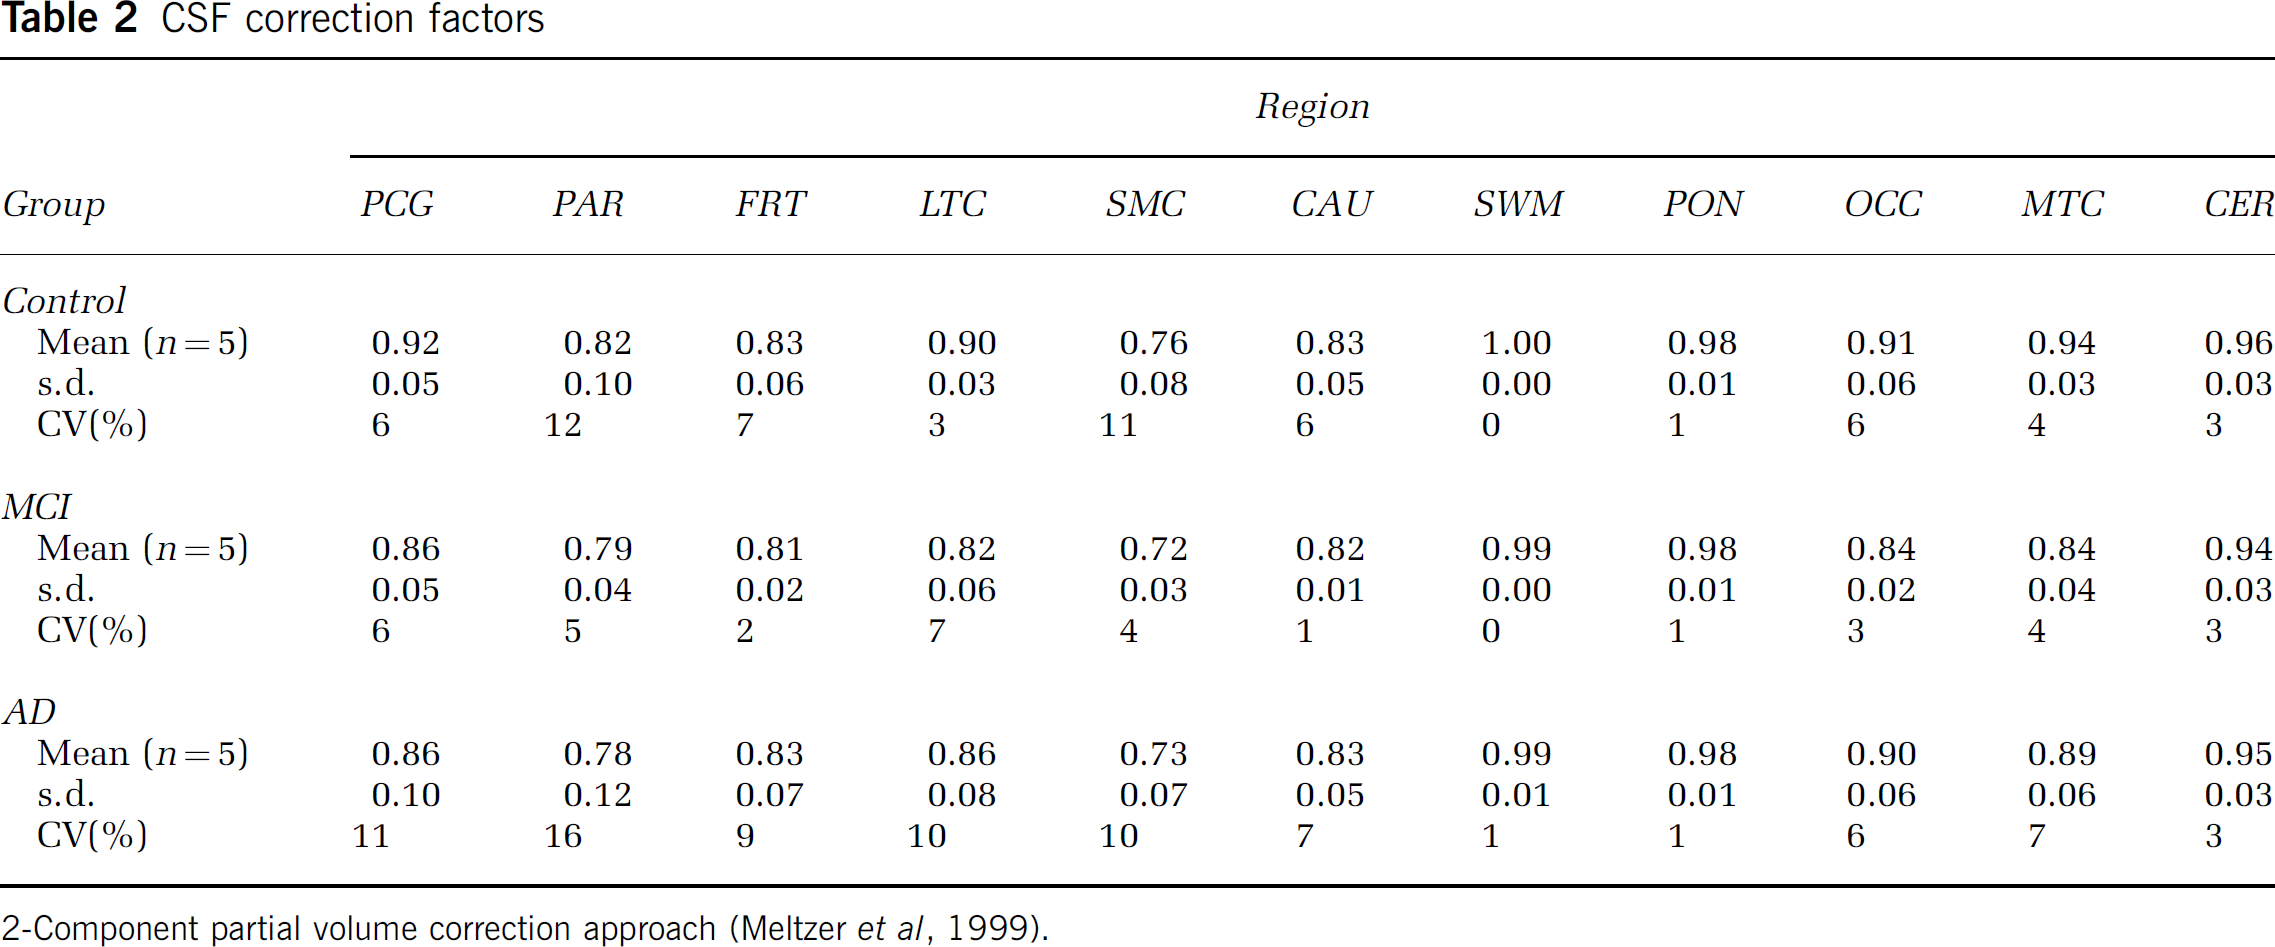
2-Component partial volume correction approach (Meltzer et al, 1999).
Pittsburgh Compound-B PET studies were performed in healthy controls (11.8 ± 2.1 mCi; 1,214 ± 716 mCi/μmol), MCI patients (12.8 ± 2.5 mCi; 817 ±310 mCi/μamol), and AD patients (13.7 ± 2.9 mCi; 1,007 ± 832 mCi/μmol).
Arterial Input Function
Arterial blood sampling was performed in all subjects. The rapid peripheral metabolism of PIB resulted in poor statistical blood data at later times (≥ 60 mins), and the metabolite analysis was refined over the course of the studies (see Materials and methods). The initial HPLC method (35% acetonitrile) was performed in seven subjects. This method performed well at early times, but did not prove reliable after 30 mins (Figure 2A). The HPLC method was refined (45% acetonitrile; see Materials and methods), but determination of later time values remained problematic. The injected PIB dose was increased from 10 mCi (n = 7) to 15 mCi (n = 8) and the extraction method also was applied. For 7 subsequent studies, both the refined HPLC and extraction assays were performed and a 75-min sample was added.
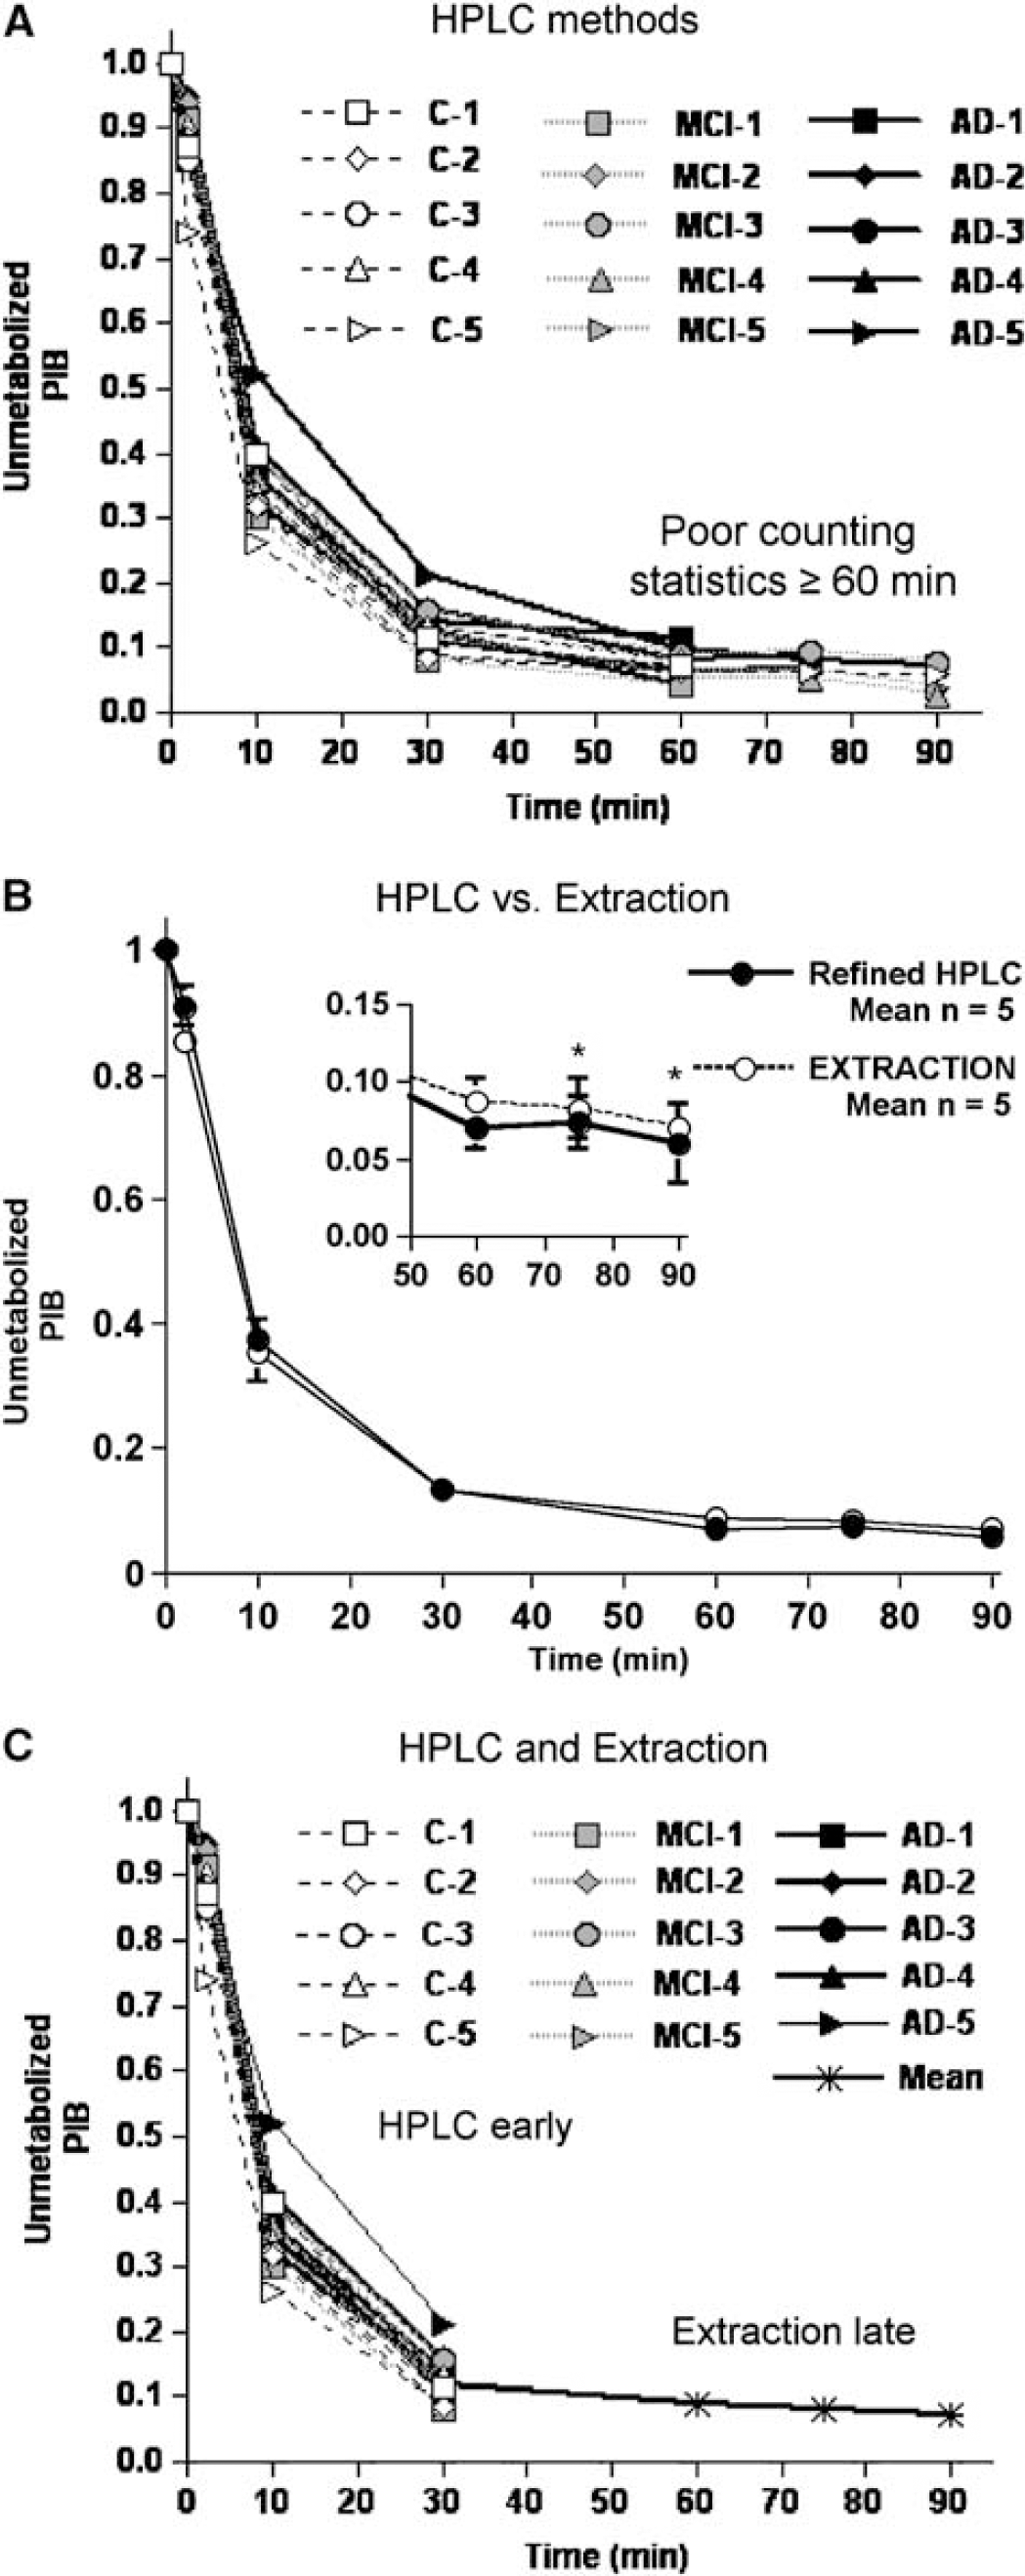
The fraction of un metabolized Pittsburgh Compound-B (PIB) in plasma was measured using H PLC and extraction methods. An initial HPLC method (
HPLC analysis provided a more accurate and less variable measure of the unmetabolized fraction of PIB at early time points, as the extraction efficiency of PIB in the organic phase was ca.95%. At later time points (60 to 90 mins), the amount of unmetabolized PIB in plasma was small, and HPLC analysis with online radioactivity measurements was not sufficiently sensitive to accurately quantify these low levels. Because of the ability to assay larger volumes of plasma and to use a more sensitive gamma well counter, the extraction method proved to be significantly more sensitive than the HPLC method from 60 to 90mins. The refined HPLC conditions provided better determination of the radiolabeled metabolites at early times (≤ 30 mins), while the extraction method was better for later times (≥ 60 mins, Figure 2B). An average extraction curve was then computed based on data from the first five subjects for which this method was performed (i.e., MCI−3, −4, −5 and AD-3 and −4).
To consistently analyze all PIB studies, a continuous time course of unmetabolized PIB in plasma was generated by fitting a curve to the unchanged PIB data constructed for each of the 15 subjects from a combination of each individual's early HPLC data (2, 10, and 30 mins) and the late extraction averages (60, 75, and 90 mins) (Figure 2C). The late extraction averages (0.09 ± 0.02, 0.08 ± 0.02, and 0.07 ± 0.01 at 60, 75, and 90 mins, respectively) compared well with individual values measured in subsequent subjects (e.g., C-5: 0.07, 0.07, and 0.06 at 60, 75, and 90 mins, respectively).
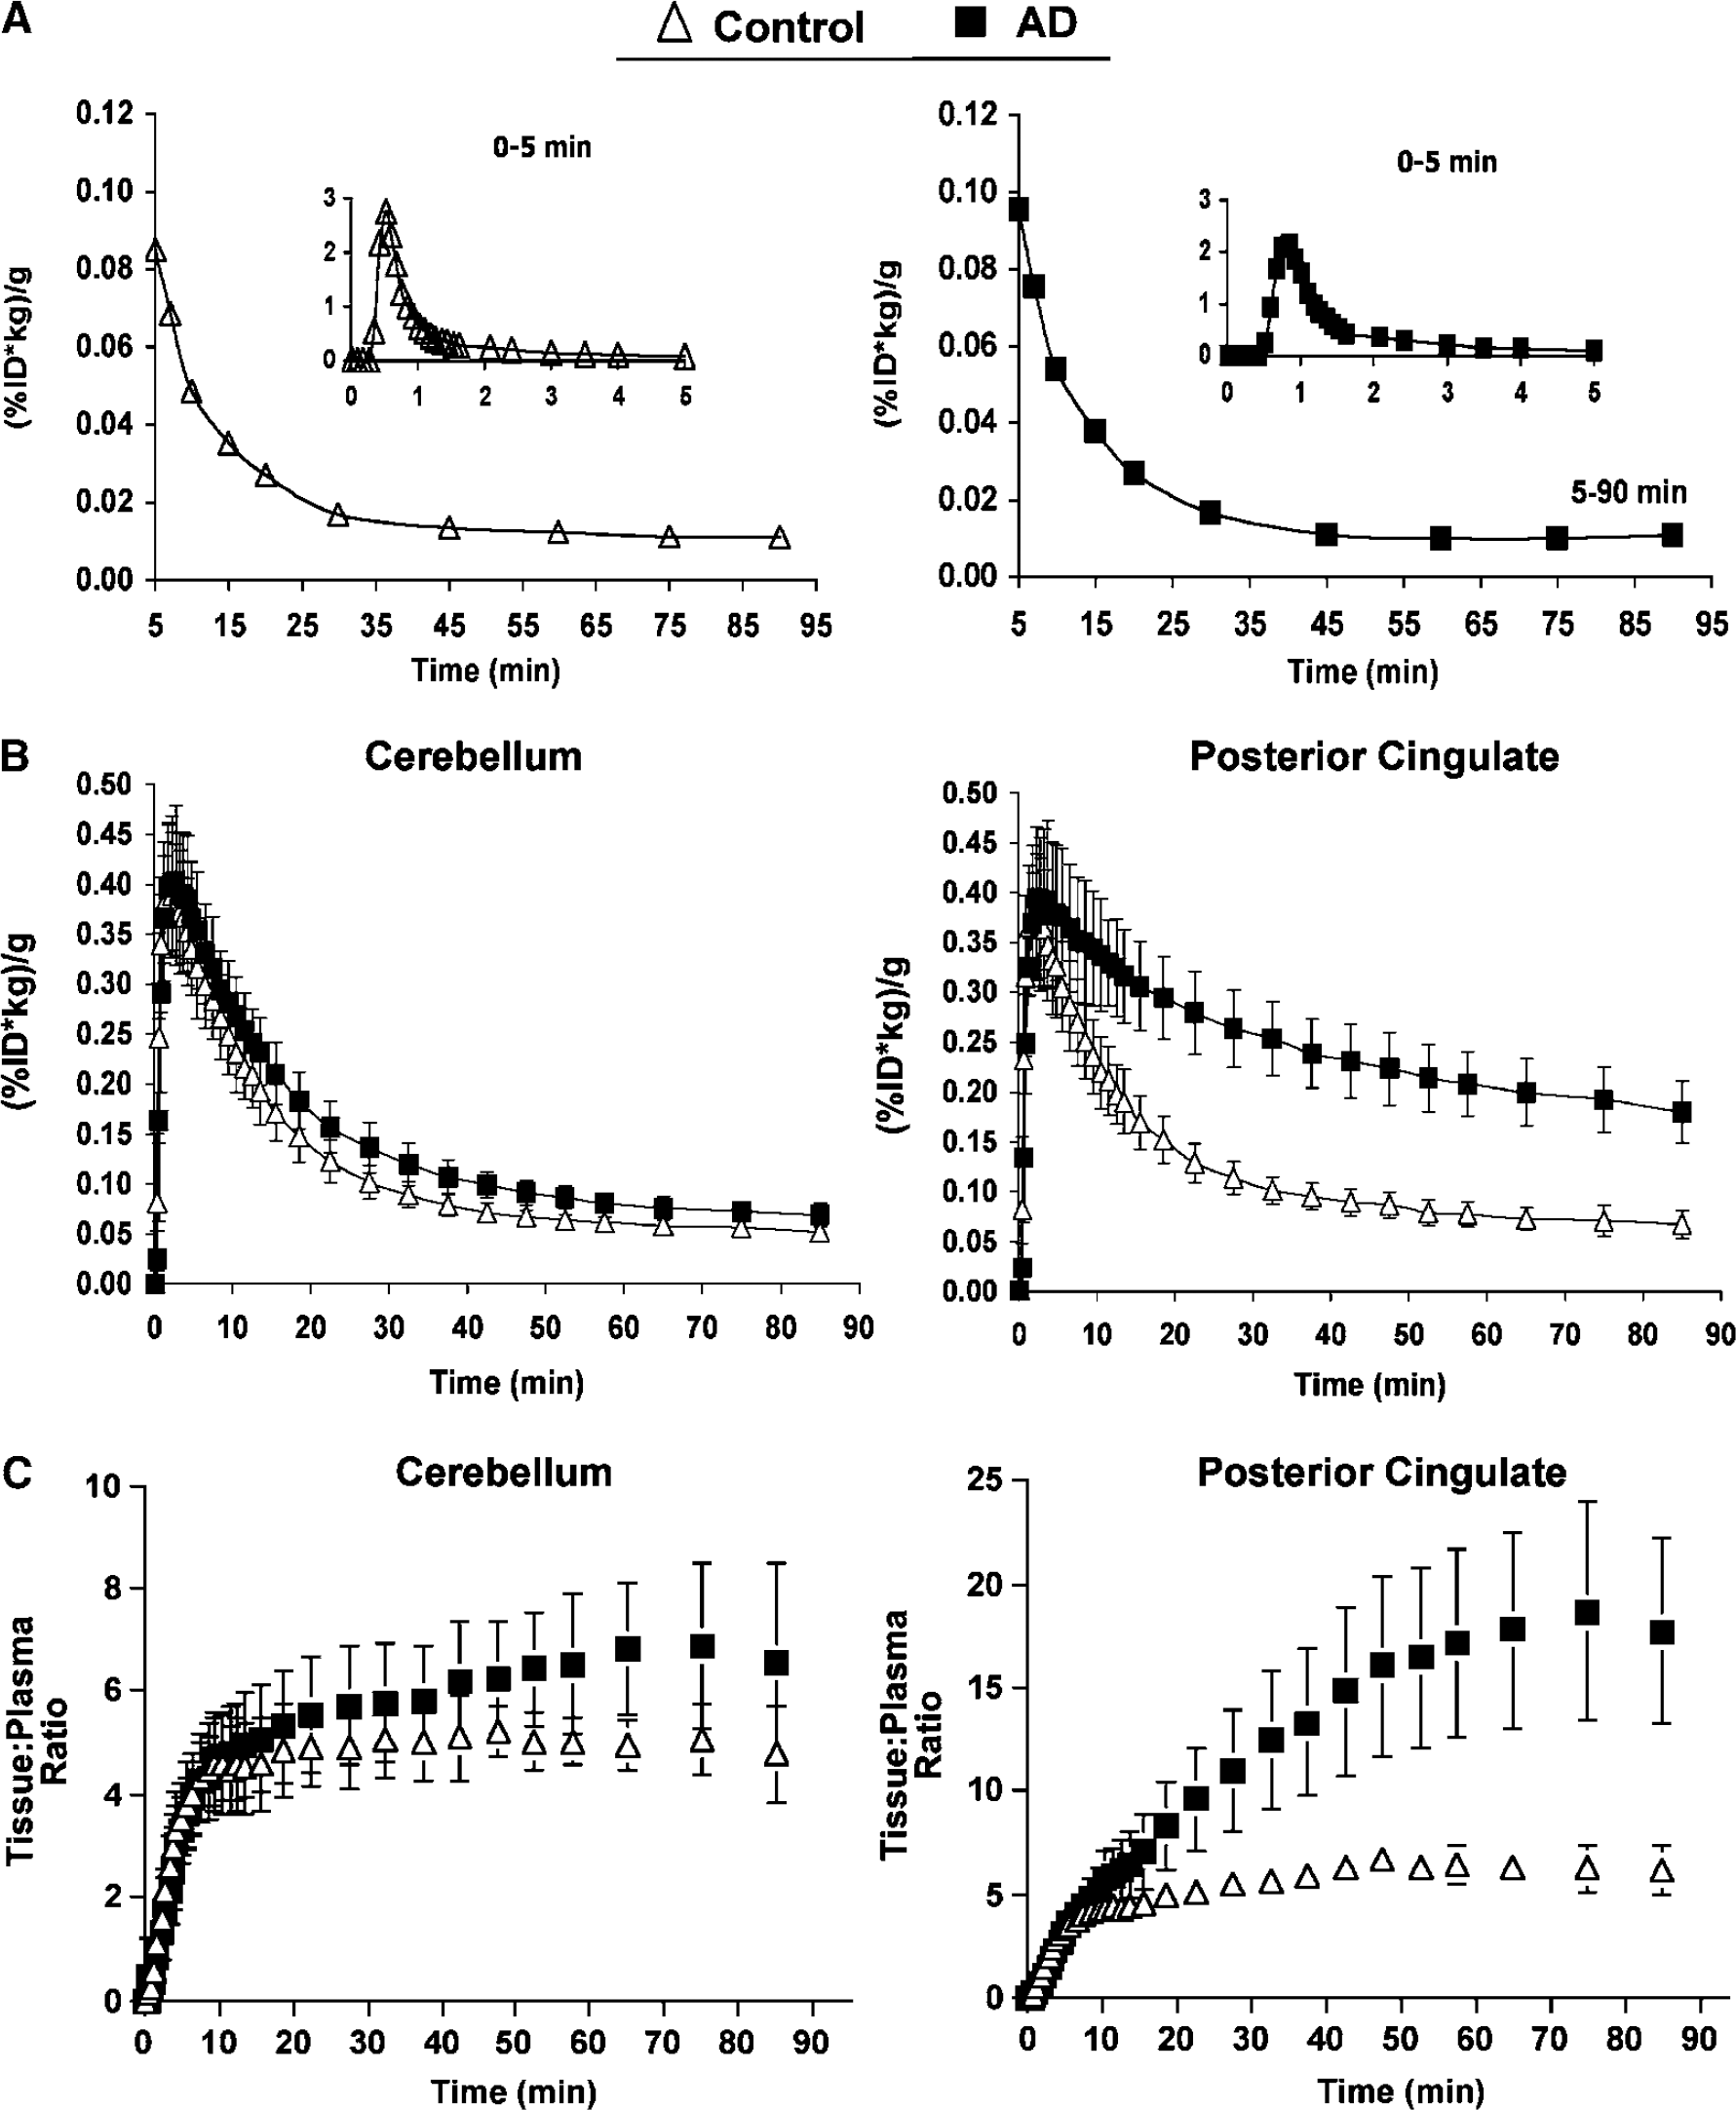
The PIB plasma radioactivity concentration is shown in Figure 3A for a control and AD subject. The concentration of PIB in plasma was similar across groups. Also shown are the average PIB time-activity curves for the cerebellar and posterior cingulate regions (Figure 3B). The cerebellar data were similar across subjects and showed a sharp decline over approximately 50 mins followed by a slow clearance at later times. In control subjects, the time-activity profile of the posterior cingulate data was similar to that of the cerebellar data. In contrast, in AD subjects, the average posterior cingulate data reflected greater brain retention than the average observed for controls.
(
Data Analysis
The results will be described in terms of cerebellar (reference) findings and regional (nonreference) findings. The analyses discussed below will focus on the comparison of control and AD groups, with the exception of the cerebellar analyses. The regional values for the individual MCI subjects were either ‘control-like’ or ‘AD-like’ making this a heterogeneous group. Thus, the representation of MCI data as a group mean value is misleading and requires discussion of the individual subject data. While equivalent findings were obtained for MCI subjects by all analyses, the results of individual MCI subjects will only be provided in the Graphical analyses section.
Tissue data: Tissue:plasma ratios were computed across brain regions. The average tissue:plasma ratios began to plateau by approximately 35 mins for the cerebellar data of control subjects, with a more variable time and level of plateau for the AD subjects (Figure 3C, left). For posterior cingulate, the control subjects exhibited a slower average time-to-plateau (approximately 45 to 50 mins) than that for the cerebellum. The approach to plateau for AD PCG data was delayed, relative to the controls, and the average plateau value was over three-fold greater than that observed for controls (Figure 3C, right).
The semiquantitative SUV values (Table 3) yielded distinct group differences between control and AD subjects in areas of brain known to contain amyloid in AD. These differences were consistent with the in vivo distribution of PIB in AD previously reported by Klunk et al (2004a). Compared with controls, 2.4- to 2.8-fold increases in SUV values were found for AD subjects in PCG, PAR, FRT, LTC, SMC, CAU (P < 0.05). Lesser increases were observed in OCC (1.9-fold), CER (1.3-fold), and MTC (1.6-fold) (P<0.05). Figure 1 shows SUV images for an AD subject (AD-3).
Standardized uptake values (SUV)
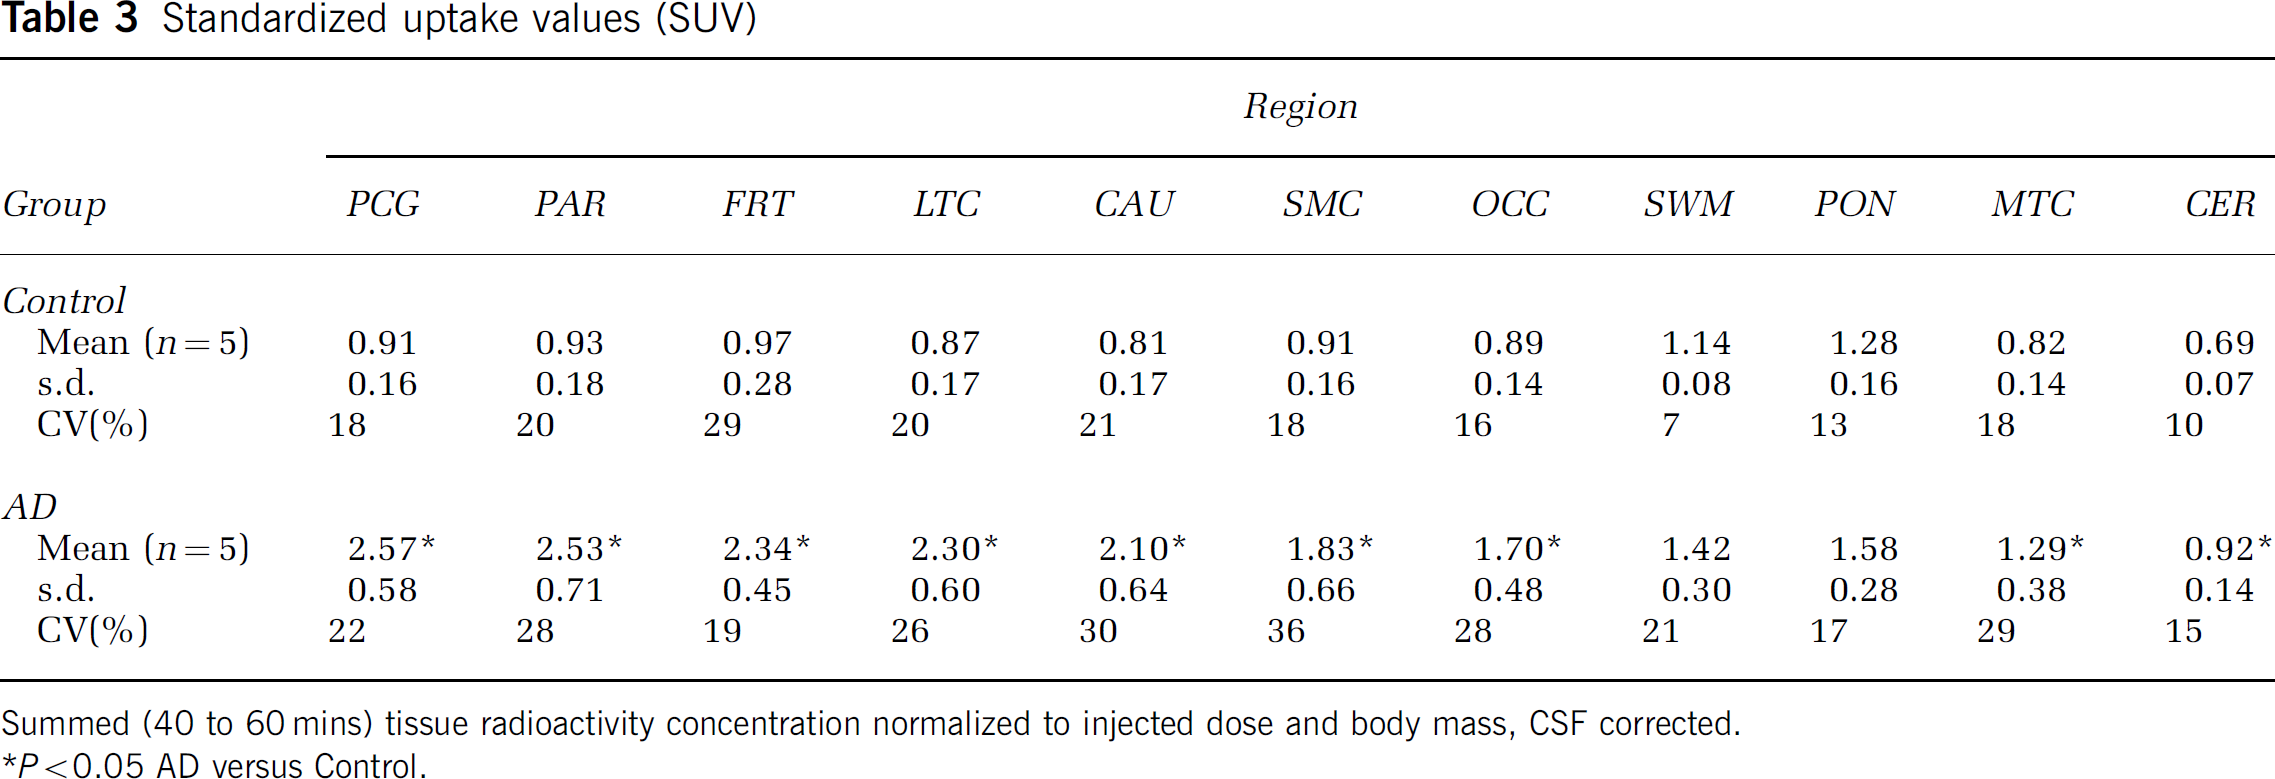
Summed (40 to 60 mins) tissue radioactivity concentration normalized to injected dose and body mass, CSF corrected.
P<0.05 AD versus Control.
Spectral analysis: As few as two and as many as four exponential components were observed across the control and AD data sets. The beta values were placed into four categories (A—D: fastest to slowest): (A) 1.90 to 0.38 min−1; (B) 0.24 to 0.15 min−1; (C) 0.10 to 0.05 min−1; and (D) 0.04 min−1. Categories B and C were most consistently observed. Category B alpha values generally ranged from 0.08 to 0.18 mL/min mL. Category C alpha values for controls were of similarly low magnitude across regions, while the values for AD subjects varied linearly with the Logan DV (r ~ 0.7). The fastest category A components were generally found in the white matter, pons, and control data. The slowest D component was variably observed and not evident for all regions of a given subject.
Cerebellar data
Compartmental modeling: Figure 4 shows different compartmental curve fits to the cerebellar data of AD-1, whose cerebellar kinetics did not include the slowest spectral analysis component. Across subjects, the 1T model was consistently inadequate with a general underestimation of the peak radioactivity concentration, overestimation of data at mid-times, and underestimation of data at later times. For the vast majority (13/15), the 2T-4k model proved best in terms of overall performance. The 2T-4k model yielded average CER AIC values, relative to the 2T-3k model, that were lower by 50%, 44%, and 18% for controls, MCI, and AD subjects, respectively.
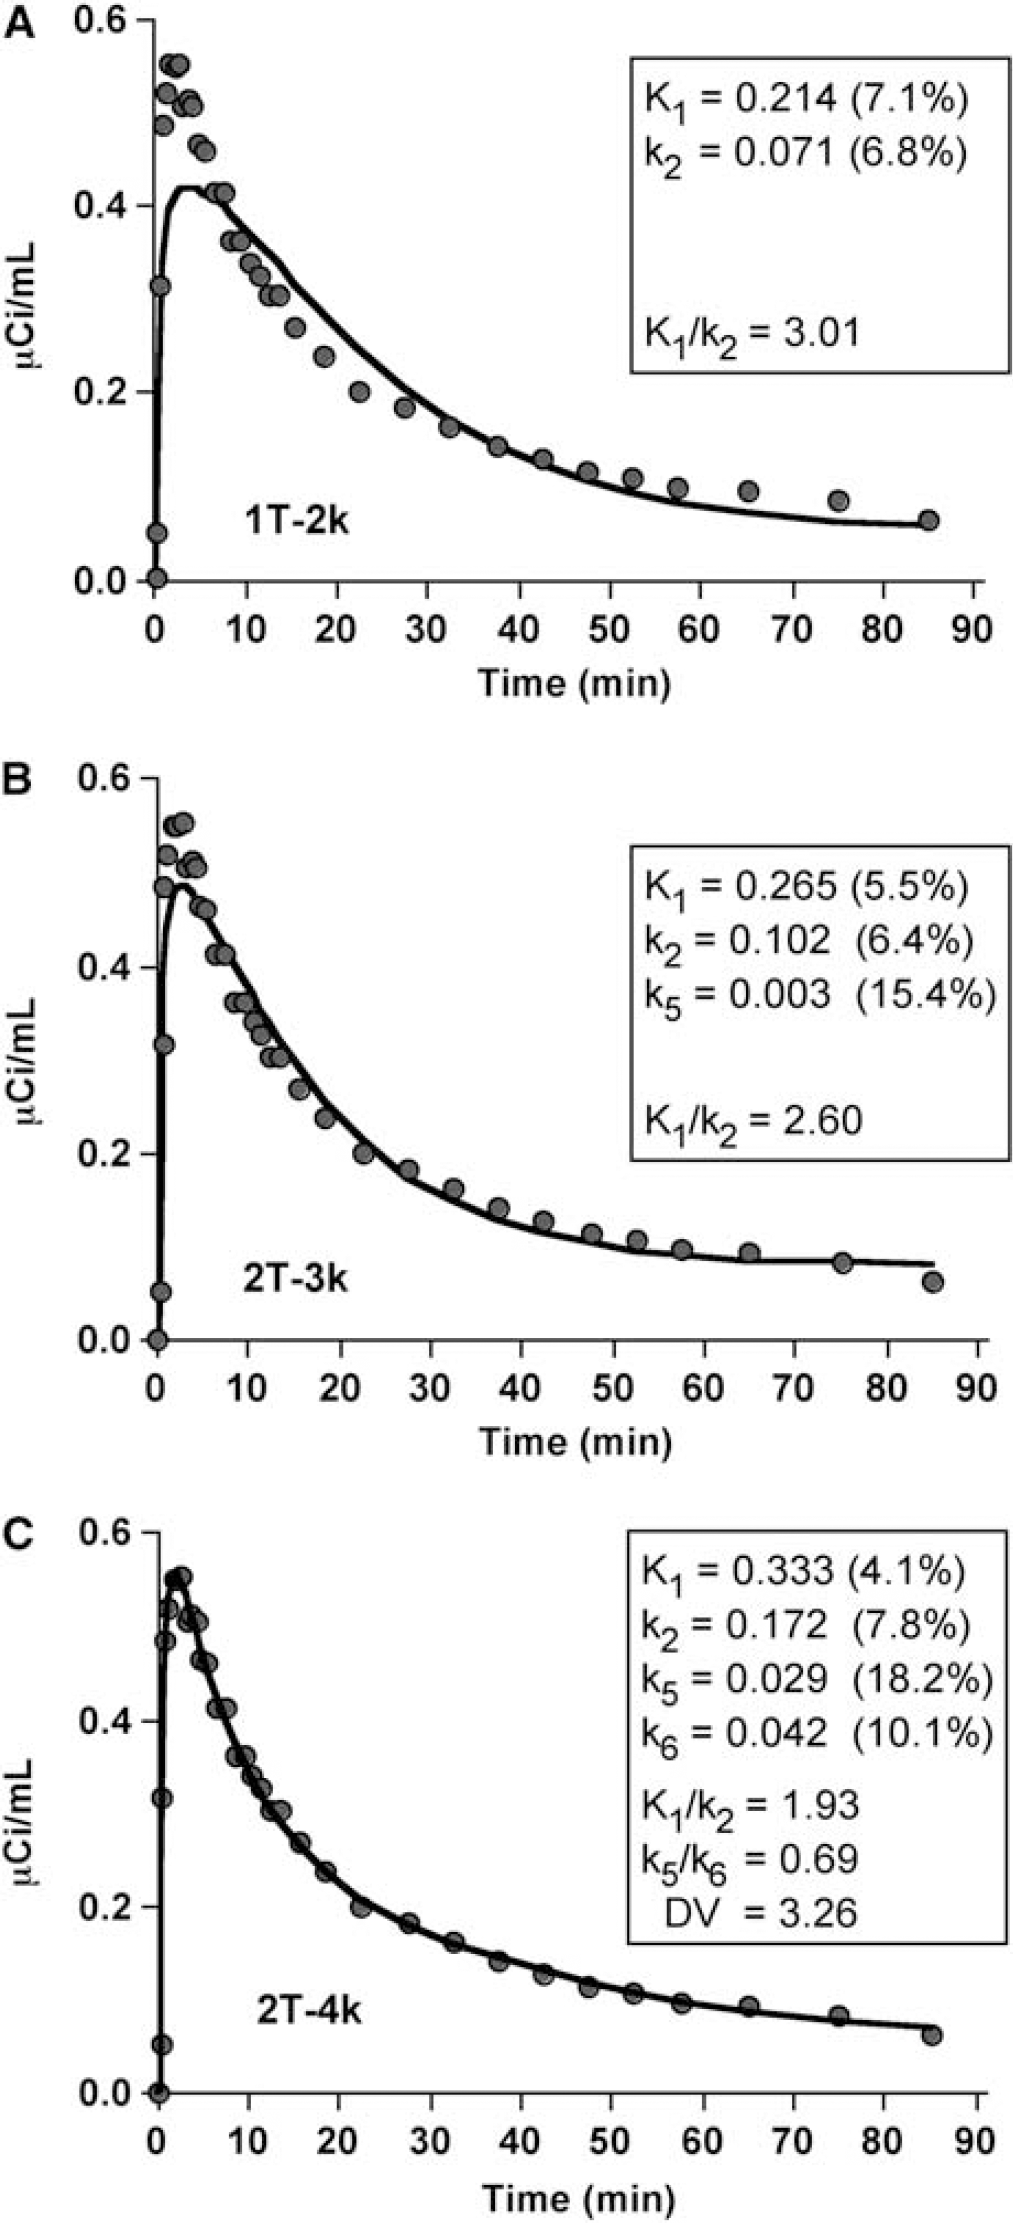
Compartmental fits (solid lines) to Pittsburgh Compound-B (PIB) cerebellar data (circles) of an AD subject (AD-1, 10 mCi injection). Different model configurations, that range in complexity, were applied: (A) 1-tissue 2-parameter model (1T-2k); (
However, for 2 of 15 subjects (one control (C-1) and one AD (AD-5) subject), a 4k fit to the cerebellar data was not achieved. Spectral analysis of these subjects' cerebellar data revealed the slowest component for both. A 4k model fit was obtained to the C-1 cerebellar data after constraint of k6 (0.0073 min−1) based on the average cerebellar k5/k6 ratio for the other 4 controls (0.78 ± 0.51). An acceptable 2T-4k fit to the cerebellar data of AD-5 was not achieved (negative k6). Parameter errors were largest for k6; average errors ranged from 33% to 38% across the 3 subject groups.
The average CER K1 values (mL/min mL) was similar for controls (0.29 ± 0.06), MCI (0.26 ± 0.03), and AD subjects (n = 4, 0.28 ± 0.04). The average K1/k2 values (mL/mL) were 1.82 ± 0.28 for control (n = 5), 1.99 ± 0.20 for MCI (n = 5), and 1.92 ± 0.06 for AD (n = 4) subjects. The standard errors in K1 and K1/k2 were not more than 5%. The average CER k5/k6 value was 0.88 ± 0.49 for controls (n = 5), 0.83 ± 0.43 for MCI subjects (n = 5), and 1.20 ± 0.62 for AD subjects (n = 4), with standard errors in the ratio of less than 30%. The average CER k6 value was similar (~ 0.02 min−1) between the groups but associated with high intersubject variability (95% to 99%). The average CER k2/k5 ratios were approximately 11 to 14 across subject groups. The ratios were not CSF corrected.
Graphical analyses: Graphical methods were applied to the cerebellar data over 35 to 90 mins (8 points) based on the time-to-plateau of the tissue:plasma ratios. For the CER data of all 15 subjects, the Logan and MA1 methods yielded high regression coefficients (r2 generally ≥0.98). Similar cerebellar DV values were obtained for compartmental, Logan, and MA1 methods (Table 4).
Cerebellar analyses
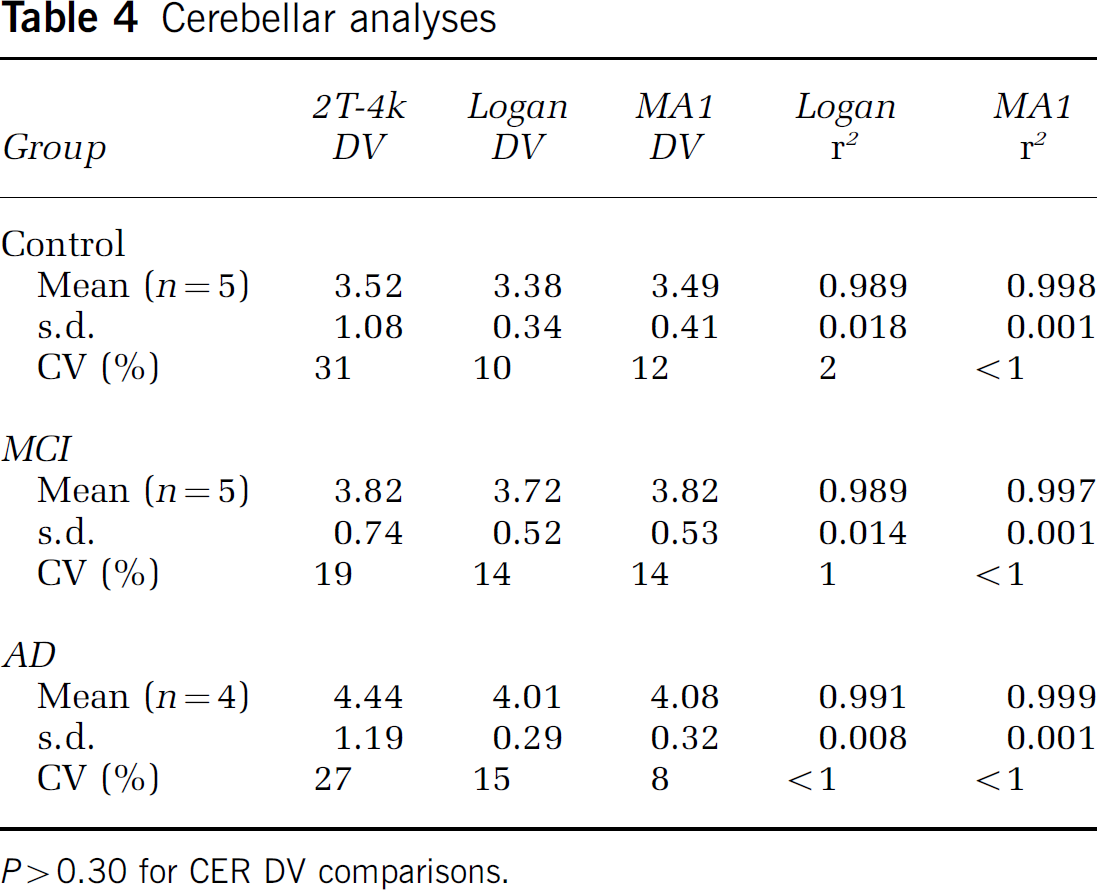
P > 0.30 for CER DV comparisons.
Regional Data
Compartmental modeling: The regional data were well described by a 2T-4k compartmental model in 147 of 150 cases (10 regions for 15 subjects). Similar to cerebellum, the 2T-3k model did not fit the regional data as well as the 2T-4k model for the vast majority of cases. As an example, the 2T-4k model yielded average PCG AIC values, relative to the 2T-3k model, that were lower by 36% and 43% for controls and AD subjects, respectively. Figure 5 shows examples of 2T-4k curve fits to both the posterior cingulate and cerebellar data of AD-3 whose cerebellar kinetics contained the slowest spectral analysis component. Table 5 lists the average regional 2T-4k PIB DVR values. Data from AD-5 were excluded from Table 5 because the 2T-4k model fit to the cerebellar data failed and regional 2T-4k DVR values were not determined for AD-5 (see above). Small negative k4 values (< −0.01 min−1) also were encountered in curve fits to the frontal cortex of MCI-2 and subcortical white matter of MCI-1 and AD-2. Parameter standard errors were generally less than 30%.
Compartmental 2T-4k DVR measures
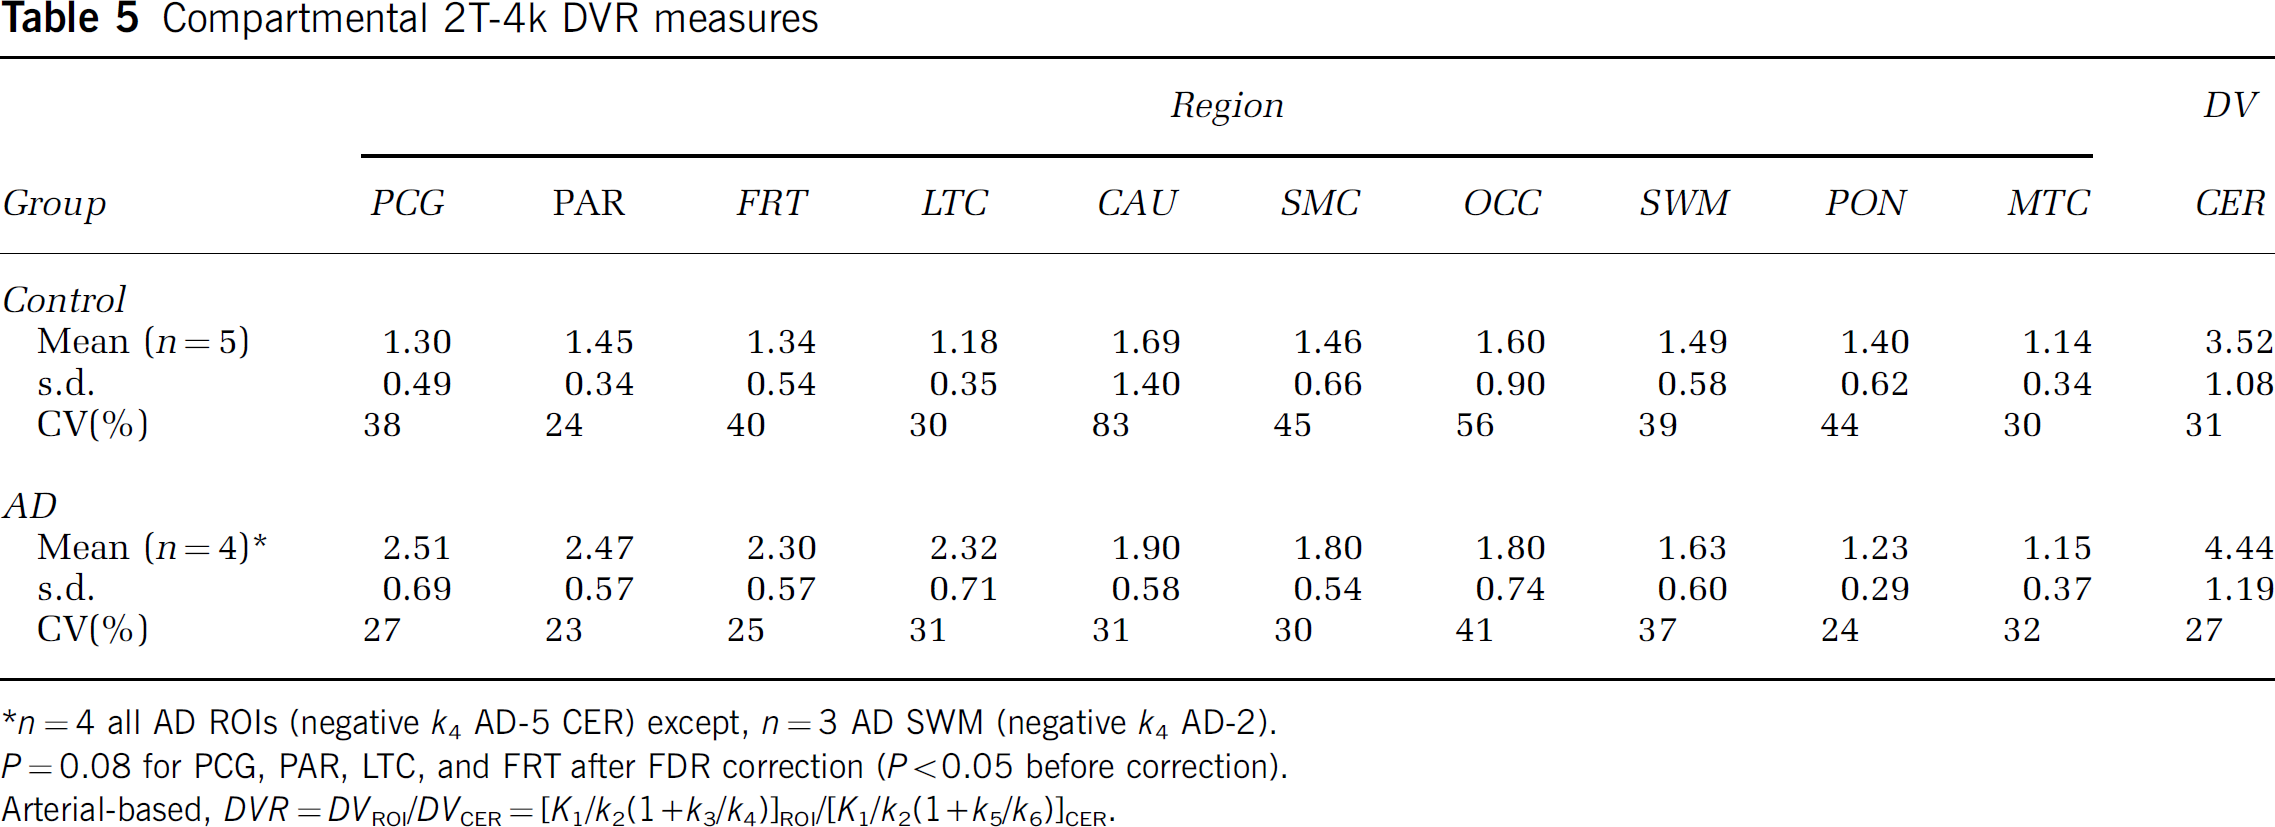
n = 4 all AD ROIs (negative k4 AD-5 CER) except, n = 3 AD SWM (negative k4 AD-2).
P = 0.08 for PCG, PAR, LTC, and FRT after FDR correction (P < 0.05 before correction).
Arterial-based, DVR = DVROI/DVCER = [K1/k3/k4)]ROI/[K1/k2(1 + k5/k6)]CER.
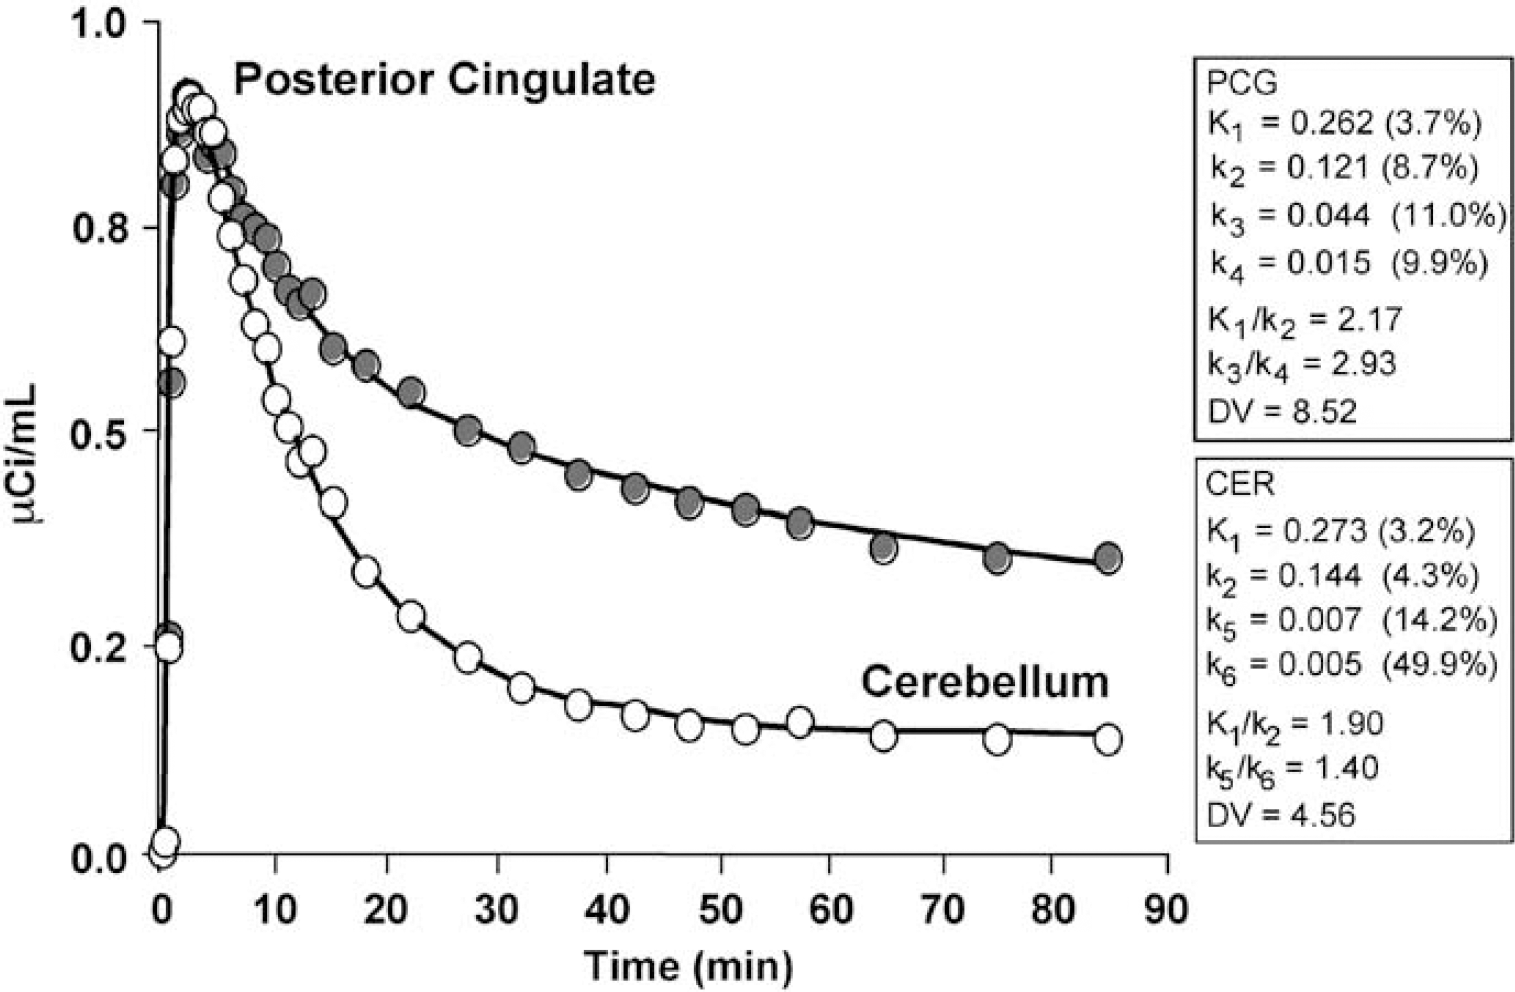
Compartmental modeling results obtained using a 2-tissue compartment model (4 parameters, 2T-4k). The graph shows an example curve fit (solid line) to the posterior cingulate Pittsburgh Compound-B (PIB) data (gray circles) of an AD subject (AD-3, 15 mCi injection), along with the cerebellar data (white circles) for comparison. The kinetic parameters (standard errors) obtained for the posterior cingulate (specific binding: k3, k4) and cerebellar fits are listed in the text boxes. The regional data were generally well described by the 2T-4k model, across regions and subjects.
Across 7 cortical areas (FRT, LTC, MTC, OCC, PAR, PCG, and SMC), the average K1 value (mL/ min mL) was somewhat less than that for CER and similar for control (0.25 ± 0.04) and AD (0.22 ± 0.04) subjects, given no CSF correction. The K1/K2 ratios were fairly uniform across the 7 cortical ROIs of controls (1.64 ± 0.08 mL/mL). The K1/k2 ratios for AD subjects (1.95 ± 0.25 mL/mL) were generally larger and somewhat more variable than the control ratios but more similar to the CER ratios. The cortical (n = 7) k3/k4 ratios varied more than the K1/k2 ratios with a nearly 1.7-fold greater cortical average for AD subjects (2.41 ± 0.46) relative to controls (1.44 ± 0.31). The average PCG K1/k2 values were 1.67 ± 0.22 mL/mL for controls (n = 5) and 2.17 ± 0.10 mL/mL for AD subjects (n = 5), with standard errors of less than 8%. The average PCG k3/k4 values were 1.41 ± 1.01 for controls (n = 5) and 2.92 ± 0.69 for AD subjects (n = 5). The average PCG k2/k3 ratios were approximately 10 for controls and 2 for AD subjects (no CSF correction).
When comparing the 2T-4k compartmental regional DVR data of controls and AD patients (Table 5), significant differences (P <0.05) were seen in the PCG, PAR, LTC, and FRT regions. Significant differences were observed for these regions before and after CSF correction was applied. However, after the FDR correction, these differences were no longer significant (P = 0.08).
Given that a 4-parameter curve fit was appropriate in the cerebellum, a 3T-6k model was applied to the regional PIB data using different specific constraints, such as fixing K1/k2 to the cerebellar value and fixing k5 and k6, respectively, to the values determined in either cerebellum or white matter (data not shown). The 3T models varied in performance with respect to adherence of either DVR or k3/k4 to a rank order consistent with the regional deposition of amyloid in AD. When k5 and k6 were not constrained, the fit often returned negative values for one or both. The failure of the 3T models is consistent with the spectral analysis results that indicated two primary components. Such constraints (K1/k2 ratio) also were unsuccessful when implemented for the 2T models (data not shown).
Graphical analyses: The individual Logan graphical DVR values are shown in Table 6. The Logan DVR results indicated greater PIB retention in most cortical regions of the AD brain, relative to controls. Large differences were observed in PCG, PAR, FRT, LTC, and CAU (1.8- to 2.1-fold; P < 0.05), moderate differences were observed in OCC and SMC (1.4-to 1.5-fold; P < 0.05), and a small, but significant difference was observed in MTC (1.2-fold; P < 0.05). No significant differences were found for the CER DV (P = 0.19). The same statistical differences were observed before and after CSF correction was applied. The PIB retention measures in different cortical areas were highly correlated (Figure 6). The Pearson correlation coefficient for the comparison of Logan DVR values from any two of the areas with the highest PIB retention (i.e., PCG, PAR, FRT, LTC, and CAU) ranged from r = 0.94 to 0.98. The PIB retention in cortical areas did not correlate significantly with white matter areas (Figure 6). The Pearson correlation coefficients for comparison of SWM DVR values with those of PCG, PAR, FRT, LTC, or CAU ranged from r=0.01 to 0.08.
Regional Logan DVR measures
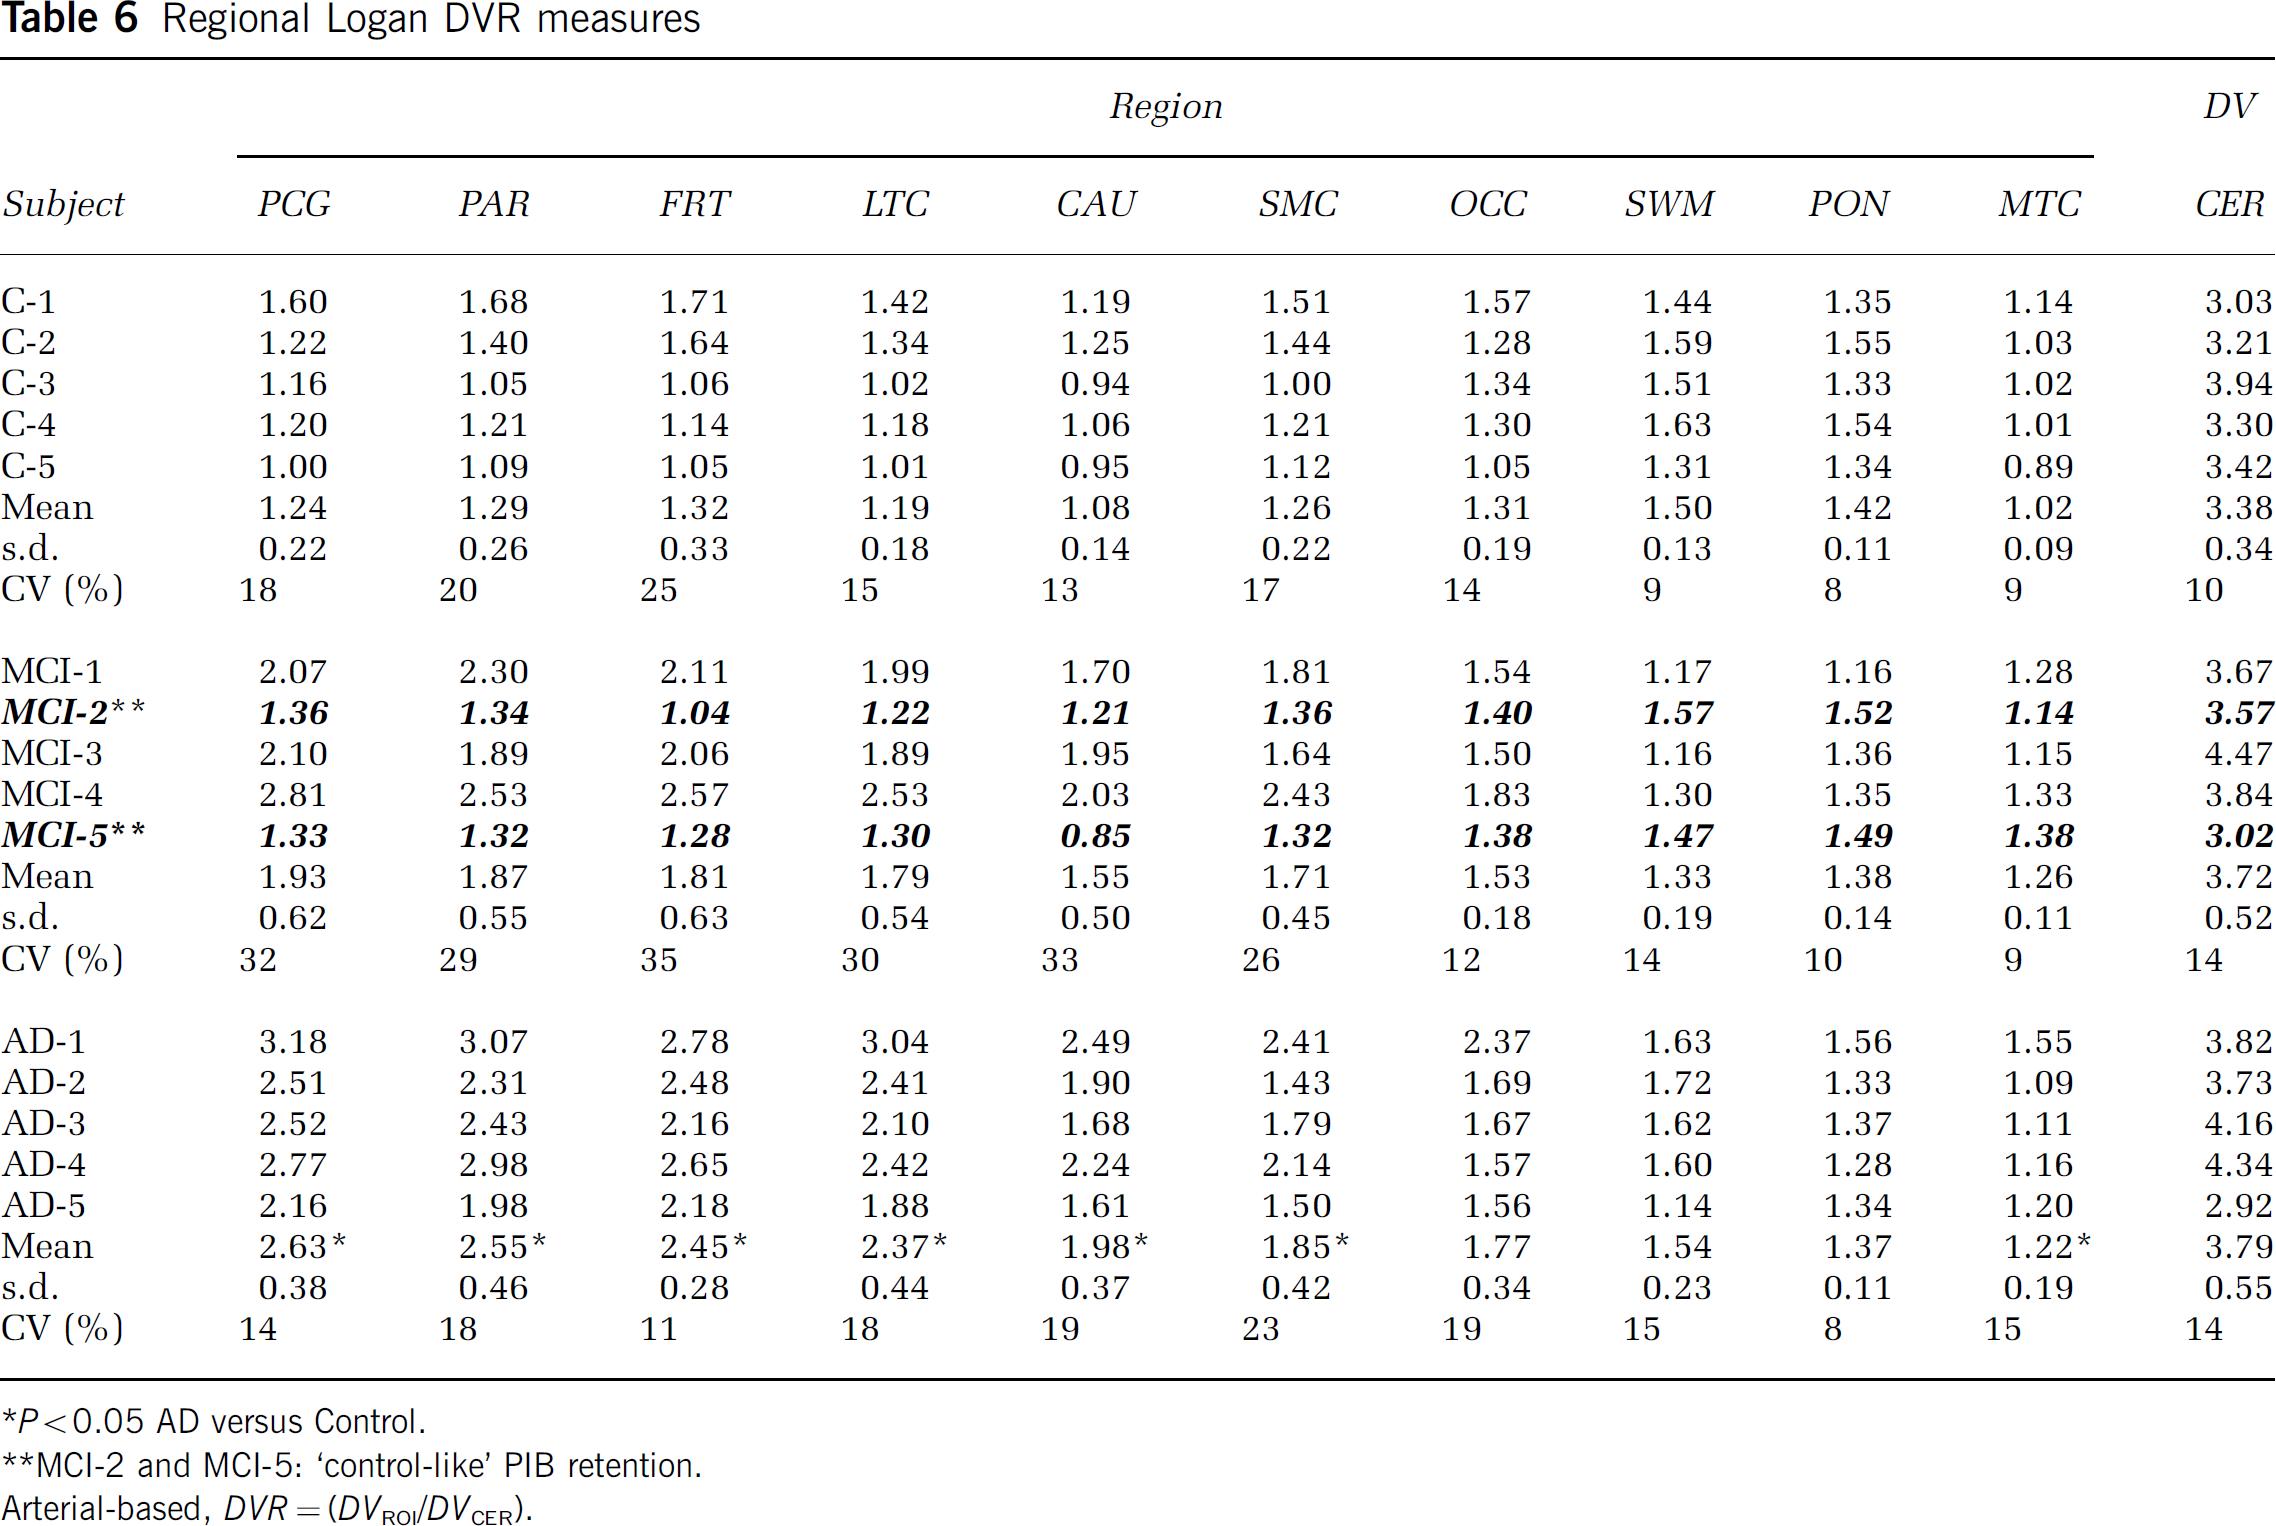
P <0.05 AD versus Control.
MCI-2 and MCI-5: ‘control-like’ PIB retention.
Arterial-based, DVR = (DVROI/DVCER).
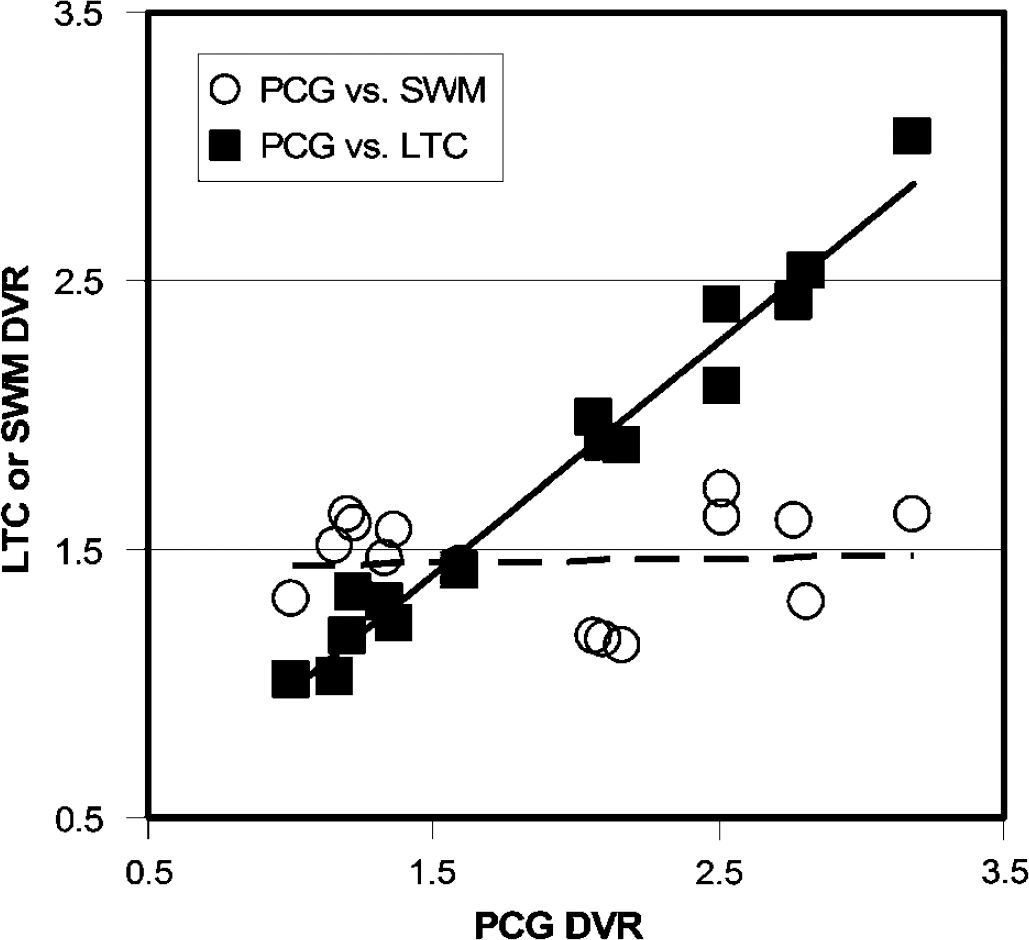
Correlation between Logan DVR values in cortical and white matter areas. Logan DVR values were highly correlated in cortical brain areas with high Pittsburgh Compound-B (PIB) retention but not between cortical areas and subcortical white matter. For example, the correlation between DVR values in the PCG and the LTC was very strong (filled squares; r = 0.98; P < 0.0001) while there was no correlation between DVR values in the PCG and SWM (circles; r = 0.04; P = 89).
The average Logan DVR values were consistent with the average tissue ratios, SUV, and compartmental 2T-4k DVR values. Good agreement was observed between individual compartmental and Logan DVR values, although the compartmental outcomes were more variable. Examples of the strong correspondence (r ~ 0.9) between the compartmental and Logan DVR values are shown in Figure 7 for areas of high PIB retention. The regression slope values indicate acceptable levels of bias; somewhat greater bias was observed for the PCG (11%) relative to the PAR (< 1%). Good agreement was observed over all regions between the SUV and Logan DVR values (r = 0.94, P < 0.0001) and both were associated with similar levels of variability.
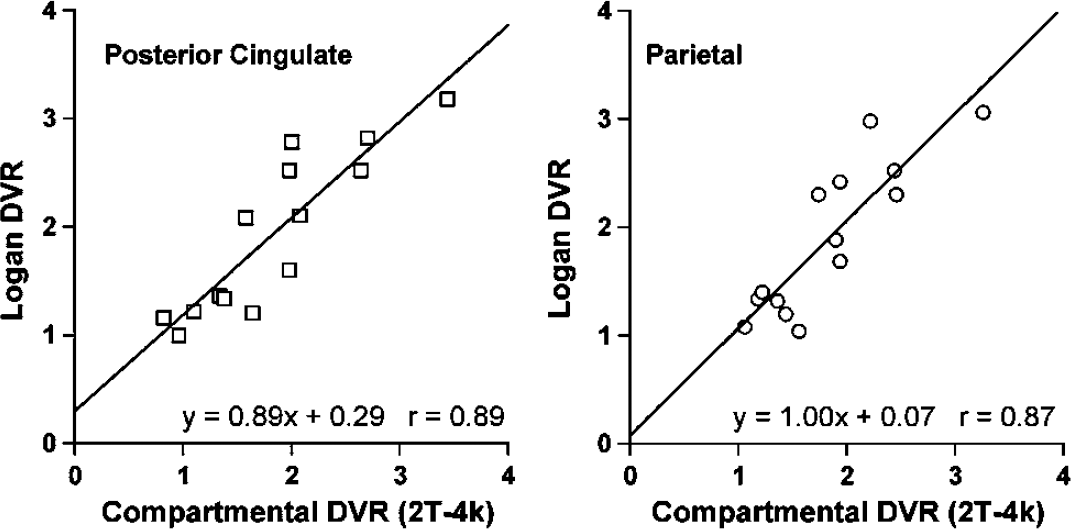
Graphs depicting linear regression between compartimentai modeling DVR and Logan DVR in areas for which AD subjects showed greatest Pittsburgh Compound-B (PIB) retention. The data for all subject groups are included (less AD-5). Examples of the good agreement observed between the 2T-4k DVR and Logan DVR values obtained for the posterior cingulate and parietal areas are shown. The regressions yielded acceptable bias (< 1% to 11%) and strong correlation (r ~ 0.9).
In general, mean MCI Logan DVR values fell between control and AD means in brain areas that showed high PIB retention in AD (Table 6). Figure 8 shows that individual MCI subjects do not fall as a group into an area that is intermediate between the control and AD ranges, but, instead, MCI subjects are either indistinguishable from controls, or indistinguishable from AD subjects. This was equally true for SUV and compartmental analyses (data not shown).
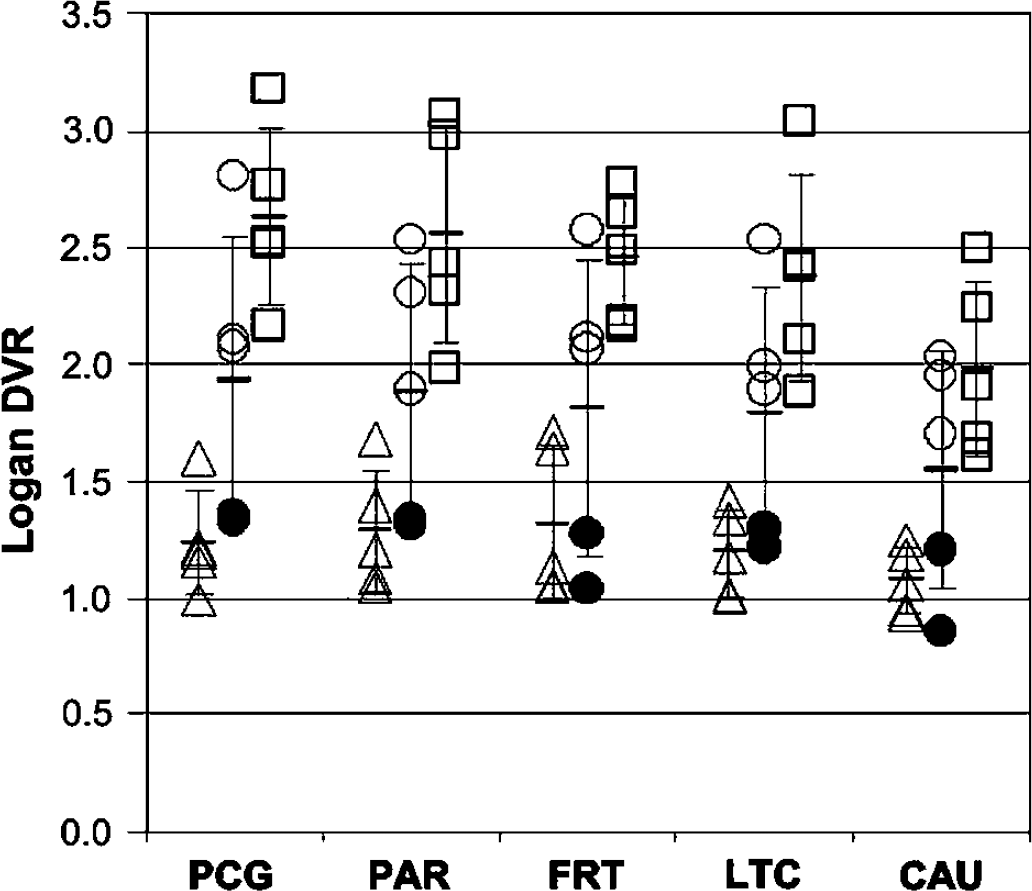
Scatter-plot showing the distribution of individual subject Logan DVR values for all control (triangles, n = 5), mild cognitive impairment (MCI) (circles, n = 5) and AD subjects (squares, n = 5) in the five brain regions showing the highest Pittsburgh Compound-B (PIB) retention in AD subjects (see Table 6). The two MCI subjects who had relatively stable clinical courses (MCI-2 and MCI-5) are shown with filled circles. Note that MCI-2 and MCI-5 are indistinguishable from controls in the five brain areas while the other MCI subjects are essentially indistinguishable from the AD subjects.
Figure 9 shows parametric Logan DVR images for a control (C-5) a ‘control-like’ MCI subject (MCI-2), an ‘AD-like’ MCI subject (MCI-4), and the AD subject (AD-1) with the highest PIB retention. The DVR images show greatest PIB retention in cortical areas of the AD and ‘AD-like’ MCI brains, consistent with known patterns of amyloid deposition (Arnold et al, 1991; Braak and Braak, 1997; Thal et al, 2002), with relatively minimal retention in the control and MCI-2 subjects.
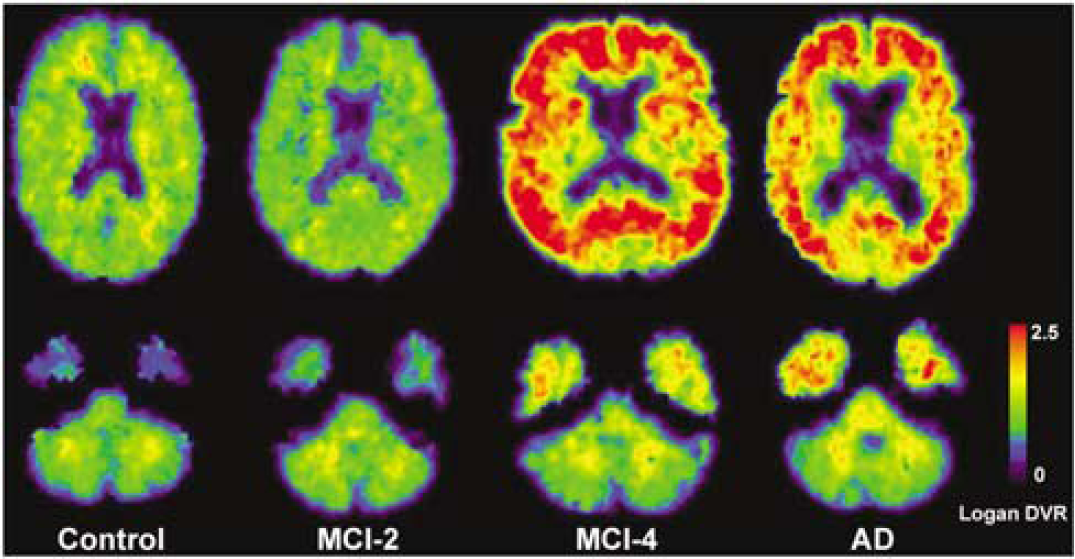
Examples of Pittsburgh Compound-B (PIB) Logan DVR images for a control (C-5), a ‘control-like’ mild cognitive impairment (MCI) (MCI-2), an ‘AD-like’ MCI (MCI-4), and the AD (AD-1) subject with highest PIB retention. Images were generated using arterial plasma data and a 90 mins analysis. The DVR images reflect greater PIB binding in many cortical areas of the AD subject and MCI-4, with background levels in the control and MCI-2 subjects. Similar DVR values were measured in the cerebellum across all subject groups.
In this work, the plateau of the tissue:plasma ratios was delayed for AD subjects relative to controls, particularly in high binding areas (e.g., PCG). The Logan analysis proved robust even for data that were slower to plateau. The tissue:plasma values for AD-5 indicated constant accumulation across regions (individual data not shown), while the Logan regression coefficient average was r2 = 0.99 ± 0.02 across the 11 regions. These results suggest that the Logan intercept values approached a plateau earlier than the tissue:plasma ratios thus establishing the necessary condition for linearity before traditional tissue:plasma steady-state had been established (Logan et al, 1990; Logan, 2000). As supplemental verification, the time course of the Logan intercept for the AD-3 PCG was generated (data not shown) using the measured arterial input function and 2T-4k parameters (Logan, 2000). The approach to plateau for the AD-3 PCG intercept was earlier (~ 35 mins) than that observed for the AD PCG:plasma ratios (~ 50 mins). The Logan DVR values were stable over time with a difference of < 1% between the average AD PCG DVR values determined over 50 to 90mins (5 points) and 35 to 90mins (8 points).
Test/retest data: The intrasubject variability in the Logan DVR proved promising. Values are shown for the five subjects in Table 7. Despite the small sample size and the time interval between scans (within 20 days of baseline), the five subjects' Logan DVR variability measures were similar to those observed for other radiotracers (Volkow et al, 1991; Smith et al, 1998). The mean test/retest variation was 8.4% ± 5.4% over all areas. More importantly, the average test/retest variation was 6.1% ± 1.5% in the five areas of primary interest for PIB retention (i.e., PCG, PAR, FRT, LTC, and CAU). Across the five subjects, the magnitude of the test/retest for posterior cingulate ranged from < 1% to 10%, while the cerebellar range was approximately 2% to 11%. The ICC values for the PCG and CER regions were 0.98 and 0.72. The stability of the DVR measure was least in areas dominated by nonspecific PIB retention, such as the white matter areas (SWM and PON, ICC values < 0.5).
Discussion
This work describes the first fully quantitative arterial-based evaluation of the novel PET imaging radiotracer, PIB, for the in vivo assessment of amyloid deposition in human brain. Studies were conducted in healthy controls and in persons with MCI and mild-to-moderate AD. The analyses yielded significantly greater PIB retention in cortical areas of AD subjects relative to controls that was most prominent in posterior cingulate, parietal and frontal cortices. The increase in PIB retention in AD subjects (relative to controls) was evident in the tissue ratio data as well as the quantitative compartmental and graphical results. The MCI subjects appeared to either be ‘AD-like’ or ‘control-like’ with respect to PIB retention. That is, the MCI subjects did not uniformly fall into a group characterized by intermediate PIB retention.
Discussion points include: (1) nature of the PIB-amyloid binding interaction, (2) choice of kinetic method, (3) suitability of the cerebellum as a reference region, (4) choice of the DVR as a PIB retention measure, and (5) the pattern of PIB retention in AD, MCI, and controls.
Nature of Pittsburgh Compound-B Binding Interaction
The exact nature of the PIB-amyloid binding interaction is not known but current evidence indicates PIB binds specifically to fibrillar amyloid in a manner similar to Thioflavin-T (Levine 1995), the beta-sheet dye from which PIB was chemically derived (Klunk et al, 2003). Data from the present study clearly indicate that PIB binding to the AD brain homogenates in vitro is a reversible process. The specificity of PIB binding was demonstrated in pre-clinical studies that included a variety of in vitro binding experiments and real-time in vivo multiphoton microscopic studies in transgenic mouse models of amyloid deposition (Klunk et al, 2003; Bacskai et al, 2003). Further demonstration of specificity, through in vivo displacement studies, has not been performed by our group as a result of several factors. First, transgenic mice that develop brain amyloid deposits have proven to be poor models for in vivo or ex vivo radiotracer studies of PIB binding because the total number of PIB binding sites on amyloid deposits in the transgenic mouse brain (or aggregated synthetic Aβ) is 1,000-fold less than that on amyloid found in AD brain (Klunk et al, 2004b). Second, PIB binding sites in human AD brain are present in concentrations over 1 μmol/L (Klunk et al, 2003). That, coupled with the low solubility of PIB in aqueous media, make it impractical to achieve the μmol/L concentrations needed for substantial in vivo displacement by nonradioactive PIB in human studies.
Logan test (T) and retest (R) DVR
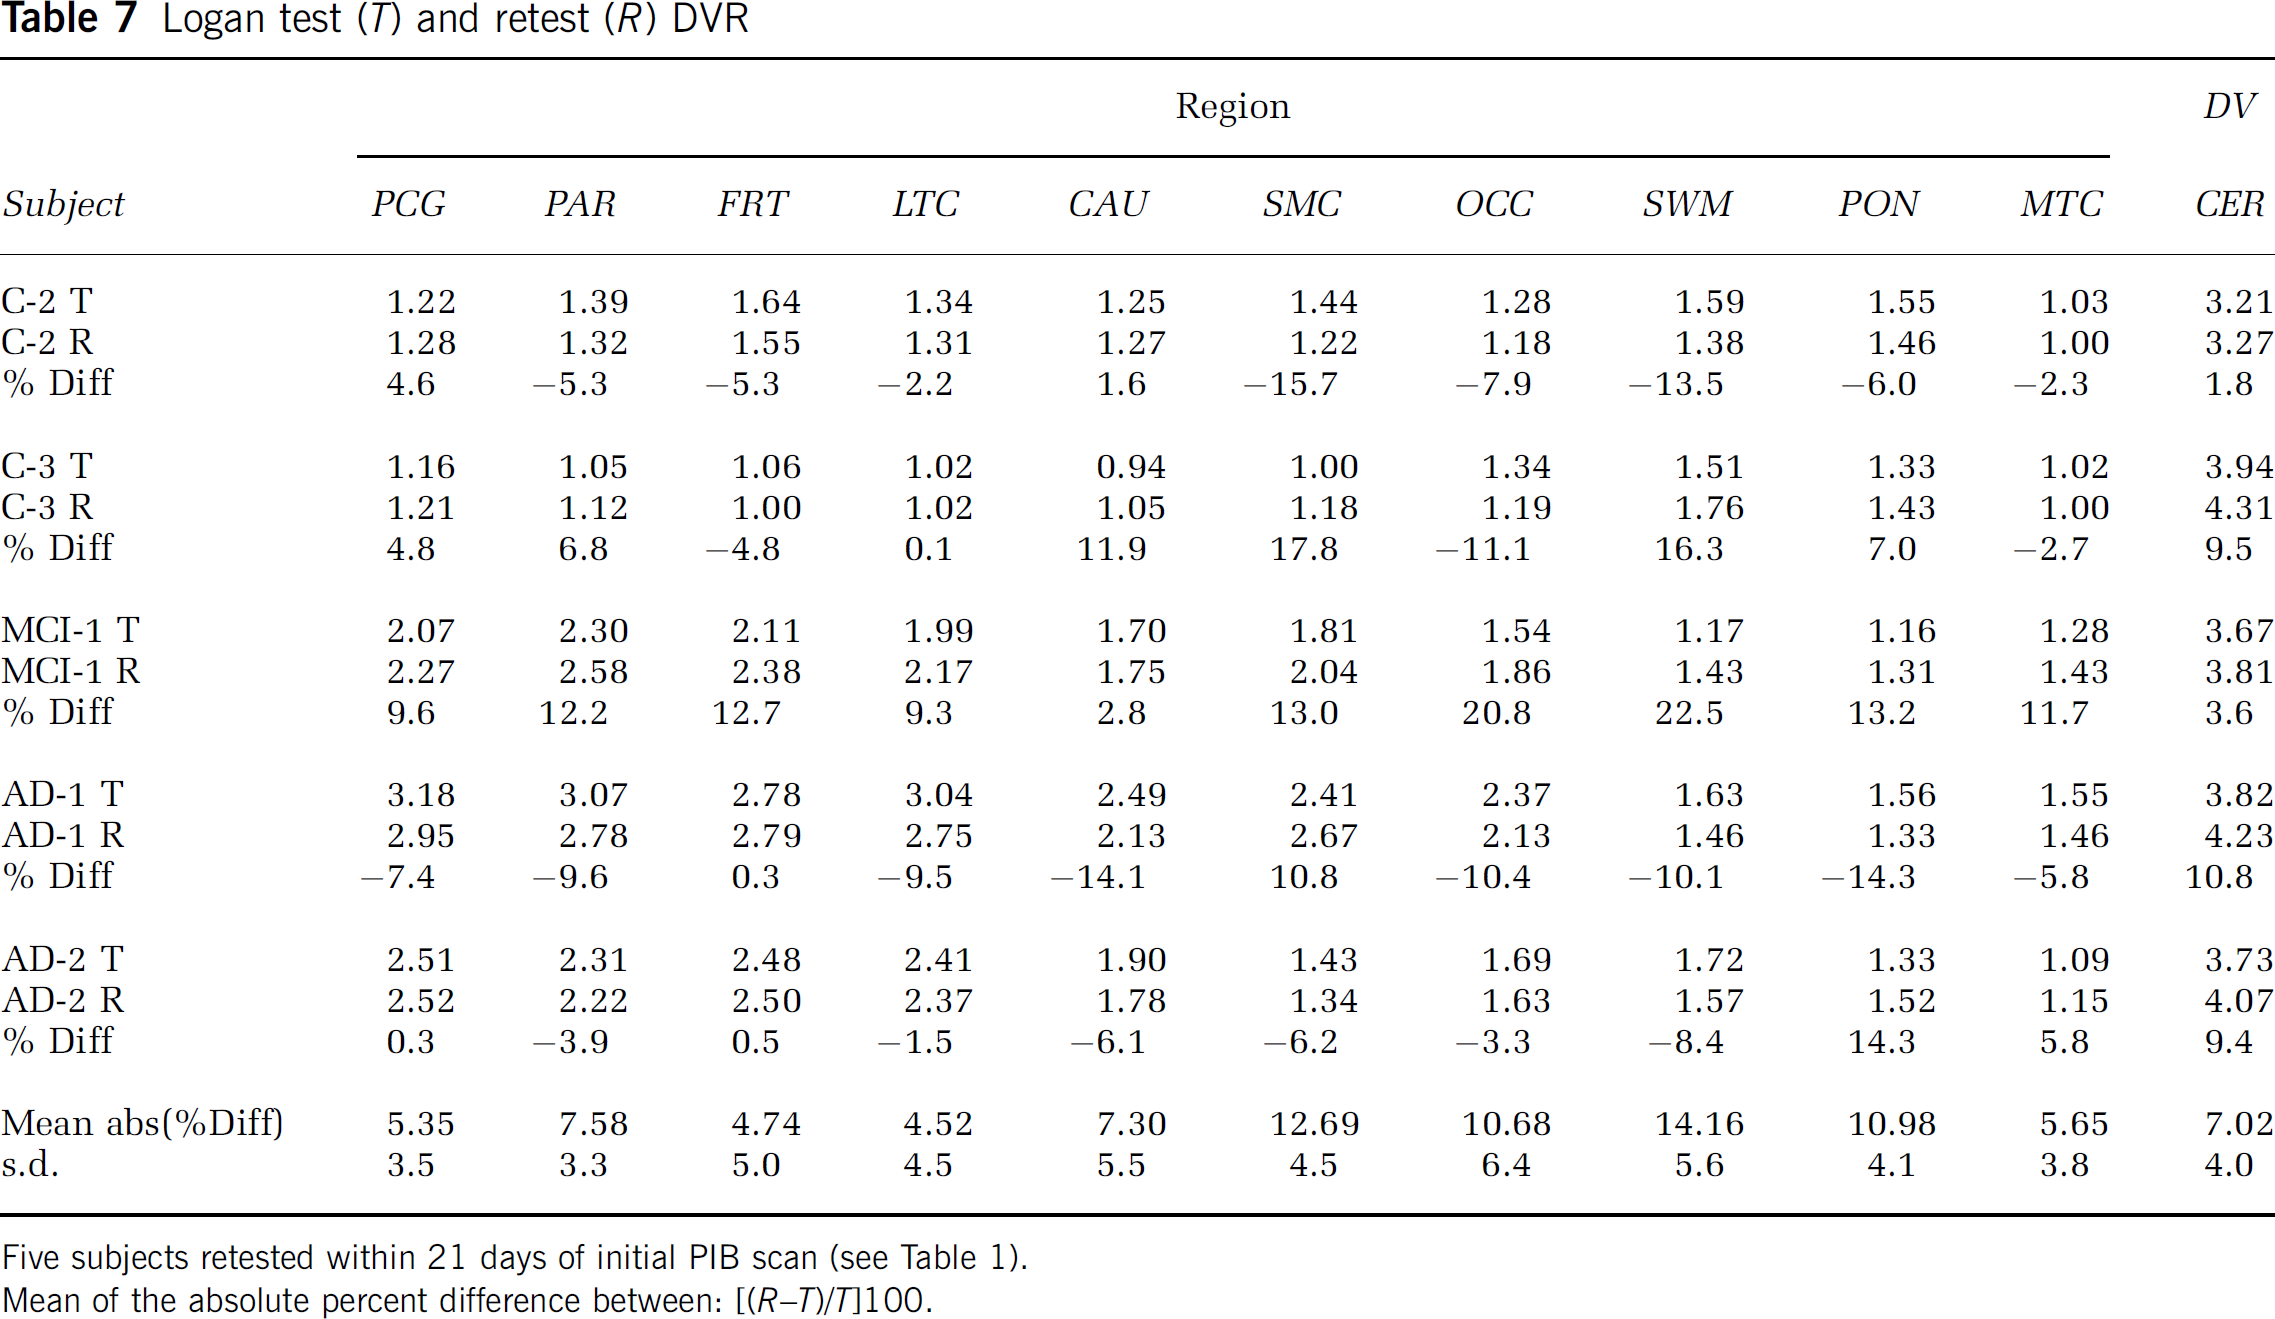
Five subjects retested within 21 days of initial PIB scan (see Table 1).
Mean of the absolute percent difference between: ((R-T)/T]100.
Kinetic Methods
Spectral analysis: The spectral analysis results supported the use of a 2-tissue compartment model as two intermediate categories of kinetic components were most prominently identified in the data. The magnitude of the slower of these two components (β: 0.10 to 0.05 min−1) proved to be related, across regions, to the Logan DV value. The small, very slow, component was observed in some subject's time—activity data but not always present for a given subject across all brain areas.
Compartmental modeling: Overall, the 2T-4k model provided better curve fits to the PIB PET data than the 2T-3k model. No significant group differences were evident in the cerebellar DV values. However, the k5/k6 ratios were 36% greater for AD subjects relative to controls. The level of variability in the CER DV values across subjects was 31% and 27%, for controls and AD subjects, respectively. This level of variability was likely, in part, the result of large intersubject variability in the CER k6. These results suggest that it is important to monitor PIB retention in the reference cerebellum, across groups, in future studies (see section below, Cerebellum as Reference).
For cortical data, the control k3/k4 ratios were consistent with nonspecific PIB retention as these were of low and generally uniform magnitude, relative to AD subjects. The average cortical AD K1/k2 ratio was approximately 20% greater than for controls and more similar to the CER K1/k2 ratios, while K1 averages were similar. This indicates that nonspecific PIB retention may be greater for AD subjects than for controls. The AD k3/k4 ratios in cortical areas were 67% higher than the k3/k4 ratios in controls (before CSF correction), consistent with much higher specific binding in AD. The poor performance of constrained models further indicated that nonspecific kinetics were not simply the result of PIB retention in white matter contained in the ROIs.
The 2T-4k DVR values showed greater PIB retention in PCG, PAR, LTC, and FRT areas of AD subjects relative to controls, but these differences did not prove to be statistically significant after correction for multiple comparisons. This was partially attributed to the intersubject variability in DVR (30% to 40%) and to exclusion of AD-5. For the cortical data, the intersubject variability in k4 was larger for controls than for AD subjects (e.g., Control PCG: 54% and AD PCG: 15%). It is expected that the 2T-4k DVR in these areas will reach statistical significance in a larger sample.
A 2-tissue compartment model previously has been applied to other PET radiotracers to describe the reference region kinetics (Frost et al, 1989) and also the specific-binding kinetics (Lammertsma et al, 1996; Parsey et al, 2000; Carson et al, 2000). This is consistent with the notion that more than 1-tissue compartment may be needed in nonspecific areas if low level dynamics are detectable in areas of low signal as compared with areas of high signal that are dominated by specific-binding (Turkheimer et al, 2003). For the PIB studies, it is not likely that the low-level cerebellar components corresponded to radiolabeled metabolites (Mathis et al, 2004).
Despite complexities inherent in compartmental analyses, this method allowed for the assessment of PIB plasma clearance, nonspecific uptake, and specific binding. The results served to verify that specific binding differences were not likely the result of plasma clearance or nonspecific effects. Compartmental modeling is an important step in the in vivo evaluation of a novel radiotracer before analyses by simpler regression methods that generally yield single outcomes (e.g., DV).
Graphical analyses: The Logan method performed well as it provided stable results across all regions and subjects, good test/retest reliability, and corresponded strongly to compartmental results. The Logan and MA1 cerebellar results were similar, yielded strong linear correlations that were generally greater than 0.98, and neither method yielded group differences in the CER DV.
The Logan analysis was the primary regression method applied to the regional PIB data. The DVR values in high binding areas were strongly related, while no such relationship was found between white matter and cortical DVR values. This further verifies that PIB specific binding outcomes are independent of nonspecific PIB retention in white matter. Greater PIB retention (as much as two-fold) was detected in cortical areas of AD subjects relative to controls. These differences were statistically significant in PCG, PAR, FRT, LTC, and CAU. These were areas for which intersubject variability in the Logan DVR measures (10% to 20%) was much less (Table 6) than that for the compartmental measures (Table 5) that tended to have higher variance, particularly when k4 values were small (2T-4k DV = K1/k2[1 + k3/k4]). It is likely that the degree of intersubject variability in the Logan DVR values was mostly biological, rather than methodological, since the test—retest intrasubject variability was generally much less (6% across primary PIB binding regions). For MCI subjects, the intersubject variability in the Logan DVR values was greater than for controls or AD subjects (as much as 30%), reflecting the heterogeneous nature of the MCI group (see below).
A potential problem for the Logan analysis is noise-induced bias in the outcome measure that results from the effects of noise on and between variables. Smoothing of the data before analysis has addressed this bias for other radiotracers (Logan et al, 2001; Price et al, 2002). Alternatively, the Ichise MA1 method provides a reformulation of the graphical equations that minimizes noise-induced bias. Smoothing of the PIB data did not impact the Logan results, the Logan and MA1 DV values (data not shown) were similar, and the unsmoothed Logan DVR values agreed with the compartmental measures. Altogether, this indicates that the level of noise in the PIB tissue and plasma data does not result in significant bias in the Logan slope. The Logan method can be readily applied on a voxel basis to yield robust parametric PIB DVR images (Figure 9).
Advantages of regression methods are found in computational simplicity, ease of application, performance stability, and measurement reproducibility, relative to compartmental modeling. The Logan method proved valid for regional PIB PET analyses across diagnostic groups. The kinetic results and the in vitro tissue homogenate demonstration of reversibility strongly support a reversible mechanism of PIB binding to amyloid in vivo. The lack of significant cerebellar group differences suggests future consideration of simplified reference tissue methods that obviate the need for arterial blood sampling. Efforts are ongoing in our group to validate reference tissue analyses (Logan et al, 1996; Lammertsma et al, 1996; Ichise et al, 1999) for PIB data, with careful consideration of variation in reference retention across diagnostic groups. Overall, the Logan analysis is the present method-of-choice for PIB PET data as it proved stable, valid, and promising for larger studies and voxel-based statistical analyses. We anticipate that the Logan DVR will be robust for comparisons of PIB retention across groups in longitudinal, natural history, and drug treatment studies.
Cerebellum as Reference
The cerebellum was chosen as reference region because it is notably free of fibrillar plaques in AD, although diffuse amyloid deposits that do not label with fibrillar dyes such as Congo red are commonly observed (Joachim et al, 1989; Yamaguchi et al, 1989). Although the cerebellar data for 13 of 15 subjects in the present study were fit well by a model consistent with reversible kinetics, the cerebellar data for two subjects were best described using a model consistent with constant accumulation or irreversible tissue uptake. It is unclear why these 2 subjects, a control and an AD, differed from the other 13 subjects. In these two subjects, the CER tissue:plasma ratios for the control exhibited a short and transient plateau (Logan r2 = 0.96), while the AD ratios were consistent with constant uptake (Logan r2 = 0.99). Spectral analyses showed that the very slow component was variably observed, and when present, was relatively small and never the dominant kinetic component.
Table 6 suggests that although measures of cerebellar PIB retention are not significantly different between groups, PIB cerebellar DV values may be higher in cases with high cortical PIB retention. The implication is that the use of cerebellum as a reference region could blunt DVR values in other brain areas, but this study lacks the power to conclusively address this point. It is not known at this time the extent to which PIB binding to cerebrovascular amyloid in the blood vessels of the meninges, covering the cerebellum, could contribute to the measured PET signal, particularly when PIB retention in the area is low or minimal. Also, it is possible that there will be rare late-stage AD cases with substantial fibrillar cerebellar amyloid deposition making the cerebellum a poor reference region in these subjects. Currently, we are examining voxel-based statistical analyses that covary for retention in the reference region, as part of the analysis. The partial least-squares method of McIntosh et al (1996) has proved promising for PIB PET data as it is a flexible voxel-based analysis suitable for large data sets, readily allows for covariate adjustment, can be used to extract both spatial and temporal features from the data, and may be useful as a discriminant analysis tool (Price et al, in press).
Distribution Volume Ratio as Pittsburgh Compound-B Retention Measure
The outcome measure of PIB retention used in this work was the DVR, rather than the binding potential (BP = DVR-1) that is often used in PET neuroreceptor studies. Unlike the control neuroreceptor PET signal that is a nonzero measure of baseline binding, the PIB measure in ‘true amyloid-negative’ controls should only reflect nonspecific localization across all brain areas, and yield a null BP value of 0. As a result of variability in the null BP, it is inevitable that some PIB BP values will be negative in controls. The DVR was therefore used as it provided a reliable and physiologically tenable nonnegative outcome measure that yields results that are identical to BP with respect to statistically significant group differences.
It should be noted that not all cognitively normal elderly will be ‘true amyloid-negative’ controls. Although few cognitively normal elderly below age 75 have significant amounts of brain amyloid, 25% to 40% of cognitively normal elderly above age 75 have some histological evidence of amyloid deposition in their brains at autopsy (Price and Morris, 1999; Wolf et al, 1999). Furthermore, biochemical analysis of Aβ levels in post-mortem brain stratified by an ante-mortem global assessment measure, the Clinical Dementia Rating (CDR) (Morris, 1993), have been performed in groups of AD and control subjects (Naslund et al, 2000). In these elderly subjects, with an average age near 83 years old, this study showed that combined Aβ1-40 and Aβ1-42 levels in the parietal cortex are substantial in controls (CDR = 0; 122 pmol/g tissue) and are elevated only approximately five-fold in mild-moderate AD subjects typical of those included in this study (CDR = 1; 646 pmol/g tissue).
Pattern of Pittsburgh Compound-B Retention in Alzheimer's Disease, Mild Cognitive Impairment, and Controls
Arnold et al (1991) mapped the distribution of NFT and neuritic plaques (amyloid plaques surrounded by dystrophic neurites) in the brains of patients with AD. Compared with NFT, neuritic plaques were generally more evenly distributed throughout cortex, with the exceptions of notably fewer neuritic plaques in limbic periallocortex and allocortex (areas with greatest NFT density such as the hippocampus). This appearance and distribution of amyloid is entirely consistent with the pattern observed across AD subjects and some MCI subjects in the quantitative PIB retention measures in this study and the semiquantitative measures in our previous study (Klunk et al, 2004a).
This report is the first description of in vivo amyloid deposition in MCI subjects. While the number of MCI subjects is small (n = 5), and the results must be interpreted cautiously, a finding with potentially important implications emerges. At some point in the development of AD pathology, there must be a stage at which amyloid levels are midway between typical controls and typical AD patients. It would be expected that antiamyloid therapies (e.g., passive immunization, secretase inhibitors, etc.) would be optimally effective at the earliest stages of amyloid buildup. The present findings suggest that, at the very least, MCI patients do not represent a homogeneous group that is at the very beginning or middle stages of amyloid deposition. These findings further suggest that a significant fraction of MCI subjects have amyloid pathology nearly as well established as mild-moderate AD subjects. The finding of AD-like levels of PIB retention in MCI is not particularly surprising given previous post-mortem reports of AD-like levels of amyloid deposition in some MCI subjects and some elderly subjects with normal cognition (Crystal et al, 1988; Morris et al, 1996; Goldman et al, 2001; Morris and Price, 2001). It should be noted that the MCI findings reported here do not appear to reflect an unusually severe subject cohort as the least impaired MCI subject (MCI-4; MMSE = 27) showed the greatest PIB retention. Further, the fact that 40% of the MCI subjects in this study had no evidence of amyloid deposition compared with controls is consistent with the fact that 40% to 50% of clinically diagnosed MCI subjects do not develop AD over a 10-year follow-up period and may revert to a ‘normal’ diagnosis (Larrieu et al, 2002; Ganguli et al, 2004).
Conclusion
The Logan analysis was determined to be a valid method for the quantification of PIB retention in vivo. Relative to other analyses, the Logan method was the method-of-choice as it provided stable region-of-interest results and robust parametric images, characteristics that are important for future larger PIB PET studies and voxel-based statistical analyses. This study showed a distinct difference in level and pattern of quantitative PIB retention measures in AD subjects as compared with controls. The most significant difference between AD and controls was evident in posterior cingulate, with high levels of PIB retention also noted in parietal and frontal cortices. Mild cognitive impairment subjects were heterogeneous with ‘AD-like’ or ‘Control-like’ levels of PIB retention. Quantitative measures of nonspecific PIB retention (cerebellum, white matter) were similar across groups. These studies provide promising results and show that it is feasible to perform fully quantitative amyloid imaging studies in AD and MCI patients using PIB PET that are needed to provide strong bases for the validation of simpler PIB PET methods for routine use across the AD disease spectrum.
Footnotes
Acknowledgements
The comments of our Neuroreceptor Mapping 2004 colleagues are much appreciated. The authors thank University of Pittsburgh colleagues at the ADRC (L Macedonia) and PET facility (J Ruszkiewicz, P McGeown, D Ratica, K Malone, S Kendro, N Flatt, and J Gallo) for their efforts in conducting and analyzing these studies and Dr L Weissfeld for her statistical comments. The authors are grateful to Dr S Meikle, Royal Prince Alfred Hospital, Australia, for the spectral analysis software. They also thank the volunteers and their families for their commitment to further discovery into the causes and treatment of Alzheimer's disease through their efforts in this and other related studies.