
Abstract
Delayed cerebral ischemia (DCI) following an aneurysmal subarachnoid hemorrhage (aSAH) significantly impacts mortality, morbidity, and healthcare costs. This study assessed the diagnostic accuracy of Transcranial Doppler (TCD)-derived biomarkers for predicting DCI via a systematic review and meta-analysis. Included studies had to correctly define DCI and report data on sensitivity, specificity, positive predictive value, and negative predictive value. Univariate or bivariate analyses with a random effects model were used, and risk of bias was evaluated with the Quality Assessment of Diagnostic Accuracy Studies. From 23 eligible articles (n = 2371 patients), three biomarker categories were identified: cerebral blood flow velocities (CBFV), cerebral autoregulation, and microembolic signals (MES). The highest sensitivity (0.86, 95% CI 0.71–0.94) and specificity (0.75, 95% CI 0.52–0.94) for DCI prediction were achieved with a mean CBFV of 120 cm/s combined with a Lindegaard ratio. The transient hyperemic response test showed the best performance among autoregulatory biomarkers with a sensitivity of 0.88, (95% CI 0.54–0.98) and specificity of 0.82 (95% CI 0.52–0.94). MES were less effective predictors. Combining CBFV with autoregulatory biomarkers enhanced TCD’s predictive value. High heterogeneity and risk of bias were noted, indicating the need for a standardized TCD approach for improved DCI evaluation.
Introduction
An aneurysmal subarachnoid hemorrhage (aSAH) is a severe type of stroke accounting for 2–7% of all strokes, 1 with mortality rates ranging from 40% to 60%. 2 The high mortality rate is directly related to the consequences of the initial bleeding and rebleeds, as well as the secondary complications of aSAH, particularly delayed cerebral ischemia (DCI). DCI is defined as a late-onset new neurological deficit or decrease in Glasgow Coma Scale (GCS) of at least two points lasting for a minimum of one hour, after exclusion of other causes (clinical definition), and may be associated with radiological signs of ischemia (radiological definition). This definition was based on the consensus statement by Vergouwen et al. 3 To date, DCI is still the most significant predictor of in-hospital mortality, 4 and is also associated with prolonged hospital stays, 5 higher rates of worse functional outcomes, 6 and increased costs of care. 5
Diagnosing DCI is relatively straightforward in aSAH patients that are awake. It remains highly challenging, however, in comatose or sedated patients, or patients suffering from multiple complications at the same time. This potentially results in underreporting of DCI. 7 Consequently, this also impedes timely application of therapeutic strategies such as induction of hypertension or volume optimization for the prevention of ischemia. 8 A sensitive tool for early detection of DCI could assist physicians in triaging patients more efficiently, and in identifying groups requiring more intensive neuromonitoring and rescue therapies. 9
A commonly applied diagnostic tool in the management of aSAH and DCI is transcranial Doppler (TCD) ultrasonography. TCD is a non-invasive bedside modality that uses low-frequency ultrasound waves to estimate cerebral blood flow velocities (CBFV) within the large cerebral arteries. 10 A clear advantage of this diagnostic tool is its ability to monitor hemodynamic changes over time by repetitive measurements at the bedside. Commonly known disadvantages of TCD are the absence of adequate temporal bone window in up to 10% of all patients, and its operator-dependent nature. 11 TCD use has dramatically decreased in the last two decades, owing to the paradigm shift refuting large vessel vasospasms as the sole cause of DCI. 9 Indeed, it has become evident that DCI is the product of a complex interplay of microvascular mechanisms. 12 Despite a plethora of research on the validity of TCD for the detection of vasospasms, research evaluating the accuracy of TCD for the prediction of DCI is sparse and inconsistent, mainly owing to the heterogeneity of the applied definitions of DCI. 13
Using TCD, a myriad of biomarkers can be assessed. 14 The objective of this systematic review was to identify relevant TCD-derived biomarkers that can specifically aid in the prediction of DCI, and to evaluate their predictive value.
Material and methods
This systematic review was performed and drafted in accordance with the PRISMA guidelines.
Search strategy
A comprehensive search was carried out in October 2023 in MEDLINE, Scopus, Web of Science, EMBASE, and the Cochrane databases, as well as in the Clinicaltrials.gov registry. The words “subarachnoid hemorrhage” and “transcranial Doppler ultrasonography” were used as key words. The terms “delayed cerebral ischemia”, “delayed ischemic neurologic deficit”, “secondary cerebral ischemia”, “delayed cerebral infarction” and “delayed neurologic deficit” were combined using the Boolean operator “OR”. Where applicable, the following filters were applied: involving human subjects, time of publication between January 1st 2000 and October 16th 2023, English language, journal article (not review) and “Medicine”/“Neuroscience” (Supplementary data 1). We focused on the above-mentioned time period to target studies conducted after the paradigm shift in the pathophysiological concept of DCI, and consequently its definition, which occurred about twenty years ago. Before this time period, DCI and vasospasms were interchangeable concepts that were mainly called ‘vasospasm’ in aSAH literature. Titles and abstracts from articles that fulfilled the initial search criteria were imported into a specialized AI-based software (Rayyan, www.rayyan.ai) for further screening. Screening for eligibility was performed by two independent investigators (HS and CC). In case of disagreement, the article was discussed between the two investigators until an agreement could be reached. Duplicates were identified and deleted accordingly. Articles were included if they were available in English, described the use of TCD in aSAH patients, and clearly included a definition of DCI in accordance with the statement by Vergouwen et al. 3 Reviews (systematic reviews, narrative reviews, meta-analyses), case-reports, commentaries, conference abstracts and experimental studies involving animals were excluded. Finally, articles solely investigating the value of TCD to predict vasospasms were excluded as well.
Data extraction and risk of bias
Two authors (HS and CC) independently extracted data from the selected reports into separate data forms. Each data form included author, year of publication, the definition of DCI that was used (clinical, radiological, or both), number of included patients, number of patients with DCI, general patient characteristics (sex and age), TCD protocol (TCD type duplex/non-duplex), timing, frequency, TCD biomarker of interest, and data related to the biomarker’s sensitivity, specificity, positive predictive value (PPV), negative predictive value (NPV), and/or receiving operating curves (ROC). In case of missing data, authors of the articles were contacted.
Additionally, risk of bias (RoB) was assessed independently by two authors (HS and CC) using the “Quality Assessment of Diagnostic Accuracy Studies” (QUADAS-2) guideline. 15 The risk of bias and applicability were separately evaluated for four domains: 1) “patient selection” (aSAH patients), 2) “index test” (TCD), 3) “reference standard” (DCI, diagnosed by means of clinical examination and/or radiologically), and 4) “flow and timing”. The evaluations of the two independent investigators were compared, and in case of disagreement, a third investigator (RH) was consulted to reach an agreement.
Key transcranial Doppler terminology
We shortly discuss key TCD terminology necessary for the appraisal of the biomarkers that were found in this review.
When combined with imaging, TCD is referred to as transcranial (TC) duplex.
The mean flow velocity (MVF) is defined as the averaged velocity, calculated using the formula: MFV = (Peak Systolic Velocity + 2 × End Diastolic velocity)/3, 16 whereby the instantaneous peak velocity during systole is referred to as the peak systolic velocity (PSV), while the velocity in late diastole is referred to as the end diastolic velocity (EDV). 17 In modern TCD use, the envelope of the spectral waveform representing the instantaneous flow velocity over a cardiac cycle is used to obtain the time-averaged mean velocity (TAMV), sometimes also referred to as the time averaged peak velocity (TAPV).
Cerebral vasospasm is defined as reversible narrowing of the cerebral blood vessels. 18 A decrease in the diameter of a vessel lumen causes an increase in blood flow resistance, which subsequently can lead to an increase in CBFV, detected by TCD. 18 As DCI and vasospasms are often mistakenly used interchangeably, 19 we use the term “arterial narrowing” in this review to refer to vasospasms to increase clarity.
The Lindegaard ratio (LR) is obtained by dividing the MFV in the middle cerebral artery (MCA) with the MFV in the ipsilateral extracranial internal carotid artery. 20 It is implemented to evaluate the presence of arterial narrowing while correcting for changes in volume and hemodilution. Its use is not widely accepted and therefore, heterogeneity exists in reports describing the presence of arterial narrowing.
The transient hyperemic response test (THRT) is based on a brief compression of the common carotid artery over 5–9 seconds to determine the transient hyperemic response ratio (THRR). This ratio represents the average of the first three consecutive flow velocity values measured in the MCA after release of the short common carotid artery compression, relative to the flow velocity before compression. 21 A THRR ≤1.09 is used to indicate impaired dynamic cerebral autoregulation (CA). 22
Another method to assess dynamic CA is the systolic flow index (Sxa), calculated as the moving linear correlation coefficient between 10 seconds-averaged values of systolic CBFV and mean arterial blood pressure (ABP). It can be used to estimate continuous dynamic CA status with its upper and lower limits. 21 The mean flow index (Mxa) is the moving correlation coefficient between the 10 seconds-averaged mean CBFV and the mean ABP, 23 with a correlation coefficient close to 0 (or negative) indicating preserved CA and more positive correlation coefficients indicating impaired CA.
Static cerebrovascular reactivity (sCVR) reflects the ability of vascular smooth muscle cells to react to a stimulus. It can be calculated by the maximum percentage change in MFV in the MCA after administration of 1 g acetazolamide, causing dilation of the cerebral arterioles. 24
Finally, microembolic signals (MES) are brief, high-intensity transient signals originating from particulate microemboli or gaseous microbubbles. Criteria for the identification of MES were developed by the Consensus Committee in 1995. 25
Statistical analysis
The TCD-derived biomarkers we obtained were either nominal biomarkers, classifying patients as having a positive or negative test, or continuous biomarkers as determined by the measurement of a certain CBFV threshold. For the former, a univariate model was applied, and sensitivity, specificity, PPV and NPV were summarized in forest plots with 95% confidence intervals. We applied the random effects meta-analysis, unless absence of excess heterogeneity was demonstrated. Sub-group analyses were performed based on the definition of DCI, which could be classified as clinical, radiological, clinical and radiological, or clinical and/or radiological.
For biomarkers measured on a continuous scale (CBFV), a bivariate analysis using the random effects model was applied to pool sensitivity and specificity simultaneously. Studies that used various CBFV thresholds depending on the location of insonation but reported only one combined sensitivity and specificity were excluded. The ‘optimal’ cut-off point resulting in the highest sensitivity and specificity was obtained with 95% confidence intervals. The summary receiver operating curve (SROC) was constructed to visualize the trade-off between sensitivity and specificity across different diagnostic thresholds. Survival curves were created plotting the probability of a positive test at different thresholds. Youden’s index, calculated as sensitivity+specificity-1 was obtained for each threshold, and the maximum value of the corresponding function was used as the ‘optimal’ cut-off. Outliers were identified and sensitivity analysis was performed accordingly.
When a biomarker was only reported once, or when the applied technique strongly differed from other articles, the sensitivities, specificities, PPV and NPV were reported in a table but not pooled for synthesis.
All analyses were performed in R Studio (4.1.3) using the “meta” and “diagmeta” packages (Supplementary data 2). The protocol for this review was not prepared and registered.
Publication bias and heterogeneity
Statistical heterogeneity was quantified as I2. Values of 25%, 50% and 75% were considered indicative of low, moderate and high heterogeneity, respectively. τ was used to quantify the amount of between-study variance in effect sizes that cannot be explained by chance alone. A p-value below 0.05 indicated evidence of substantial statistical heterogeneity. Visual inspection of SROCs was used to identify outliers or studies that highly impacted the results. These outliers were further investigated by means of sensitivity analysis to assess their impact on the results.
Results
Selection process
The search strategy and selection of articles is outlined in Figure 1. After removal of duplicates, 1784 records were screened for eligibility. Of these, 1728 records were excluded because the study did not include the intended outcome measure (n = 1219) or population (n = 486), or appeared as a wrong type of publication (n = 23). Ultimately, the full text of 56 articles was further screened, after which 23 articles (n = 2371 patients) met the inclusion criteria.
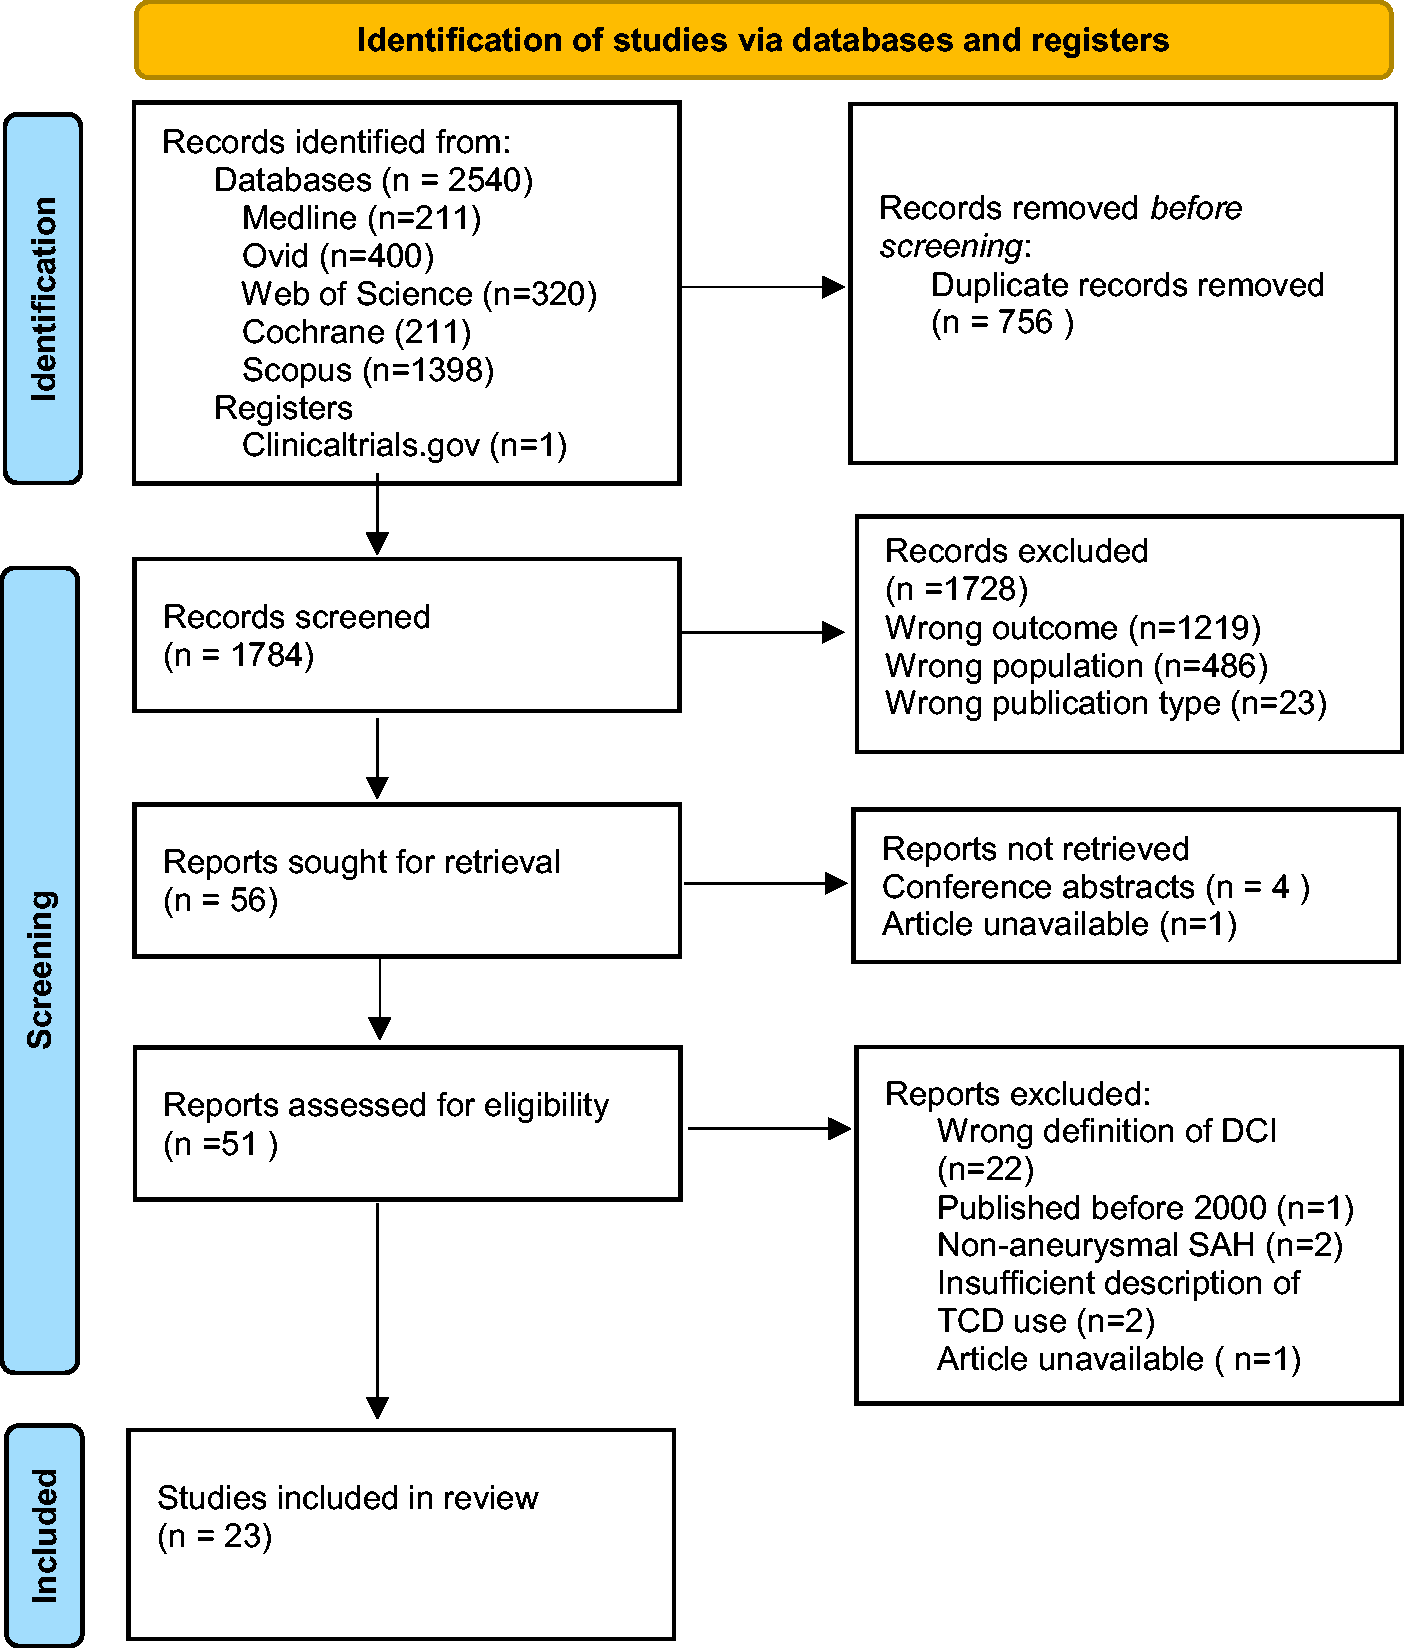
Flowchart of the selection of articles.
The included studies were prospective (n = 16) or retrospective (n = 7) cohort studies. The clinical definition of DCI was used in 6 (23%) studies, whereas the radiological definition was used in another 6 (23%) studies, and both definitions were used in 3 (13%) studies. In addition, 8 (35%) studies considered DCI as the presence of clinical DCI and/or radiological signs of ischemia. Our search yielded three types of TCD-derived biomarkers: 1) CBFV (absolute values and relative changes, n = 20), 2) dynamic CA and sCVR biomarkers (n = 8), and 3) MES (n = 2) (Table 1). The categories were not exclusive.
Descriptive table of the included studies.
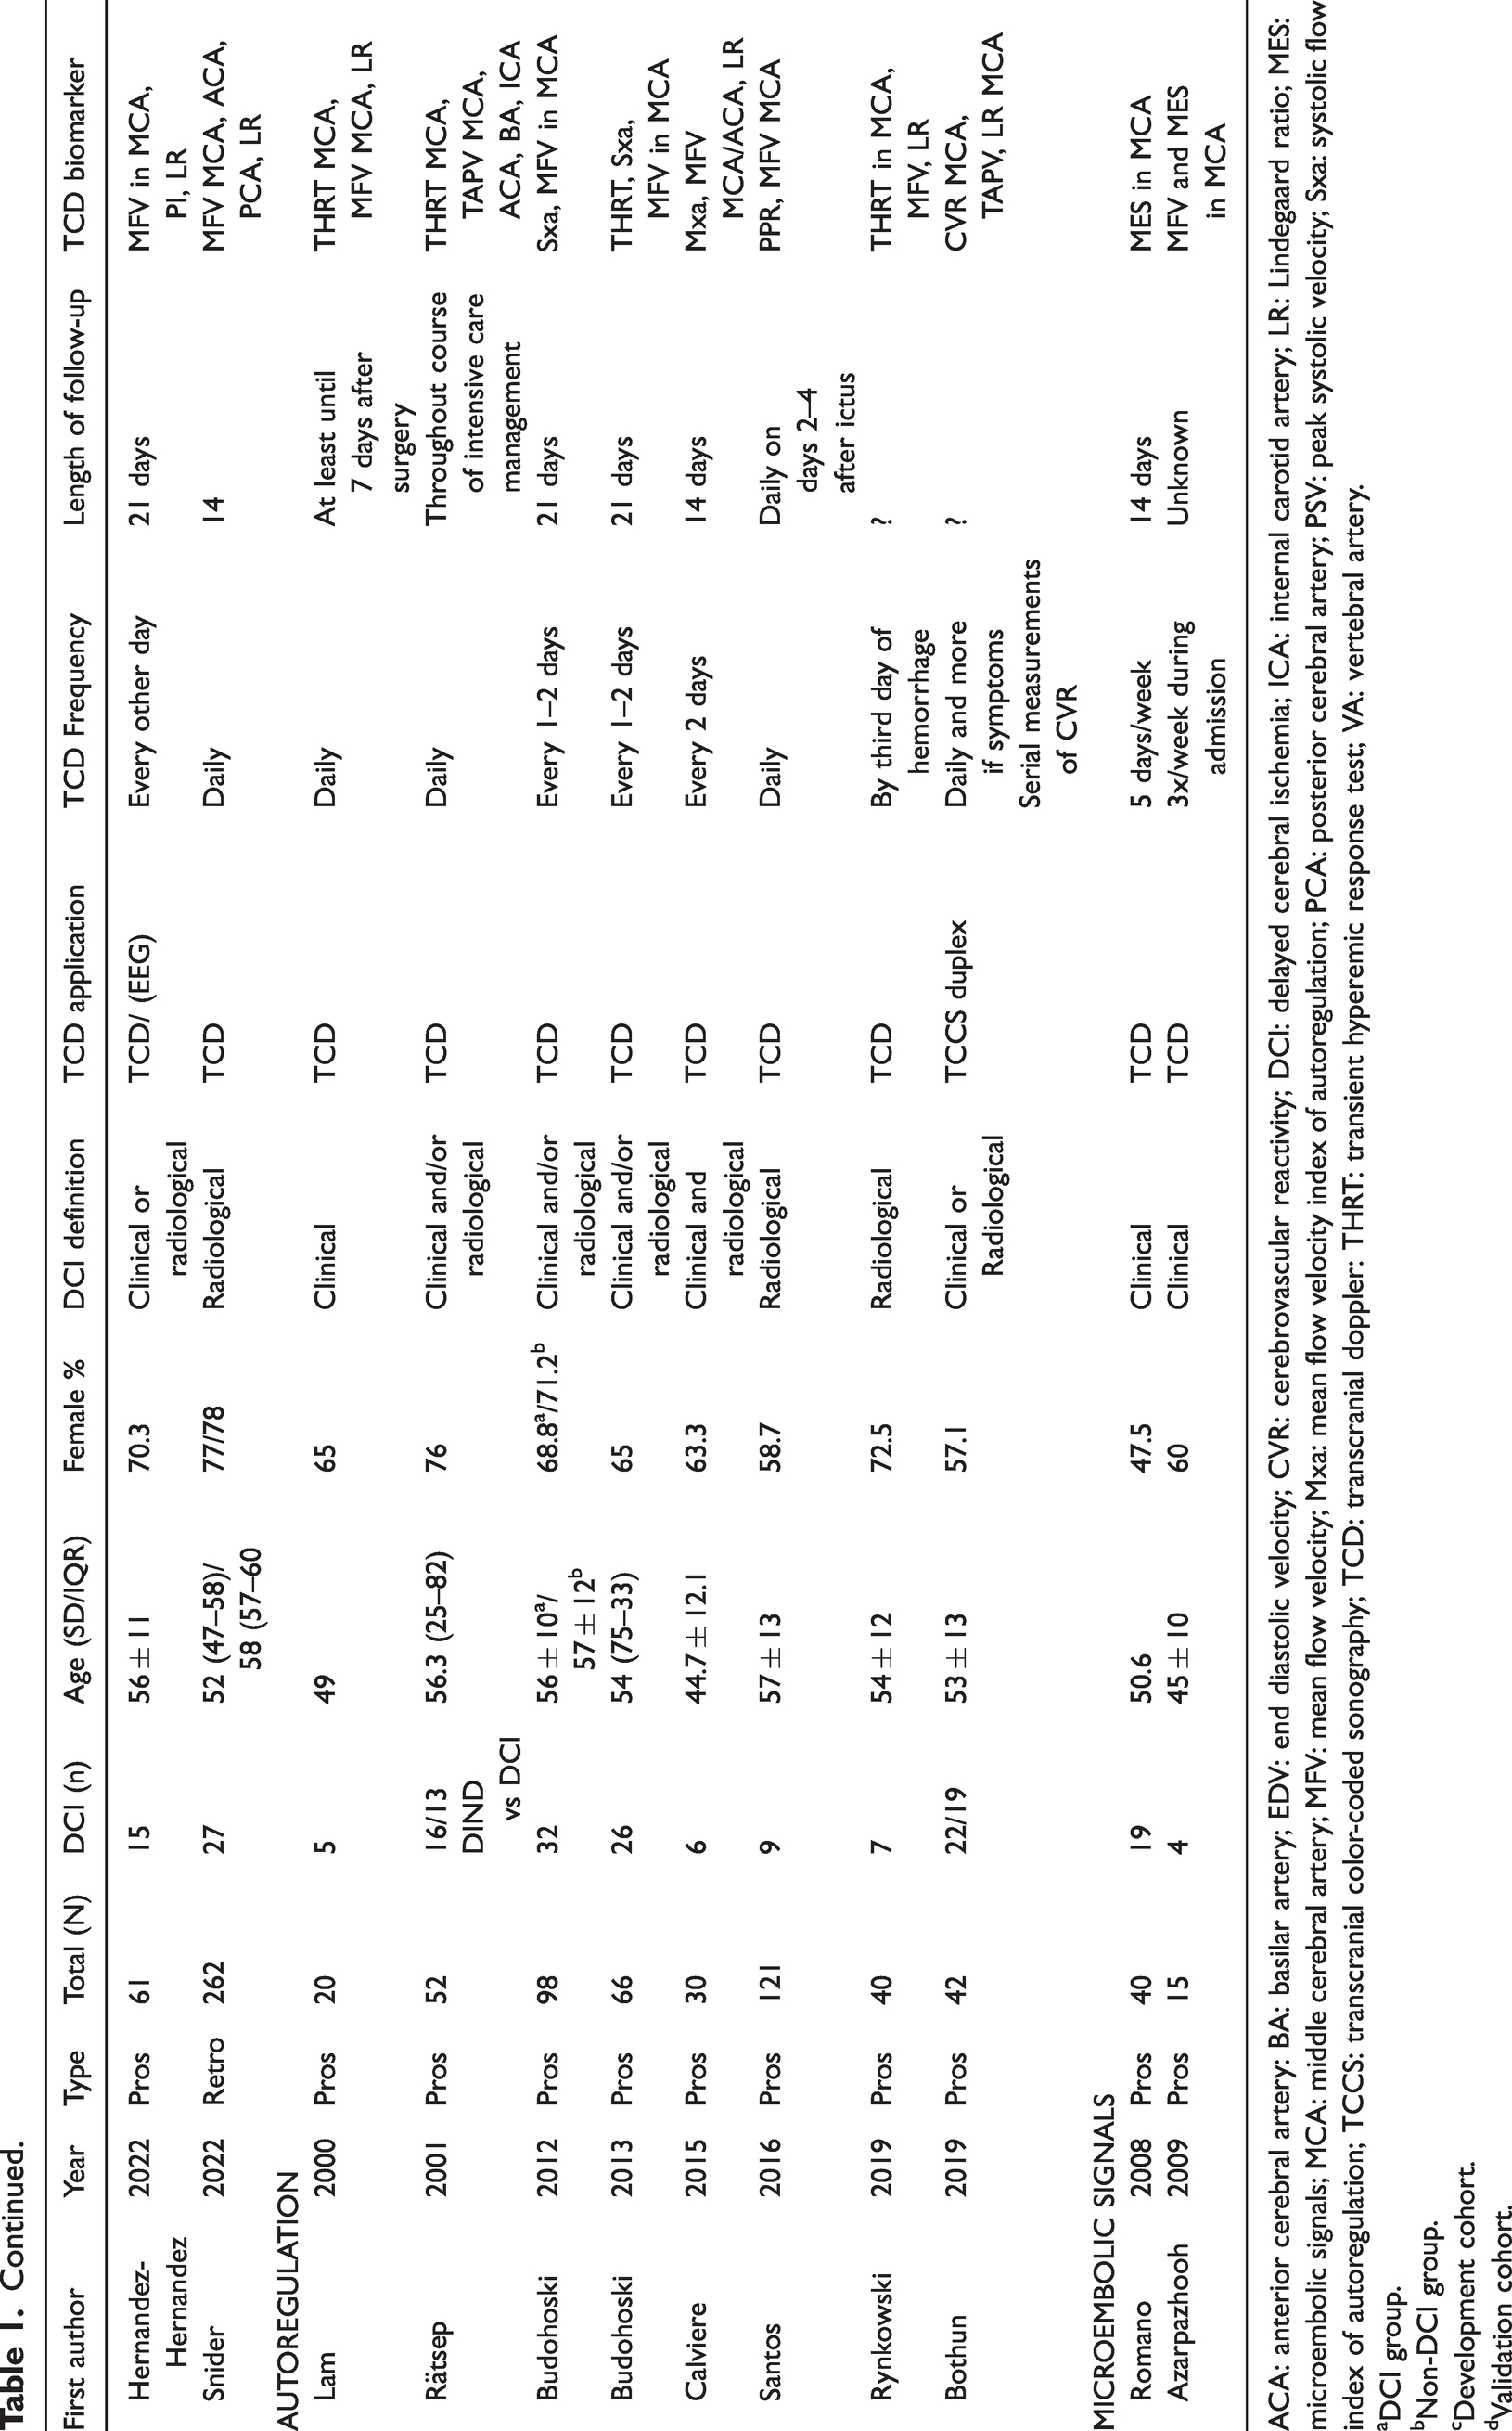
ACA: anterior cerebral artery: BA: basilar artery; EDV: end diastolic velocity; CVR: cerebrovascular reactivity; DCI: delayed cerebral ischemia; ICA: internal carotid artery; LR: Lindegaard ratio; MES: microembolic signals; MCA: middle cerebral artery; MFV: mean flow velocity; Mxa: mean flow velocity index of autoregulation; PCA: posterior cerebral artery; PSV: peak systolic velocity; Sxa: systolic flow index of autoregulation; TCCS: transcranial color-coded sonography; TCD: transcranial doppler: THRT: transient hyperemic response test; VA: vertebral artery.
DCI group.
Non-DCI group.
Development cohort.
Validation cohort.
Evaluation of bias and applicability
Evaluation of RoB revealed that almost 57% of the selected studies had a high risk of selection bias (Supplementary figure 1). Generally, this high risk originated from the selection of patients with narrowly defined inclusion criteria, limiting the generalizability of results. Inclusion criteria assigned patients to specific World Federation of Neurosurgery (WFNS) categories either in favor of patients that were mildly affected by aSAH, or conversely, patients with a poor prognosis score, influencing the a priori likelihood of developing DCI. Other examples include patients that underwent a single specific kind of intervention, i.e., either only endovascular or surgically treated aneurysms, or patients with certain characteristics enabling them to undergo certain tests, e.g., patients without a carotid stenosis. The RoB regarding the index test (i.e., TCD procedure) was judged to be unclear in 65% of cases, which was frequently related to the fact that the physician performing the TCD test was involved in the diagnosis of DCI. The reference standard (the diagnosis of DCI) was well described, yet uncertainties arose regarding whether DCI was diagnosed independently of TCD results.
Cerebral blood flow velocity-based biomarkers (n = 2144 patients)
Twenty studies used CBFV as a biomarker of interest for the prediction of DCI. Two studies used TC Duplex, while in another study, both TCD and TC Duplex were used; in the remaining studies, only TCD was applied. Seventeen studies used the MFV, of which two studies specifically employed the TAPV, whereas three used absolute PSV to predict DCI (Supplementary table 1–2). Two other studies explored the diagnostic accuracy of relative changes in CBFV over time for the prediction of DCI (Supplementary table 3). Notably, different thresholds of MFV, TAPV and PSV for the prediction of DCI were used (>90 cm/s, >120 cm/s, >150 cm/s, 160 cm/s, 200 cm/s), and different arteries were insonated, either solely focusing on the MCA, or also including other intracranial arteries with varying velocity thresholds.
Mean flow velocities
Ten studies solely measured the MFV in the MCA, two studies measured the MFV in both the anterior cerebral artery (ACA) and the MCA, and five studies insonated arteries both in the anterior and posterior circulation. In all these studies, an increase in MFV was measured to detect arterial narrowing, which in turn was used to predict DCI. Among these studies, only eight required the LR to be above 3 to predict DCI. The applied thresholds ranged from 90 to 200 cm/s (Supplementary table 1). Four studies used different velocity thresholds depending on the insonated artery, while only providing one summary sensitivity and specificity. These studies were excluded from further analysis to obtain the optimal-cutoff value for the best prediction of DCI.
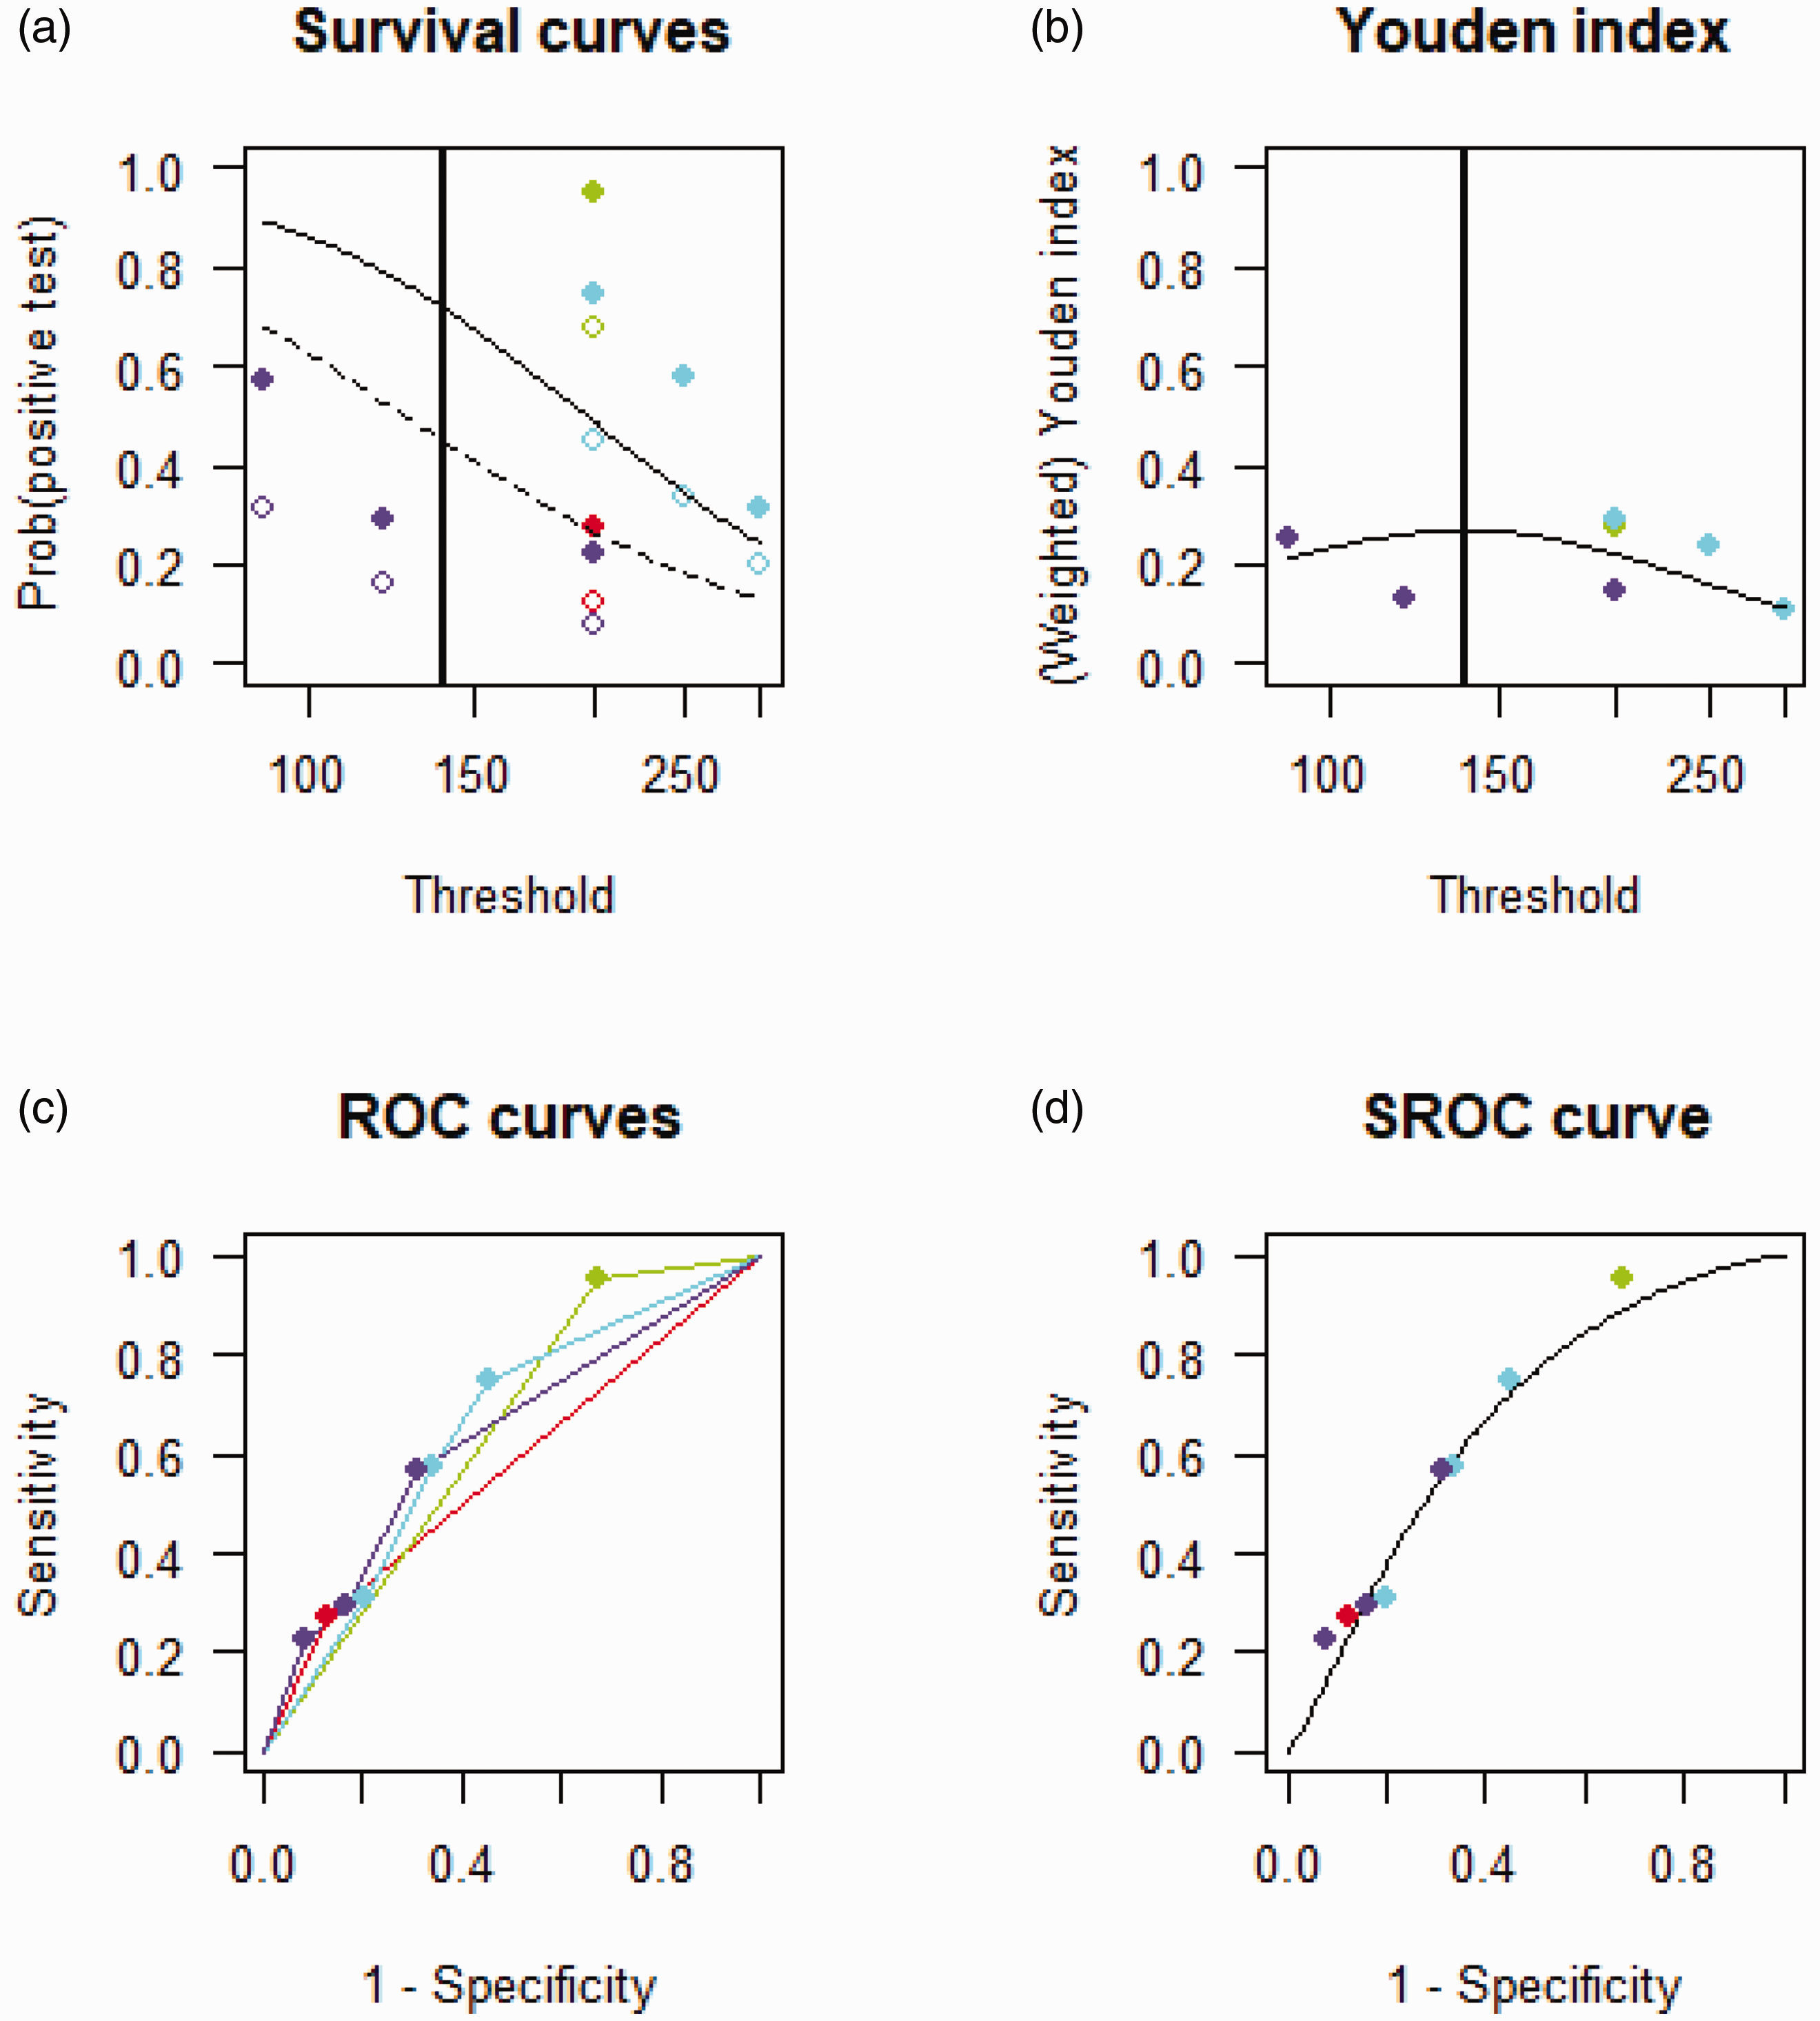
When pooling studies that employed different thresholds of CBFV to predict DCI without using the LR (n = 6 studies), and after sensitivity analysis excluding the study by Carrera et al., 26 an ‘optimal’ cut-off was found to be 157 cm/s, with a sensitivity of 0.47 (95% CI 0.23–0.74) and specificity of 0.80 (95% CI 0.62–0.90), and an AUC of 0.65 (95% CI 0.22–0.74) (Figure 2). Carrera et al. 24 was the only study measuring CBFV in the anterior and posterior circulation, whereas the other studies solely focused on the anterior circulation.
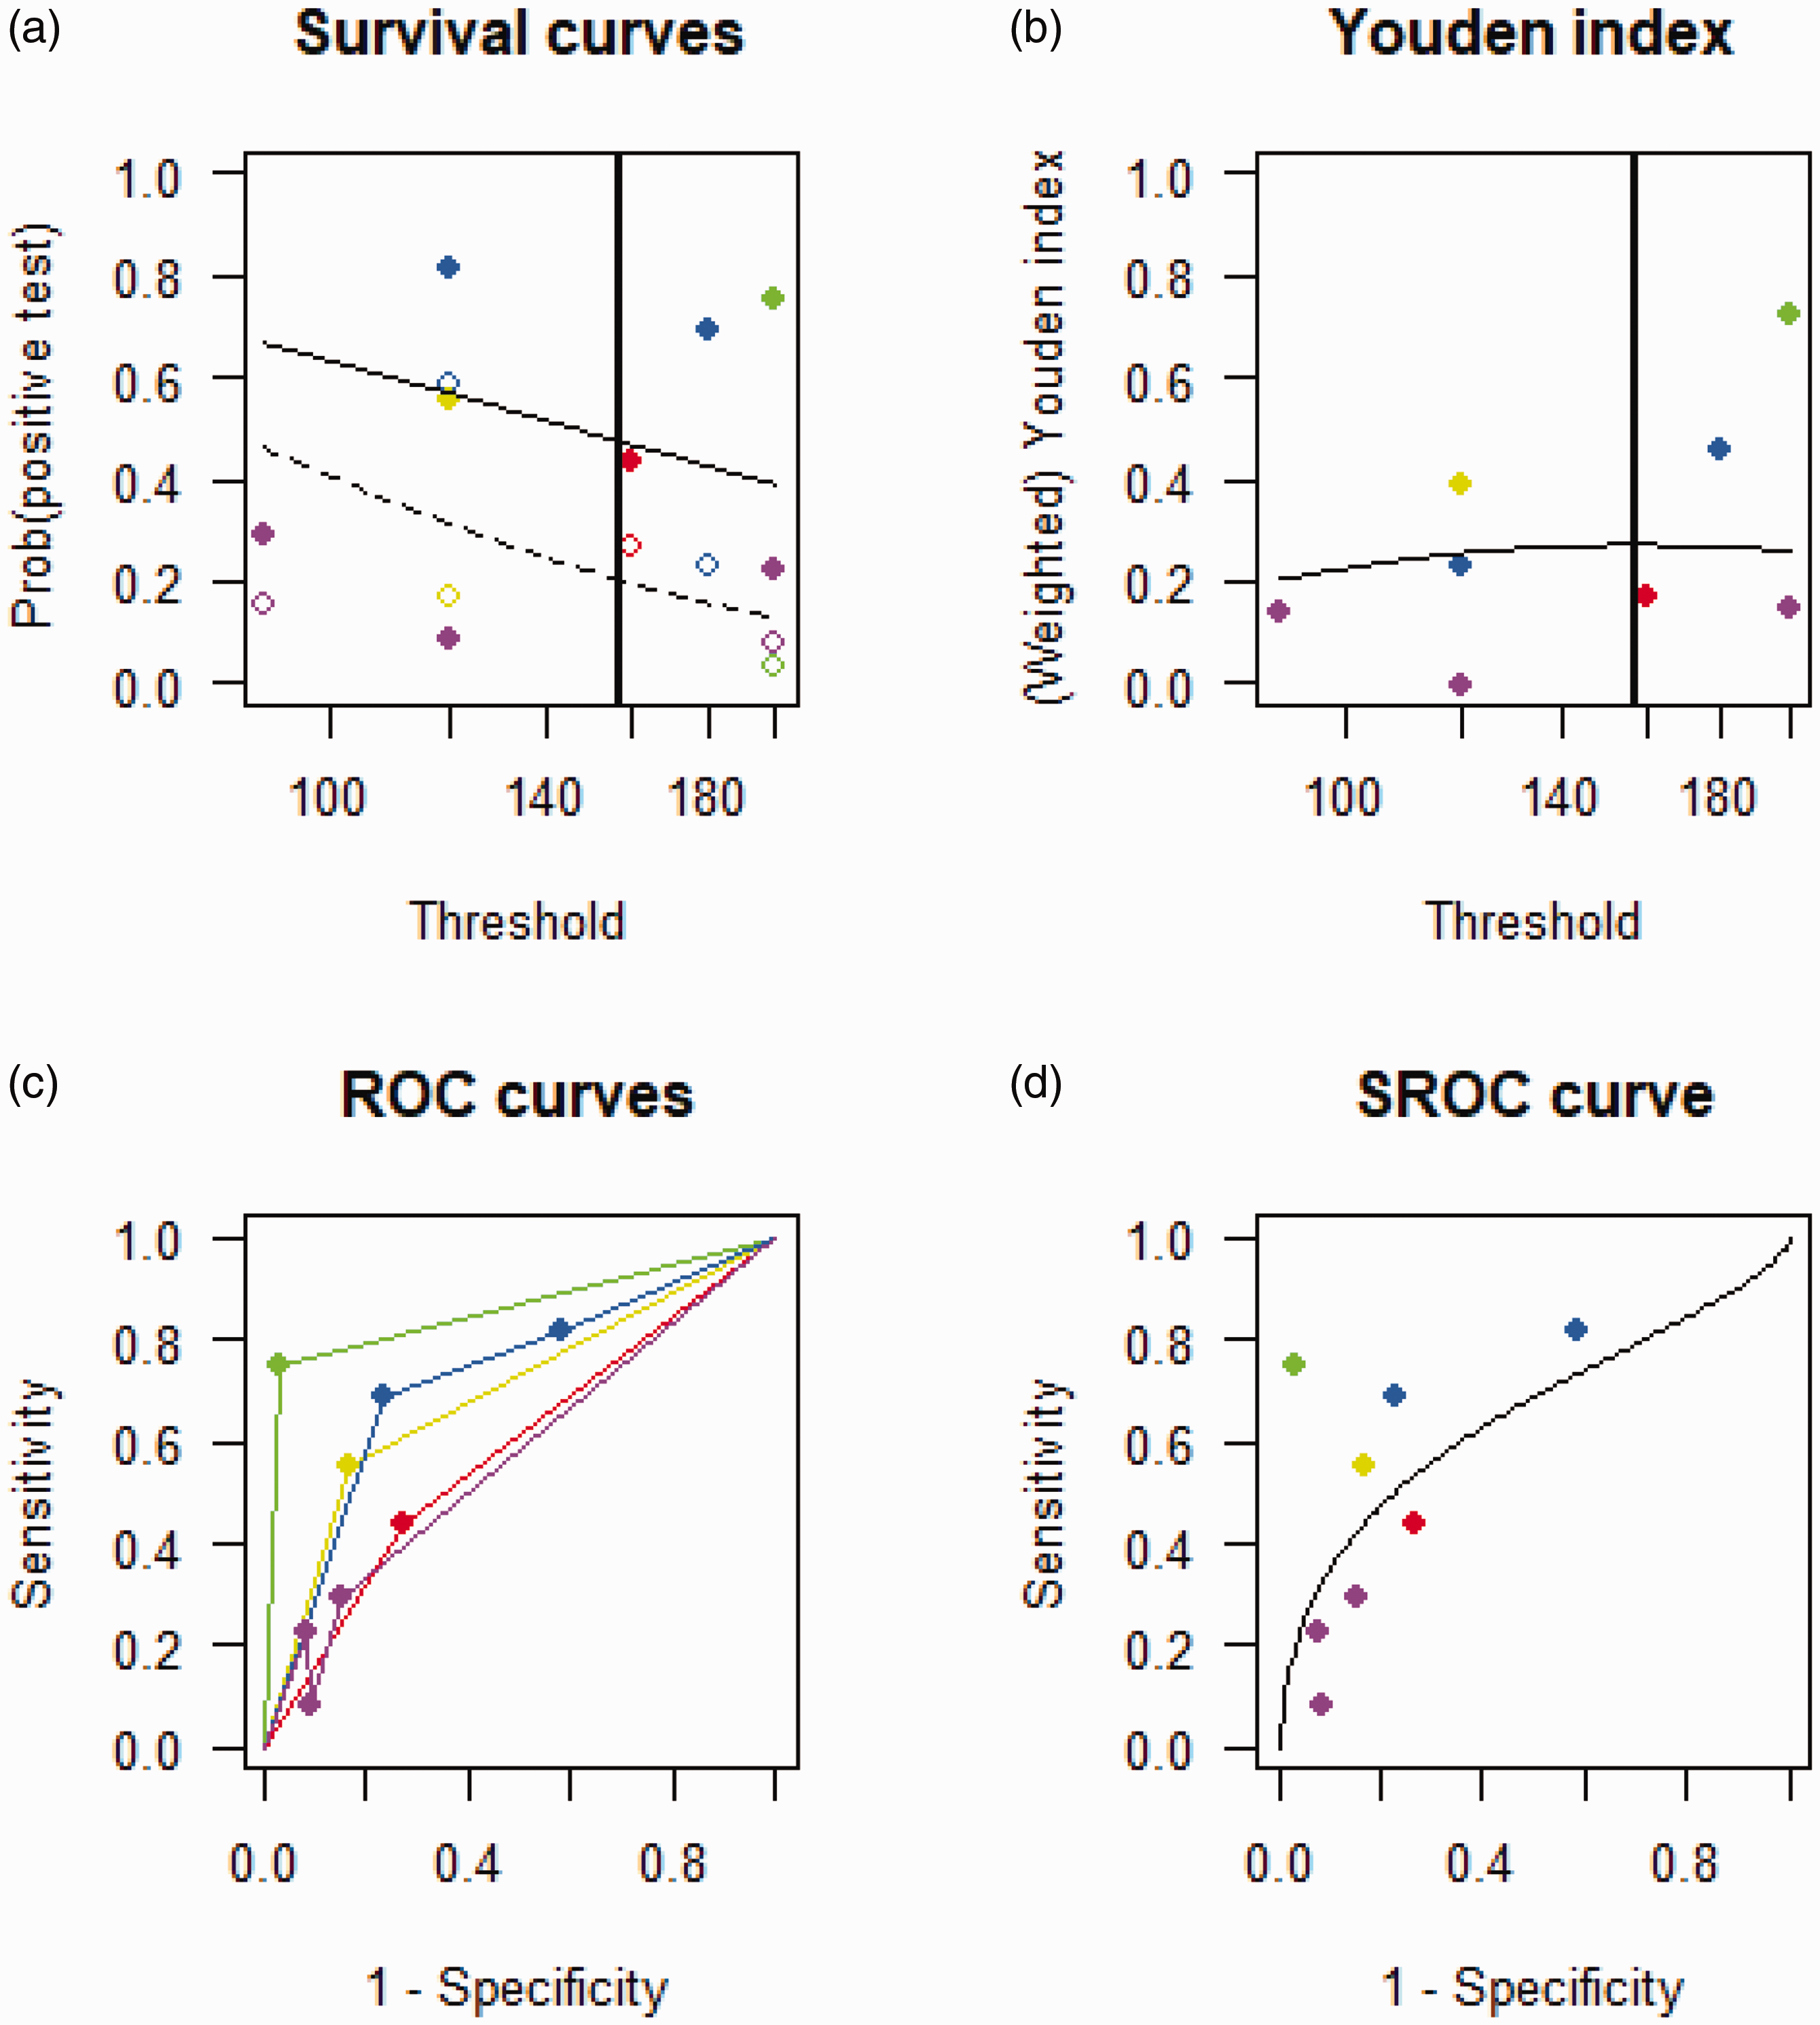
Summary receiving operating curve of studies investigating the use of MFV for the prediction of DCI after exclusion of the study by Carrera et al. (a) Survival curve showing the probability of a positive test across different velocity thresholds with the diseased and non-diseased represented by a solid and dashed line respectively. (b) Youden’s index calculated for each velocity threshold and (c and d) ROCs of the individual studies and SROC combining all studies. DCI: delayed cerebral ischemia; MFV: mean flow velocity; ROC: receiving operating curve: SROC: summary receiving operating curve.
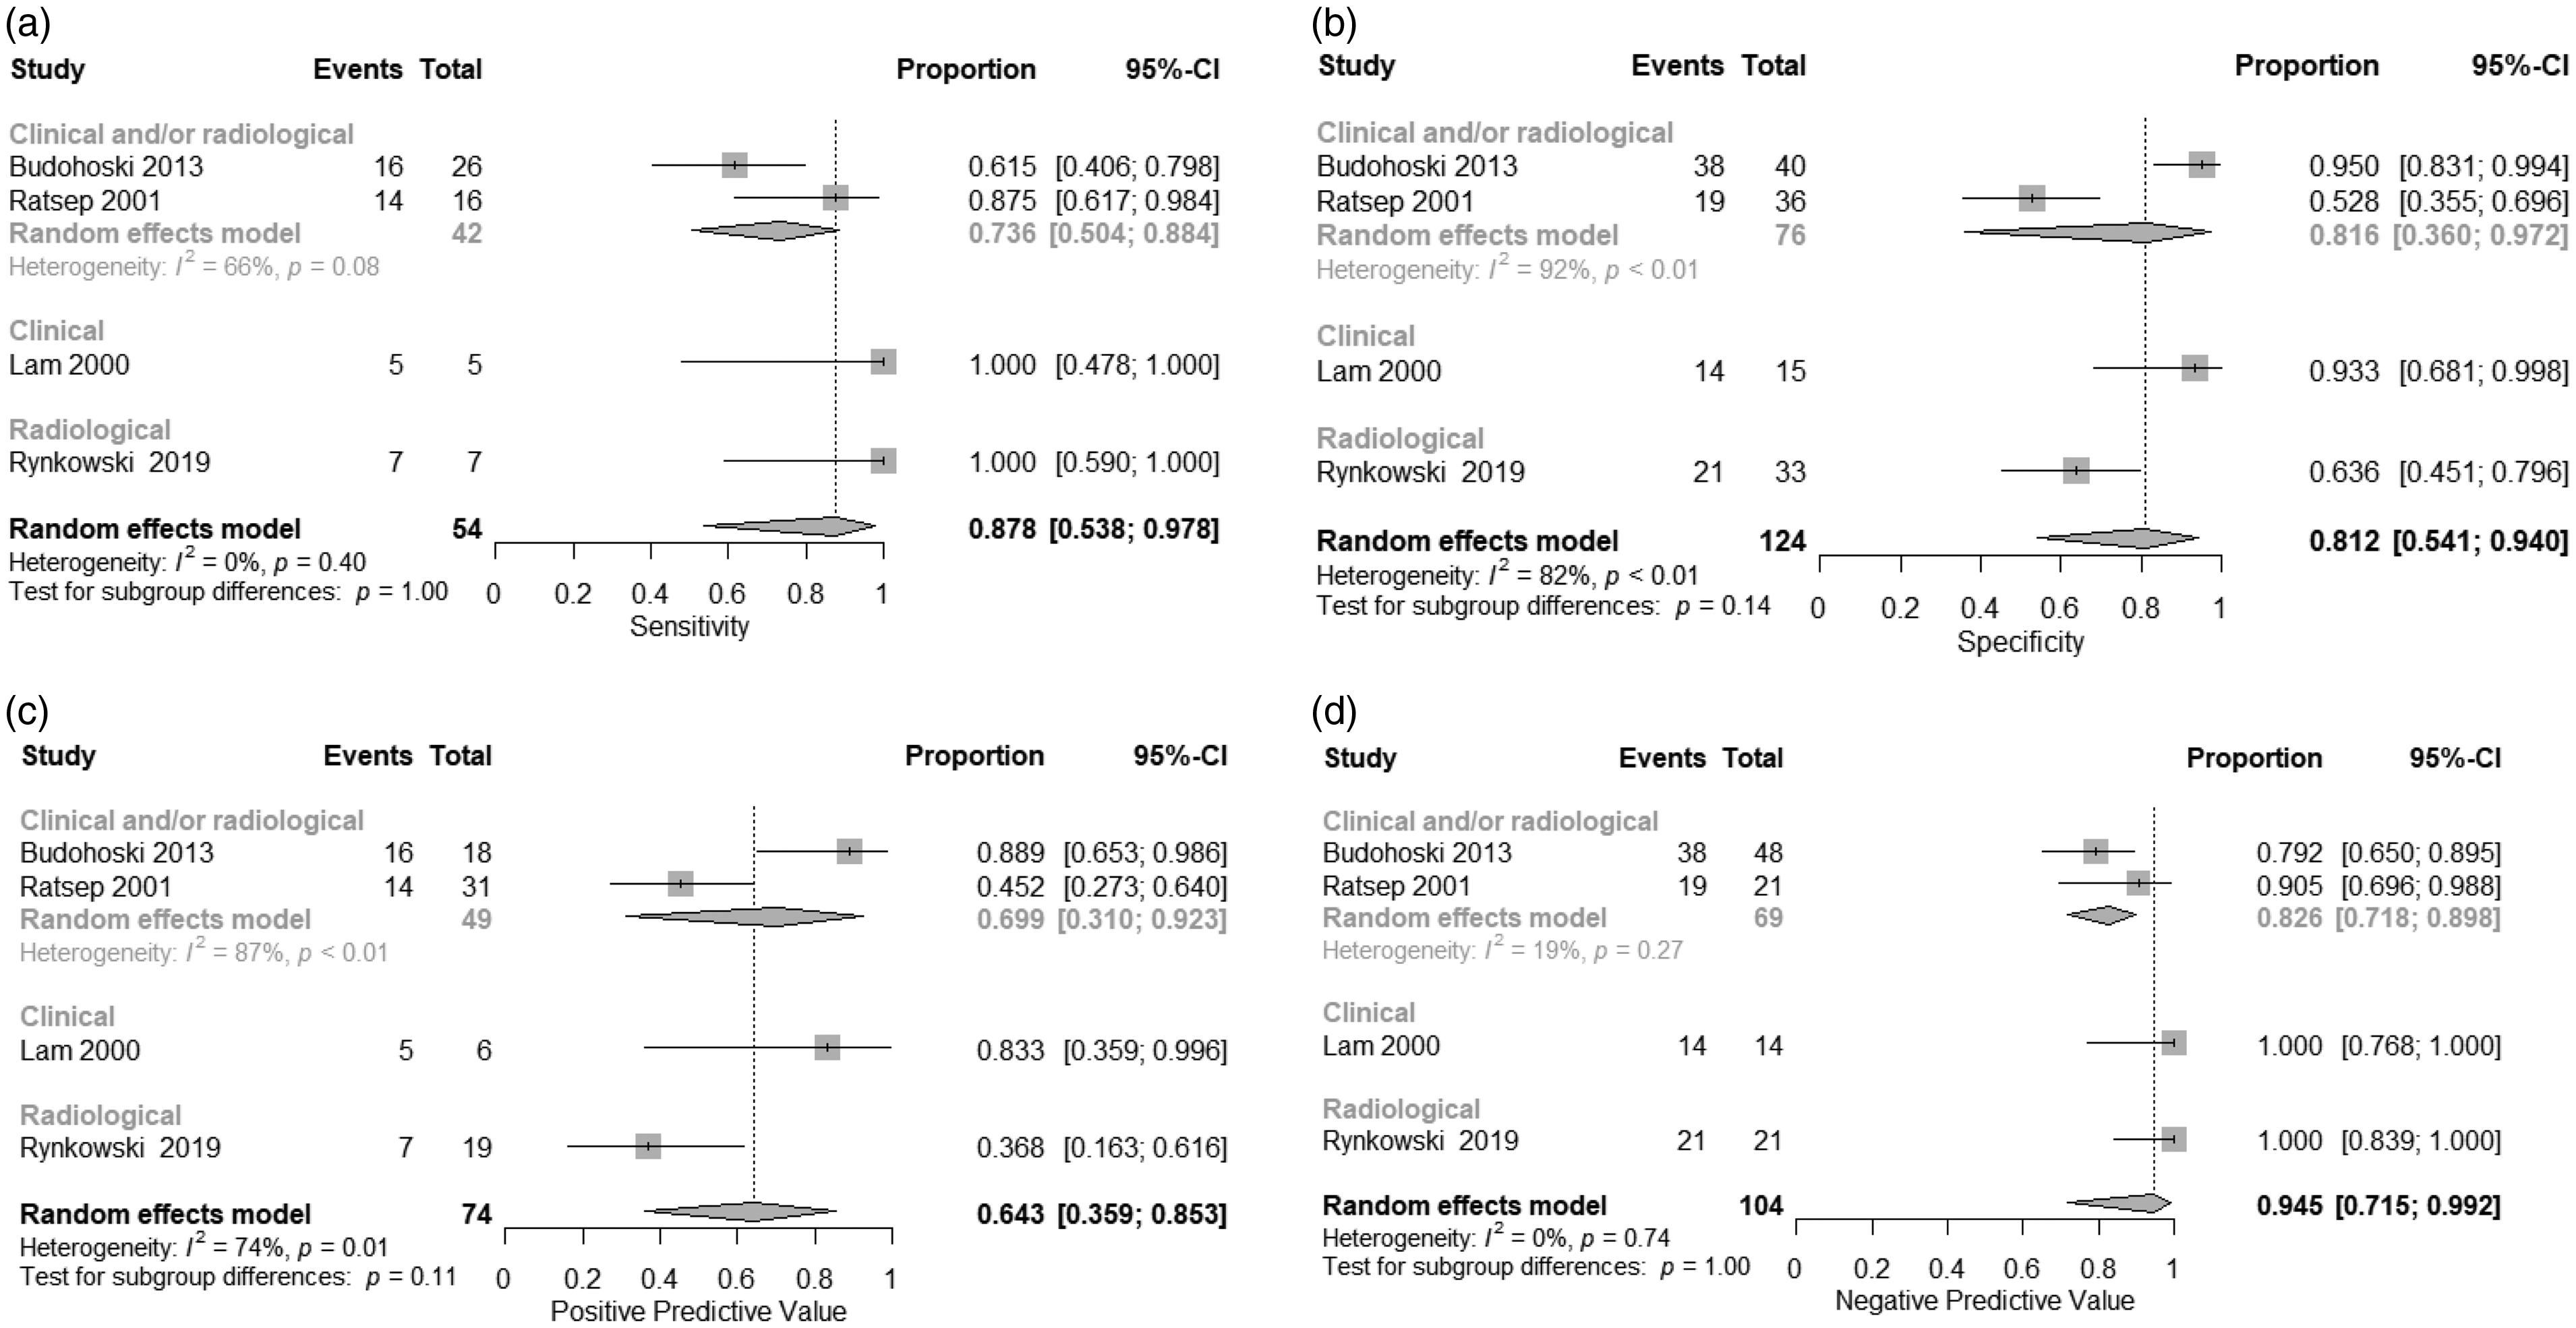
The pooled sensitivity, specificity, PPV, and NPV of studies using an MFV cut-off of 120 cm/s measured in the MCA in combination with a LR > 3 to predict DCI were 0.86 (95% CI 0.71–0.94), 0.75 (95% CI 0.56–0.87), 0.58 (95% CI 0.43–0.73), and 0.91 (95% CI 0.85–0.95), respectively (Figure 3). Sub-group analyses based on the applied DCI definition (clinical and/or radiological) did not reveal statistically significant differences between groups for all summary statistics. Heterogeneity was moderate to high (I2 = 52%, p = 0.04) and specificity (I2 = 85%, p < 0.01), as well as for the PPV (I2 =55%, p = 0.03).
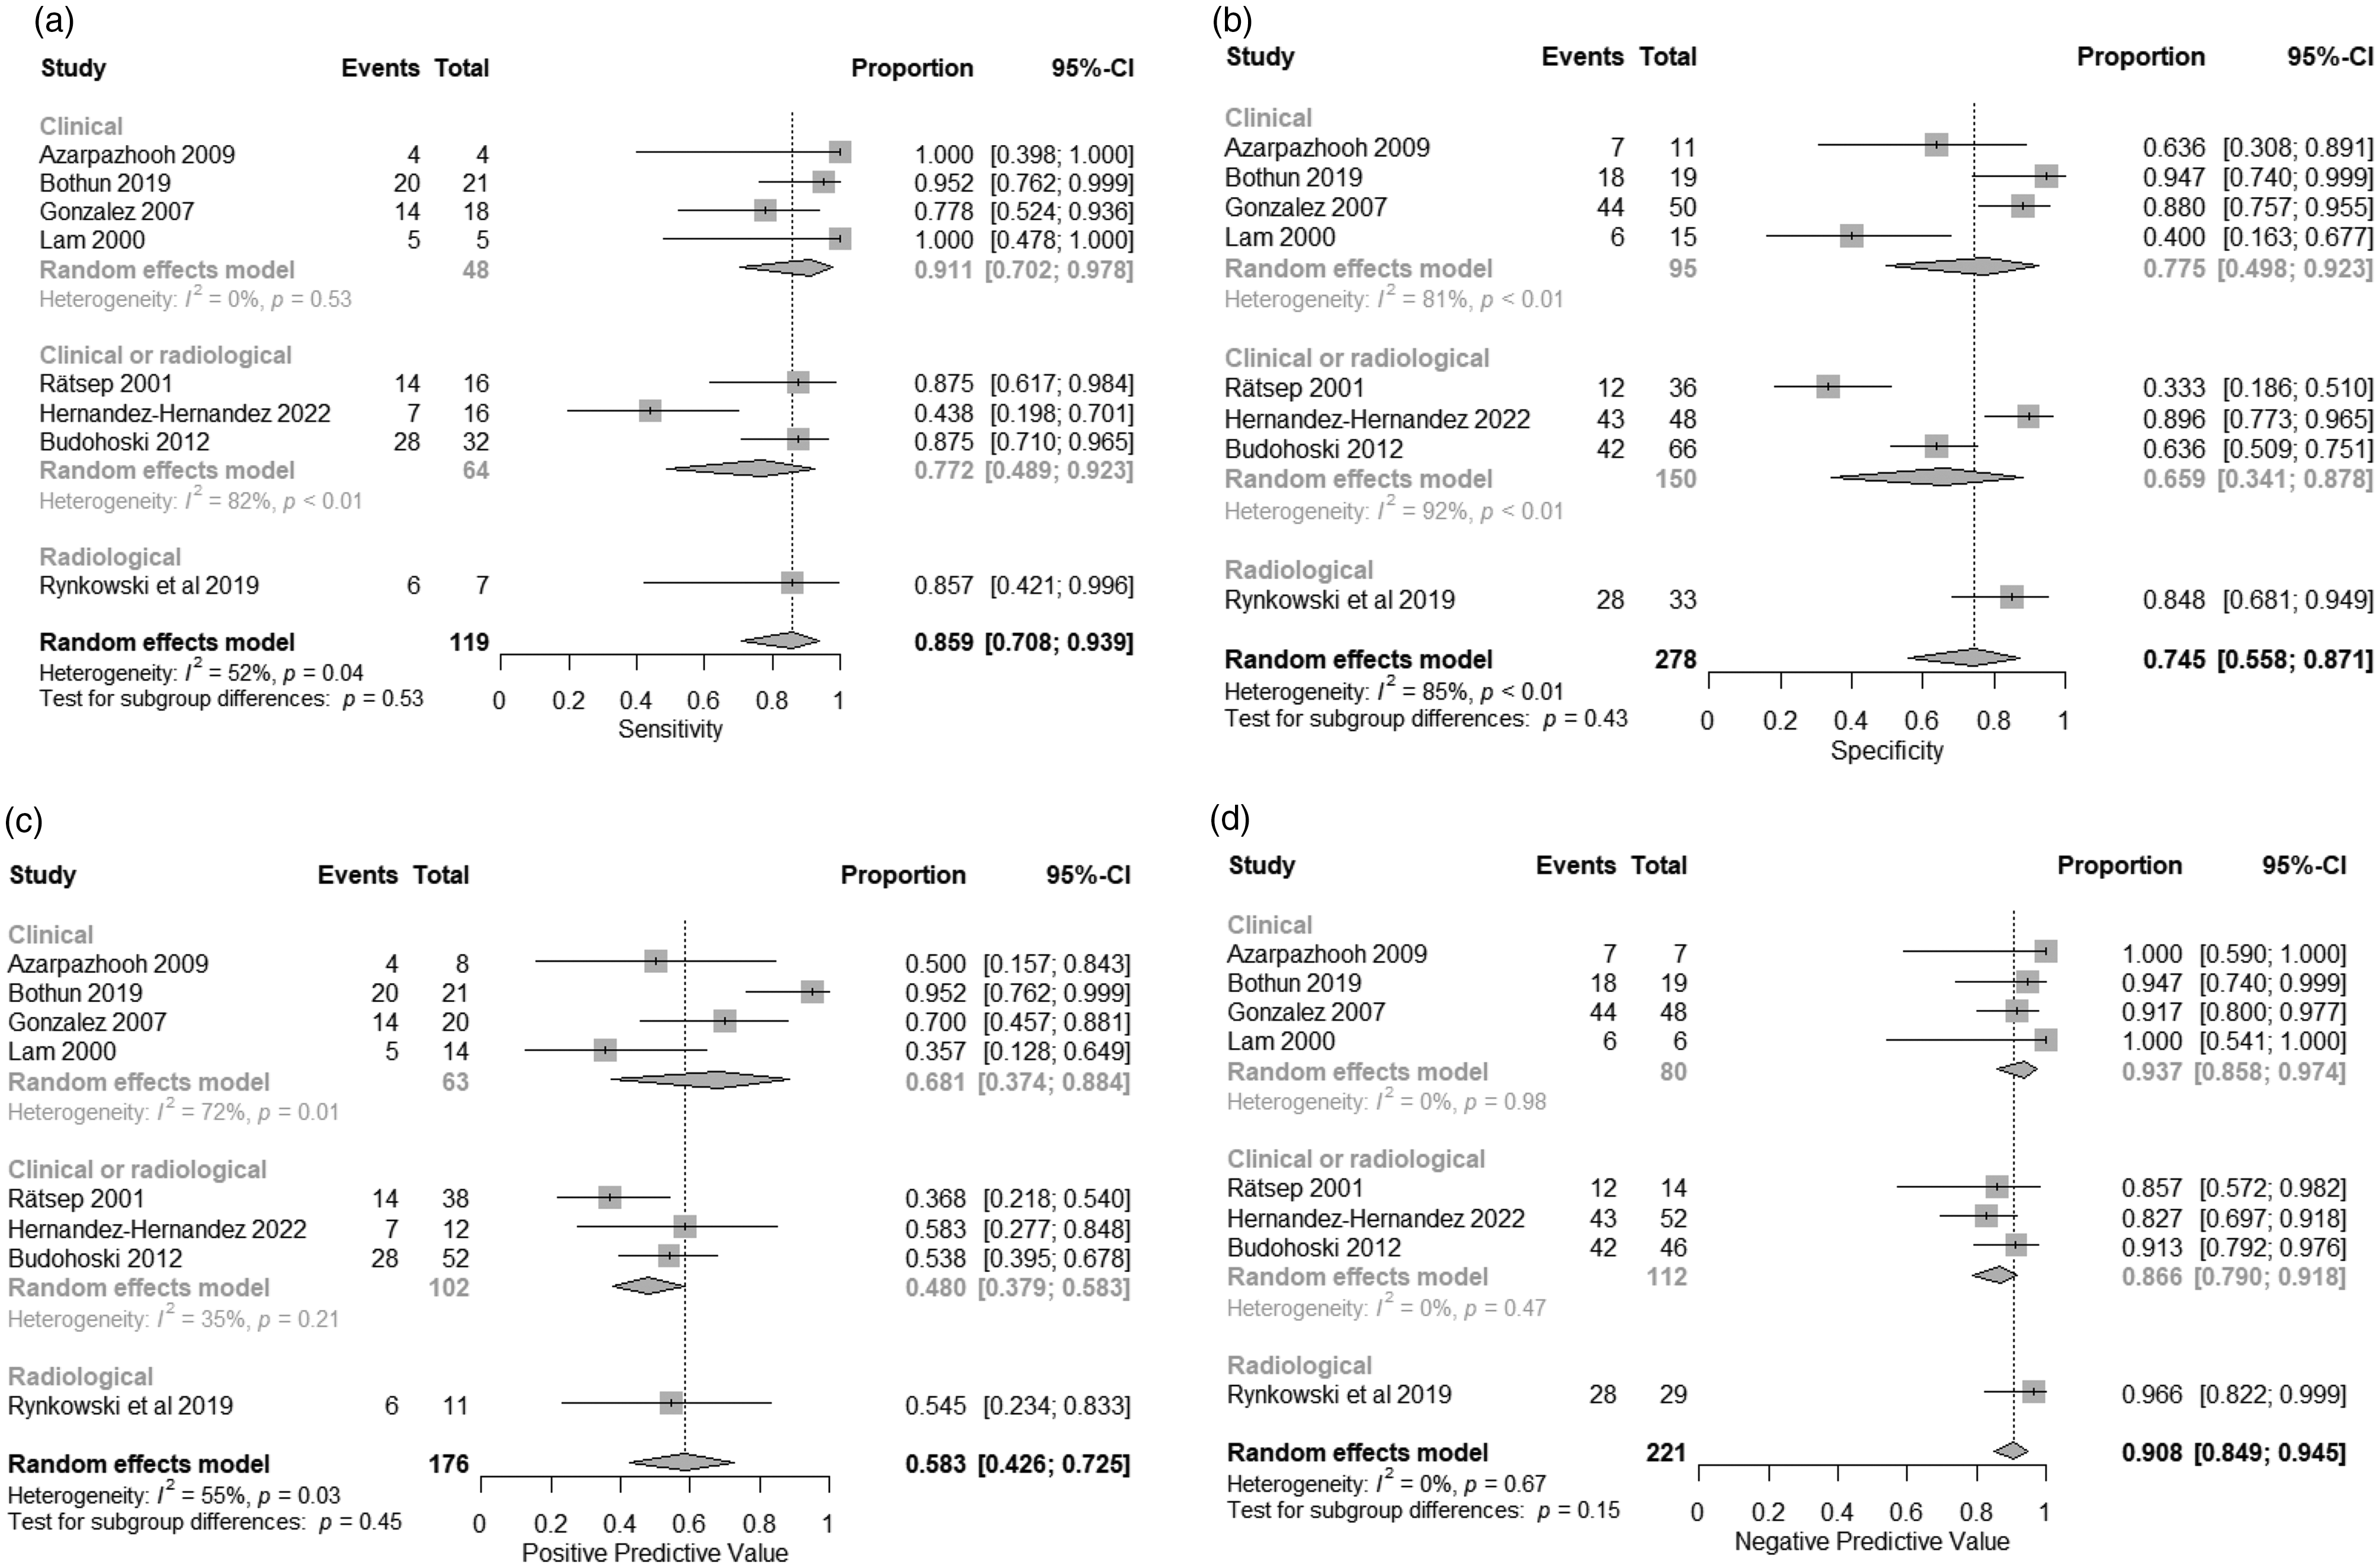
Forest plots representing the pooled sensitivities (a), specificities (b), PPV (c), NPV (d) of the studies investigating a MFV > 120 cm/s combined with a LR > 3 for the prediction of DCI. DCI: delayed cerebral ischemia; LR: Lindegaard ratio; MFV: mean flow velocity; NPV: negative predictive value: PPV: positive predictive value.
Peak systolic velocities
Two studies measured the PSV in any artery, while the third study solely measured PSVs in the MCA. One study combined TC duplex with TCD instead of using only TCD. Thresholds ranged from 120 to 300 cm/s (Supplementary data table 2). The ‘optimal’ cut-off value for the prediction of DCI was 165 cm/s, with a sensitivity of 0.67 (95% CI 0.23–0.93) and a specificity of 0.58 (95% CI 0.20–0.89) (Figure 4). Sensitivity analysis was not performed due to the limited number of studies.
Summary receiving operating curve of studies investigating the use of PSV for the prediction of DCI. (a) Survival curve showing the probability of a positive test across different velocity thresholds with the diseased and non-diseased represented by a solid and dashed line respectively. (b) Youden’s index calculated for each velocity threshold and (c and d) ROCs of the individual studies and SROC combining all studies. DCI: delayed cerebral ischemia; PSV: peak systolic velocity; ROC: receiving operating curve: SROC: summary receiving operating curve.
Changes in mean flow velocities over time
Two studies assessed changes in MFV over time, measured in the MCA as a predictive biomarker for DCI. A cut-off of 45 cm/s and 50 cm/s change in CBFV during daily consecutive measurements was associated with a sensitivity of 0.60 and 1, respectively, and a specificity of 0.59 and 0.60, respectively. Additionally, the respective PPVs were 0.45 and 0.4, and the NPVs were 1 and 0.77 (Supplementary table 3).
Cerebral autoregulatory and vasoreactivity biomarkers (n = 469 patients)
Five studies investigated the value of the THRT to predict DCI following aSAH (Supplementary table 4). Two studies used CA indices (the Sxa and Mxa) to predict DCI, while another study tested a pressure-flow curve. Finally, one study assessed the value of sCVR evaluation for the prediction of DCI (Supplementary table 5).
Transient hyperemic response test
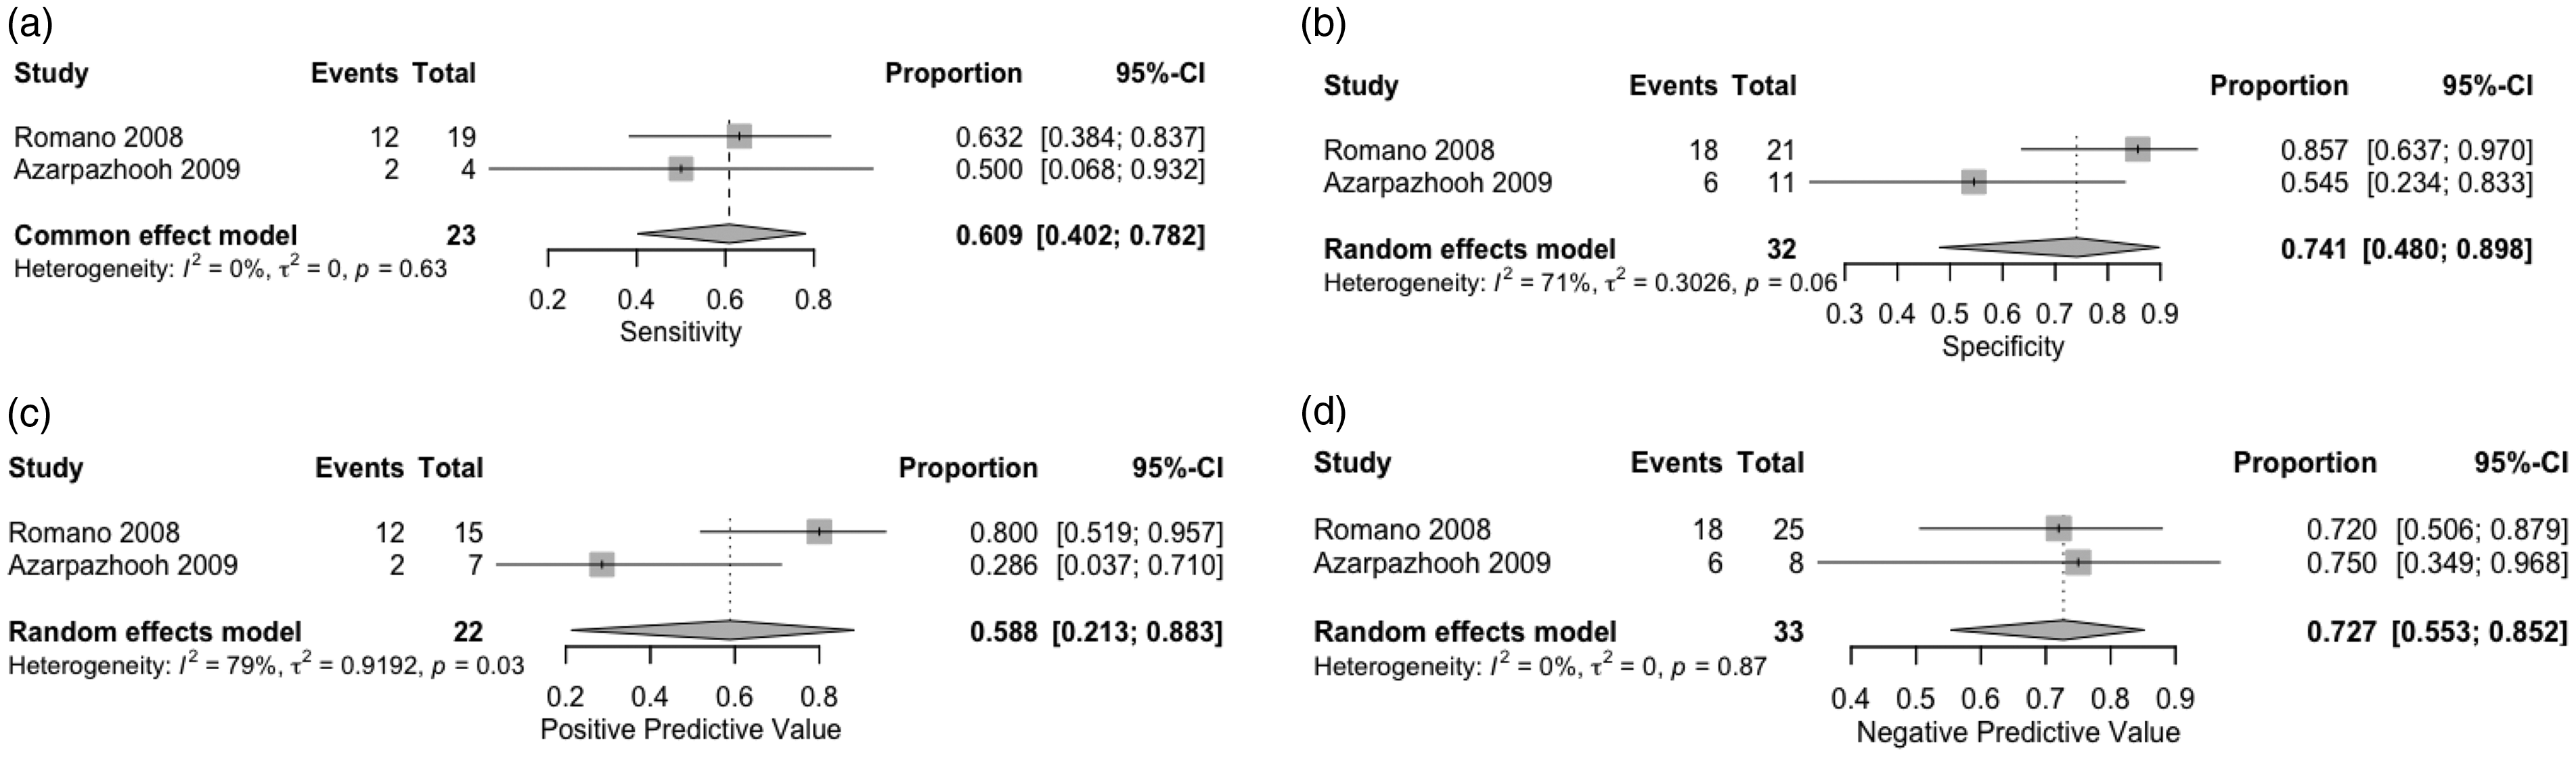
For the five studies investigating the THRT for the prediction of DCI, the pooled sensitivity, specificity, PPV, and NPV were 0.87 (95% CI 0.54–0.98), 0.81 (95% CI 0.54–0.94), 0.64 (95% CI 0.36–0.85), 0.95 (95% CI 0.72–0.99), respectively (Figure 5). Sub-group analyses based on the used definition of DCI (clinical and/or radiological) did not reveal statistically significant differences between groups for all summary statistics. Heterogeneity was high for the pooled specificity (I2 = 82%, p = <0.01), and moderate for the pooled PPV (I2 = 74%, p = 0.01).
Forest plots representing the pooled sensitivities (a), specificities (b), PPV (c), NPV (d) of the studies investigating the THRT for the prediction of DCI. DCI: delayed cerebral ischemia; NPV: negative predictive value: PPV: positive predictive value; THRT: transient hyperemic response test.
Autoregulatory indices
The sensitivity, specificity, PPV, and NPV of the Mxa for the prediction of DCI were 0.67, 0.75, 0.40 and 0.90, respectively. 27 For the Sxa, the corresponding values were 0.81, 0.76, 0.62 and 0.89, respectively. 8 A higher specificity was found when combining the presence of arterial narrowing with the Mxa (0.92) 28 (Supplementary table 5).
Another study by Santos et al. 27 assessed aSAH patients using a ABP-CBFV curve and a projection pursuit regression (PPR) technique. Analysis of the slope was found to predict DCI with an AUC of 0.86 (95% CI 0.80–0.91) (Supplementary table 5).
Static cerebrovascular reactivity
An AUC of 0.86 (95% CI 0.70–0.94) was found for the prediction of DCI when testing sCVR (Supplementary table 5).
Microembolic signals (n = 55 patients)
Two studies investigated the association between TCD-detected MES and the presence of DCI to evaluate their diagnostic role in the pathophysiology of DCI (Table 1). Pooled sensitivity, specificity, PPV, and NPV for the prediction of DCI were 0.61 (95% CI 0.40–0.78), 0.74 (0.48–0.90), 0.59 (0.21–0.88) and 0.73 (0.55–0.85), respectively (Figure 6). Heterogeneity was high for the pooled PPV (I2 = 79%, p = 0.03).
Forest plots representing the pooled sensitivity (a), specificity (b), PPV (c) and NPV (d) of studies investigating microembolic signals for the prediction of DCI. DCI: delayed cerebral ischemia; NPV: negative predictive value: PPV: positive predictive value.
A complete overview of the mean weighted estimates of the different TCD-biomarkers can be found in Table 2.
Pooled mean weighted estimates of the different TCD-derived biomarkers for the prediction of DCI.
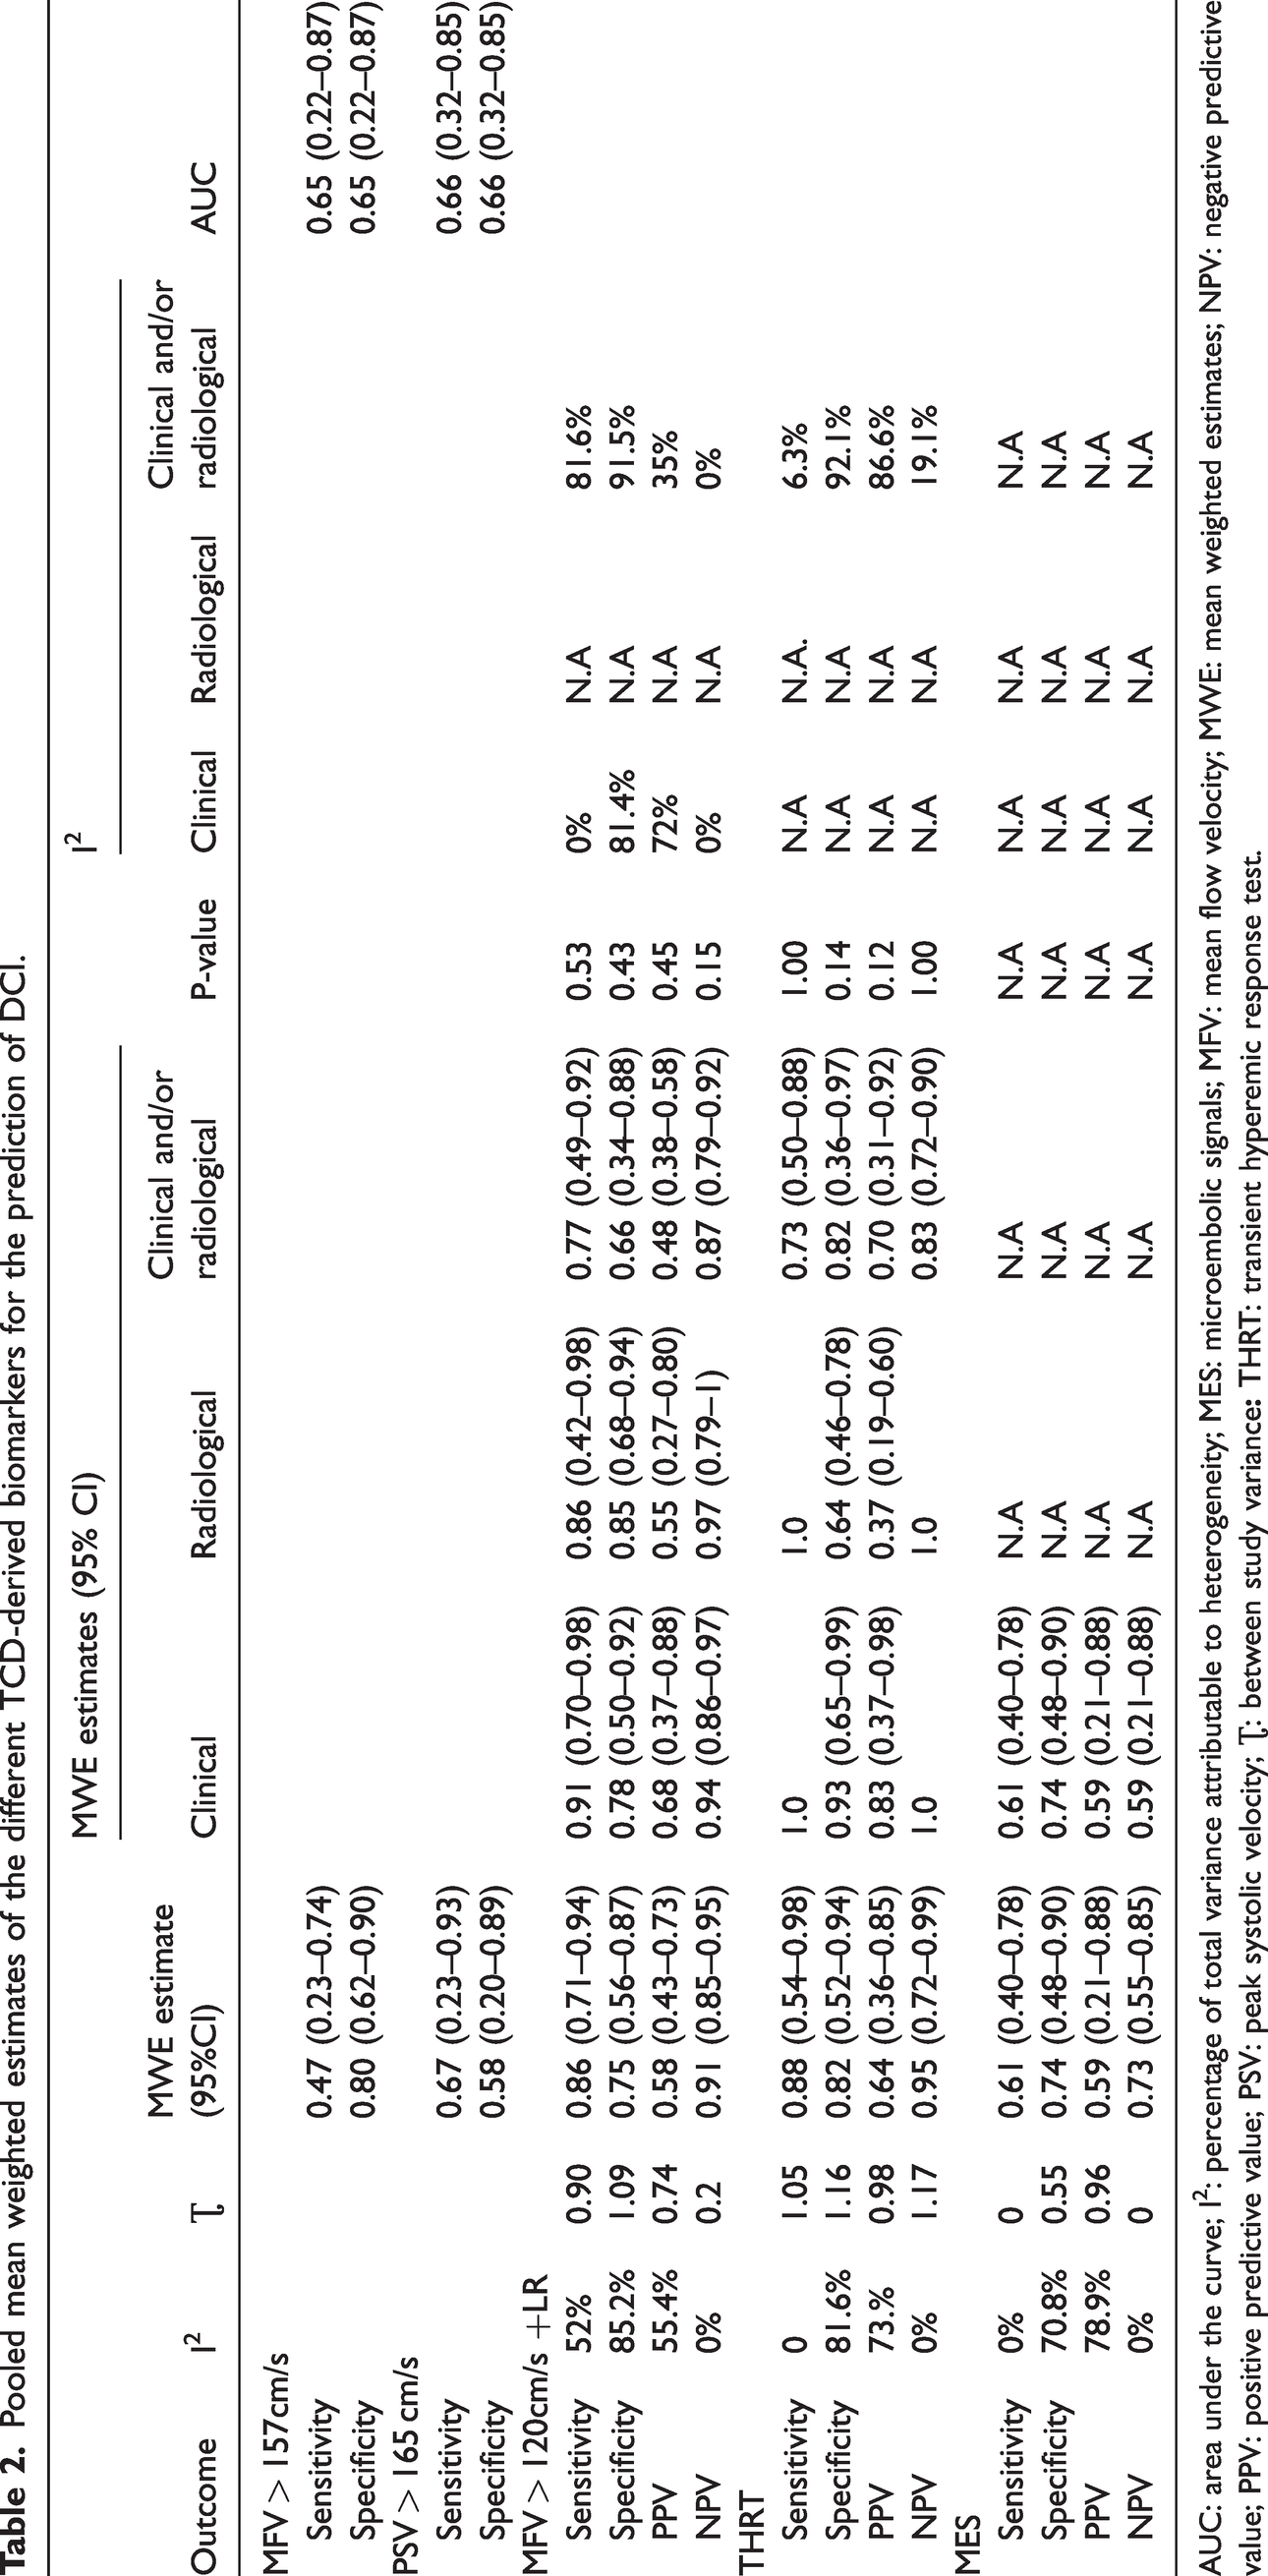
AUC: area under the curve; I2: percentage of total variance attributable to heterogeneity; MES: microembolic signals; MFV: mean flow velocity; MWE: mean weighted estimates; NPV: negative predictive value; PPV: positive predictive value; PSV: peak systolic velocity; Ʈ: between study variance
Discussion
This is the first systematic review that evaluates the value of different TCD-derived biomarkers for the prediction of DCI, namely CBFV (absolute or relative changes), dynamic and static CA, and the occurrence of MES. Although CBFV is more commonly used for DCI prediction, TCD biomarkers of CA dysfunction showed the highest sensitivity and specificity for the prediction of DCI. On the other hand, TCD-detected MES had an overall lower sensitivity and specificity compared to CBFV and CA biomarkers. The following discussion will focus on the strengths, weaknesses and limitations of these different biomarkers. Moreover, other novel TCD-derived biomarkers that may be beneficial for detecting DCI, but have not been specifically investigated in the context of DCI monitoring, are discussed.
Absolute cerebral blood flow velocities and changes in cerebral blood flow velocities
The assessment of CBFV to predict DCI is the most reported and used TCD-derived biomarker in aSAH patients. The highest sensitivity could be reached when using the MFV threshold of 120 cm/s combined with the LR > 3 to predict clinical and/or radiological DCI. The use of PSV was clearly inferior to that of the MFV for the prediction of DCI.
Overall, the sensitivity and specificity of establishing an increase in CBFV as a measure of DCI were highly heterogeneous in the selected articles, yielding results that were sometimes contradictory. This high heterogeneity is likely the result of variations in practices related to the type of applied TCD system (TCD vs TC Duplex), the used thresholds of CBFV (ranging from 80 to 200 cm/s), the selected arteries to insonate (both anterior and posterior circulation), as well as the selection of the parameters of interest (MFV, TAPV, PSV) (Table 1). Finally, our review showed a lack of consensus regarding the standardized use of the LR in combination with an elevated MFV to detect arterial narrowing in the context of DCI. To date, no large study has investigated the validity of the LR to differentiate between arterial narrowing and generalized hyperemia in aSAH patients. As guidelines have refuted the benefits of the triple H therapy involving hypervolemia to prevent ischemia, it remains to be elucidated whether the LR is still a relevant index to use for the detection of arterial narrowing.
Guidelines on the treatment of aSAH patients usually only sparsely touch upon the value of TCD for monitoring and prediction of DCI, and do not make clear recommendations on which measurement strategies to adopt.29,30 The lack of consensus statements on the definition of TCD-detected arterial narrowing, and consequently the variations in practice among the selected studies make it challenging to precisely determine the value of increased CBFV for the prediction of DCI.
A systematic review by Kumar et al. published in 2016 specifically investigated the diagnostic accuracy of TCD-detected increase in CBFV, with or without a LR > 3, for the prediction of DCI, and revealed a high sensitivity and NPV of 90% and 92%, respectively, as well as a reasonable specificity and PPV of 71% and 57%, respectively. 13 The authors concluded that TCD-generated evidence of arterial narrowing (referred to as vasospasms) is predictive of DCI with high accuracy. In our review, articles were selected based on their adherence to the DCI definition of Vergouwen et al. 31 to maximize homogeneity. Unlike Kumar et al., we deliberately excluded articles that aimed to predict DCI defined as “symptomatic vasospasms”, as those articles excluded patients developing DCI in the absence of arterial narrowing. Moreover, and in contrast with the review by Kumar et al., we did not pool the results of studies using the LR with those not using the LR to increase comparability of the results. Finally, we sought to investigate the effects of different thresholds of CBFV for the prediction of DCI by applying SROC, also reducing the bias that may arise from subjective or arbitrary threshold selection.
Despite the release of the consensus statement by Vergouwen et al. on the definition of DCI, many articles published after 2016 still erroneously refer to DCI as “vasospasms” or “symptomatic vasospasms”, and therefore fail to report the clinically relevant outcomes. From our search, 65 articles were excluded from our analysis, as the outcome of interest was the presence of arterial narrowing or the combination of DCI with arterial narrowing. The inherent complexity of DCI lies in its ability to manifest without evident signs of arterial narrowing, and conversely, patients with arterial narrowing may not consistently develop DCI. Multiple treatment strategies aimed at reducing or preventing arterial narrowing like intra-arterial calcium antagonists 32 and endothelin receptor A antagonists 33 have failed to reduce the development of DCI despite successfully treating arterial narrowing. This conundrum underlines the need to prioritize DCI management above arterial narrowing for improvement of outcome.
Dynamic cerebral autoregulation and static cerebrovascular reactivity
As disturbances in CA are suspected to play a role in early brain injury and DCI,34 –36 the assessment of dynamic CA or sCVR can serve as an effective monitoring tool. 22
The THRT was found to predict DCI with a high sensitivity and specificity. All studies revealed that early changes in CA occurring within 72 hours to five days after ictus were strongly associated with the development of DCI. A limitation of this method is its high inter- and intra-rater variability, 37 in part related to natural and physiological variation of CA over time. 38 To counteract this, three studies repeated the test three times at intervals of up to two minutes and averaged the obtained results, increasing the accuracy of the test.27,39 Additionally, in all studies, the test was repeated several times at intervals of one or two days during the hospital stay, allowing to assess relative differences in CA over time. Finally, THRTs were solely performed in the MCA to enable a unified assessment of CA.
A few inherent disadvantages of the THRT can limit its applicability. Performing the manual compression of the common carotid artery is contra-indicated in cases of extracranial vascular stenosis or atheromas due to risks of stroke. 40 However, this can be controlled for by performing a TC Duplex to identify stenosis prior to performing the test. Notably, none of the included studies mentioned adverse events caused by compression of the carotid artery. Besides this, the THRT can only be performed if the patient remains calm. Ratsep et al. reported that 20% of the measurements failed as a result of psychomotor activity of the patient and suboptimal temporal bone windows. 41
The predictive nature of autoregulatory biomarkers was further confirmed by Budohoski et al. with the Sxa, revealing 7-fold increased odds of developing DCI in those patients with impaired CA in the first five days. 8 In contrast, TCD-detected arterial narrowing as defined by MFV > 120 cm/s alone did not increase the likelihood of developing DCI, suggesting that disruption of CA may play a more important role in DCI compared to arterial narrowing alone. This distinction is further confirmed by Santos et al., 42 who found very distinct changes in the pressure-flow curve in patients with arterial narrowing compared to patients with DCI, thereby indicating the possible distinct pathophysiological mechanisms underlying both processes. The combination of dynamic CA dysfunction with arterial narrowing, however, drastically increases the likelihood of developing DCI, as highlighted in the study by Calviere et al. 23 This may be explained by the dual insult theory stating that two hemodynamic insults are needed to induce ischemia. 43
Only one study assessed sCVR using acetazolamide in aSAH patients, and found that the lowest sCVR value on the contralateral side (opposite to the side of the aneurysm) had an AUC of 0.86 (0.7–0.94) for the prediction of clinical DCI. Clear limitations of this technique are the frequent side effects of acetazolamide (flushing, headache, extremity paresthesia, hyperventilation) and contra-indications for the use of acetazolamide including electrolyte imbalances, which commonly occur in aSAH. This strongly reduces the applicability of this modality in aSAH patients.
To conclude, it becomes clear that CA dysfunction at an early stage precedes the occurrence of DCI. Among the different markers of CA, the PRR and Sxa or Mxa may have the most potential, while also being the least burdensome. Additionally, a clear advantage of a marker like Mxa is its robustness, as different depths and angles of insonation do not affect its results, thereby reducing the inter- and intra-rater variability. 44 However, the promising results of the above-mentioned studies need further validation from larger cohorts, preferably employing continuous assessments of autoregulation to more precisely detect dysfunctional CA preceding the development of DCI.
Microembolic signals
The two studies monitoring for MES in aSAH revealed a low sensitivity and heterogeneous specificity for the prediction of DCI. Of note, Azarpazhooh et al. monitored for MES in aneurysmal and non-aneurysmal SAH patients, and only found MES in aSAH patients, suggesting that the vascular stress caused by rupture of an aneurysm could predispose patients to MES. 45 The origin of MES is unclear, but is thought to result from vasospastic arterial segments, aneurysm sacs, surgical or procedural manipulations or hypercoagulable states. Limitations of this biomarker are the multiple possible artefacts caused by probe movements, patient movements due to coughing or speaking, and the subjective nature of this assessment measure, collectively reducing its reliability. 47 Therefore, considering all of the above, MES monitoring appears to be of limited value to predict DCI in aSAH patients.
Novel biomarkers
We here discuss novel biomarkers that have emerged as relevant markers for the evaluation of cerebral hemodynamics, but that have not yet specifically been investigated for the prediction of DCI independently of arterial narrowing. Slow waves (SWs) calculated using spectral analysis of flow velocity in the MCA reflect dynamic oscillations in cerebral blood volume influenced by autoregulatory vasodilation and vasoconstriction. 43 Papaianou et al. found that the magnitude of SWs was significantly higher before the occurrence of arterial narrowing in DCI patients compared to non-DCI patients. 43 A major drawback of this study was that only patients with arterial narrowing were included, leading to bias in the results.
Another biomarker is the time constant of cerebral arterial bed – tau – reflecting the interplay between CVR and CA. 43 More specifically, tau mirrors the interaction between the compliance in the major intracranial arteries and the resistance originating from the smaller regulatory vessels. 43 A significant advantage of this biomarker is its independence from vessel radius, enabling a comparison between patients with different vessel radii. It requires bedside TCD combined with simultaneous monitoring of ABP.
Finally, another TCD biomarker that has emerged within the arena of ischemic stroke management is the velocity curvature index (VCI), which may prove effective for the detection of DCI in aSAH patients. The VCI is a quantitative metric that was developed to replace the qualitative assessment of CBFV waveform morphology, with lower values indicating a more blunted or dampened signal. It has proven to be a robust, effective and easily computed metric of cerebral blood flow, capable of separating patients with large vessel occlusions from healthy controls, with an AUC of 92%.45 As such, the VCI can capture changes in the cerebral blood flow signal morphology that reflect an increase in cerebrovascular resistance, intracranial pressure, or a decrease in intracranial compliance. These factors are known to play a role in DCI following aSAH, therefore the VCI may be lower in DCI patients compared to patients without DCI. It remains to be elucidated, however, whether the VCI can also discriminate patients with microvascular pathologies, as is seen in DCI.
Implications for clinical practice
Considering the bedside and non-invasive nature of TCD, it can easily be implemented relatively easily in the management workflow of SAH patients. The findings of this review suggest that TCD can best be utilized as part of a continuous or multimodal neuromonitoring approach to improve insights into disease progression and to detect critical physiological events that may affect outcome. In the following section we provide concrete examples of how TCD can contribute to better prognostication and improved treatment allocation in SAH management.
As autoregulatory dysfunction was clearly found to be impaired prior to the development of DCI, regular monitoring of autoregulation can be implemented in clinical practice to identify those patients most at risk of DCI, warranting closer monitoring or even extended admission at an intensive or medium care unit. Patients showing early signs of autoregulatory dysfunction could for example benefit from more invasive neuromonitoring with cerebral microdyalisis, brain tissue oxygenation or additional imaging (e.g. CT perfusion) to identify early indicators of potential ischemia onset.7,46 Veldeman et al recently demonstrated that incorporating additional neuromonitoring techniques was associated with early detection of DCI, faster initiation of treatment, and a reduction in infarction rates.47 Their multimodal neuromonitoring regime resulted in significantly higher rates of good recovery at 12 months compared to patients not undergoing additional neuromonitoring.47 This targeted neuromonitoring also led to a reduction of CT scans, contributing to a reduction in exposure to ionizing radiation and a reduction in potentially hazardous patient transports.47 Besides evaluation of autoregulation, measuring MBFV combined with a LR is still an informative modality enabling physicians to identify when patients are at risk of developing arterial narrowing, which in the presence of autoregulatory dysfunction, place patients at higher risks of ischemia. 43 This information can be used to determine the optimal timing of additional interventions (aneurysm occluding interventions for example) to limit excessive metabolic mismatch.
Moreover, a better understanding of the patient’s CA at the bedside can be used for the implementation of personalized blood pressure regulation that enables ‘optimal’ cerebral perfusion in individual patients over time. This strategy has the potential of limiting hypertension-induced adverse events 48 as seen in the HIMALAIA trial through continuous finetuning and feedback mechanisms.49 An elegant example of this autoregulation-based tailored treatment strategy is the COGITATE study (CPPopt Guided Therapy: Assessment of Target Effectiveness) that has been applied in traumatic brain injury patients, aiming to target a CPP at which dynamic CA works best.49 Similar initiatives have been developed in aSAH patient with detected impaired CA episodes. In these patients, a one size fits all approach of blood pressure augmentation may potentially lead to more adverse events than benefits. Weiss et al have shown that patients developing DCI had a considerable deviation of CPP from CA-guided CPP targets underlining the potential need for blood pressure augmentation at a certain point.50 Although an ICP probe was used to calculate dynamic CA, the development of robotic TCD systems in combination with continuous ABP measurements, could form an appealing non-invasive alternative to monitor autoregulation continuously and non-invasively.
To summarize, TCD assessment of autoregulation can potentially aid in the process of risk stratification and allocation of care, and enable patient-specific, targeted, and cost-effective care.
Strengths and limitations
This meta-analysis is the first of its kind to investigate the overall diagnostic accuracy of a broad range of TCD-derived biomarkers for the prediction of DCI in aSAH patients. Moreover, strict adherence to the definition of DCI as stated by Vergouwen et al. was essential for the inclusion of studies, thus increasing homogeneity and improving comparability between studies for better validity of our results. We have also sought to explore the differential diagnostic accuracy of TCD markers for the clinical and radiological definitions of DCI separately, in an attempt to shed more light on the distinct pathomechanisms underlying both manifestations of DCI. Finally, this study employed SROCs to illustrate the trade-off between sensitivity and specificity across different diagnostic thresholds, thereby allowing identification of ‘optimal’ cut-off thresholds for the prediction of DCI.
This meta-analysis also has several limitations. Firstly, many studies were excluded from this review, as DCI was often referred to as the presence of “vasospasms”. Despite the established consensus statement on the definition of DCI, numerous studies persist in inaccurately characterizing DCI as “vasospasms” or “symptomatic vasospasms”, thus marring our understanding of this intricate pathology. This has resulted in a limited number of studies reporting on the diagnostic accuracy of TCD-derived biomarkers for the prediction of DCI. Conversely, some articles might have been missed, as some authors use the terminology “vasospasms” while actually referring to the current definition of DCI. Moreover, most studies explored the diagnostic accuracy of CBFV as a biomarker for DCI, while evidence regarding the benefits of other biomarkers was sparser, preventing an accurate and well-weighted comparison of the different biomarkers. Lastly, the pooled analysis of the different biomarkers must be interpreted with caution due to the small sample sizes of most of the included studies, as well as the high heterogeneity, primarily assumed to result from variations in practices in the application of TCD.
Conclusions
We found three main TCD-based biomarkers for the prediction of DCI: velocity-based, autoregulatory-based, and a marker based on the detection of MES. Dynamic autoregulatory markers emerge as promising biomarkers to predict DCI, however these results need to be validated. Within the velocity-based biomarkers, a mean flow velocity above 120 cm/s combined with a LR yielded the highest sensitivity, specificity, PPV and NPV for the prediction of DCI. Finally, MES are poorly predictive of DCI. Many other TCD-biomarkers such as SW, tau and the VCI may be relevant, but have not been tested specifically for the prediction of DCI. Standardization of TCD use is essential for better comparability of results.
Supplemental Material
sj-pdf-1-jcb-10.1177_0271678X251313746 - Supplemental material for Systematic review and meta-analysis of transcranial doppler biomarkers for the prediction of delayed cerebral ischemia following subarachnoid hemorrhage
Supplemental material, sj-pdf-1-jcb-10.1177_0271678X251313746 for Systematic review and meta-analysis of transcranial doppler biomarkers for the prediction of delayed cerebral ischemia following subarachnoid hemorrhage by Hanna Schenck, Céline van Craenenbroeck, Sander van Kuijk, Erik Gommer, Michael Veldeman, Yasin Temel, Marcel Aries, Werner Mess and Roel Haeren in Journal of Cerebral Blood Flow & Metabolism
Footnotes
Funding
The author(s) received no financial support for the research, authorship, and/or publication of this article.
Declaration of conflicting interests
The author(s) declared no potential conflicts of interest with respect to the research, authorship, and/or publication of this article.
Supplementary material
Supplemental material for this article is available online.
References
Supplementary Material
Please find the following supplemental material available below.
For Open Access articles published under a Creative Commons License, all supplemental material carries the same license as the article it is associated with.
For non-Open Access articles published, all supplemental material carries a non-exclusive license, and permission requests for re-use of supplemental material or any part of supplemental material shall be sent directly to the copyright owner as specified in the copyright notice associated with the article.