
Abstract
In patients after subarachnoid hemorrhage (SAH) failure of cerebral autoregulation is associated with delayed cerebral ischemia (DCI). Various methods of assessing autoregulation are available, but their predictive values remain unknown. We characterize the relationship between different indices of autoregulation. Patients with SAH within 5 days were included in a prospective study. The relationship between three indices of autoregulation was analyzed: two indices calculated using spontaneous blood pressure fluctuations, Sxa (based on transcranial Doppler) and TOxa (based on near-infrared spectroscopy); and transient hyperemic response test (THRT) where a brief compression of the common carotid artery is used. The predictive value of indices was assessed using data from the first 5 days. Overall there was only moderate correlation between indices. However, both Sxa and TOxa showed good accuracy in predicting impaired autoregulation evidenced by a negative THRT (area under the curve (AUC): 0.788, 95% CI: 0.723 to 0.854 and AUC: 0.827, 95% CI: 0.769 to 0.885, respectively). All indices proved accurate in predicting DCI when 0- to 5-day data were used (AUC: 0.801, 95% CI: 0.660 to 0.942; AUC: 0.857, 95% CI: 0.731 to 0.984, AUC: 0.796, 95% CI: 0.658 to 0.934 for THRT, Sxa, and TOxa, respectively). Combining all three indices had 100% specificity for predicting DCI. While multiple colinearities exist between the assessed methods, multimodal monitoring of cerebral autoregulation can aid in predicting DCI.
Keywords
INTRODUCTION
Cerebral autoregulation describes the intrinsic ability of the cerebral vasculature to maintain a stable cerebral blood flow over a wide range of arterial blood pressures (ABPs). It has been described that cerebral autoregulation may become disturbed after subarachnoid hemorrhage (SAH),1–7 which has been associated with development of delayed cerebral ischemia (DCI).1,2,5–9
The transient hyperemic response test (THRT) is a transcranial Doppler (TCD) based method, which characterizes the changes in cerebral blood flow velocity (FV) after a brief compression of the common carotid artery. It is a recognized and simple method of testing autoregulation in vivo.2,6,8,10–18 It is directly proportional to the static rate of autoregulation, which is the ‘gold standard’ for measuring autoregulation, 15 and it has been shown to be predictive of DCI after SAH.2,6
However, other ways of measuring autoregulation that do not require physical or pharmacological blood pressure stimulation have been described.19–22 By using the correlation coefficient method, the dynamic relationship between cerebral blood flow and ABP, encompassing both vasoconstriction and vasodilatation, can be studied. Both TCD and near-infrared spectroscopy (NIRS) are modalities where the correlation coefficient method has been experimentally and clinically verified.23–25
We have previously described in a prospective study that continuous indices of autoregulation (TCD and NIRS derived) are predictive of DCI. 9 However, the interrelationship between the two continuous indices as well as THRT has not been fully elucidated. In the present analysis, we have reexamined data from the prospective observational study 9 to describe the relationship between THRT, and two continuous indices of autoregulation, Sxa, derived from TCD and TOxa, derived from NIRS, with particular emphasis on their ability to identify the blood pressure levels below and above which autoregulation becomes compromised as well as the benefit of multimodal autoregulation assessment.
MATERIALS AND METHODS
Patients and Management
All patients admitted to the Department of Neurosurgery in Addenbrooke's Hospital between June 2010 and January 2012 with a diagnosis of SAH were screened for eligibility to participate in a prospective observational study of autoregulation disturbances after SAH. 9 Inclusion criteria were age ≥18 years old, aneurysmal SAH confirmed with Computed Tomography angiography or digital subtraction angiography, and <5 days elapsed from ictus. Of the 98 patients included in the prospective observational study, only patients who received autoregulation monitoring via THRT, Sxa, and TOxa were considered for the present comparative analysis. The study was approved by the Research Ethics Committee at Addenbrooke's Hospital. All patients were required to sign written consent before entering the study. If patients were deemed incapacitated, then written assent was required from the next-of-kin. In all cases should the patient in question regain capacitance written consent was sought.
Patients were treated according to current guidelines. 26 Initial management included prompt cardiopulmonary support, maintenance of euvolemia, oral nimodipine 60 mg every 4 hours, and treatment of acute hydrocephalus with external ventricular drainage. The decision to treat by surgical clipping or endovascular embolization was performed on the basis of consensus between a team of neurosurgeons and interventional radiologists. Patients with diagnosed DCI underwent hemodynamic augmentation therapy with intravenous crystalloids administered to achieve a central venous pressure between 8 and 12 mm Hg and blood pressure support to achieve improvements in the neurologic status using individually titrated doses of vasopressors (noradrenaline, dobutamine, and arginine vasopressin). Balloon angioplasty and intraarterial administration of vasodilators were not routinely performed. A number of patients were included in the STASH (SimvaSTatin in Aneurysmal Subarachnoid Hemorrhage) trial (www.stashtrial.com). However, we are blinded to the allocation of patients therefore this information is not discussed in the manuscript.
Hydrocephalus was treated with external ventricular drainage, lumbar drainage, or serial lumbar punctures (at the discretion of the treating neurosurgeon) until the need for permanent cerebrospinal fluid diversion was established. Electroencephalograhy was performed when seizures were suspected as the cause of neurologic deterioration or lack of neurologic progress.
End Points and Definitions
The primary end point for the prospective observational study was DCI within 21 days of ictus. The main hypotheses being that disturbed cerebral autoregulation from the first 5 days after SAH is associated with the development of DCI. For the present, methodological analysis we wanted to determine the relationship between the different indices of autoregulation which were used, with emphasis on their ability to predict DCI.
Delayed cerebral ischemia was defined as a new focal neurologic deficit or global neurologic deterioration (a decrease of ≥2 points on the Glasgow Coma Scale) lasting >2 hours, after exclusion of intracranial hemorrhage, hydrocephalus, seizures, metabolic derangements, and infection, with or without radiologic signs of cerebral vasospasm. 27 In unconscious patients, the diagnosis of DCI was made when there was a lack of neurologic progress in the absence of confounders (as above and after imaging did not reveal other sources of brain damage) and with evidence of one of the above: cerebral vasospasm either on TCD or digital subtraction angiography; perfusion deficit on perfusion computed tomography or cerebral infarction not attributable to other causes (i.e., iatrogenic). 27 The diagnosis of DCI was made by the responsible neurosurgical team when the above criteria were met. All patients who were discharged before completing the full 21 days of the study were deemed not to have DCI unless they were readmitted because of new neurologic symptoms. Patients who died before completing the full 21 days were classified into DCI group only if DCI was diagnosed before death or death was thought to be a consequence of DCI.
Cerebral vasospasm was defined as mean FV in the middle cerebral artery (MCA) exceeding 120 cm/s with a concomitant Lindegaard Ratio of above 3.0 on TCD,28,29 or narrowing of cerebral arteries on digital subtraction angiography. Routine postoperative CT and digital subtraction angiography were not performed.
Data Collection and Monitoring
Neurologic state on admission was assessed using the WFNS (World Federation of Neurosurgical Societies) scale. The amount of subarachnoid blood was graded according to modified Fisher scale. 30
Multimodal neuromonitoring and autoregulation testing was performed every 1 to 2 days by a single investigator (KPB). Arterial blood pressure was monitored noninvasively with a Finapres 2300 finger plethysmograph (Ohmeda, Amsterdam, The Netherlands). The hand was kept steady at heart level. Where available, ABP was monitored from the radial artery using a pressure monitoring kit (Baxter Healthcare, Deerfield, IL, USA). Bilateral MCA FV was measured with DopplerBox (DWL Compumedics, Singen, Germany) using a head positioning device (Lam Rack, DWL Compumedics) via the temporal window at a depth of 45 to 60 mm. Bilateral tissue oxygenation index was monitored with NIRO-200 (Hamamatsu Photonics, Hertfordshire, UK) with probes positioned over the frontal area (2.5 cm above the orbital ridge and 2.5 cm away from the midline). Data were recorded at a frequency of 200 Hz using ICM + software (Cambridge Enterprise, Cambridge, UK, http://www.neurosurg.cam.ac.uk/icmplus).
Calculation of Hemodynamic Parameters
Calculation of autoregulatory indices was performed with the monitoring data anonymised and with investigators blinded to clinical events. The following parameters were calculated:
Transient hyperemic response ratio (THRR) was calculated after performing the THRT, from the average of the first three consecutive systolic FV values (excluding the first systole), after release of common carotid artery compression.10,12,13

TCD-based autoregulation, Sxa, was calculated as a moving, linear correlation coefficient between values of systolic FV and ABP from a 300-second window with an averaging period of 10 seconds.31,32 The minimum monitoring time required for results to be considered meaningful was 30 minutes.
Near-infrared spectroscopy-based autoregulation, TOxa, was calculated as a moving, linear correlation coefficient between values of tissue oxygenation index and ABP from a 300-second window with an update every 10 seconds.23–25 The minimum monitoring time required for results to be considered meaningful was 30 minutes.
Arterial blood pressure was chosen for calculation of cerebral autoregulatory indices as intracranial pressure was rarely monitored in this group of patients. Previous data suggest that blood pressure-based indices correlate well with cerebral perfusion pressure (CPP) based indices.25,31,33
The physiologic basis for the correlation coefficient methodology has been described elsewhere.25,32 Briefly, a passive transmission of ABP fluctuations to FV and tissue oxygenation index, respectively, is suggestive of passive pressure-flow relationship and therefore impaired autoregulation. In such cases, the calculated autoregulatory indices will be positive. In contrast, opposite changes in FV and tissue oxygenation index to the observed fluctuations in ABP suggest active regulation. In such cases, TOxa and Sxa will be close to zero or negative.
Statistical Analysis
Statistical analysis was performed using SPPS software (IBM, New York, NY, USA). Patients were dichotomized into DCI and non-DCI groups. The assumption of normal distribution was confirmed using Shapiro–Wilk test, at the level of significance of 0.05, therefore parametric tests were used.
In patients in whom unilateral vasospasm was diagnosed using TCD, recordings (TCD and NIRS) from the ipsilateral side were used for analysis. In patients in whom bilateral vasospasm was diagnosed an average of both sides was used for analysis. In patients in whom vasospasm was not diagnosed recordings from the side ipsilateral to the aneurysm were used for analysis. In patients with midline aneurysms, without diagnosed vasospasm an average of both sides was used for analysis. All autoregulatory indices were averaged per session. In patients where ipsilateral recordings were used the recordings from the contralateral side were disregarded and not used for DCI prognostication.
Pearson's linear correlation was used to determine the relationship between all three indices of autoregulation. Receiver operating characteristic (ROC) was used to determine the ability of Sxa and TOxa to predict impaired autoregulation as evidenced by THRR ≤1.09 and to determine the threshold of Sxa and TOxa with the best sensitivity and specificity which was used for DCI prediction.
FV, THRR, Sxa, and TOxa were binned according to predefined ABP thresholds. Identification of the lower and upper limits of autoregulation (LLA and ULA, respectively) was performed by fitting a piecewise linear regression line with two breakpoints to the average values of the binned data. The first breakpoint indicated the LLA while the second the ULA. For determination of the LLA and ULA, combined data from all monitoring days from all patients were used. To determine the autoregulatory curve in a single patient it is necessary to perform long-term monitoring, which was not feasible with the current setup (in particular TCD monitoring).
Averaged values of the analyzed autoregulation indices from the first 5 days after SAH were used for prediction of DCI using the ROC curve analysis. Combinations of indices were also used to determine the benefit of using multiple parameters. The ROC curves were compared using z-statistics. Statistical significance was set at P < 0.05.
RESULTS
There were 98 patients included in the larger prospective study, of which 66 had all three monitoring methods implemented, therefore, fit the inclusion criteria for this analysis. The results from the whole cohort (n = 98) have been reported previously (Sxa and TOxa were found to be independent predictors of DCI in a multivariate model, THRT was not considered). 9 Twenty-six patients (39%) developed DCI. There were more patients with WFNS grade 4 in the DCI group (P = 0.048), as well as more patients with TCD-defined vasospasm (P = 0.055) (Table 1). There were significant differences in ABP values between the DCI and non-DCI groups when all monitoring days were analyzed. However, this was not apparent when only days 0 to 5 were analyzed, suggesting that that it was a consequence of the use of hemodynamic augmentation therapy in the DCI group. There were no differences in the PaCO2 levels between DCI and non-DCI groups (Supplementary Table 1).
Baseline characteristics
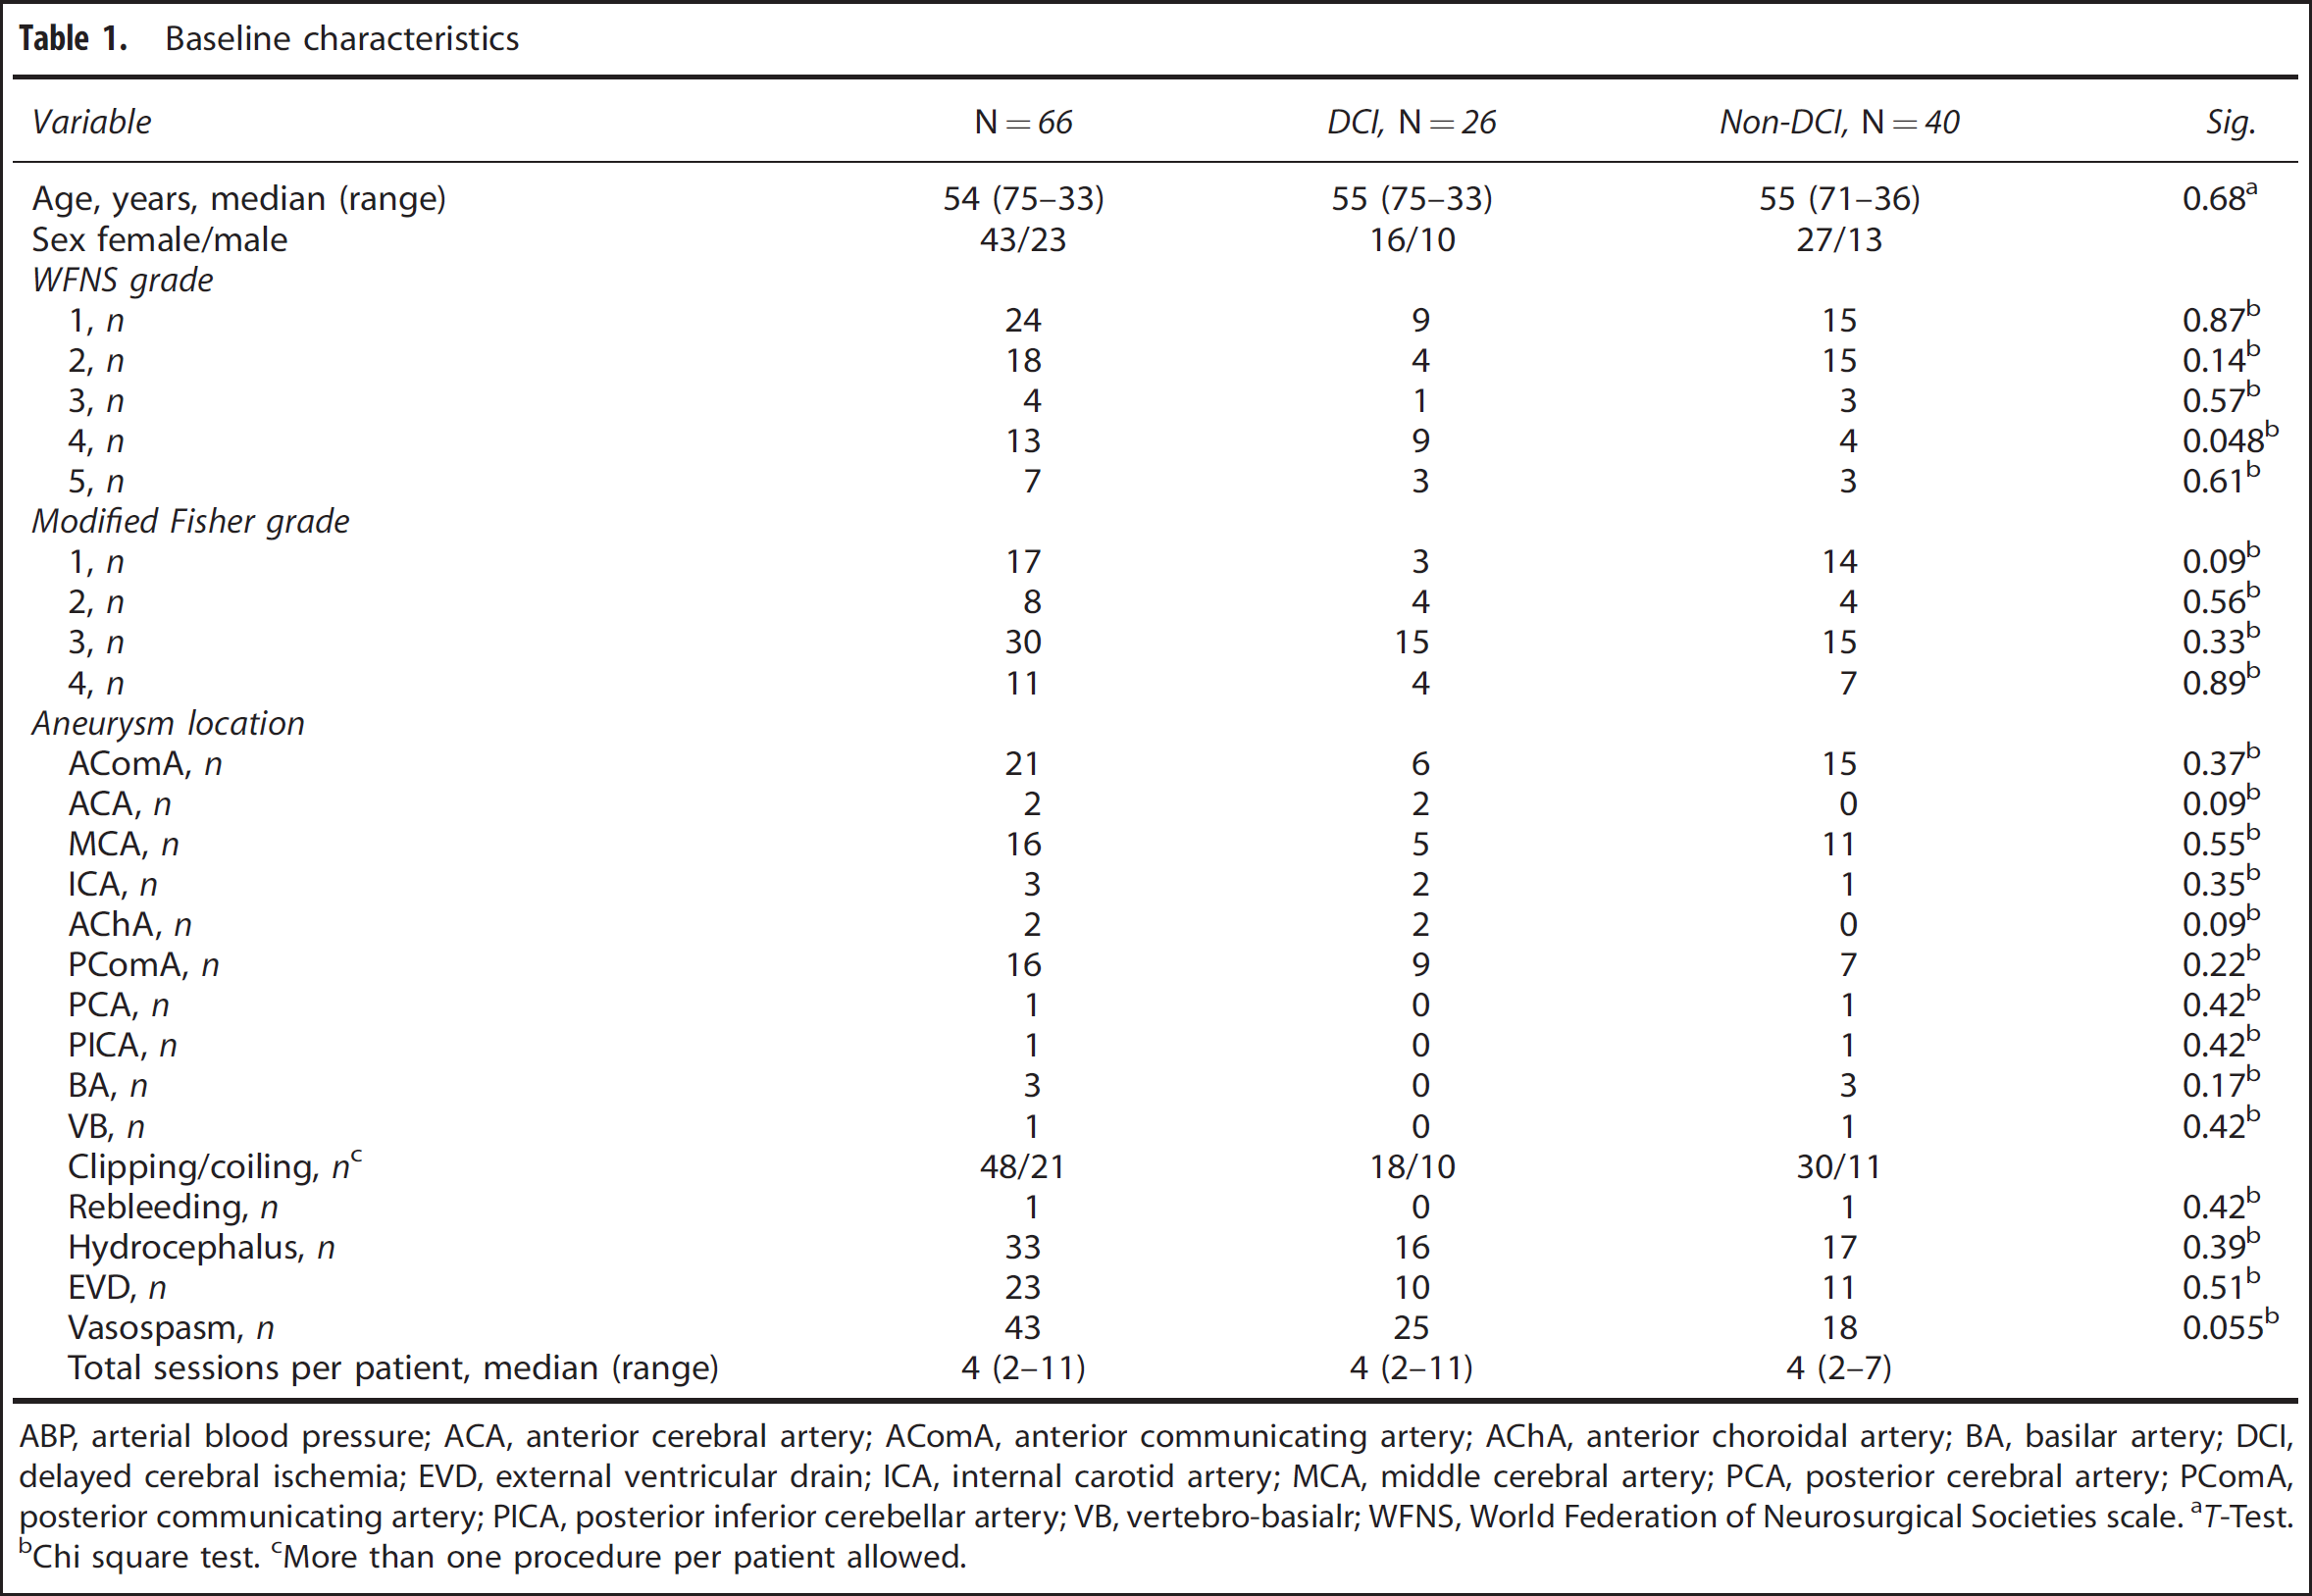
ABP, arterial blood pressure; ACA, anterior cerebral artery; AComA, anterior communicating artery; AChA, anterior choroidal artery; BA, basilar artery; DCI, delayed cerebral ischemia; EVD, external ventricular drain; ICA, internal carotid artery; MCA, middle cerebral artery; PCA, posterior cerebral artery; PComA, posterior communicating artery; PICA, posterior inferior cerebellar artery; VB, vertebro-basialr; WFNS, World Federation of Neurosurgical Societies scale.
T-Test.
Chi square test.
More than one procedure per patient allowed.
Correlation Between Indices and Their Agreement with Negative Transient Hyperemic Response Test
The correlation of TOxa with THRR and Sxa with THRR was modest but significant (r = −0.465, P ≤ 0.000001, n = 193 and r = −0.379, P ≤ 0.000001, n = 200, respectively). Similarly, the correlation between Sxa and TOxa was modest but significant (r = 0.360, P ≤ 0.000001, n = 321). Figure 1 depicts an example of monitoring data with Sxa, TOxa, and THRT all showing impaired autoregulation on day 5 after SAH in a patient who developed DCI on day 9.
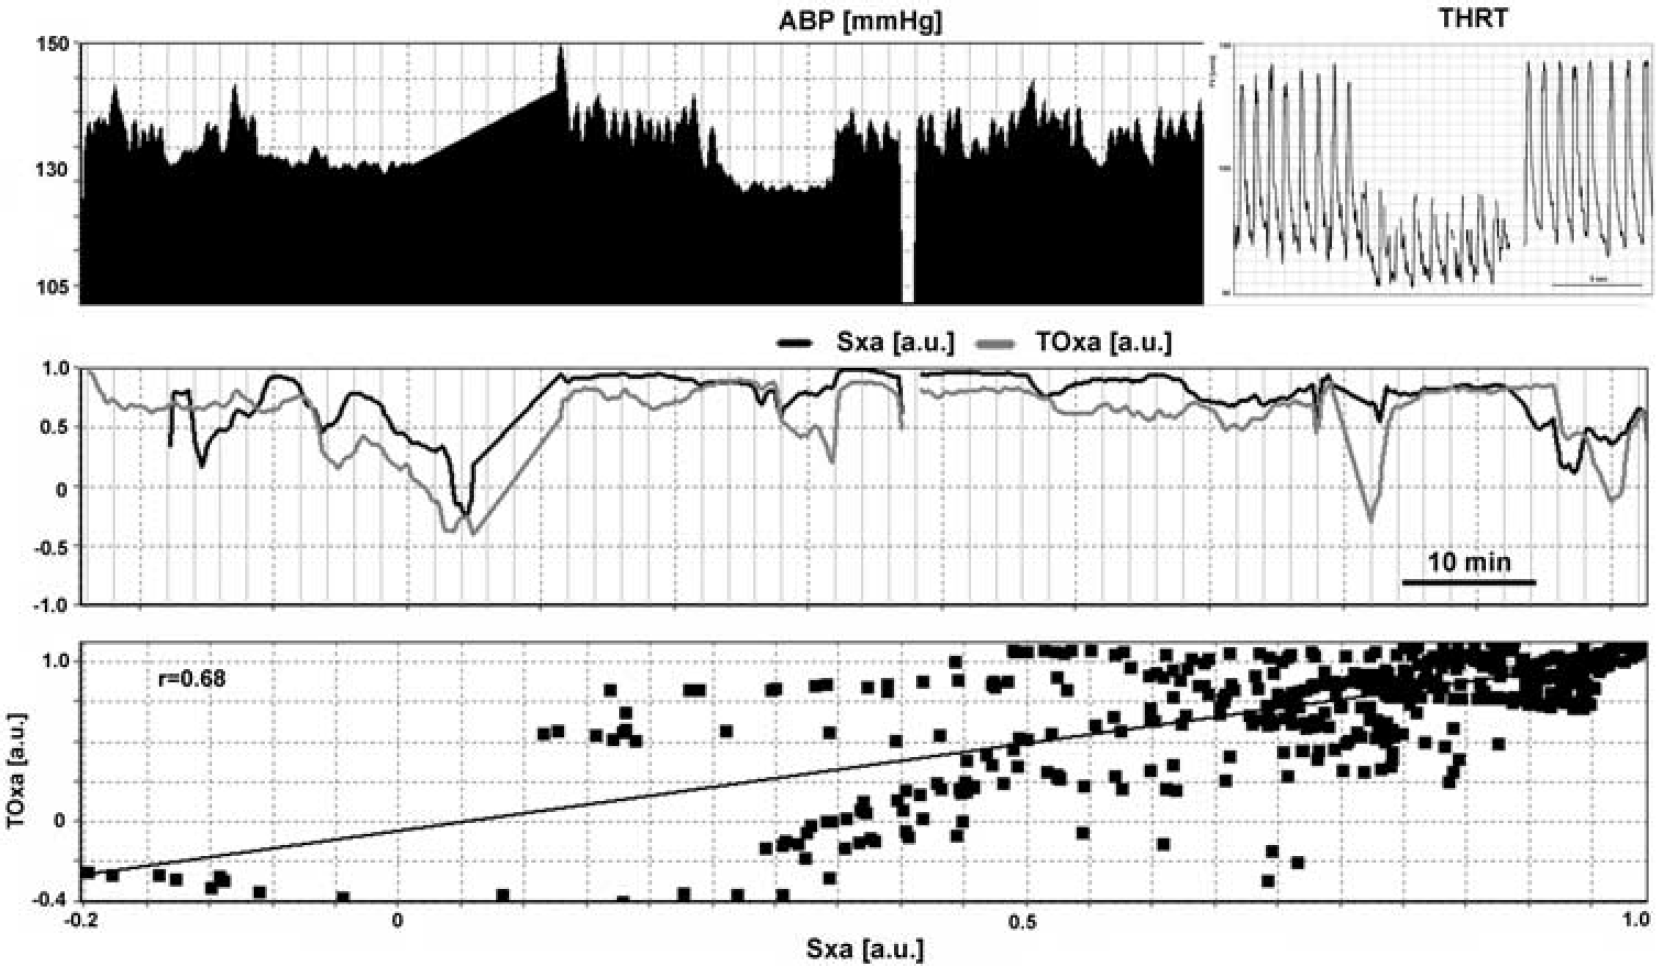
Example of monitoring performed on day 5 after ictus. Middle panel shows impaired autoregulation using Sxa (black line), TOxa (gray line), with values of indices close to +1. Similarly, the lack of a hyperemic response in THRT indicates impaired autoregulation (insert top panel). There is relatively good correlation between Sxa and TOxa (r = 0.68). The patient developed delayed cerebral ischemia on day 9. ABP, arterial blood pressure; Sxa, transcranial Doppler autoregulation; THRT, transient hyperemic response test; TOxa, near-infrared spectroscopy-based autoregulation.
Both Sxa and TOxa were able to accurately predict the presence of impaired autoregulation as evidenced by THRR ≤1.09 (area under the curve (AUC): 0.788, 95% CI: 0.723 to 0.854 and AUC: 0.827, 95% CI: 0.769 to 0.885, respectively) (Figure 2). The thresholds with the highest sensitivity and specificity were Sxa: 0.05 (sensitivity and specificity of 0.73 and 0.72) and TOxa: 0.13 (sensitivity and specificity of 0.77 and 0.71).
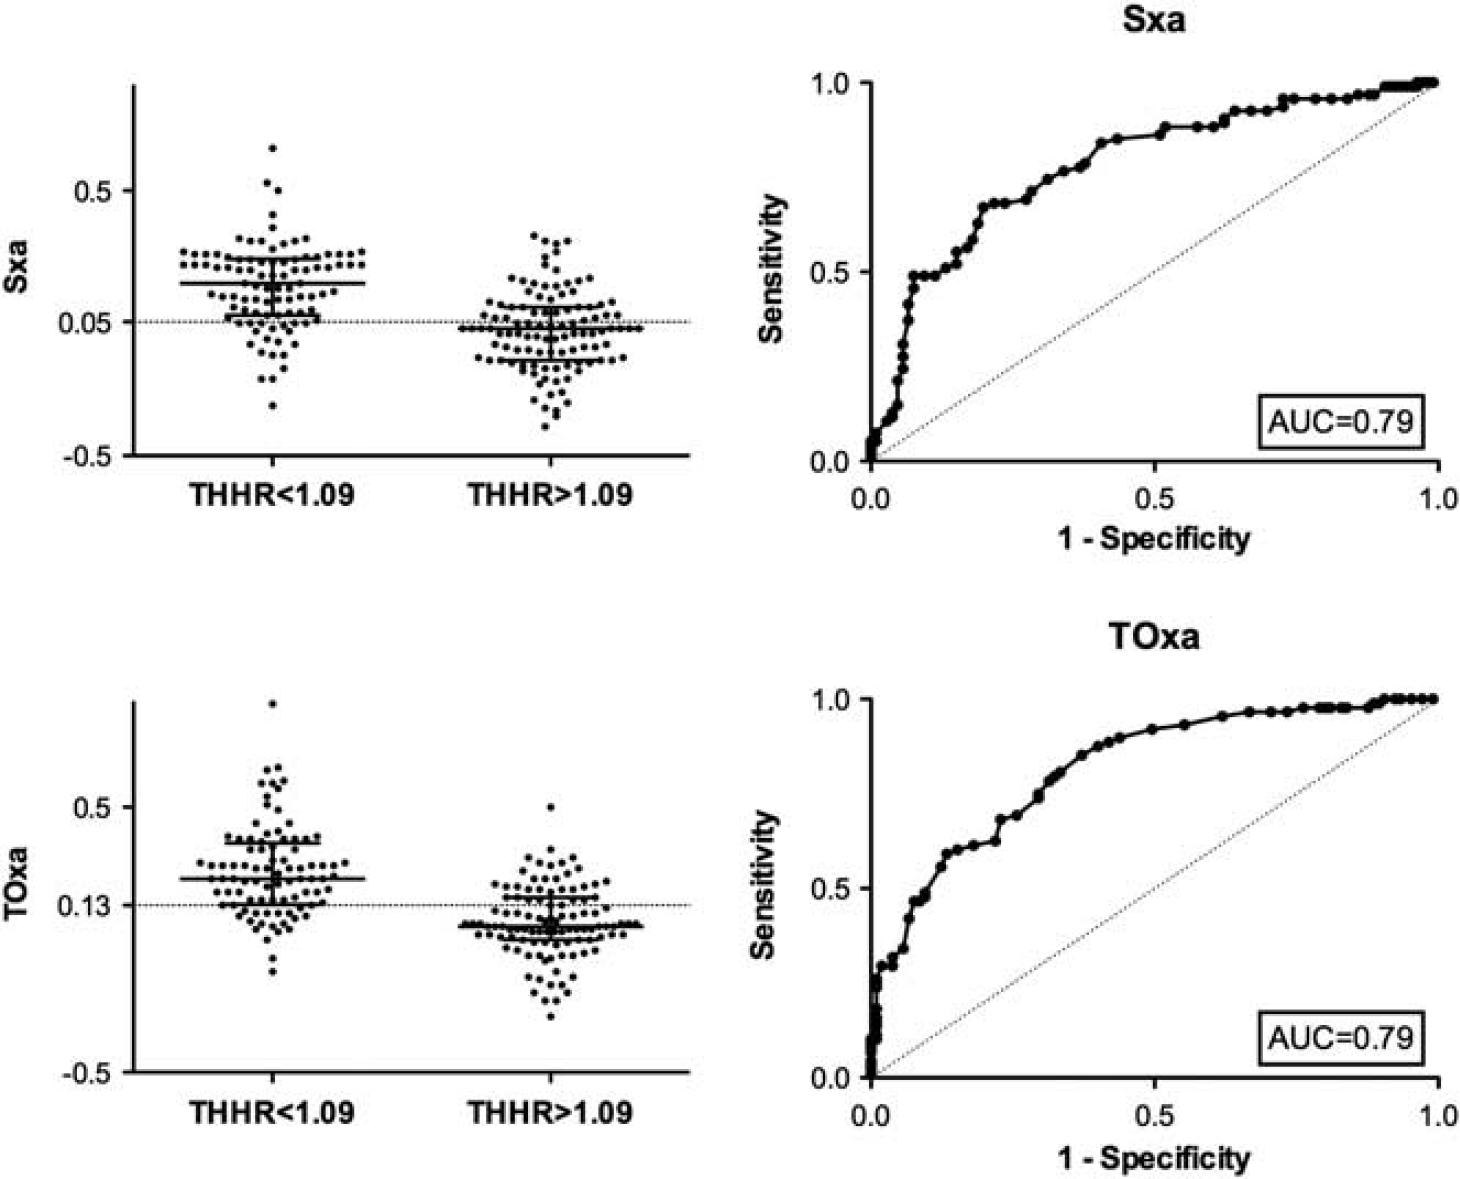
Scatter plot of Sxa (top) and TOxa (bottom) dichotomized to THRR ≤1.09 and THRR >1.09 with superimposed reference lines of optimal sensitivity and specificity as defined by the respective ROC curves (right): 0.05 for Sxa and 0.13 for TOxa. Similar accuracy for Sxa and TOxa in identifying impaired autoregulation as evidenced by THRR ≤ 1.09 can be seen. AUC, area under the curve; Sxa, transcranial Doppler autoregulation; THRR, transient hyperemic response ratio; TOxa, near-infrared spectroscopy-based autoregulation.
Determination of the Lower and Upper Limits of Autoregulation
When FV averaged from all recordings was binned according to blood pressure values a curve resembling the autoregulatory curve could be obtained suggesting LLA at 80 mm Hg and ULA at 120 mm Hg (mean blood pressure values are quoted in all cases). Subsequently, THRR, Sxa, and TOxa were binned using the same ABP thresholds to generate a static, group autoregulation curve for each index. The static, group plots for THRR, Sxa, and TOxa fared better at predicting the TCD-derived LLA than predicting the ULA (Figure 3). All three indices showed impaired AR below TCD-defined LLA of 80 mm Hg. Sxa showed impaired autoregulation above ABP of 125 mm Hg, TOxa showed a much narrower range with impaired autoregulation seen above ABP of 105 mm Hg, and the ULA was not seen when THRR was used.
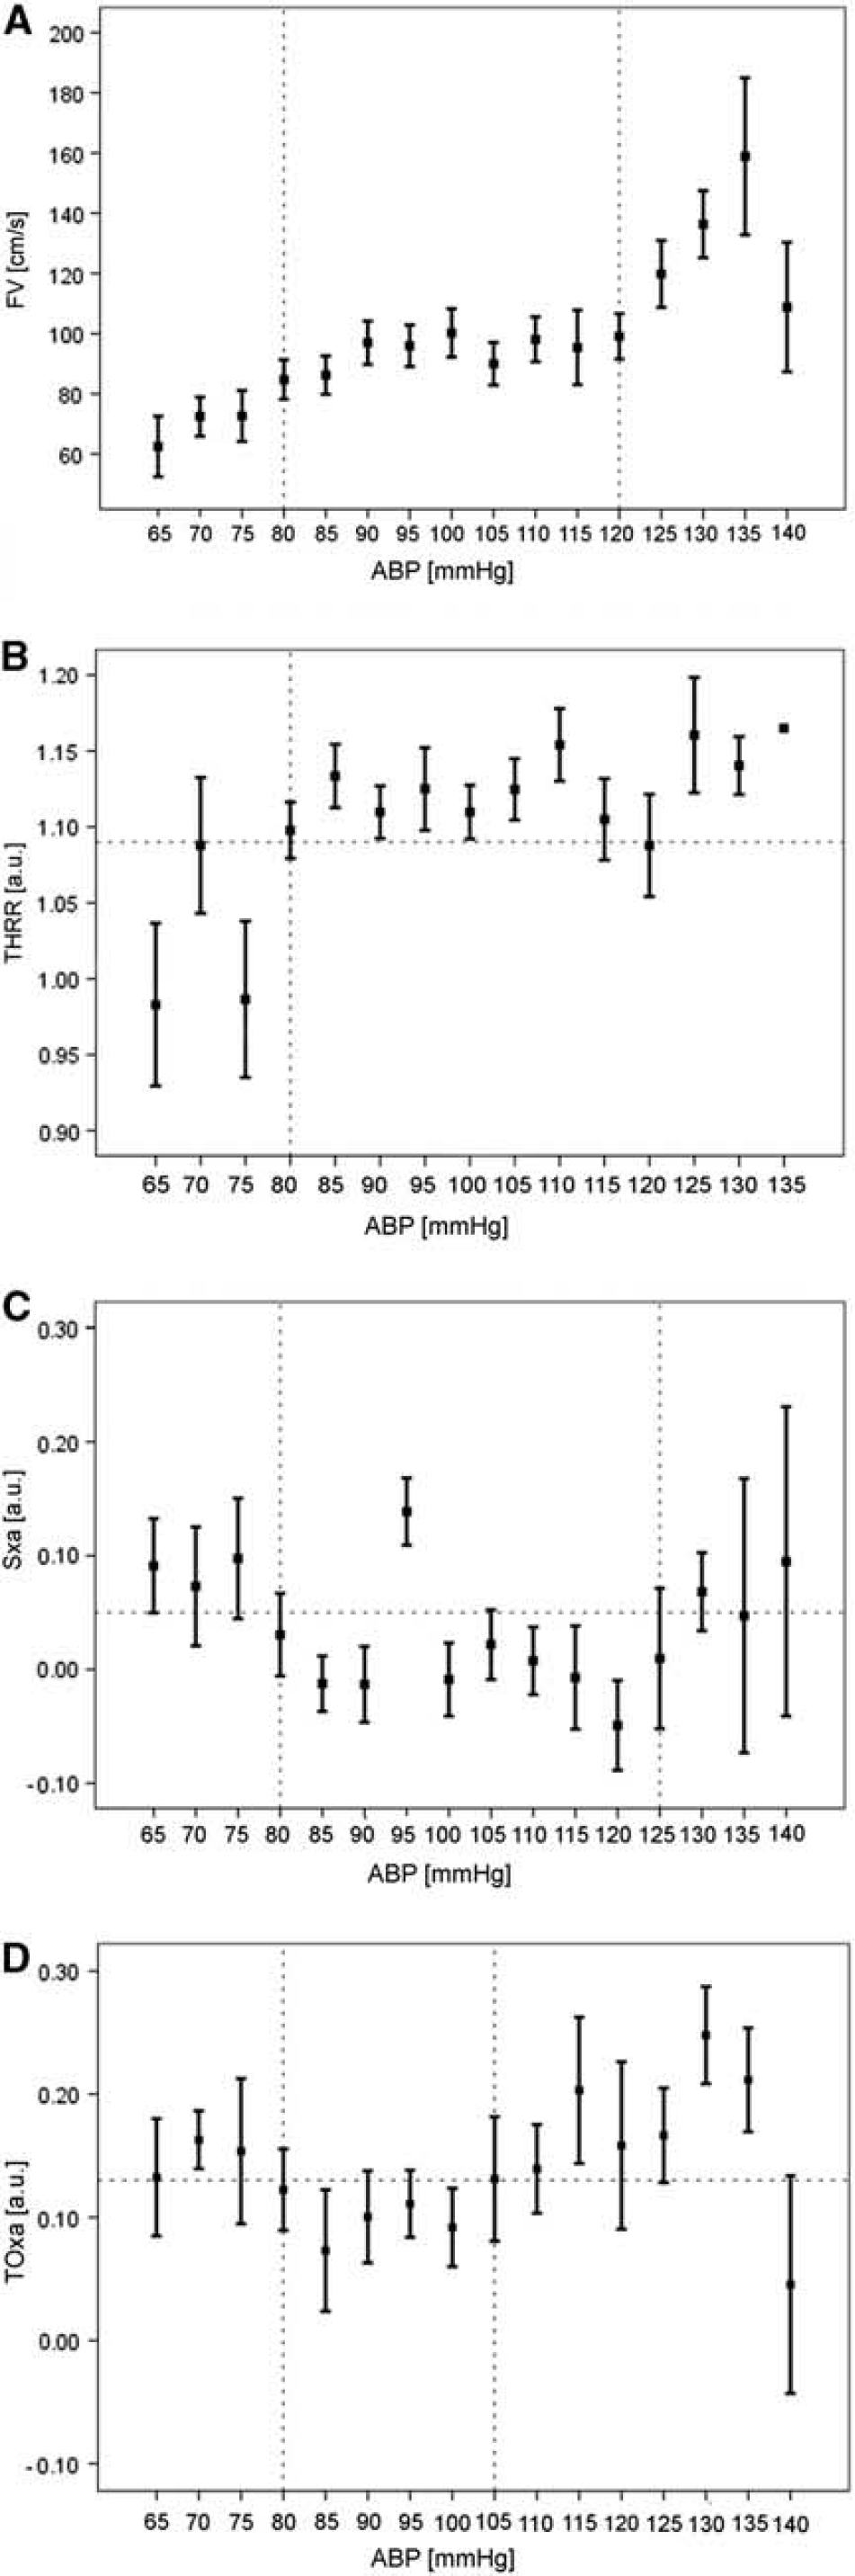
FV plotted against ABP bins shows an autoregulation curve with the LLA at 80 mm Hg and ULA at 120 mm Hg (vertical dashed lines) (
Early Autoregulatory Failure and Prediction of Delayed Cerebral Ischemia
Averaged data from the first 5 days after ictus were used to construct ROC curves to compare the accuracy of all three modalities of predicting development of DCI (Figure 4). Importantly, there were two patients who developed DCI before day 5. These patients were not excluded from the analysis, as the authors have previously found that exclusion has very little effect on the overall predictive value. 9 The highest AUC was observed for Sxa (AUC: 0.857 95% CI: 0.731 to 0.984), however, the differences in AUC between indices and their combinations were not significant. Table 2 summarizes the respective AUC as well as sensitivity and specificity for all indices and combinations of indices. Thirteen out of thirteen patients in whom impaired autoregulation during the first 5 days was confirmed using all three indices developed DCI, showing 100% specificity with 61% sensitivity.
Prediction of DCI
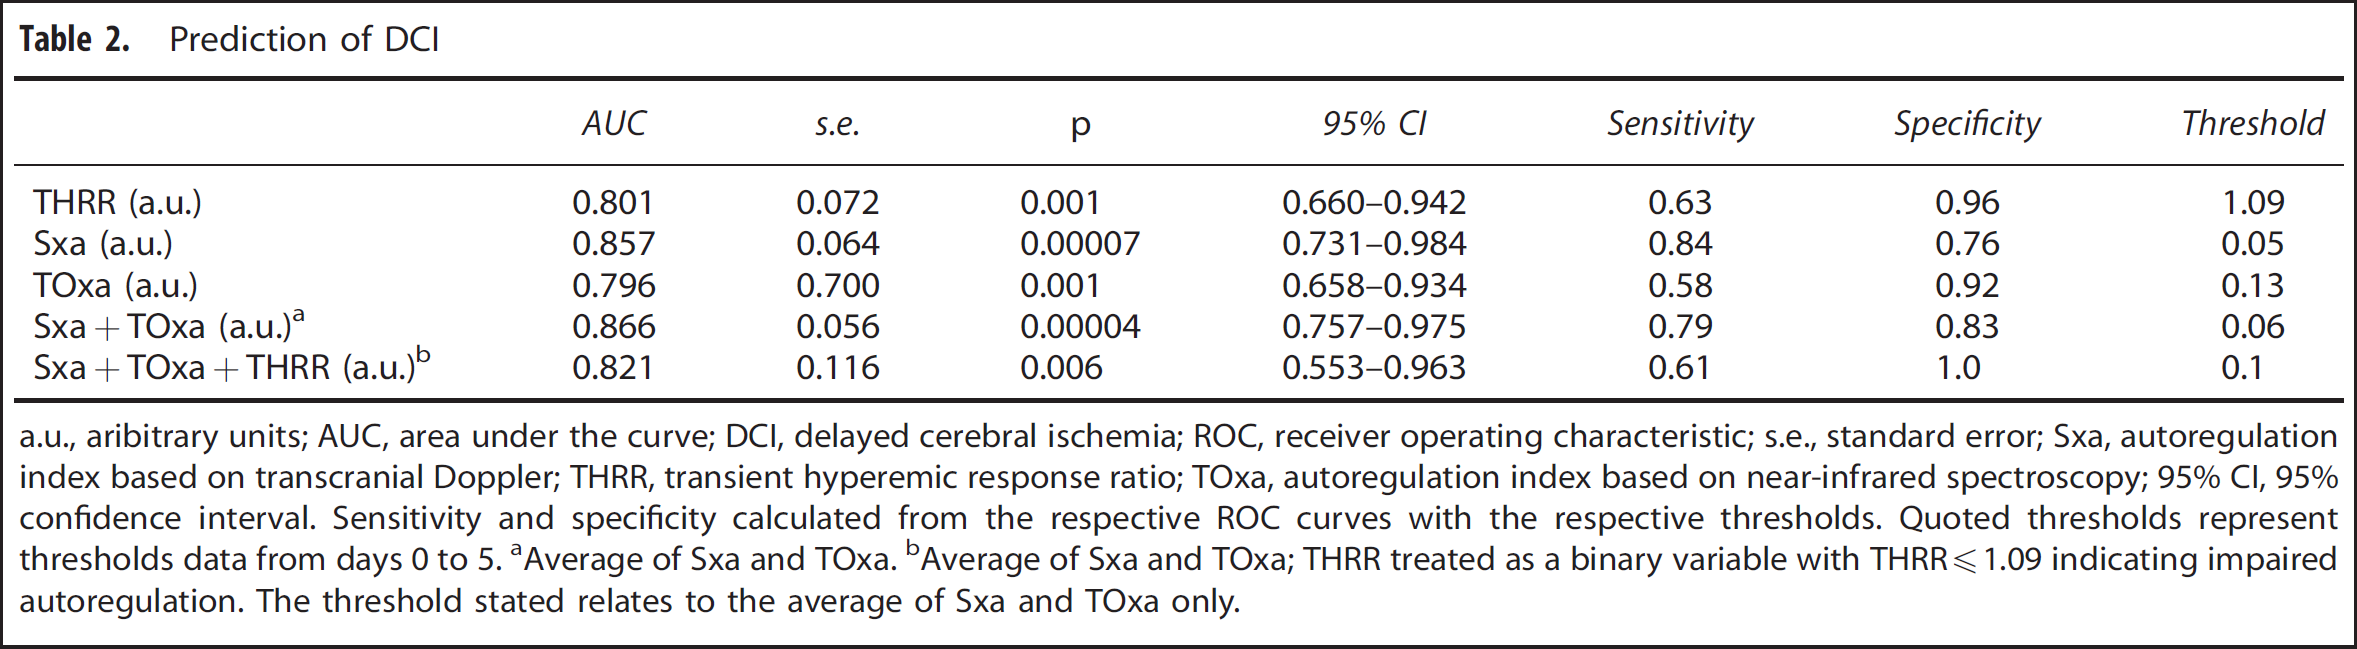
a.u., aribitrary units; AUC, area under the curve; DCI, delayed cerebral ischemia; ROC, receiver operating characteristic; s.e., standard error; Sxa, autoregulation index based on transcranial Doppler; THRR, transient hyperemic response ratio; TOxa, autoregulation index based on near-infrared spectroscopy; 95% CI, 95% confidence interval.
Sensitivity and specificity calculated from the respective ROC curves with the respective thresholds. Quoted thresholds represent thresholds data from days 0 to 5.
Average of Sxa and TOxa.
Average of Sxa and TOxa; THRR treated as a binary variable with THRR1.09 indicating impaired autoregulation. The threshold stated relates to the average of Sxa and TOxa only.
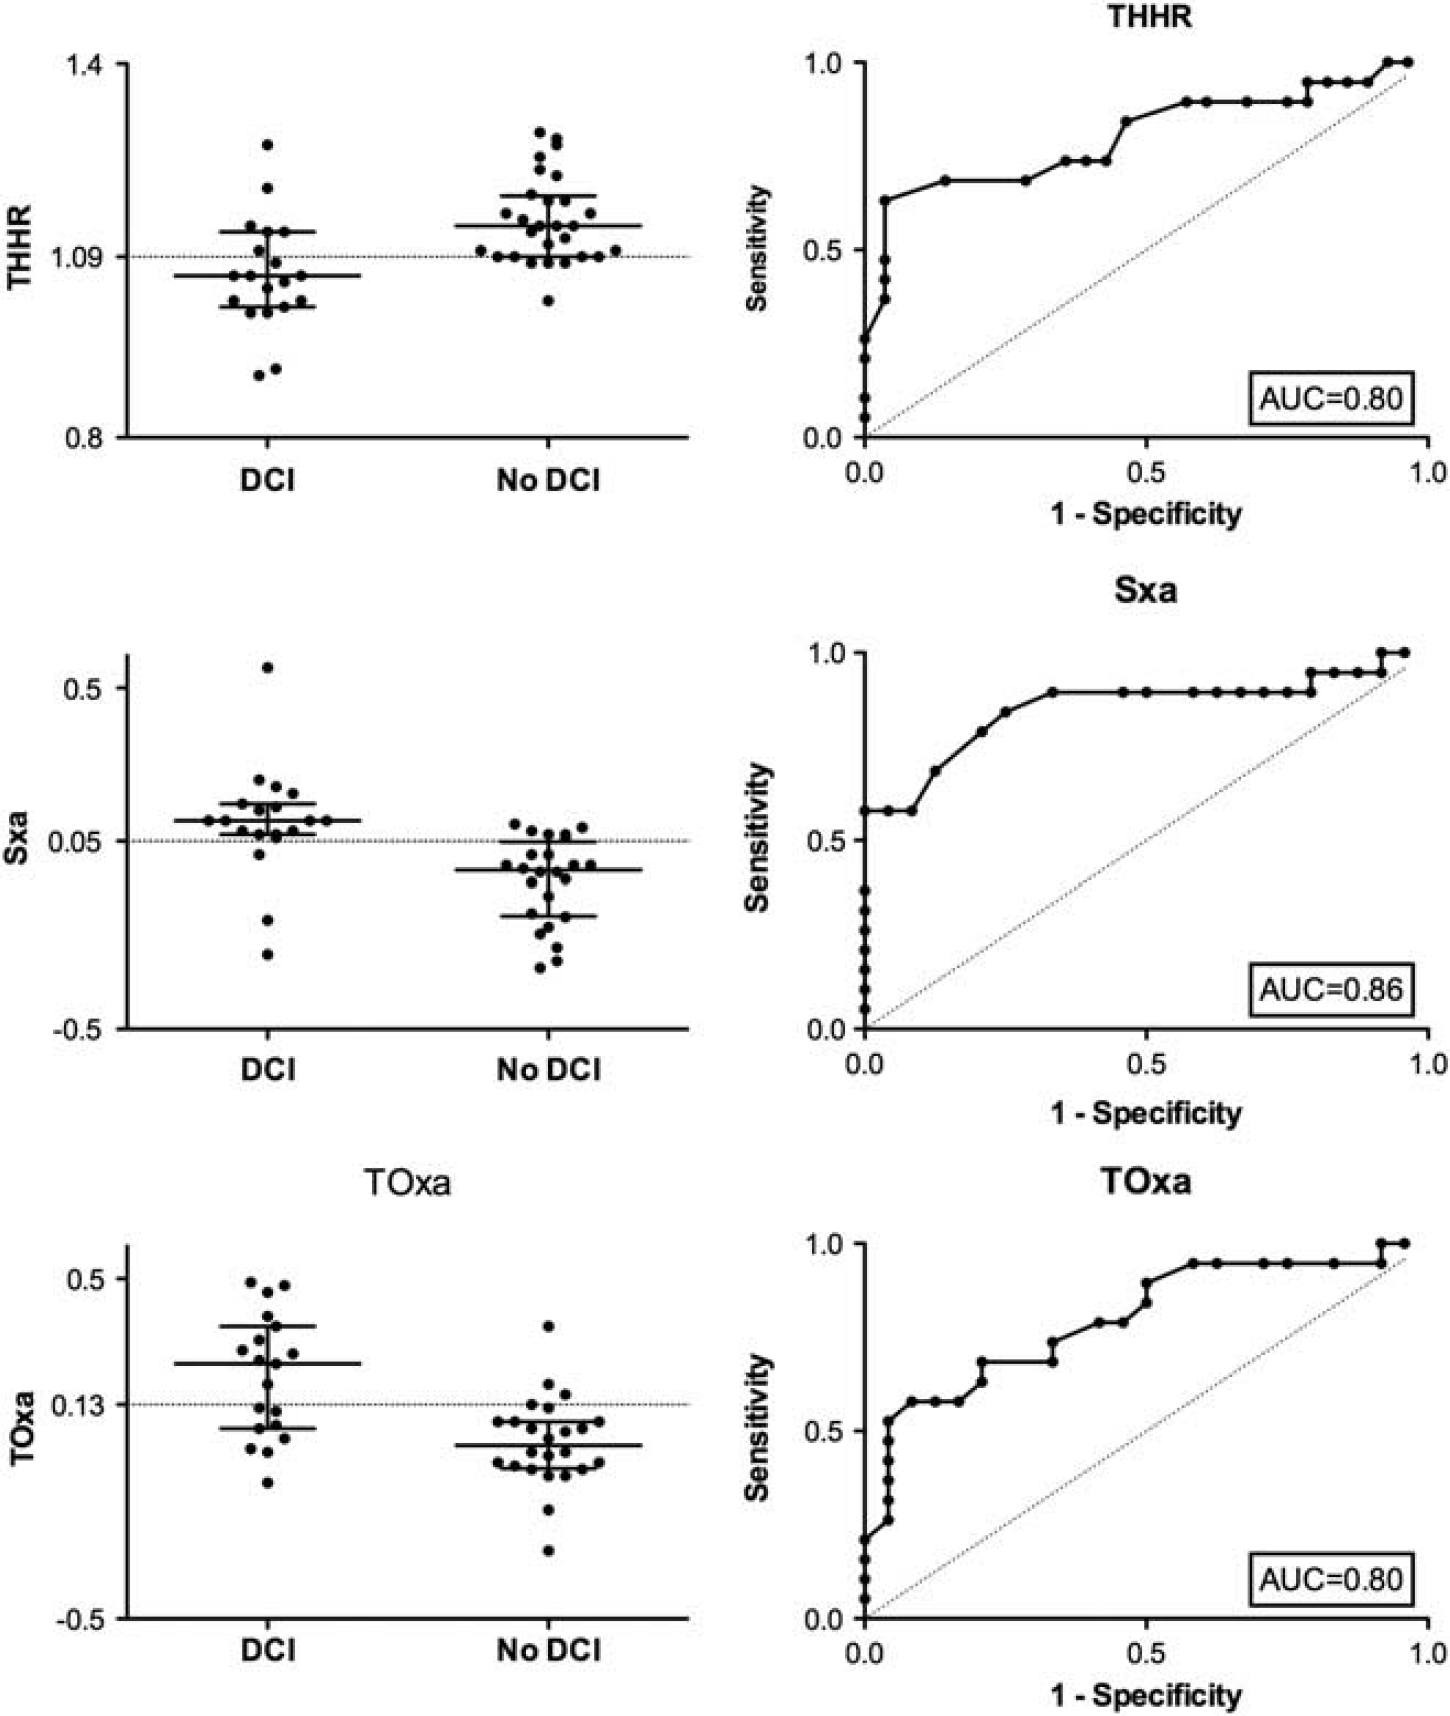
Autoregulation indices dichotomized into DCI and non-DCI groups with superimposed threshold for impaired autoregulation obtained from the respective ROC curves (0.05 for Sxa, 0.13 for TOxa and 1.09 for THRR). ROC curve analysis showing the ability of autoregulation indices from the first 5 days to predict DCI. AUC, area under the curve; DCI, delayed cerebral ischemia; ROC, receiver operator characteristic; Sxa, transcranial Doppler-based index of autoregulation; THRR, transient hyperemic response ratio; TOxa, near-infrared spectroscopy-based index of autoregulation.
DISCUSSION
We have shown that both continuous indices, Sxa and TOxa, could predict impaired autoregulation evidenced by a negative THRT. However, the observed correlations between the indices, although significant, were only moderate. Furthermore, there were differences in identifying the upper breakpoint of ABP above which autoregulation failed. All three indices performed equally well in predicting the development of DCI. Simultaneous impairment of autoregulation using all three indices was 100% specific in predicting DCI.
Methodological Considerations
For this analysis, we have chosen the THRT as the comparator. Of the three considered indices, only THRT utilizes a direct challenge to the cerebrovascular system, by briefly obstructing the flow in the internal carotid artery. Despite collateral flow via the circle of Willis the observed decrease in FV and the following hyperemic response are undoubtedly the result of a decrease in blood flow and reactive vasodilation, making the qualitative interpretation of the results unambiguous. Furthermore, THRT in prospective observational studies was shown to be useful in predicting clinical deterioration after SAH.2,6 However, while clinical and experimental data exist supporting the validity of Sxa and TOxa,13,23,25,31,32,34 neither index has been evaluated for its power to predict DCI.
The mean flow index, Mx, which is derived from mean FV and CPP and its noninvasive version, Mxa, where ABP is used instead of CPP, have been previously investigated in patients with SAH.3,35 In the present study, we have used an alternative index derived from systolic values of FV as previously described.13,31,32 In one study of 32 patients with SAH changes in autoregulation during vasospasm were identified more accurately with Mx than with Sx. 35 However, a cohort study of 300 patients with head injury showed that Sxa had a stronger association with outcome than Mxa. 31
Relationship of Continuous Indices, Sxa and TOxa, with Transient Hyperemic Response Ratio
Both Sxa and TOxa showed good accuracy for predicting impaired autoregulation as seen by a THRR of ≤1.09, without significant differences between the two methods. However, the correlations between THRR and Sxa and TOxa were relatively poor, in keeping with previous reports from head injury. 13 Compared with the discrete assessment of autoregulation that is obtained with the THRT, Sxa and TOxa provide continuous autoregulation monitoring.
We have also observed that the correlation between Sxa and TOxa was moderate. Changes of FV in the MCA are modulated by the distal resistance vessels, providing the diameter of the insonated artery remains constant. 36 However, NIRS measures surrogates of cerebral blood flow in the mixed arterio-venous compartment in cerebral cortex located in the watershed area between the MCA and anterior cerebral artery, where, in patients with normal pressure hydrocephalus, autoregulation has been suggested to be weaker. 37 Perhaps, this is why values of TOxa are lower than Sxa (Supplementary Table 1). The two modalities measure different anatomic regions of the brain as well as different vascular beds. It is conceivable that focal disturbances of cerebral blood flow, which are known to occur after SAH, 38 may influence the two modalities differently. Furthermore, current understanding of the development of DCI suggests a multifactorial process with microemboli, microthrombosis, macrovascular spasm, and cortical spreading depolarization all playing a part. 39 These processes may not affect the entire cerebral vasculature equally, which may contribute to the observed differences between THRT, Sxa, and TOxa.
Identification of the Lower and Upper Limits of Autoregulation
When FV data from the group were binned and averaged across ABP, a curve depicting the upper and lower limits of autoregulation was seen. 40 The group LLA was consistently identified at the same blood pressure level, around 80 mm Hg, using all analyzed indices. However, there were discrepancies between the indices in identifying the ULA, which was considerably lower when using TOxa (105 mm Hg) than Sxa (125 mm Hg) and absent when THRR was used. Overall, the obtained range at which autoregulation was active was narrowed compared with classical values of 50 to 150 mm Hg. However, similar results are obtained when data from head injured patients are analyzed, 41 suggesting that acute cerebral injury may cause narrowing of the autoregulatory plateau. Unfortunately, because of the limited numbers we were not able to identify the ULA and LLA separately for DCI and non-DCI groups. Furthermore, we were not able to make autoregulation curves for each patient separately, therefore, we are unable to discuss the temporal changes in the ULA and LLA after SAH.
Transient hyperemic response ratio is a measure of autoregulatory vasodilatation, while the ULA is related to vasoconstriction, making the absence of ULA expected, with similar findings reported in head injury. 13 The discrepancies between Sxa and TOxa cannot be reliably explained using the presented data. We can only speculate that different pathologic processes are responsible for autoregulatory failure seen at the level of arterial capacitance vessels (Sxa), and the mixed arterio-venous compartment (TOxa).
Prediction of Delayed Cerebral Ischemia
Despite the observed differences, all three methods showed equivalent accuracy in predicting the development of DCI. Importantly, simultaneous demonstration of autoregulatory failure using all three indices had 100% specificity for predicting DCI. Concomitant use of continuous Sxa and TOxa resulted in both high sensitivity and specificity (close to 80%). It seems that, while undoubtedly considerable colinearities between the methods exist, there is merit in using multimodal monitoring of cerebral autoregulation after SAH.
CONCLUSIONS
There was a significant correlation between the analyzed methods and the accuracy for determining impaired autoregulation was similar. All methods showed good accuracy for predicting DCI, with very high specificity when all three indices were in agreement. Detailed studies are required to elucidate the exact mechanisms leading to DCI and their effect on different parts of the cerebral vascular tree with respect to autoregulatory failure.
DISCLOSURE/CONFLICT OF INTEREST
ICM + Software is licensed by Cambridge Enterprise, Cambridge, UK, http://www.neurosurg.cam.ac.uk/icmplus/. MC and PS have a financial interest in a fraction of the licensing fee.
Footnotes
References
Supplementary Material
Please find the following supplemental material available below.
For Open Access articles published under a Creative Commons License, all supplemental material carries the same license as the article it is associated with.
For non-Open Access articles published, all supplemental material carries a non-exclusive license, and permission requests for re-use of supplemental material or any part of supplemental material shall be sent directly to the copyright owner as specified in the copyright notice associated with the article.