
Abstract
The study investigated the sensitivity of a novel MRI-based OEF mapping, quantitative susceptibility mapping plus quantitative blood oxygen level-dependent imaging (QSM+qBOLD or QQ), to physiological changes, particularly increased oxygen extraction fraction (OEF) by using hyperventilation as a vasoconstrictive stimulus. While QQ’s sensitivity to decreased OEF during hypercapnia has been demonstrated, its sensitivity to increased OEF levels, crucial for cerebrovascular disorders like vascular dementia and Parkinson’s disease, remains unexplored. In comparison with a previous QSM-based OEF, we evaluated QQ’s sensitivity to high OEF values. MRI data were obtained from 11 healthy subjects during resting state (RS) and hyperventilation state (HV) using a 3 T MRI with a three-dimensional multi-echo gradient echo sequence (mGRE) and arterial spin labeling (ASL). Region of interest (ROI) analysis and paired t-tests were used to compare OEF, CMRO2 and CBF between QQ and QSM. Similar to QSM, QQ showed higher OEF during HV compared to RS: in cortical gray matter, QQ-OEF and QSM-OEF was 36.4
Keywords
Introduction
Cerebral metabolic rate of oxygen (CMRO2) and oxygen extraction fraction (OEF) have been considered as vital biomarkers for assessing tissue viability and activity.1,2 Recent advancements in MRI techniques have made their mapping possible for diagnosing and evaluating neurological conditions such as ischemic stroke, 3 Alzheimer disease, 4 and tumor. 5 Primarily, MRI methods have focused on the magnitude signal modeling for OEF estimation, including calibrated fMRI,6 –9 quantitative imaging of extraction of oxygen and tissue consumption (QUIXOTIC), 10 quantitative blood oxygen level dependent imaging (qBOLD). 11 However, novel OEF techniques that model the often-neglected MRI phase signal have been introduced, including susceptometry-based oximetry,12,13 and quantitative susceptibility mapping (QSM)-based OEF.14,15
QSM-based OEF methods initially focused on estimating macrovascular OEF based on the relationship between venous oxygenation and susceptibility to infer regional OEF information.16 –19 However, issues such as low spatial specificities (i.e., difficulties in identifying accurate brain regions draining into the corresponding veins) and partial volume effects have promoted the development of microvascular QSM-based OEF techniques.16 –20 Microvascular QSM-based OEF mapping, here referred to as QSM-OEF, directly measures regional tissue oxygen metabolism by separating susceptibility distributions of microvasculature (e.g., capillaries) from non-blood tissue within the cerebral parenchyma. 18 Hence, QSM-OEF enables OEF quantification at the voxel level.16 –20 For the susceptibility separation, QSM-OEF utilizes vascular challenges, such as hyperventilation. 19 Hyperventilation reduces the partial pressure of carbon dioxide (CO2) in arterial blood leading to vasoconstriction and a subsequent decrease in cerebral blood flow (CBF), while cerebral metabolic rate of oxygen (CMRO2) remains relatively stable.21,22 However, this vascular challenge procedure is impractical in clinical settings. Moreover, QSM-OEF assumes that venous blood volume (v) is known from its linear relationship with CBF, which was derived from the whole-brain linear regression analysis in healthy subjects. 23 This assumption may not be valid at individual voxel level or in disease.
Recently, a novel OEF mapping technique, termed QQ, has been introduced, which removes the need for the vascular challenges and the unrealistic v-CBF assumption in QSM-OEF. QQ integrates QSM-OEF technique with qBOLD for comprehensive MRI signal modeling, utilizing both phase and magnitude signal (QSM + qBOLD = QQ). 24 QQ estimates OEF maps from multi-echo gradient (mGRE) data alone in a single brain state (e.g., resting state), whereas QSM-OEF requires both mGRE and arterial spin labeling (ASL) in two brain states (e.g., resting state and hyperventilation). Furthermore, the robustness of QQ against noise has been significantly improved by using unsupervised machine learning algorithms.25 –29 QQ has been validated against 15O-PET showing a great scan-rescan producibility in healthy subjects, 30 tested in other imaging sequences, 31 and applied in neurologic disorders.32 –42 QQ utilizes a practical data acquisition scheme, i.e., it uses a single routine sequence, mGRE, available in every MRI scanner and does not require any vascular challenges, unlike other OEF techniques that require specialized sequences and vascular challenges.6 –10 Consequently, QQ is readily applicable in clinical settings.
In this study, we aim to investigate the sensitivity of QQ to physiological changes, particularly to increased OEF. While a comparison study with calibrated fMRI demonstrated QQ’s sensitivity to decreased OEF driven by hypercapnia, 43 its sensitivity to increased OEF values has yet to be explored, which is crucial for investigating cerebrovascular disorders associated elevated OEF, including vascular dementia and Parkinson’s disease, where higher OEF is expected due to impaired CBF.44 –47 Comparing with QSM-OEF, we evaluated the sensitivity of QQ to increased OEF values.
Materials and methods
Data acquisition
The dataset utilized in this study was retrospectively obtained from previous QSM-OEF study which utilized resting state and hyperventilation. 19 This retrospective image analysis study received approval from the Weill Cornell Medicine local Institutional Review Board, and all participants provided written informed consent in accordance with the ethical standards of the 1975 Helsinki Declaration and its subsequent amendments. Healthy volunteers (n = 11, 1 female, mean age 34 ± 12 years) underwent brain MRI scanning twice: once while at resting state (RS) and again while the person was hyperventilating (HV). MRI scan was perform using a 3 Tesla scanner (HDxt, GE Healthcare, Waukesha, Wisconsin) utilizing an eight-channel brain receive coil.
Hyperventilation experiment
Participants were guided to hyperventilate at a specific rate (one inhale and exhale for every 2 to 3 seconds) prior to their scans. MRI scans were conducted both before and during hyperventilation using a protocol that included a 3D FSE ASL sequence and a 3D SPGR sequence. The scans during the hyperventilation state began 30 seconds after the start of hyperventilation. The hyperventilation period lasts for about 7 minutes. To minimize head motion, restrictive padding was used inside the head coil. Consequently, no noticeable motion artifacts were observed in either the ASL or SPGR datasets.
The imaging protocol includes an anatomical T1w BRAVO sequence, a 3D fast spin echo (FSE) ASL for CBF measurement, and a 3D mGRE sequence for OEF estimation. The parameters for the 3D FSE ASL sequence were as follows: a labeling period of 1500-ms, post label delay of 1525-ms, spiral sampling of eight interleaves with 512 readout points per leaf, readout bandwidth of 62.5-kHz, a 20-cm field of view (FOV), 3-mm isotropic resolution, 35 axial slices, 10.5-ms echo time (TE), 4796-ms pulse repetition time (TR), three signal averages, and 6-min scan time. The parameters for the 3D SPGR sequence includes seven equally spaced echoes, with a first TE of 4.3-ms, echo spacing of 7.9-ms, TR of 56.6-ms, 0.52-mm in plane resolution, 2-mm slice thickness, identical volume coverage as the 3D FSE ASL sequence, readout bandwidth of 62.5-kHz, 15
Data processing
CBF and QSM processing
CBF maps (ml/100 g/min) are created from the ASL data using the FuncTool software package (GE Healthcare, Waukesha, Wisconsin). QSM maps were calculated from mGRE data. Initially, susceptibility estimation involves obtaining the total field through a linear fit of the mGRE phase. 49 Then, the local field is estimated via the projection onto dipole field (PDF) method. 50 Subsequently, susceptibility is computed using the Morphology Enabled Dipole Inversion with automatic uniform cerebrospinal fluid zero reference (MEDI + 0) algorithm.15,51 –53
QQ-OEF and CMRO2 mapping from mGRE data at baseline and at hyperventilation separately
The QQ model estimates OEF based on the venous deoxyheme-dependent signal in the mGRE phase signal using QSM and the magnitude signal using qBOLD.
25
To obtain the OEF, QQ solves for venous oxygenation (
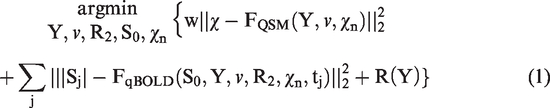
In the first term of equation (1), the QSM approach separates voxel wise susceptibility (
In the second term of equation (1), qBOLD models the OEF effect on the magnitude signal at the echo time,

In this study, we applied a machine learning algorithm, termed temporal clustering, tissue composition, and total variation (CCTV), to solve QQ robustly. First, CCTV utilized temporal clustering to group voxels with similar mGRE signals into the same clusters by using x-means algorithm, an improved version of k-means that automatically determines the optimal number of clusters. This approach is based on that voxels exhibiting similar mGRE signal decay have similar model parameter values. Then, each cluster was further divided into three sub-clusters (gray matter (GM), white matter (WM), and cerebrospinal fluid (CSF)) through the tissue composition process in CCTV, based on that the same type of tissue has similar tissue properties (including v and R2). This tissue type integration allows comprehensive clustering, which leads to enhanced optimization initialization. 26 Since the number of clusters is typically much smaller than the number of voxels (∼50 vs.106), averaging within these clusters can significantly enhance the signal-to-noise ratio (SNR). 25 Note that, above a certain number of clusters (e.g., 10 clusters), the number of clusters does not significantly affect the resultant OEF map, 25 which suggests that uniform OEF map from QQ-CCTV in this study may not be caused by the clustering, but it primarily represents the expected uniform oxygen extraction throughout the whole brain as seen in previous 15O-PET studies.30,59,60 Additionally, CCTV applies total variation regularization to minimize noise propagation into the OEF map. 61
Using the OEF, CMRO2 was estimated from the equation CMRO2 = OEF × CBF × [H]a, where [H]a = 7.377 µmol/mL is the oxygenated heme molar concentration in an arteriole with haematocrit (Hct) = 0.357. 17
QSM-OEF mapping at baseline and hyperventilation utilizing mGRE and ASL data in both resting state and hyperventilation together
The QSM-OEF model was implemented according to Zhang et al.
19
QSM-OEF solves for three unknowns (resting state OEF, hyperventilation OEF, and
ROI analysis
Cortical gray matter (CGM), deep gray matters (DGMs; thalamus, caudate, putamen, pallidum), and white matter (WM) masks were constructed by using FreeSurfer algorithm 62 on T1w BRAVO images, which were visually confirmed by a neuroradiologist (A.G.). CSF voxels were then excluded from the ROIs using a CSF mask, which was created by thresholding R2* values below 10 Hz and expanding it by approximately 2 voxels at the boundary to include partial-volumed edge voxels. For each ROI, the mean and standard deviation of OEF, CBF, and CMRO2 from QQ and QSM technique were measured in both before RS and during HV. Paired sample t-tests and Bland-Altman (BA) plots were performed to compare the differences in OEF, CBF, and CMRO2, in CGM during RS and HV across the subjects. The Shapiro-Wilk test confirmed the normality of each ROI data distribution (all p-values >0.05). A P-value less than 0.05 was considered statistically significant. P-values are adjusted using False Discovery Rate (FDR) correction to address multiple comparison. All data were expressed as mean ± standard deviation.
Results
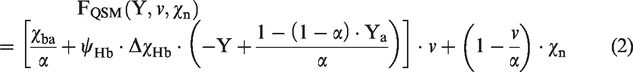
Figure 1 shows OEF maps in two representative subjects at RS and HV using QSM and QQ. Compared to QSM, QQ showed a more uniform OEF. In CGM, QQ showed similar average OEF values compared to QSM at both RS and HV. Specifically, the average OEF values for the 11 healthy participants at RS were 36.4 ± 4.7% for QQ and 35.3 ± 12.5% for QSM (P = 0.51), and at HV were 45.0 ± 11.6% for QQ and 45.0 ± 14.8% for QSM (P = 0.98), as detailed in Table 1. Both QSM and QQ showed significantly increased OEF at HV compared to RS: QQ (P = 0.005) and QSM (P < 0.001).
OEF maps from QSM and QQ between RS and HV in two subjects. QQ shows more uniform OEF than QSM. Both QQ and QSM shows decreased OEF in RS when compared to HV. The unit of color scale is %. The corresponding T1 BRAVO images are shown below for each subject.
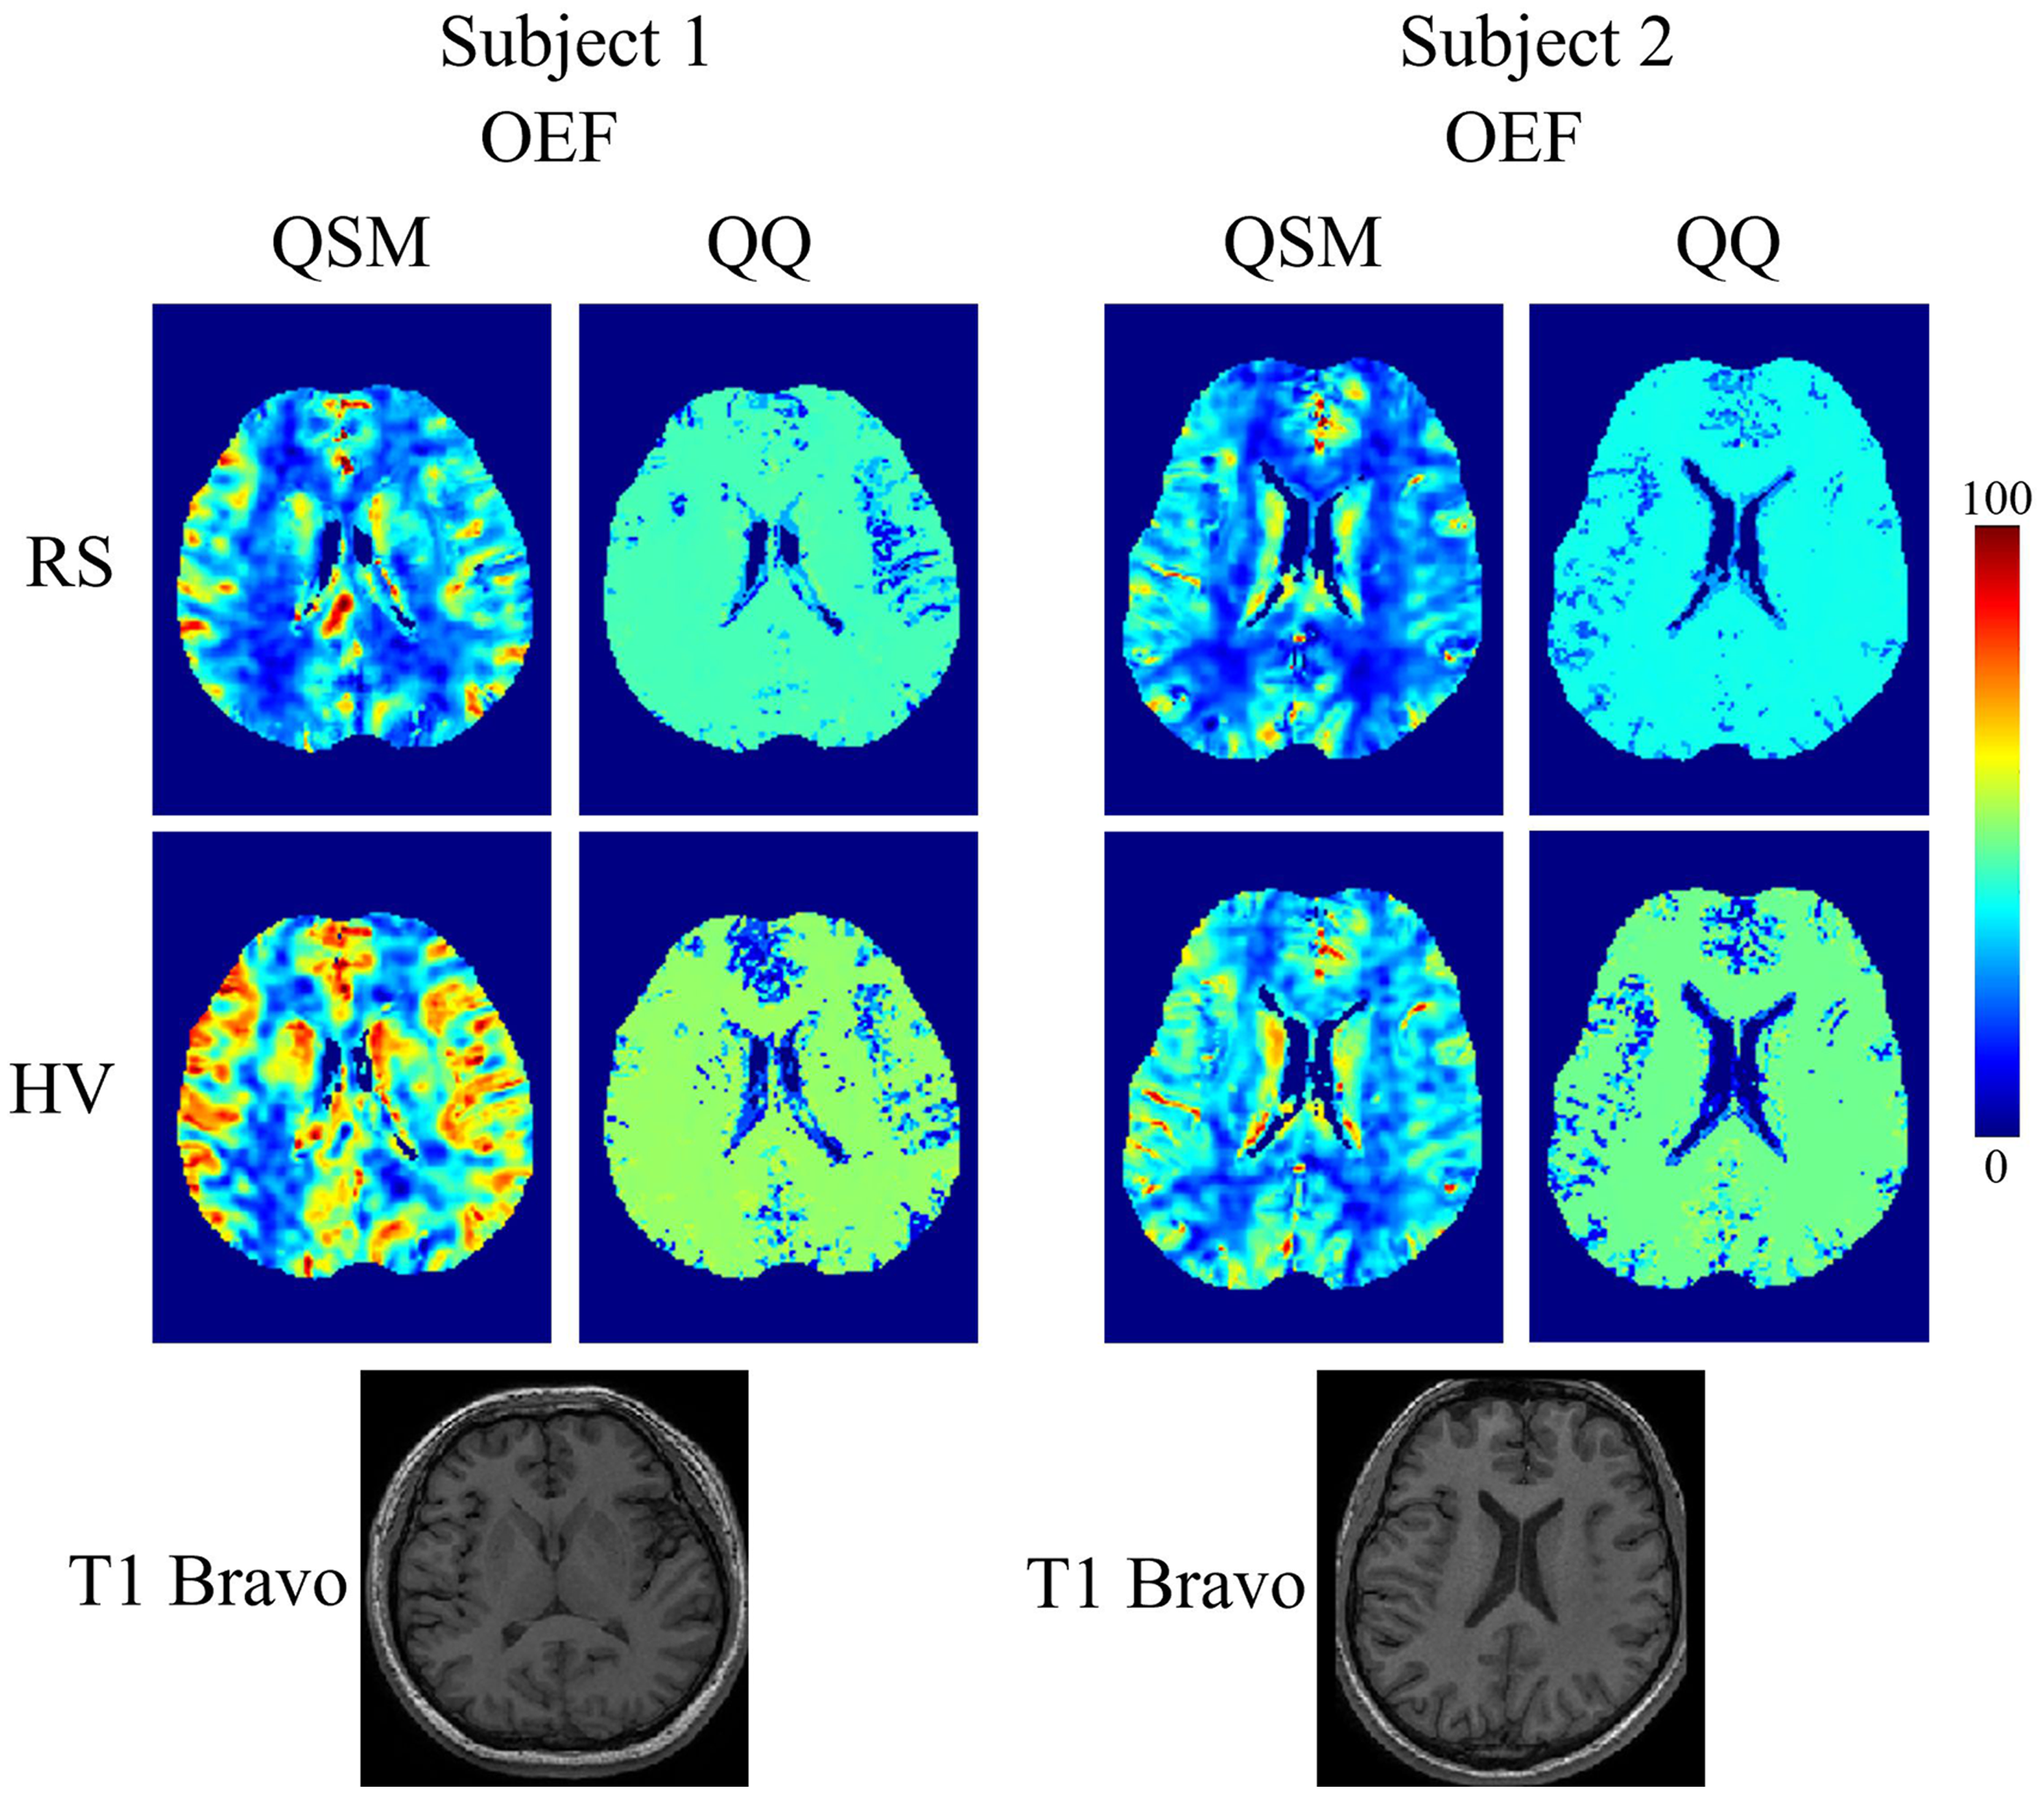
Average OEF, CMRO2 and CBF in CGM.
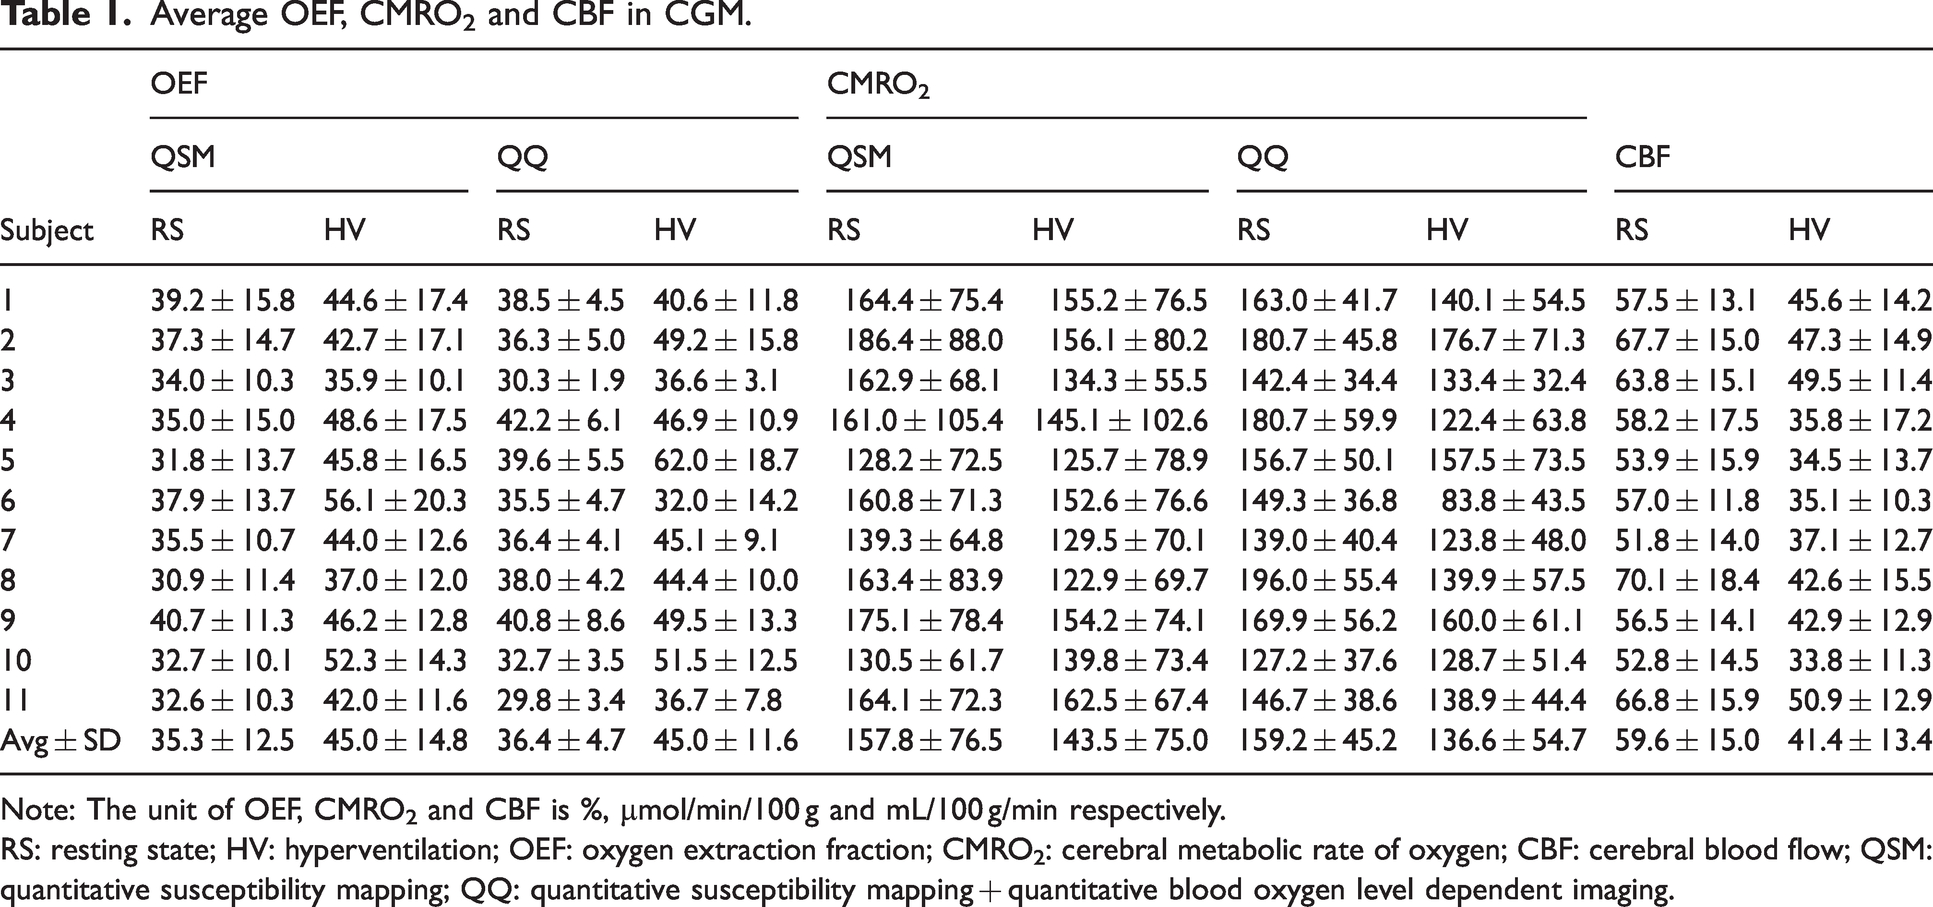
Note: The unit of OEF, CMRO2 and CBF is %, µmol/min/100 g and mL/100 g/min respectively.
RS: resting state; HV: hyperventilation; OEF: oxygen extraction fraction; CMRO2: cerebral metabolic rate of oxygen; CBF: cerebral blood flow; QSM: quantitative susceptibility mapping; QQ: quantitative susceptibility mapping + quantitative blood oxygen level dependent imaging.
Figure 2 shows CMRO2 and CBF maps in the same two subjects at RS and HV for QSM and QQ. QQ showed clear CMRO2 contrast CGM and WM. In CGM, QQ showed lower CMRO2 value to that of QSM: during RS, the average CMRO2 values for the 11 healthy participants were 159.2 ± 45.2 µmol/100 g/min for QQ and 157.8 ± 76.5 µmol/100 g/min for QSM (P = 0.86), and during HV were 136.6 ± 54.7 µmol/100 g/min for QQ and 143.5 ± 75.0 µmol/100 g/min for QSM (P = 0.52). Both QSM and QQ showed a decrease in CMRO2 during HV compared to RS: QQ (P = 0.0199) and QSM (P = 0.0139). CBF was higher during RS compared to HV, with the average CBF values for the 11 subjects being 59.6 ± 15.0 mL/100 g/min for RS and 41.4 ± 13.4 mL/100 g/min for HV (P < 0.05) in CGM.
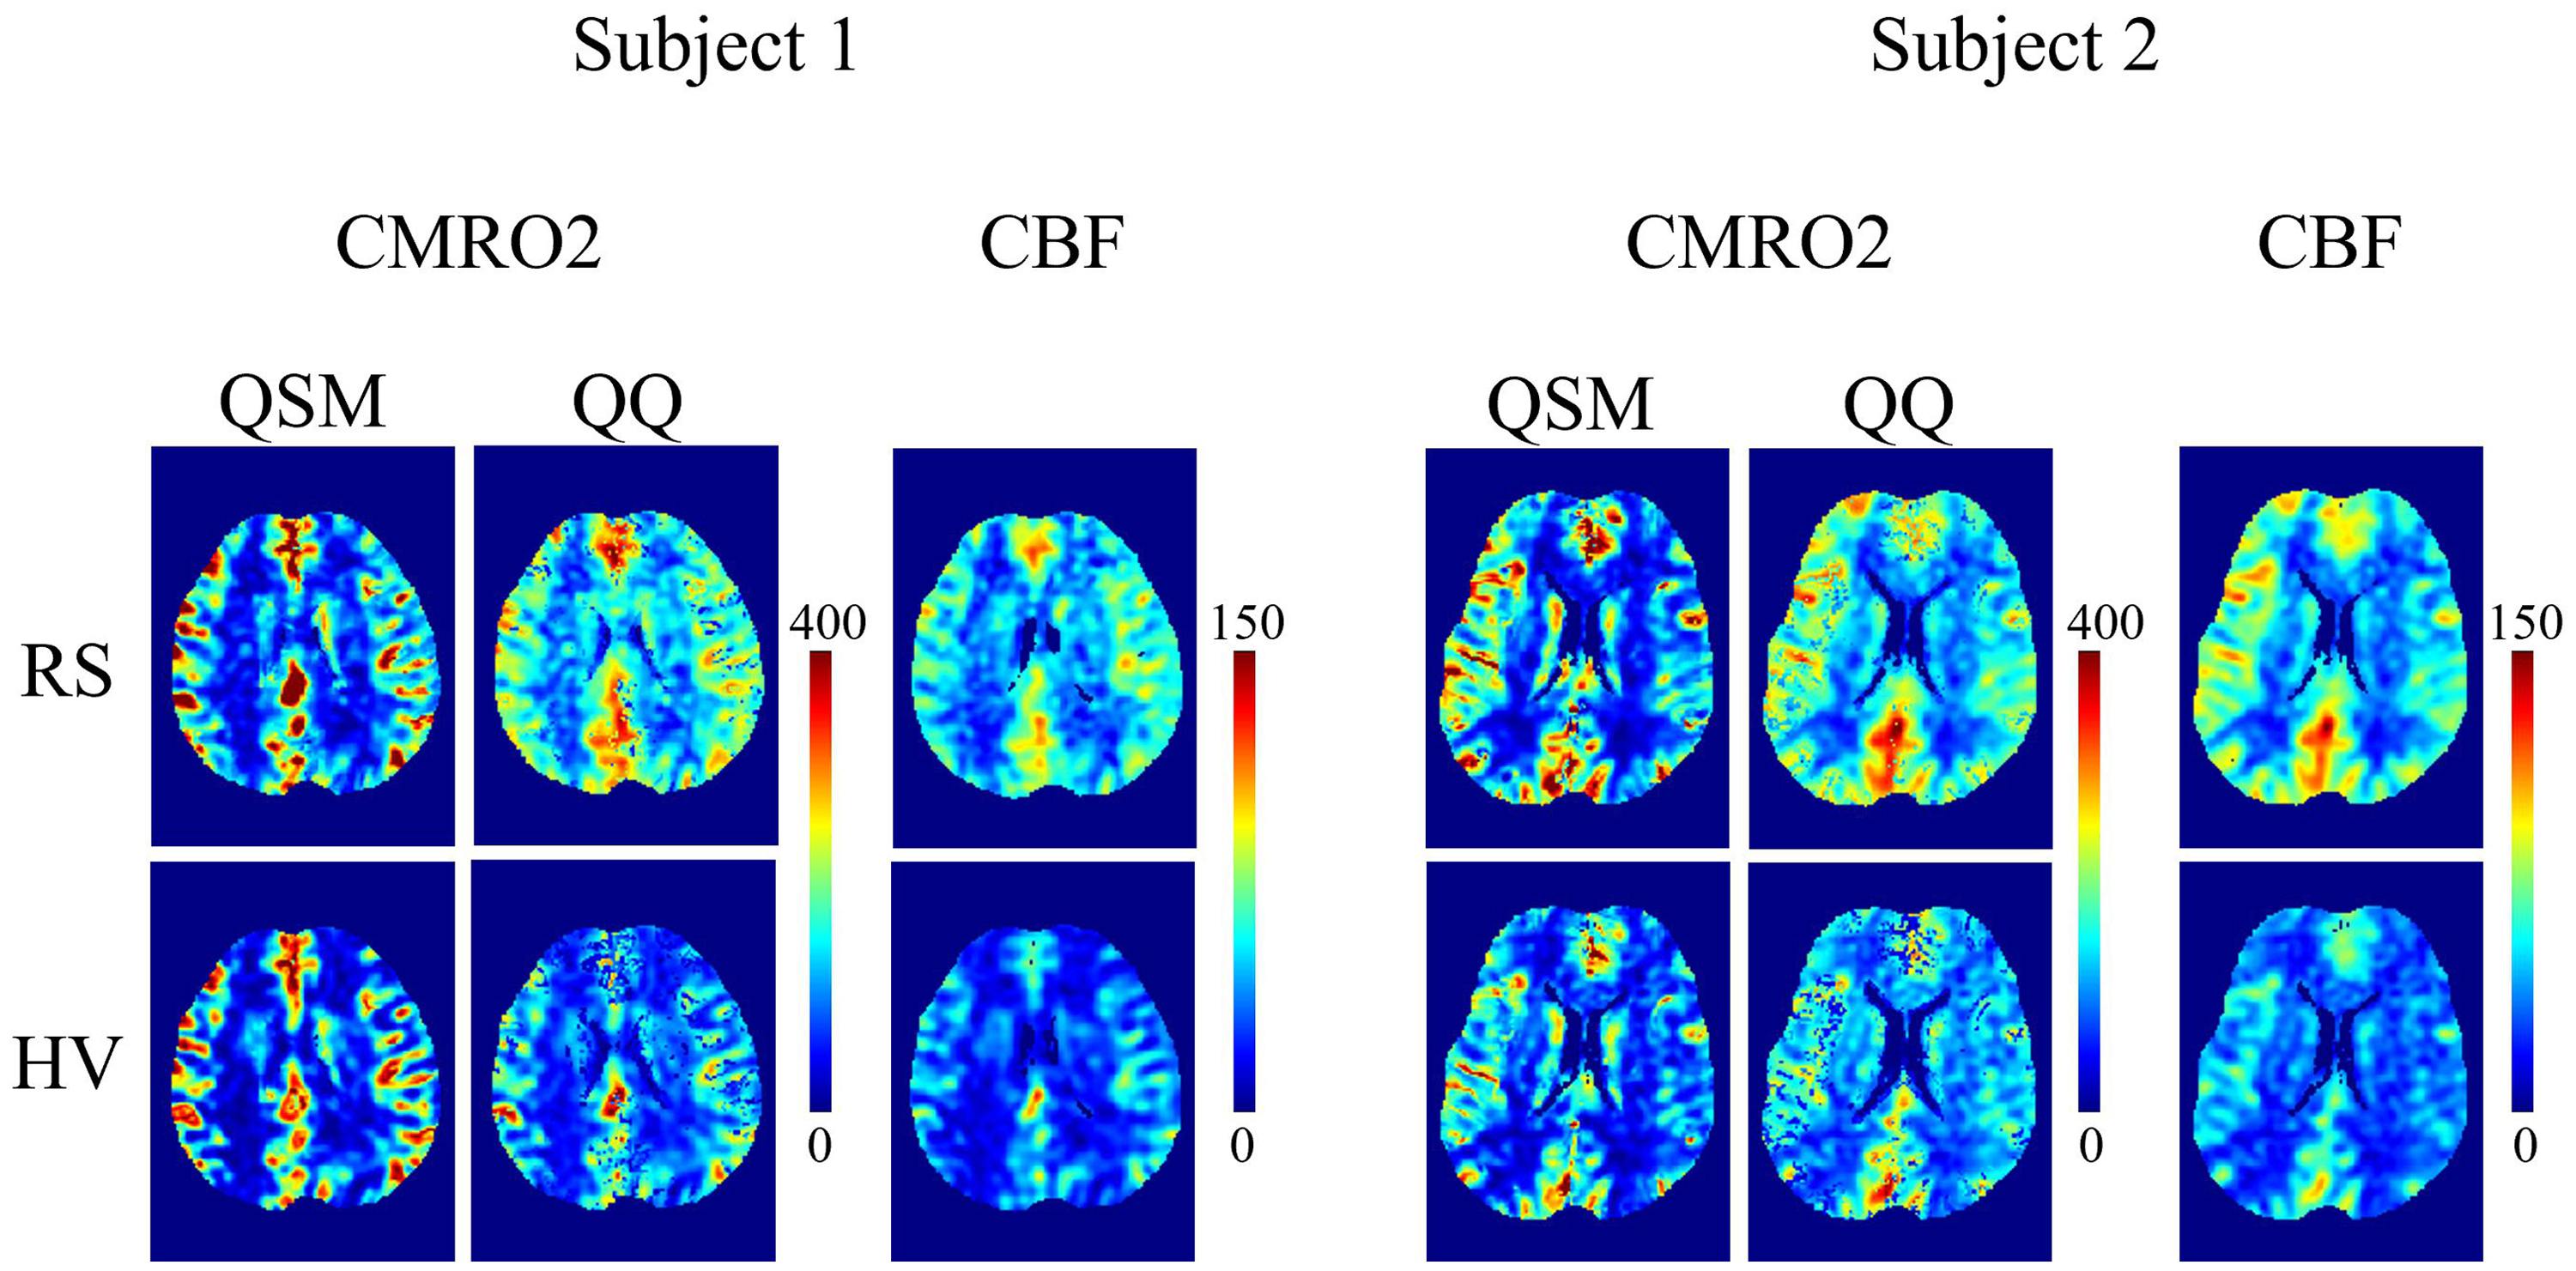
CMRO2 and CBF maps from QSM and QQ between RS and HV in the same two subjects as in Figure 1. QQ shows good CMRO2 contrast between CGM and WM. The CBF was obtained by registering to OEF resolution. The unit of color scale is mol/100 g/min for CMRO2 and mL/min/100 g for CBF.
Figure 3 shows boxplots of OEF, CMRO2 and CBF in the ROIs. For OEF, both QQ and QSM show significantly higher OEF in HV compared to RS across all ROIs. Compared to QSM, QQ shows similar OEF values in CGM and Thalamus, but higher values in WM and lower values in Caudate, Putamen, and Pallium. For CMRO2, no significant difference was found between RS and HV for both QSM and QQ in all ROIs, except CGM, where QQ shows lower CMRO2 at HV. Compared to QSM, QQ shows similar CMRO2 values in CGM and Thalamus, but higher values in WM and lower values in Caudate, Putamen, and Pallidum. CBF is lower in RS compared to HV in all the ROIs. Detailed ROI analysis results (i.e., mean ± standard deviation in each ROI) are provided in Supporting Information Tables S1, S2, and S3.
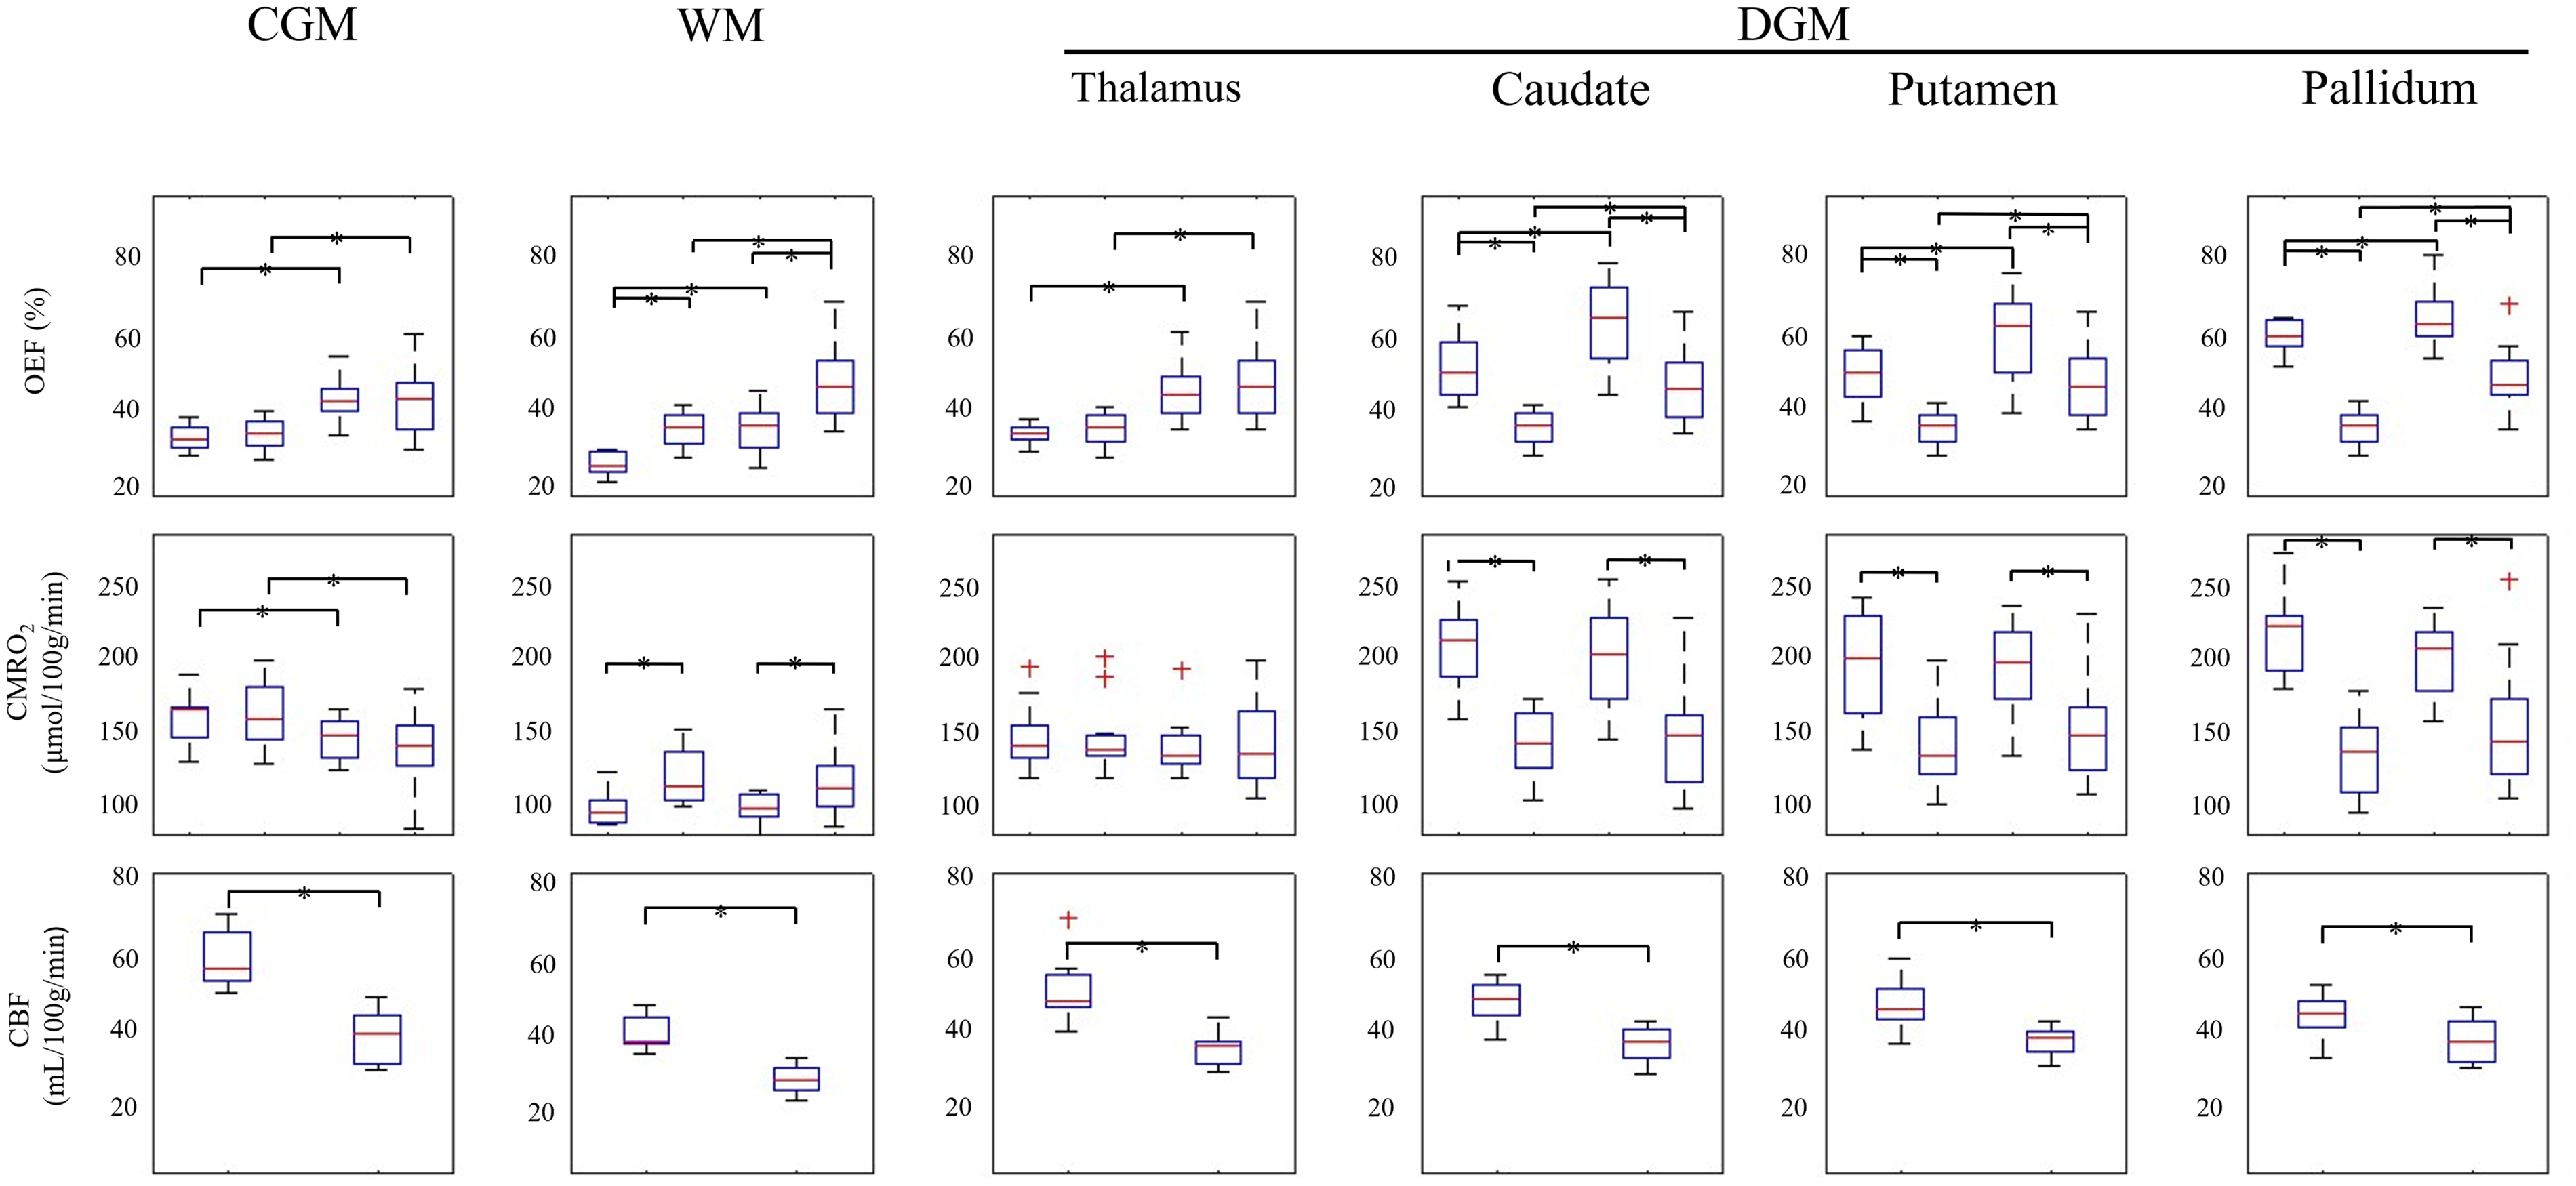
Box plots of OEF, CMRO2 and CBF in CGM were plotted for QQ and QSM. Red line, blue box, black whisker, and red cross indicates the median, interquartile range, and the range extending to 1.5 of the interquartile range, outlier beyond the whisker range. The significant differences (P < 0.05) between RS and HV approach are marked with an asterisk.
Figure 4 shows the Bland-Altman plots comparing the QSM and QQ approach for OEF and CMRO2 across all subjects. All four comparisons show good agreement in CGM and Thalamus. For example, in CGM, the mean difference for OEF was not significant between QSM and QQ, 7% (P = 0.51) at RS and 5% (P = 0.98) at HV, and the mean difference for CMRO2 were 29.29 mol/100 g/min (P = 0.86) at RS and 20.59 mol/100 g/min (P = 0.52) at HV. On the other hand, in Caudate, Putamen, and Pallidum, QQ and QSM showed significant biases. For example, in the Caudate, the mean difference for OEF was 15.9% (P < 0.001) at RS and 16.4% (P = 0.002) at HV. Similarly, in the Pallidum, the mean difference for OEF was 23.6% (P < 0.001) at RS and 15.4% (P = 0.003) at HV. The biases were also prominent for CMRO2, with the Caudate showing a mean difference of 64.2% (P < 0.001) at RS and 52.7% (P < 0.001) at HV.
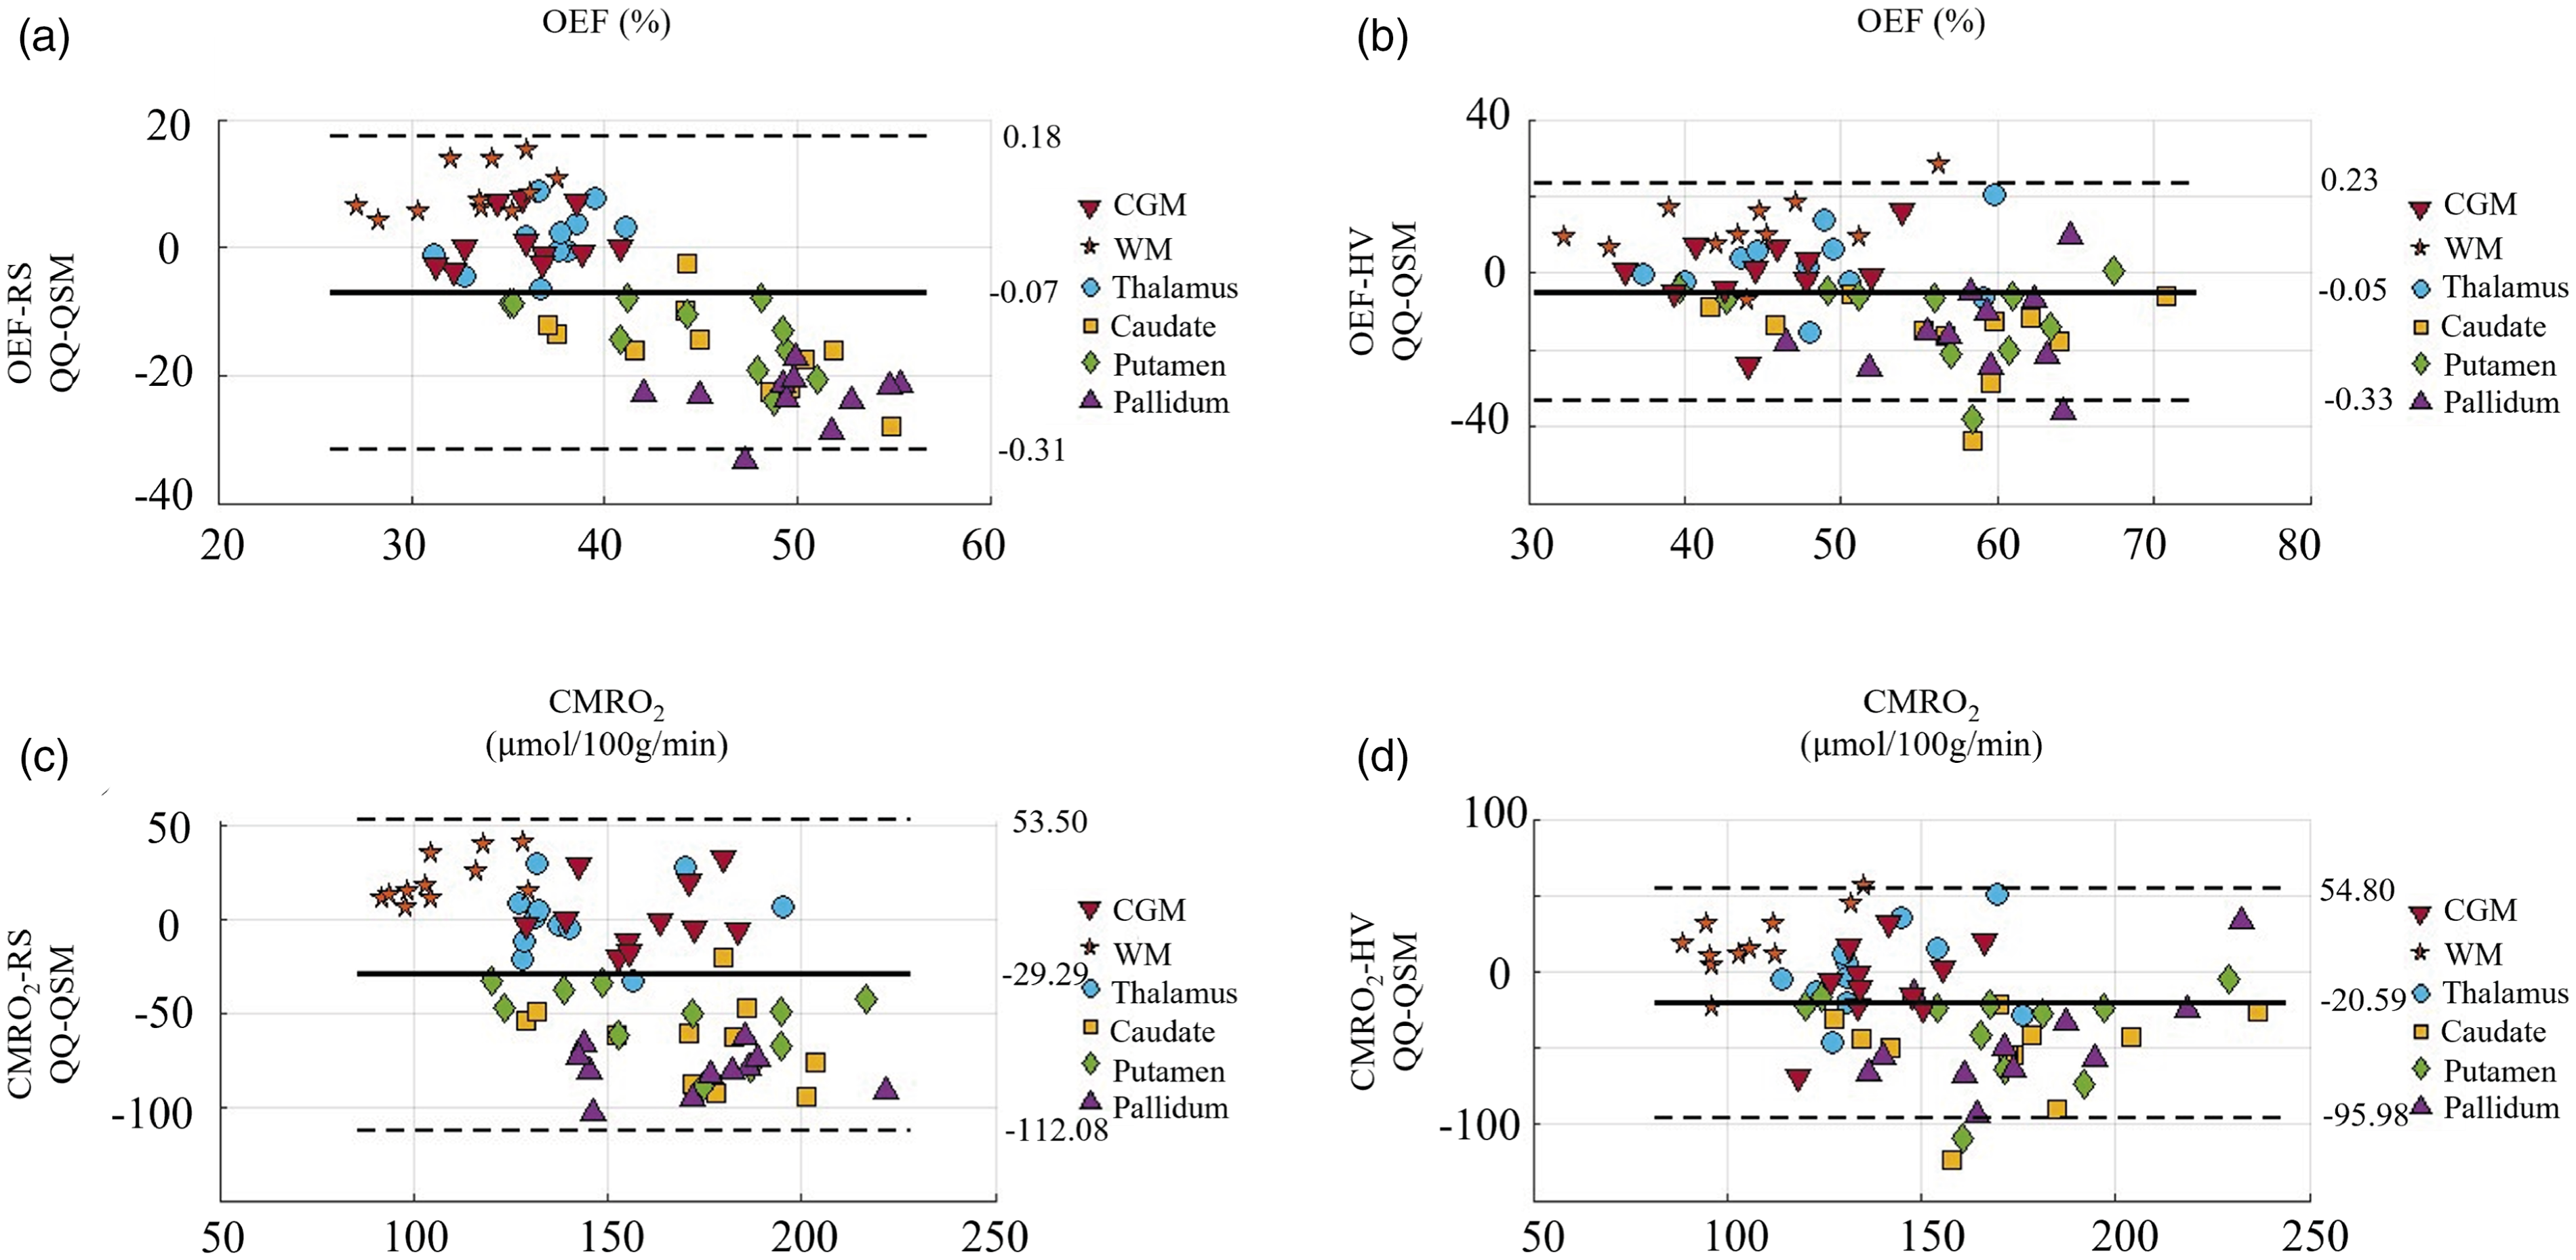
Bland-Altman plots comparing OEF and CMRO2 values in CGM between QQ and QSM. (a) QQ-OEF vs. QSM-OEF at RS, (b) QQ-OEF vs. QSM-OEF during, (c) HV QQ-CMRO2 vs. QSM-CMRO2 at RS, and (d) QQ-CMRO2 vs. QSM-CMRO2 during HV.
Discussion
This study investigated the sensitivity of QQ to physiologically increased OEF during hyperventilation, in comparison with the microvascular QSM-based OEF technique (QSM-OEF). As abnormally high OEF is expected in a variety of cerebrovascular disorders, including vascular dementia,44 –46 Parkinson’s disease, 47 and moyamoya disease,63 –65 this sensitivity study demonstrates the QQ’s feasibility for such disorders. Our results indicate that QQ provided similar OEF values in CGM compared to QSM-OEF at resting state (RS) and significantly higher OEF during hyperventilation (HV) compared to RS. QQ has higher potential in clinical settings than QSM-OEF in three aspects. First, QQ is based on more accurate biophysics modeling than QSM-OEF, as it eliminates the unreliable assumption in QSM-OEF that venous blood volume (v) is linearly proportional to CBF in every voxel. Our QQ provided significantly decreased v during HV compared to RS, e.g., 3.94 ± 0.27% vs. 3.71 ± 0.63% (P = 0.0029) in CGM (Supporting Information Figure S1), which demonstrates that QQ can measure vasoconstriction induced by hyperventilation. Second, QQ does not require a vascular challenge (i.e., it only needs a single brain state, e.g. RS), whereas QSM-OEF requires a vascular challenge, e.g. both RS and HV, to estimate OEF during RS. Such vascular challenge is not practical in clinical settings. Third, the reconstruction of QQ may be more robust due to its utilization of both phase and magnitude signals and its implementation of a machine learning algorithm, CCTV. The sensitivity of QQ to high OEF abnormalities, in addition to its previously observed sensitivity to low OEF abnormalities, 43 guarantees QQ’s wide feasibility in various clinical settings.
OEF during resting state in CGM estimated from the two methods were similar and statistically not significantly different (Table 1): 36.4
In addition, QQ showed relatively uniform OEF between CGM and WM (Figure 1), which agrees well with previous PET studies,60,68,69 whereas QSM-OEF showed OEF contrast between CGM and WM. This contrast may be caused by the inclusion of CBF in QSM-OEF. QQ computes OEF independently for RS and HV without utilizing CBF information. In contrast, QSM-OEF incorporates CBF information for OEF estimation. It treats v as a constant, not as a model parameter, by assuming that v is linearly related to CBF. However, CBF estimation in WM may not be accurate owing to low SNR in ASL measurements. 70 This leads to inaccurate v estimation in WM and subsequently inaccurate OEF estimation in WM using QSM-OEF approach. This inaccuracy in OEF estimation in WM may cause the observed OEF contrast between CGM and WM in QSM-OEF.
In comparison between RS and HV, the two methods showed similar OEFs in CGM, e.g., 36.4
In CGM, QQ and QSM showed a significant CMRO2 decrease during HV compared to RS. The CGM CMRO2 decrease during HV is consistent with previous studies. For instance, one study observed a substantial decrease in CMRO2 with the immediate initiation of hyperventilation when CBF decreases. 72 Similar studies have also shown reduction in CMRO2 with the onset of hypocarbia.73 –77 In this study, QQ showed a 14.3% CMRO2 reduction in CGM, which agrees with a CMRO2 reduction of 17.4% in hypercapnia in a similar study. 43 This is in line with recent studies suggesting that blood flow changes, such as hyper-hypoxia and hyper-hypocapnia, can alter global CMRO2 by 5 to 20%.78 –82 However, further detailed studies are warranted, as there has not been a clear consensus regarding decreases, increases, and no significant changes in CMRO2 responding to increased CO2 level in blood.71,83,84 Also, the CMRO2 response to hyperventilation may depend on participant characteristics (e.g., healthy subjects vs. patient with neurologic disorders) and the experimental setup (e.g., duration of hyperventilation). Additionally, we found that an average of 30.5% reduction in CBF in CGM, which is similar to previously reported values.21,22
The study has several limitations. First, the results from both QSM-OEF and QQ-OEF may be affected by the partial volume effect. QSM-OEF utilizes a low-resolution CBF both directly (by using CBF in the assumption regarding the CMRO2 ratio between RS and HV) and indirectly (by estimating v from CBF) to estimate a higher-resolution OEF. Hence, inaccuracies in CBF driven by partial voluming can lead to inaccurate OEF estimation in the QSM-OEF approach. In QQ-OEF, the OEF estimation in large veins may be problematic, as qBOLD in QQ assumes numerous randomly oriented cylindrical blood vessels within a voxel, which may not be valid in large veins. Second, the hematocrit (Hct) was not measured and assumed to be consistent (Hct = 0.357) in this study. In QSM-OEF, the maximum CMRO2 estimation error caused by intersubject variability of Hct was 2.4%. 19 Further studies are warranted to investigate potential error in OEF estimation due to Hct variability. Third, an improved ASL protocol which follows a recent white paper 85 could potentially improve SNR in CBF and subsequently enhance v and OEF estimation in the QSM-OEF approach. Fourth, the qBOLD term in QQ assumes two source components within a voxel: iron in venous structure (deoxyhemoglobin) and a diffusively distributed source (medium), such as non-blood tissue protein or ferritin. However, the presence of other structured strong sources like myelin in white matter and structured ferritin in deep gray matter could lead to intravoxel field variation, causing greater MRI signal decay than deoxyhemoglobin effects alone. This may result in an overestimation of QQ-OEF in WM, 30 though this issue was observed to be not significant in our previous study. 30
In conclusion, our study demonstrated QQ’s sensitivity to physiologically increased OEF levels in healthy subjects, in comparison to QSM-OEF. The non-invasive, readily applicable, challenge-free QQ-OEF mapping is now well-positioned for further evaluation in patients exhibiting increased OEF due to pathophysiological abnormalities.
Supplemental Material
sj-pdf-1-jcb-10.1177_0271678X241298584 - Supplemental material for Sensitivity assessment of QSM+qBOLD (or QQ) in detecting elevated oxygen extraction fraction (OEF) in physiological change
Supplemental material, sj-pdf-1-jcb-10.1177_0271678X241298584 for Sensitivity assessment of QSM+qBOLD (or QQ) in detecting elevated oxygen extraction fraction (OEF) in physiological change by Praveena Elanghovan, Thanh Nguyen, Pascal Spincemaille, Ajay Gupta, Yi Wang and Junghun Cho in Journal of Cerebral Blood Flow & Metabolism
Footnotes
Funding
The author(s) disclosed receipt of the following financial support for the research, authorship, and/or publication of this article: This work was supported by the NIH R00NS123229, R01NS136369.
Declaration of conflicting interests
The author(s) declared no potential conflicts of interest with respect to the research, authorship, and/or publication of this article.
Authors’ contributions
All authors (PE, TN, PS, AG, YW, and JC) made substantial contribution to the concept and design, data acquisition, or data analysis and interpretation. All authors assisted in drafting or revising the article. Final approval of the submitted manuscript was provided by all authors.
Supplementary material
Supplemental material for this article is available online.
References
Supplementary Material
Please find the following supplemental material available below.
For Open Access articles published under a Creative Commons License, all supplemental material carries the same license as the article it is associated with.
For non-Open Access articles published, all supplemental material carries a non-exclusive license, and permission requests for re-use of supplemental material or any part of supplemental material shall be sent directly to the copyright owner as specified in the copyright notice associated with the article.