
Abstract
We aimed to validate oxygen extraction fraction (OEF) estimations by quantitative susceptibility mapping plus quantitative blood oxygen-level dependence (QSM+qBOLD, or QQ) using 15O-PET. In ten healthy adult brains, PET and MRI were acquired simultaneously on a PET/MR scanner. PET was acquired using C[15O], O[15O], and H2[15O]. Image-derived arterial input functions and standard models of oxygen metabolism provided quantification of PET. MRI included T1-weighted imaging, time-of-flight angiography, and multi-echo gradient-echo imaging that was processed for QQ. Region of interest (ROI) analyses compared PET OEF and QQ OEF. In ROI analyses, the averaged OEF differences between PET and QQ were generally small and statistically insignificant. For whole brains, the average and standard deviation of OEF was 32.8 ± 6.7% for PET; OEF was 34.2 ± 2.6% for QQ. Bland-Altman plots quantified agreement between PET OEF and QQ OEF. The interval between the 95% limits of agreement was 16.9 ± 4.0% for whole brains. Our validation study suggests that respiratory challenge-free QQ-OEF mapping may be useful for non-invasive clinical assessment of regional OEF impairment.
Keywords
Introduction
Regional oxygen extraction fraction (OEF) is an essential biomarker for investigating tissue vulnerability and function in various diseases such as stroke,1–4 cerebral tumors, 5 and Alzheimer’s Disease. 6 Positron emission tomography (PET) with 15O tracers is the reference standard for quantitative mapping of OEF.7–9 Using tracer kinetic modeling of 15O tracers, PET has been used to map OEF in healthy subjects,8,10 various diseases including stroke2,11–15 and Huntington’s disease. 16 An image-derived arterial input function method was further introduced for 15O PET imaging using PET/MR.17,18 However, PET with 15O has not been widely used in clinical settings because 15O tracers with 122-second half-lives must be produced by a cyclotron within the PET facility. 8 This has substantially limited 15O PET availability.
In contrast, with widely available MR scanners, tissue cerebral oxygen consumption can be estimated by modeling conversion of diamagnetic oxyheme into paramagnetic deoxyheme in the vasculature. OEF can be estimated from MRI signal magnitudes by methods such as T2-Relaxation-Under-Spin-Tagging (TRUST),19–21 quantitative BOLD (qBOLD),22–26 quantitative imaging of extraction of oxygen and tissue consumption (QUIXOTIC), 27 and calibrated BOLD.28–31 OEF can also be estimated from MRI signal phase by methods such as whole-brain susceptometry-based oximetry,32,33 and quantitative susceptibility mapping (QSM) 34 methods using macrovascular15,35,36 or microvascular models.37–39
A promising, recently reported OEF mapping method uses a comprehensive MR signal model incorporating both signal phase and magnitude (QSM+qBOLD, or QQ). 40 QQ estimates OEF maps from multi-echo gradient (mGRE) data alone. It does so without burdensome gas inhalation or respiratory-control procedures. The robustness of QQ OEF has been significantly improved by introduction of an unsupervised machine learning method, cluster analysis of time evolution, which may enable clinically practical use of the QQ OEF mapping method. 41 Accordingly, the purpose of this study is to validate QQ OEF measurements as compared to reference standard 15O PET OEF measurements in healthy adults.
Materials and methods
Data acquisition
Ten healthy subjects (8 females, age 43 ± 20 years) underwent MRI and PET. The study was approved by Washington University Human Research Protection Office and Institutional Review Board, and written informed consent was obtained from all individuals in accordance with the ethical standards of the Helsinki Declaration of 1975 and its later amendments.
All subjects were imaged on a PET/MR system (Siemens Biograph 3 T mMR, Erlangen, Germany). Anatomical MRI images were first acquired. PET data was acquired with sequential administrations of C[15O], O[15O], H2[15O], C[15O], O[15O], and H2[15O]. There was greater than six half-lives between consecutive administrations of 15O tracers. Prescribed doses were 15-37 mCi for C[15O] admixed in room air, 15-37 mCi of O[15O] in room air and 25 mCi of H2[15O] injected intravenously as a bolus. During PET, MRI was acquired simultaneously. MRI included structural Magnetization Prepared Rapid Gradient Echo (MPRAGE) and time-of-flight MR angiography (TOF-MRA) that were used for anatomic registration and for calculating an image-derived arterial input function (IDAIF), and duplicate sets of mGRE sequences for QQ that were aimed to temporally coincide with O[15O] scans. (Due to technical issue, in MRI, only a single mGRE was acquired on subject 9 and, in PET, one C[15O] scan was missed on subject 1 and 6, and one H2[15O] scan was missed on subject 7.)
Acquisitions of PET list mode data began at least 60 seconds prior to administration of each tracer and the PET scan duration included 720 seconds of listmode packets. Attenuation mu-maps were synthesized from MPRAGE using the method of Burgos, et al. 42 Dynamic imaging frames were reconstructed with four iterations of ordered sets of expectation maximization and isotropic Gaussian filtering at 4.3 mm full-width half-maximum (FWHM) using the NiftyPET software platform. 43
MRI imaging parameters were as follows. T1-MPRAGE was acquired for T1-weighted anatomical image (T1w): TR = 2400ms, TE = 2.97 ms, TI =1000ms, flip angle = 8°, and voxel size = 0.95 × 0.95 ×1 mm3. TOF-MRA was acquired for IDAIF: TR = 22ms, TE = 3.94 ms, flip angle = 18°, and voxel size = 0.57 × 0.57 × 0.70 mm3. mGRE was acquired for QQ-OEF: TR= 33 ms, TE1/ΔTE/TE10 = 4.7/2.5/28.4 ms, flip angle 15°, bandwidth = 465 Hz/pixel, voxel size =0.94 × 0.94 × 3 mm3.
Data processing
The two inputs for QQ are voxel-wise susceptibility and mGRE magnitude signal. First, the susceptibility was estimated as follows. The total field was obtained with a linear fit of the mGRE phase. 46 The local field was subsequently estimated by the projection onto dipole field (PDF) method. 47 Susceptibility was then computed by the Morphology Enabled Dipole Inversion with automatic uniform cerebrospinal fluid zero reference (MEDI + 0) algorithm.48–51 Based on the obtained susceptibility and mGRE magnitude, OEF was estimated using QQ.40,41
Since the inversion of QQ is involved with nonconvex optimization due to the coupling of v and Y, it is very sensitive to the measurement noise. For robust OEF reconstruction against noise, cluster analysis of time evolution (CAT) was used. 41 The basic idea of CAT is that the voxels with similar mGRE signal decay can be grouped into a cluster and be assumed to have similar model parameter values including OEF. Consequently, signal-to-noise ratio is expected to be increased significantly by averaging over numerous voxels in a cluster. The QQ-OEF was registered to the T1w images using the FSL FLIRT algorithm.52,53
Using the tracer kinetic modeling with these TACs, CBF and CBV were estimated from the 15O-water scans9,60 and 15O-carbon monoxide scans, 61 respectively. OEF was finally estimated from the 15O-oxygen scans in conjunction with calculated CBF and CBV images. 58 For robust PET-OEF estimation, nonlinear curve fitting was only performed for the estimation of IDAIFs for the 15O-water scans. 18 For 15O-Carbon monoxide and 15O-oxygen estimation, the IDAIF was estimated based on the measured arterial and background ROI TAC, 17 where no curve fitting was involved. For CBV estimation, although the 15O-Carbon monoxide was acquired as multi-frame dynamic emission scans, the steady-state portion of the scan (after 2 minutes post initiation of inhalation) was numerically integrated to generate a single frame static scan, and the voxel-wise signal was estimated as the ratio of voxel intensity to the arterial signal intensity. To avoid performing model fitting with extremely noisy TACs in the estimation of voxel-wise CBF maps and subsequent OEF maps, the linearized version of the original CBF and OEF model was used. 17
ROI analysis
QQ-OEF was smoothed with 3 D Gaussian filtering to match that applied to PET-OEF (FWHM = 8 mm). To compare QQ and PET, QQ- and PET-OEF maps were averaged over the two scans (scan-rescan). Comparisons of OEF measures between QQ-OEF and PET-OEF were performed in the whole brain and regional ROIs: cortical gray matter (CGM), frontal, temporal, parietal, and occipital lobe of CGM, white matter (WM), and deep gray matter (DGM) regions (Thalamus, Caudate, Putamen, and Pallidum). The OEF values were presented as mean ± standard deviation. Paired t-tests estimated significant differences between QQ-OEF and PET-OEF. A P value less than 0.01 was considered significant. The Lilliefors test confirmed the normality of each ROI data distribution (all p-values > 0.025). Bland-Altman (BA) plots were constructed based on the OEF average in regional ROIs. For a non-uniform difference in BA plots, a regression approach was used to obtain the 95% limits of agreement with considering a linear trend as in Figures 2(a), (c) and 4(a), (c). 62 Each ROI mask was identified by FreeSurfer 57 analysis of the T1w MPRAGE sequence and overlapped with a QQ reconstruction whole brain mask registered to the T1w MPRAGE beforehand (Supporting Information Figure S1). The voxels with extremely high OEF value (>90%) observed on PET-OEF were excluded from ROI analysis. Those were not physiologic and likely to be caused by artefacts, such as misalignments between component scans that lead to errors near vasculature, and bone/CSF or attenuation/scatter correction errors that lead to hot spots.
Results
Figure 1 shows, for an exemplar subject, representative OEF maps generated by PET and QQ. Excluding boundary voxels where division by small estimators of tracer dynamics create unstable PET point-estimates, both PET and QQ provide OEF estimates of 30.8 ± 4.0% for PET and 32.9 ± 4.4% for QQ. OEF maps in all the 10 subjects are shown in Supporting Information Figures S2, S3, and S4.
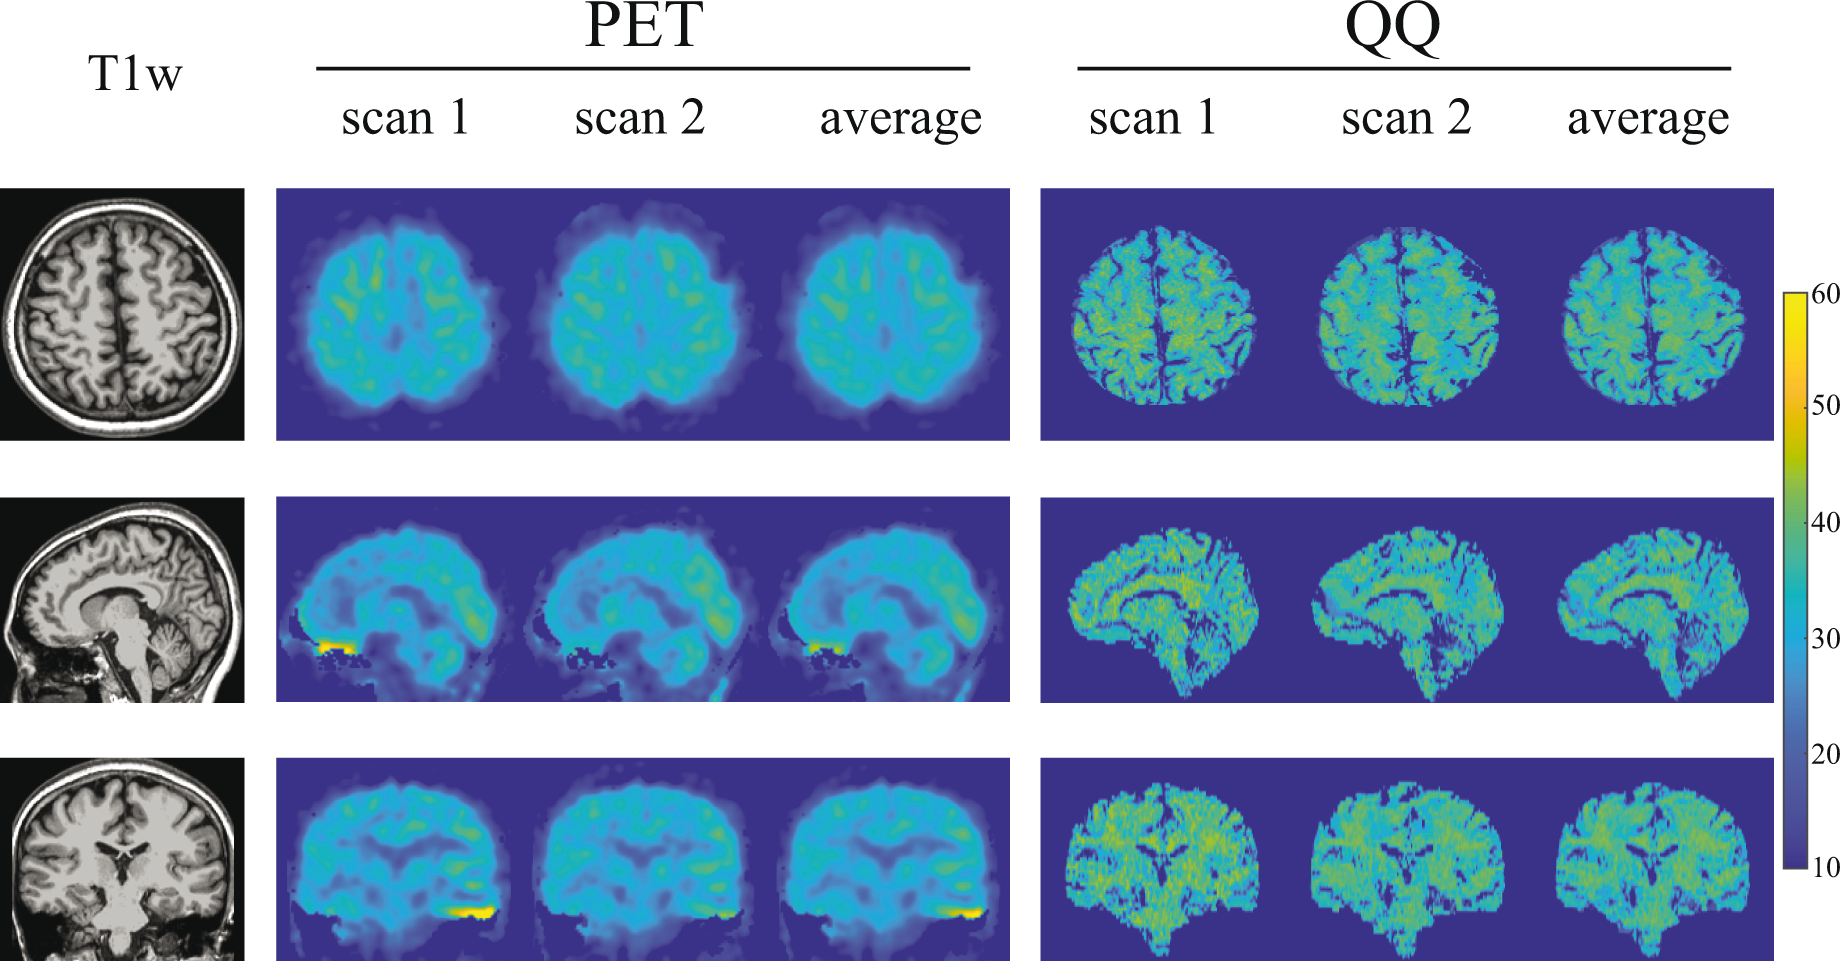
OEF maps from PET and QQ in axial, sagittal, and coronal views in a subject. Both PET and QQ show uniform OEF maps and good agreement between scans and methods.
Figure 2 shows Bland-Altman residual plots of whole-brain OEF. PET had scan-rescan variations (Figure 2(a)). Averaging over all subjects, the OEF difference between scans was 3.9% (p = 0.009), marked by a dotted line. In QQ, averaging over all subjects, the OEF difference between scans was 0.4% (p = 0.7), similarly marked by a dotted line (Figure 2(b)). QQ showed similar average whole brain OEF values when compared to PET (Figure 2(c) and Table 1): 32.8 ± 6.7% on PET and 34.2 ± 2.6% on QQ (p = 0.5). When analyzing the scan-rescan results separately, the interval of the 95% limits of agreement between PET and QQ was similar to that between scan-rescan for each method: 16.9 ± 4.0% for PET and QQ average, 12.0 ± 2.8% for PET scan 1 and 2, and 12.4 ± 3.1% for QQ scan 1 and 2. Figure 2(a) and (c) shows a linear trend (p-values < 0.0001).
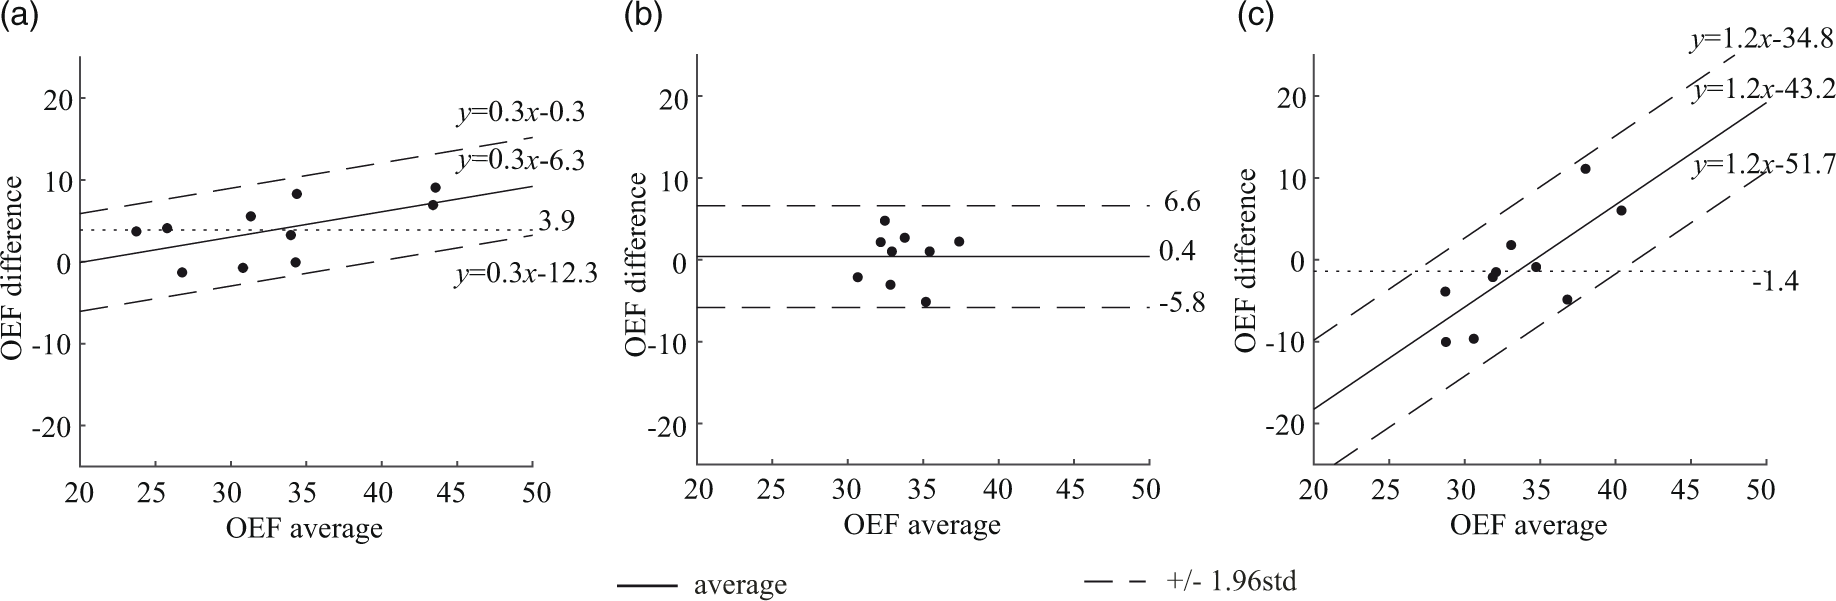
Bland-Altman plots comparing OEF values in whole brain between PET and QQ scans. (a) PET scan 1 vs. PET scan 2. (b) QQ scan 1 vs. QQ scan 2. (C) PET average vs. QQ average. PET and QQ show small scan to rescan variations (average OEF difference: 3.9%, p < 0.009 for PET and 0.4%, p = 0.7 for QQ). The average difference between PET and QQ is not significant (−1.4%, p = 0.5). The OEF agreement interval (distance between the two dashed line) between PET and QQ average is similar to the one between scan-rescan within each method. The unit in the x- and y-axis is %.
Average and standard deviation of whole brain OEF.
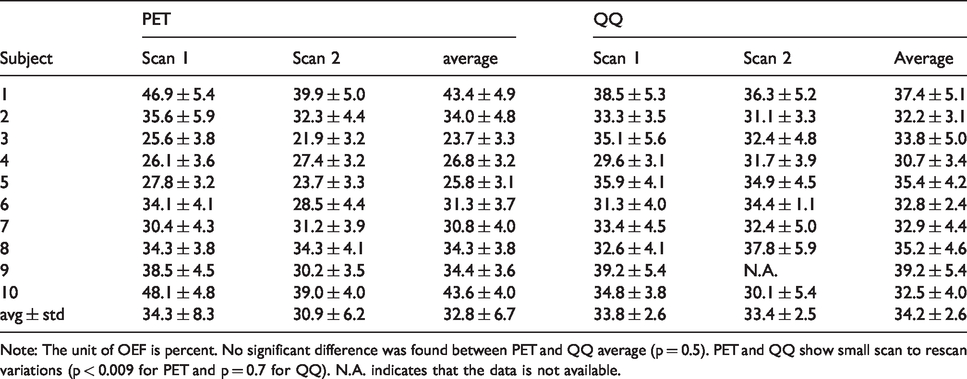
Note: The unit of OEF is percent. No significant difference was found between PET and QQ average (p = 0.5). PET and QQ show small scan to rescan variations (p < 0.009 for PET and p = 0.7 for QQ). N.A. indicates that the data is not available.
Figure 3 compares PET and QQ estimates of OEF regionally averaged by cortical gray matter (CGM), white matter (WM), and deep gray matter (DGM). PET and QQ provided similar regional OEF values: The averaged OEF values, respectively for PET and QQ, were 34.4 ± 7.0% and 32.5 ± 2.4% in CGM, 34.5 ± 7.0% and 31.9 ± 2.2% in CGM-Frontal, 33.8 ± 7.1% and 31.4 ± 2.7% in CGM-Temporal, 35.1 ± 7.3% and 33.6 ± 2.6% in CGM-Parietal, 35.4 ± 7.2% and 34.7 ± 2.9% in CGM-Occipital, 32.2 ± 6.8 and 35.7 ± 3.0% in WM, 32.0 ± 5.9 and 35.1 ± 2.7% in Thalamus, 32.2 ± 6.4 and 32.1 ± 2.9% in Caudate, 36.8 ± 7.0 and 37.1 ± 2.5% in Putamen, and 35.2 ± 7.0 and 38.1 ± 2.5% in Pallidum. The difference between PET and QQ average was not significant in any of these ROIs (all p-values > 0.12). In CGMs, both PET and QQ showed significantly higher OEF values in CGM-Occipital than CGM average (p = 0.004 for PET and p < 0.0001 for QQ).
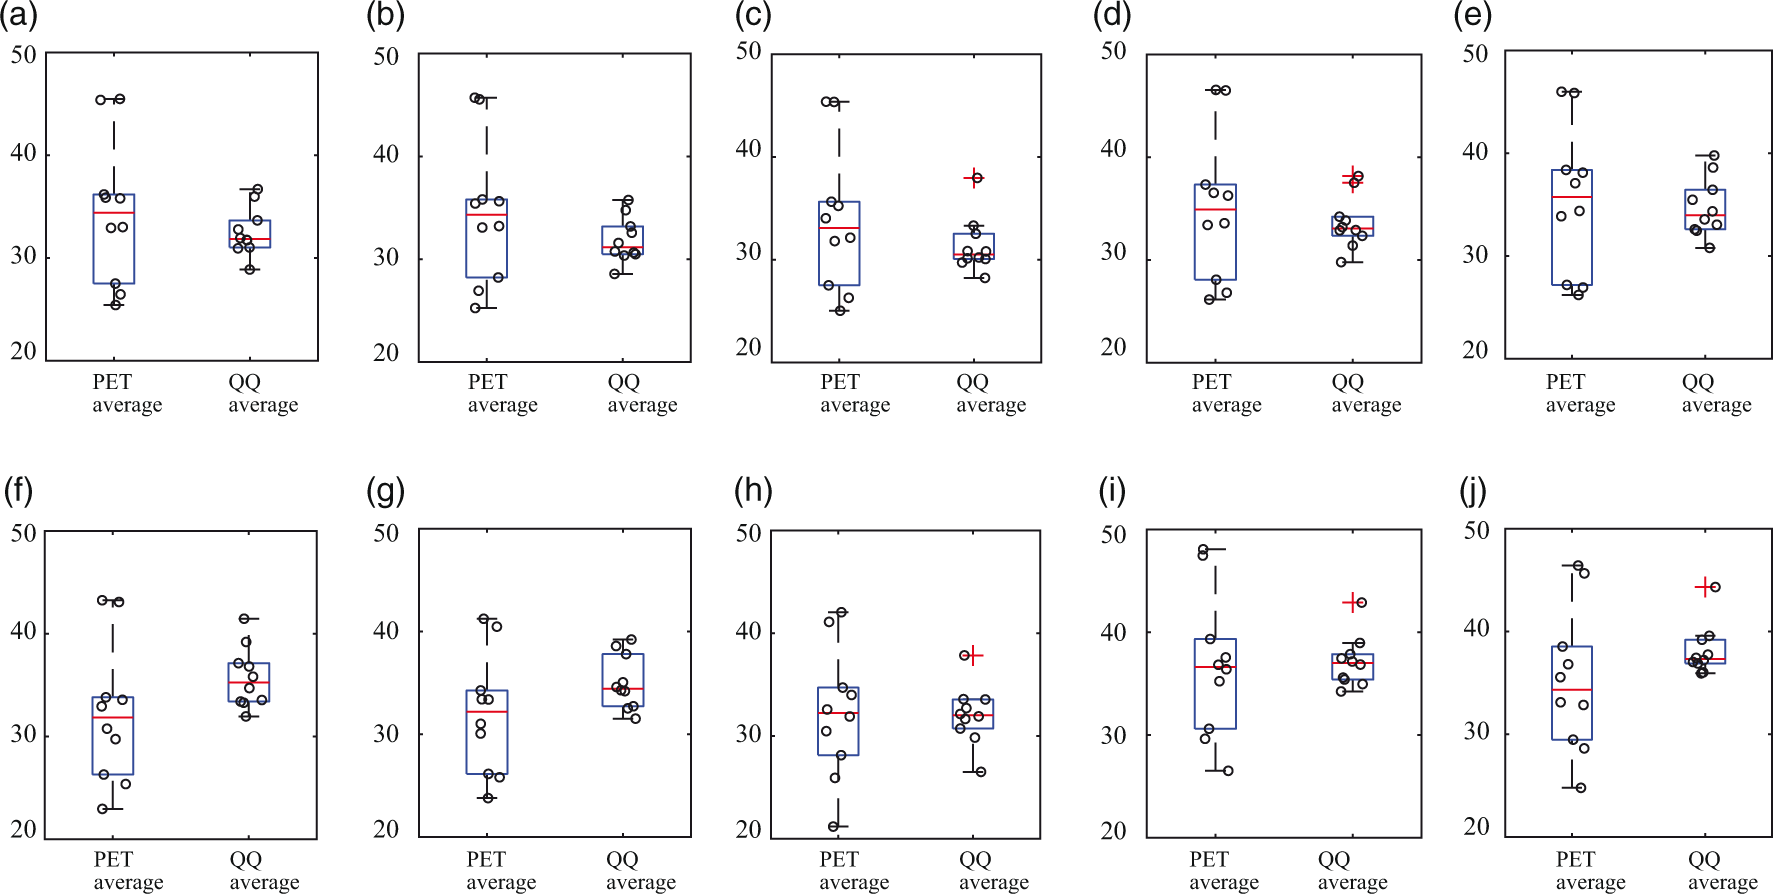
OEF comparison in cortical gray matters (a–e), white matter (f), and deep gray matters (g–j) among PET and QQ average. No significant difference was found between PET and QQ (p > 0.12, paired t-test). The unit in y-axis is %. Red line, blue box, black whisker, and red cross, black circle indicates median value, interquartile range, the range extending to 1.5 of the interquartile range, outlier beyond the whisker range, and individual subject value.
Figure 4 shows the Bland-Altman plots of the regionally averaged OEF values in CGM, WM, and DGM. PET and QQ had a small scan-rescan variation: average OEF difference = 4.0% (p = 0.009) for PET (Figure 4(a)) and 0.5% (p = 0.6) for QQ (Figure 4(b)). The mean regional OEF difference was not significant between PET and QQ averages, −7 × 10⁻⁴% (p = 0.97) (dotted line in Figure 4(c)). The interval of the 95% limits of agreement between the two methods across tissue types was comparable to the one between scan-rescan within each method: 20.9 ± 1.5% for PET and QQ average, 12.7 ± 0.9% for PET scan 1 and 2, and 12.3 ± 0.9% for QQ scan 1 and 2. Figure 4(a) and (c) shows a linear trend (p-values < 0.0001).
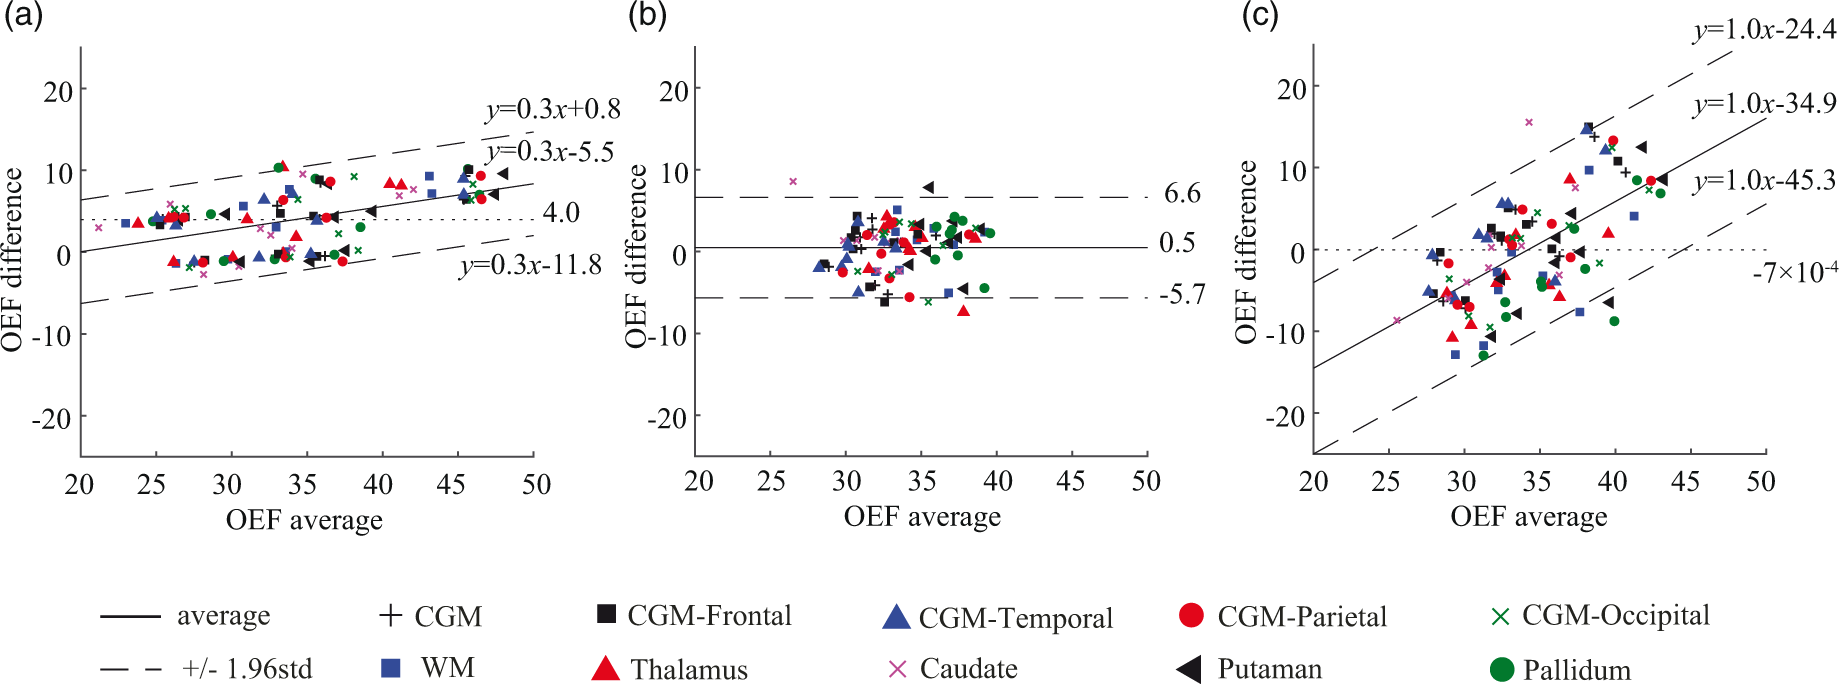
Bland-Altman plots comparing OEF values in regional ROIs between PET and QQ scans. (a) PET scan 1 vs. PET scan 2. (b) QQ scan 1 vs. QQ scan 2. (c) PET average vs. QQ average. A small and statistically not significant bias in mean regional OEF difference between PET and QQ averages was found (dotted line in (c)). The OEF agreement interval (mean ± 1.96std) between two methods was comparable to the one between scan-rescan within each method. The unit in the x- and y-axis is %.
Discussion
Our data indicate that gradient echo MRI-based QSM+qBOLD (QQ)-OEF mapping is valid against reference 15 O PET-OEF mapping in healthy adults; the QQ method provides similar OEF values both globally and regionally when compared to 15O PET. Further validation of challenge-free QQ-OEF mapping in clinical settings is now warranted, as a non-invasive and more accessible assessment of regional OEF impairment than the reference standard 15O PET-OEF technique.
QQ-OEF mapping may be particularly valuable for more widespread and repeated evaluation of cerebral oxygen deficiency causing brain tissue vulnerability or injury in various brain disorders, such as ischemic stroke, 63 Alzheimer’s disease (AD),64,65 and multiple sclerosis. 66 For instance, in stroke therapy, it is critical to identify salvageable ischemic tissue to determine treatment such as mechanical thrombectomy. Inadequacies of methods in current clinical use, e.g. problematic ischemic core definition by CBF reduction 67 and variability in diffusion perfusion mismatch,68–70 can be overcome by an accurate regional OEF mapping method. Another example is measurement of altered brain aerobic glycolysis in AD. 71 This measurement partly depends on quantitative measurement of oxygen metabolism, which is particularly difficult to perform with PET in the very large cohorts of individuals comprising current AD studies.
In this study, both PET and QQ showed fairly uniform OEF maps over the brain (Figure 1), which is in line with previous PET and MRI studies.8,10,23,27,72 Global and CGM OEF values estimated with the two methods were not significantly different and agree with prior OEF values obtained from PET, e.g. 35 ± 7% to 40 ± 9%,10,16,72,73 from calibrated BOLD, e.g. 35 ± 4% to 44 ± 14%,30,74–80 and from QSM, e.g. 29 ± 3% to 50 ± 5%.15,36–41,74 Also, the slightly higher OEF in the occipital lobe than CGM average agrees with prior PET literature. 72
Compared to PET-OEF, QQ-OEF showed smaller inter-subject variation–average coefficient of variation (COV) in whole brain = 7.6% for QQ vs 20.5% for PET–though their group averages were close (Table 1). This PET inter-subject COV is consistent with similar inter-subject variability for OEF, CBF, and CMRO2 reported in previous PET studies.10,16,17 Though a physiologic reason for this variability is possible, the variability might also arise from various complexities in PET data acquisition and processing. For instance, as PET-OEF estimation depends on CBF and CBV calculated from two independent PET scans with different tracers, CBF and CBV variability may contribute to the OEF variability.8,11 PET-OEF estimation relies on subject inhalation of O[15O] and C[15O] gases, which might introduce another source of inter-subject variability. Also, the process of arterial input function (AIF) estimation needed for quantitative PET analysis is complex, the IDAIF used in this study is sensitive to PET-MRI registration uncertainty, and the resultant variability in AIF estimation may contribute to additional variability in OEF estimation. 17 In addition, MR-based attenuation and scatter correction 81 used in this study can lead to spatially varying and individual-dependent PET signal variation, 82 further contributing to OEF estimation variability.
Regional ROI analysis showed no significant OEF difference between PET and QQ scans in CGM, WM, and DGM (Figure 3). Average OEF maps from PET and QQ were both similarly largely uniform (Figure 1) and had similar global OEF values between the two methods (Figure 2 and Table 1). The within-subject standard deviation of the whole-brain OEF, e.g. 4.9% in the PET average of Subject 1 in Table 1, might be caused by real physiological variation and/or various complexities in data acquisition and processing, e.g. the sensitivity of the IDAIF to PET-MRI registration uncertainty in PET-OEF processing. 17 Interestingly, both methods independently demonstrated a slightly but significantly higher OEF in the occipital lobes, confirming that this is likely a true physiologic finding.
To investigate if the usage of CAT affects the concordance of QQ- and PET-OEF, QQ-OEF without CAT was processed by following the original QQ paper 40 with v initialized to that used in the QQ-CAT paper 41 and showed significant difference from PET-OEF, e.g. 38.5 ± 2.1% vs. 32.8 ± 6.7% (p = 0.02, paired t-test) for the global OEF. This suggests that the usage of CAT seems critical for the QQ- and PET-OEF concordance, which may be related to that the measurement error propagation into the OEF was reduced significantly by using CAT in the QQ model. 41
The intra-subject variability existed from scan 1 to scan 2 in PET-OEF. Six out of 10 subjects (Subject 1, 3, 5, 6, 9, and 10) showed a larger than 10% global OEF decrease in Scan 2 compared to Scan 1, whereas 2 subjects (Subject 4 and 7) showed a slight increase, 2∼5% (Table 1). We believe that the deviation between two scans are potentially both artefact-related and physiologic.
Regarding the possibility of artefact, although PET-OEF was estimated twice for all 10 participants, three of them had only one 15O-water or 15O-Carbon monoxide scan, and a single CBF/CBV map was used to estimate the OEF for both 15O-Oxygen scans. Biological fluctuations in CBF/CBV could lead to the biases in OEF. Also, misalignment in the component scans could lead to inaccurate OEF estimations. In addition, the PET in our PET/MR scanner was inferior to traditional PET scanners for 15O PET imaging with suboptimal attenuation and scatter correction, lack of 2 D acquisition mode, difficulty in physically limiting motion artifact, difficulties in getting the inhalation tube to the participants mouth, and unpleasant environment relative to traditional PET scanners due to the smaller and deeper bore size.
Regarding the possibility of real physiologic change, the OEF difference between the two scans in PET correlates with that in QQ, e.g.
QQ-OEF showed a trend of being greater than PET-OEF (not statistically significant) in white matter and some deep gray nuclei such as Thalamus and Pallidum. It is possible that QQ-OEF is overestimated in those regions. The qBOLD in QQ model assumes two source compartments within a voxel: iron in venous structure (dexoyhemoglobin) and diffusively distributed source (medium), e.g. non-blood tissue protein or ferratin. If the other structured (non-diffusive) strong sources exist, such as myelin in white matter and structured ferratin in deep gray matter, they would induce additional intravoxel field variation, which may lead to greater MRI signal decay than the sole deoxyhemoglobin effects of venous blood. Consequently, QQ-OEF might be overestimated in white matter and some deep gray nuclei.
For the uncertainty analysis on QQ-OEF, we performed a numerical simulation to investigate how much measurement noise propagates into OEF estimation, similarly to the Numerical simulation 2 in the QQ-CAT paper.
41
First, mGRE magnitude signal and the susceptibility values were simulated based on the QQ model. The input was the QQ-CAT result of a subject in this study (ground truth). Gaussian noise was then added to the mGRE signal and the susceptibility values to obtain a realistic SNR of 50. The simulated data was processed by the QQ with CAT. This process was repeated for 10 times with additional random gaussian noise at the same noise level (SNR 50). For accuracy measurement, the mean absolute error (MAE) between the average OEF map over the 10 trials and the OEF ground truth was calculated:
We checked how well QQ- and PET-OEF estimates are supported by data (goodness of fit). For QQ-OEF estimation, the relative residual of QSM and qBOLD term in QQ model were calculated:
A limitation of this study is that it is not clear which level of sensitivity is required for this technique to be clinically useful. However, the preliminary chronic ischemic stroke patient cases in the QQ-CAT paper showed that QQ-CAT was sensitive enough to capture low OEF regions, which agreed well with DWI-defined ischemic lesions. 41 In addition, the healthy subjects in this study showed generally uniform OEF maps without any extreme values, which indicates that no significant false positive error is induced from the QQ-CAT.
To investigate the sensitivity of QQ to OEF abnormalities quantitatively, we performed the same simulation as used in the uncertainty analysis above, with one difference that the ground truth was a simulated acute ipsilateral ischemic stroke patient brain where the OEF map was generally uniform and had regionally higher OEF ischemic lesions. The ground truth ratio of the average OEF in the lesion to the contralateral side (
In conclusion, our study suggests that in healthy adults the QQ model generates whole brain and regional OEF estimates in agreement with the current gold standard OEF estimation by 15O PET. The noninvasive challenge-free gradient echo MRI based QQ OEF mapping is now poised for further evaluation in patients where OEF is likely to be regionally affected.
Supplemental Material
sj-pdf-1-jcb-10.1177_0271678X20973951 - Supplemental material for Cerebral oxygen extraction fraction (OEF): Comparison of challenge-free gradient echo QSM+qBOLD (QQ) with 15O PET in healthy adults
Supplemental material, sj-pdf-1-jcb-10.1177_0271678X20973951 for Cerebral oxygen extraction fraction (OEF): Comparison of challenge-free gradient echo QSM+qBOLD (QQ) with 15O PET in healthy adults by Junghun Cho, John Lee, Hongyu An, Manu S Goyal, Yi Su and Yi Wang in Journal of Cerebral Blood Flow & Metabolism
Footnotes
Funding
The author(s) disclosed receipt of the following financial support for the research, authorship, and/or publication of this article: This work is supported in part by NIH R21EB024366, R01AG057536, R01NS090464, R01NS095562, R01NS105144, S10OD021782, R01AG057536, 1R01NS082561, 1P30NS098577.
Declaration of conflicting interests
The author(s) declared the following potential conflicts of interest with respect to the research, authorship, and/or publication of this article: JC and YW are in the inventor list on OEF related patent application of Cornell University, and YW owns equity of Medimagemetric LLC. The authors declared no other potential conflicts of interest with respect to the research, authorship, and/or publication of this article.
Authors’ contributions
All authors (JC, JL, HA, MG, YS, and YW) made substantial contribution to the concept and design, data acquisition, or data analysis and interpretation. All authors assisted in drafting or revising the article. Final approval of the submitted manuscript was provided by all authors.
Supplementary material
Supplementary material for this article is available online.
References
Supplementary Material
Please find the following supplemental material available below.
For Open Access articles published under a Creative Commons License, all supplemental material carries the same license as the article it is associated with.
For non-Open Access articles published, all supplemental material carries a non-exclusive license, and permission requests for re-use of supplemental material or any part of supplemental material shall be sent directly to the copyright owner as specified in the copyright notice associated with the article.