
Abstract
A directional sensitivity of the cerebral pressure-flow relationship has been described using repeated squat-stands. Oscillatory lower body negative pressure (OLBNP) is a reproducible method to characterize dynamic cerebral autoregulation (dCA). It could represent a safer method to examine the directional sensitivity of the cerebral pressure-flow relationship within clinical populations and/or during pharmaceutical administration. Therefore, examining the cerebral pressure-flow directional sensitivity during an OLBNP-induced cyclic physiological stress is crucial. We calculated changes in middle cerebral artery mean blood velocity (MCAv) per alterations to mean arterial pressure (MAP) to compute ratios adjusted for time intervals (ΔMCAvT/ΔMAPT) with respect to the minimum-to-maximum MCAv and MAP, for each OLBNP transition (0 to −90 Torr), during 0.05 Hz and 0.10 Hz OLBNP. We then compared averaged ΔMCAvT/ΔMAPT during OLBNP-induced MAP increases (INC) (ΔMCAvT/
Keywords
Introduction
Dynamic cerebral autoregulation (dCA) represents the ability of the cerebrovasculature to react to rapid blood pressure changes to maintain adequate cerebral perfusion. Different responses of cerebral blood velocity (CBv) to transient changes in mean arterial pressure (MAP) have initially been reported using pharmacological interventions in healthy participants. 1 Specifically, the augmentation in cerebral blood velocity is attenuated when MAP acutely increases compared to the decline in cerebral blood velocity when MAP acutely decreases.2,3 The brain being encapsulated in a bony inflexible cavity, this hysteresis-like pattern could be a protective mechanism against blood pressure surges.4,5
The repeated squat-stand protocol is widely recognized as a reliable and reproducible method for inducing large blood pressure oscillations aimed at characterizing dCA in the frequency 6 –8 and time domains.2,3,9 –14 Using the autoregulation index (ARI), Panerai et al. demonstrated a better autoregulatory capacity during transient increases than decrease in MAP. 13 Recently, we completed a study providing further evidence of a directional relationship between middle cerebral artery mean blood velocity (MCAv) and MAP, indicating cerebral vessels are better adapted to buffer acute increases in MAP. 3 We reported cerebral pressure-flow relationship directional sensitivity at 0.10 Hz, but not 0.05 Hz repeated squat-stand. In addition, our findings convincingly demonstrated the repeated squat-stand model can provide a reliable estimate of the physiological response by averaging several transient responses, leading to comparable ΔMCAvT/ΔMAPT over a 5-min period. These results support the usefulness of analyzing large MAP oscillations induced by the repeated squat-stand model in the time domain to evaluate the directional behavior of dCA.
Cerebral sympathetic nervous activity15 –17 and intrinsic myogenic activity16,18 have been proposed as mechanisms explaining the presence of a directional sensitivity in the cerebral pressure-flow relationship. One strategy to examine the above-mentioned mechanisms is the utilization of sympathetic and calcium channel blockades. However, due to the fall of systemic vascular resistances, there is a risk of serious arterial hypotension and fainting when pharmacological agents are used in combination with a hemodynamic stress such as repeated squat-stands.19 –21 Accordingly, the utilization of the repeated squat-stand protocol in an upright position may not be a safe model to examine the potential mechanisms of directional sensitivity, when additional mechanistic modifiers are employed. The use of spontaneous oscillations of MAP and CBv could represent an interesting alternative to oscillations of larger amplitude to safely study the potential mechanisms of such a hysteresis-like pattern. Indeed, Panerai et al. 14 recently proposed a new method for the identification of directional sensitivity of the cerebral pressure-flow relationship based on autoregressive-moving average models. An important advantage of this analytical approach is that it can be applied to resting spontaneous MAP in addition to large transient MAP changes. However, spontaneous MAP oscillations may not engage dCA to the same extent as larger MAP oscillations. 8
Oscillatory lower body negative pressure (OLBNP) is also recognized as a reproducible method to characterize dCA with forced blood pressure oscillations.8,22 Similar to the repeated squat-stand protocol, OLBNP has been utilized to examine the relationship between MAP and CBv in the frequency domain. 8 With participants in supine position, OLBNP represents a safer method (i.e. no risk of falling secondary to presyncopal symptoms) to examine the mechanisms underlying the dynamic sensitivity of the cerebral pressure-flow relationship (e.g., sympathetic nervous activity and myogenic activity) using various blockades or in clinical populations.
However, whether the directional sensitivity of the cerebral pressure-flow relationship can be detected using induced systemic blood pressure oscillations via OLBNP with participants in supine position remains to be determined. Considering the influence of body posture on dCA,8,23 we cannot assume this passive manipulation of MAP, while participants are in supine position, will necessarily lead to comparable results than those obtained when using the repeated squat-stand model with participants being in the standing position.
Accordingly, we need to examine whether there is evidence of directional sensitivity of the cerebral pressure-flow relationship during this OLBNP-induced cyclic physiological stress. Therefore, the aim of this study was to compare the changes in MCAv per changes in MAP (ΔMCAvT/ΔMAPT) using the largest concurrent MAP oscillations induced by OLBNP at 0.05 Hz and 0.10 Hz. Our hypothesis was that the cerebrovasculature will be better adapted to compensate for transient increases than transient decreases in MAP when oscillations are induced at 0.10 Hz, but not at 0.05 Hz. 3
Materials and methods
Ethics and informed consent
Prior to participating in this study, all participants provided informed written consent. This prospective study was approved by the Comité d’éthique de la recherche de l’Institut universitaire de cardiologie et de pneumologie de Québec (CER: 22096 and 22213) according to the principles established by the Declaration of Helsinki (except for registration in a database). These data have not been reported previously.
Participants
Twenty participants (10 females, 10 males) aged 18 to 45 years were recruited from the Quebec community through advertising materials. This sample size was chosen according to a power calculation from previous results (α = 0.05, β = 0.80), 3 where we observed ΔMCAvT/ΔMAPT was lower for MAP increases than MAP decreases at 0.10 Hz repeated squat-stands (0.91 ± 0.3 vs. 1.01 ± 0.4 cm⋅s−1/mmHg). Participants were eligible if they fulfilled the following criteria: non-smoking, non-obese (body mass index <30 kg/m 2 ) with no history of cardiovascular or cerebrovascular disease, diabetes, systemic arterial hypertension or respiratory disease. Apart from contraceptive methods in women, participants were not eligible if they were taking any medication. Women were tested during menses or the early follicular phase (days 1 to 7) of their menstrual cycle.
Study design
The study included two visits. During the first visit, a period of familiarization with the OLBNP protocol and the associated noise from the chamber’s vacuums was completed. For the second visit, participants arrived at the laboratory between 8:00 AM and 9:00 AM after having consumed a standardized snack (granola bar and fruit juice) 90 to 120 min before their arrival time. Participants were measured, weighed, instrumented and moved into a supine position with their lower body sealed in a LBNP chamber above their iliac crests. An initial 5-min supine rest was used to quantify the participants’ resting breathing frequency. Following the establishment of the resting breathing frequency, a 10-min supine rest was completed and the last 5 min were recorded for baseline characteristics. Then, 6-min periods of OLBNP at a frequency of 0.05 Hz (cycles of 10 s at 0 Torr and 10 s at −90 Torr) and 0.10 Hz (cycles of 5 s at 0 Torr and 5 s at −90 Torr) were randomly applied on participants, both preceded by 5 min of recorded supine resting periods. Throughout the experiment, participants were asked, and continuously coached, to maintain their resting breathing frequency, with the help of a metronome, in order to maintain partial pressure of end-tidal carbon dioxide (PETCO2) at baseline levels. A 10 min of supine rest between OLBNP periods was added to ensure the return of variables of interest at baseline values. Arterial blood pressure, MCAv, heart rate, ventilatory variables and PETCO2 were continuously monitored during the initial 10-min period of supine rest, the two 6-min periods of OLBNP and the 10-min of supine rest between OLBNP periods.
The OLBNP protocol consisted of a computerized control of the inside pressure oscillating between 0 and −90 Torr at 0.05 Hz and 0.10 Hz (Technavance, Austin, Texas, USA) (Figure 1). These two frequencies were chosen since they are in the frequency bands where cerebral autoregulation is thought to have the most important influence on cerebral pressure-flow dynamics.6,7 Following pilot work where OLBNP between 0 and −50, −60, −70, −80 and −90 Torr pressures were tested, the 0 to −90 Torr pressure change was chosen for this study because it was the optimal threshold oscillatory pressure change to provide clear and comparable MAP and MCAv oscillations during the 6 min periods at 0.05 and 0.10 Hz. The computer ensured the duration of inside pressure changes were similar between both directions of MAP changes (from 0 to −90 Torr vs. −90 to 0 Torr) at both frequencies (0.05 and 0.10 Hz). The system is equipped with a computer-controlled throttle valve to generate reproducible pressure protocols. Since the chamber is leak-tight, vacuum transitions from 0 to −90 Torr can be achieved in as little as 4 s. To ensure a constant rate of pressure change is maintained during venting (−90 to 0 Torr), the system is equipped with an additional throttle valve to control the rate at which air returns to the chamber. Using this approach, the time for vacuum (0 to −90 Torr) and venting (−90 to 0 Torr) transitions are repeatable and can be evenly matched. Transition times are of 4.17 ± 0.20 s for vacuum and 4.05 ± 0.20 s for venting.
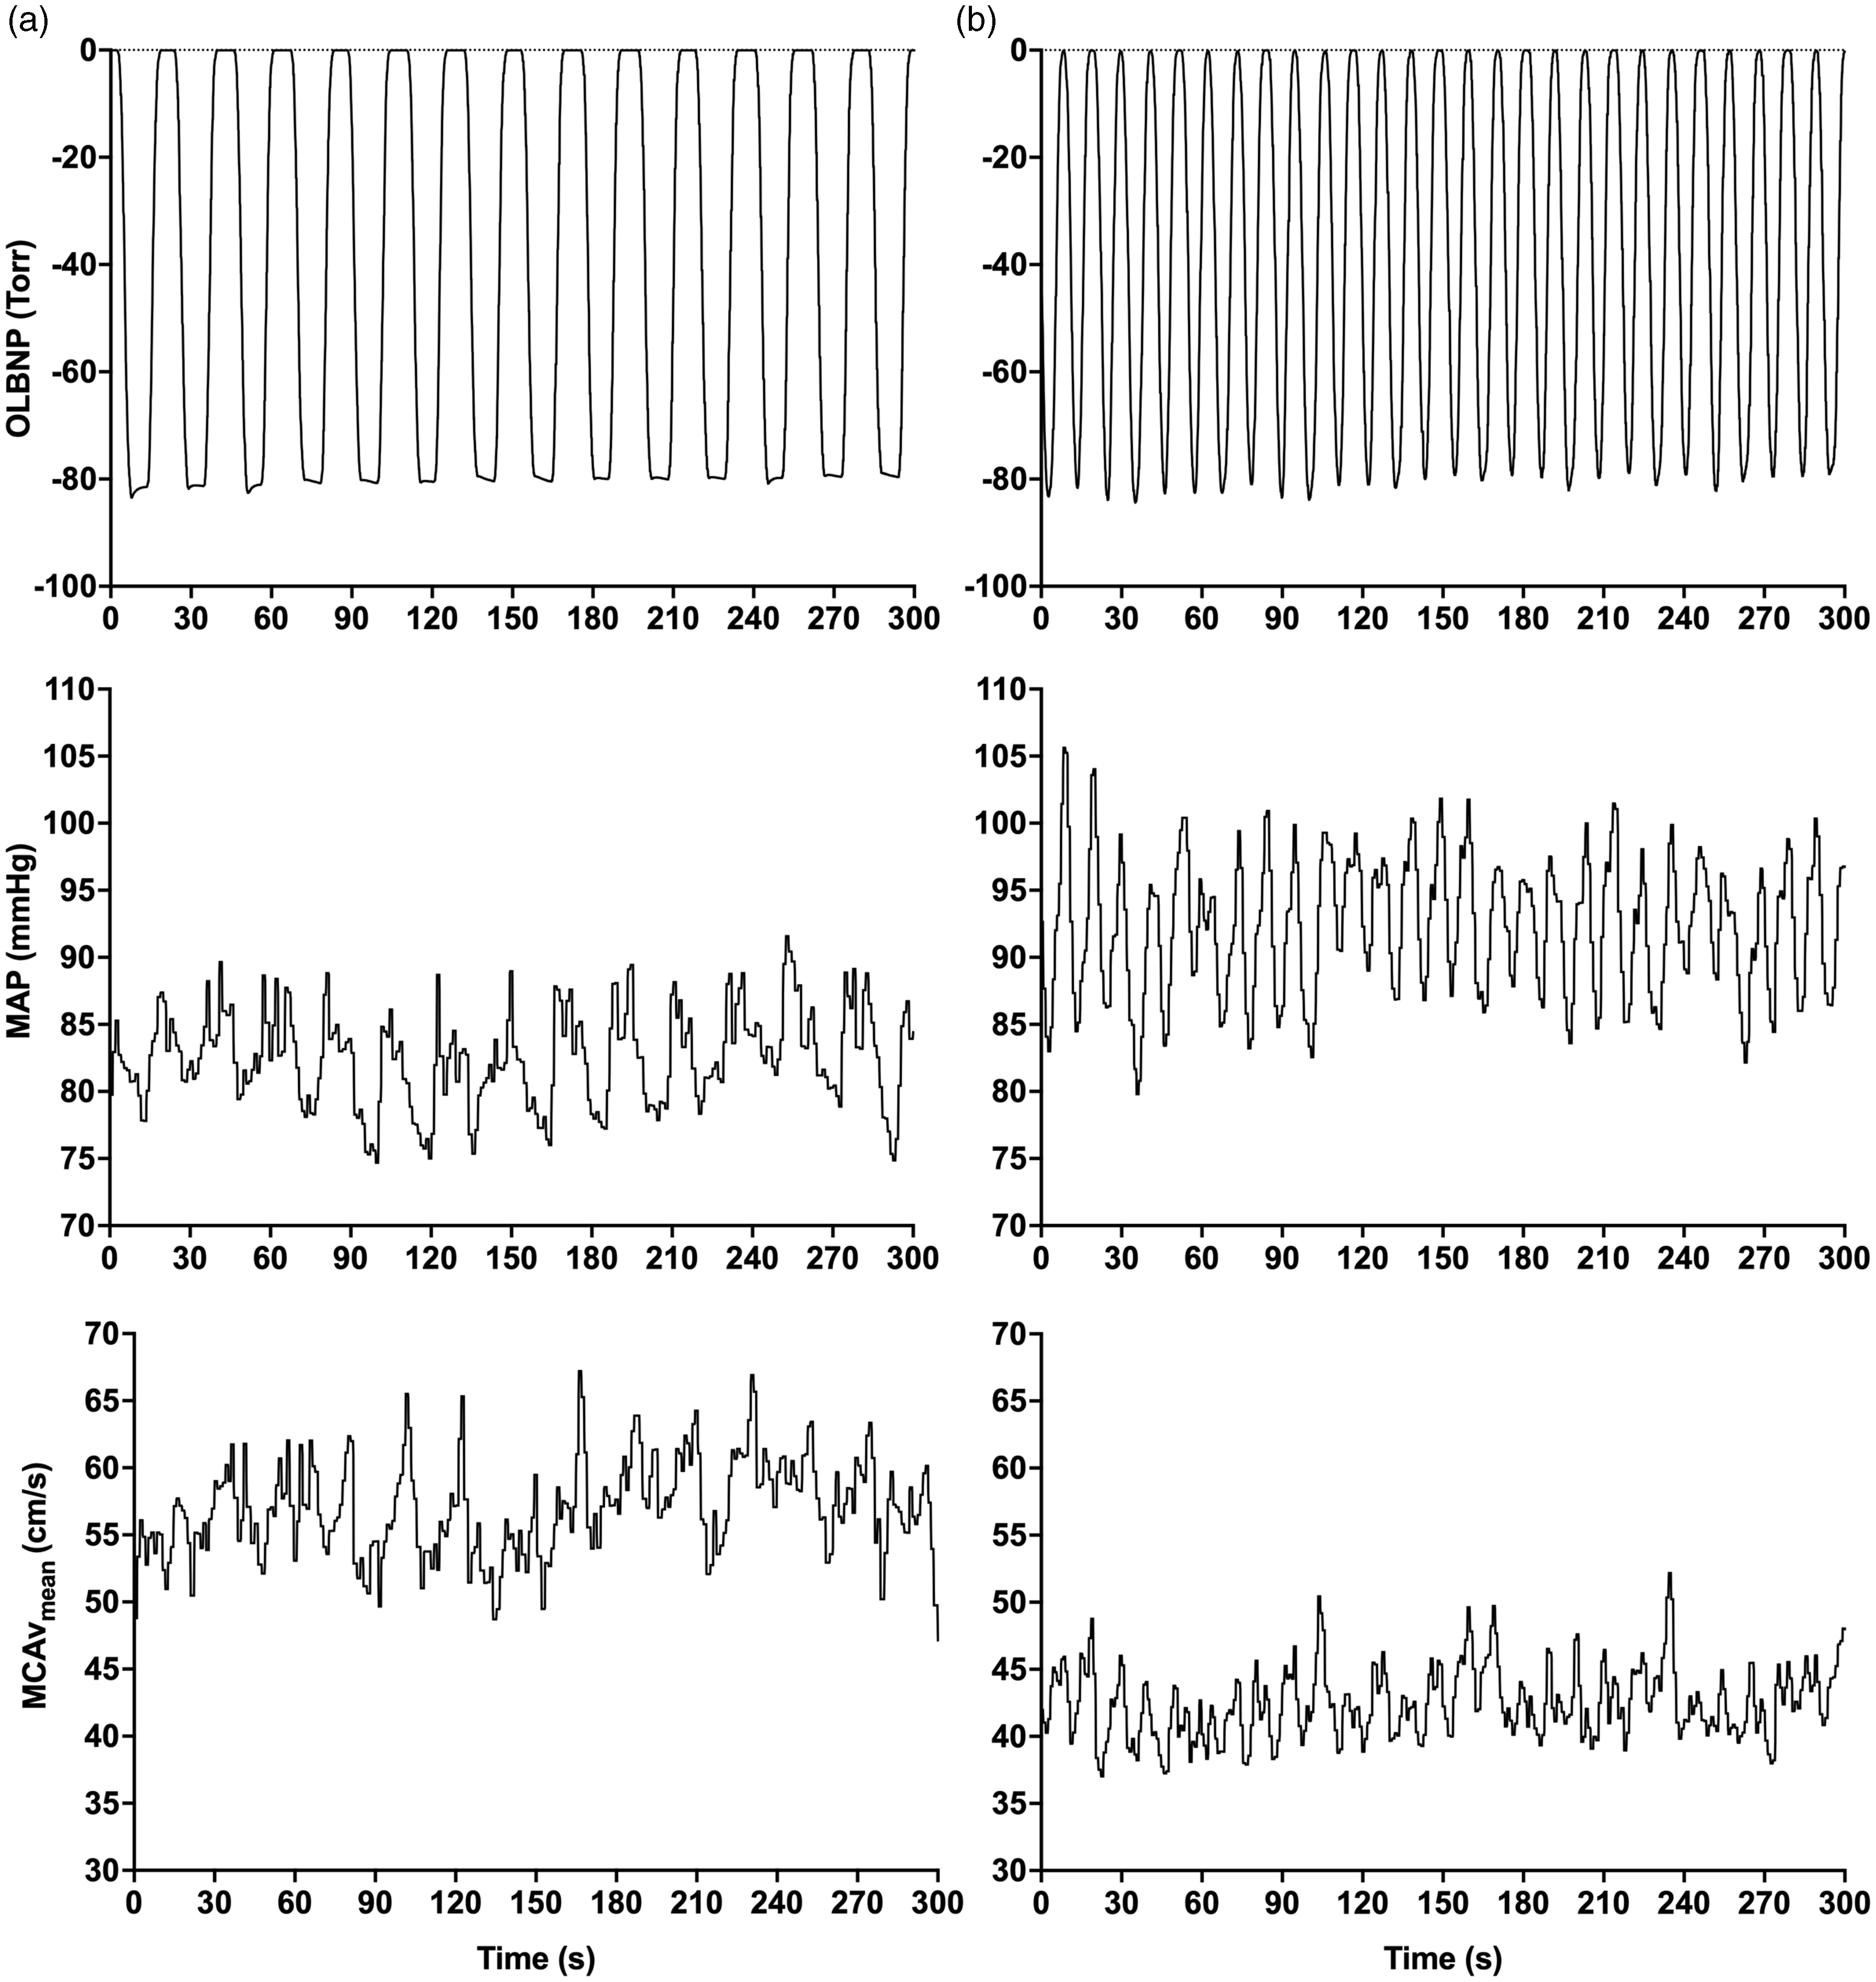
Representative continuous tracing of OLBNP, MAP and MCAvmean during 5-min OLBNP sessions at ∼0.05 Hz (Panel A) and ∼0.10 Hz (Panel B) in two different participants. OLBNP: oscillatory lower body negative pressure; MAP: mean arterial pressure; MCAvmean: middle cerebral artery mean blood velocity.
Instrumentation
Arterial blood pressure was measured continuously using finger arterial clamping (Nexfin, Edwards Lifesciences, Irvine, CA, USA), frequently calibrated using an automated sphygmomanometer at the brachial artery. MCAv was measured with a transcranial Doppler ultrasound (Doppler Box, Compumedics DWL USA, San Juan Capistrano, CA, USA). The left MCA was identified using a standardized protocol. 24 Once the MCA was identified, the probe was fixed in place with a commercial headband (DiaMon, Compumedics DWL USA, San Juan Capistrano, CA, USA) and adhesive ultrasonic gel. Ventilatory variables and PETCO2 were measured using a gas analyzer (ML206, AD Instruments, Colorado Springs, CO, USA). Heart rate was measured with a 3-lead electrocardiogram.
All data were simultaneously sampled at 1000 Hz with an analog-to-digital converter (Powerlab 16/30 ML880, AD Instruments) and saved for later analysis using commercially available software (LabChart version 7.1, AD Instruments). To account for established delays in our arterial blood pressure monitoring device, we have applied a −250 ms time shift to ensure finger arterial clamping and transcranial Doppler ultrasound data were time aligned. MAP and MCAv were obtained by averaging raw arterial blood pressure and MCA blood velocity signals, respectively, over each cardiac cycle. Calculated MAP and MCAv were not interpolated nor resampled. Subsequent analyses were completed on those signals.
Data analysis
Baseline resting values in the supine position were averaged over the last min before the first OLBNP session started. To characterize the cerebral pressure-flow relationship in response to transient increases and decreases in MAP, we calculated a time-adjusted ratio between MCAv and MAP changes for each OLBNP transition in each MAP direction. Following visual inspection, oscillations in the first min were discarded for stable MAP and MCAv oscillations to be achieved. All participants had at least 5 min of OLBNP recording included for each frequency3,10 (Figure 1). Absolute changes in MCAv (ΔMCAv) and MAP (ΔMAP) during acute increases in MAP (INC) were calculated as the difference between maximal values and the preceding minima for each transition. Absolute ΔMCAv and ΔMAP during acute decreases in MAP (DEC) were calculated as the difference between the minimum and the preceding maximum. For all participants, these values were then averaged over the OLBNP session.3,10 Time intervals (in s) for MCAv (Δtime MCAv) and MAP (Δtime MAP) changes were calculated as the difference between the time at maximum value and the time at minimum value for each variable during INC for each transition. 3 Similarly, the difference between the time at minimum value and the time at maximum value were calculated to obtain the time interval during DEC for each transition of each variable (see Figure 1 from 3 ) The rate of change for both MAP and MCAv were then calculated as (ΔMAP/Δtime MAP) and (ΔMCAv/Δtime MCAv). Values of the complete 5-min period were then averaged for each participant. For a visual representation of how these measures were calculated, we direct the reader to Figure 1 from. 3 To characterize the cerebral pressure-flow relationship in response to INC and DEC, we calculated a time-adjusted ratio between MCAv and MAP changes for each OLBNP transition in each MAP direction as previously described. 3 All values that were greater than 3 standard deviations were removed. Then, we averaged ΔMCAvT/ΔMAPT for each MAP direction for each individual’s repeated OLBNP over recording period.
ΔMCAvT/ΔMAPT during transient decreases in MAP (ΔMCAvT/
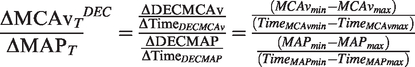
ΔMCAvT/ΔMAPT during transient increases in MAP (ΔMCAvT/
PETCO2 data were averaged over each OLBNP transition. To further evaluate whether OLBNP induced changes in PETCO2, an averaged PETCO2 of the first and last five OLBNP oscillations were calculated for each frequency (0.05 and 0.10 Hz).
Statistical analysis
The normality of distributions was tested using Shapiro–Wilk tests. Paired t-tests, or Wilcoxon matched-pairs signed-rank tests if data distribution was not normal, were used to compare variables between transient MAP increases and decreases for each frequency. Of note, in the case of negative values (i.e. values calculated during acute decreases in MAP), absolute values were used to carry out descriptive calculations and statistical analysis. For PETCO2, the averaged values over the first five MAP oscillations were compared to the last five MAP oscillations to evaluate change over time using a paired t-test. A priori significance threshold was determined as α < 0.05.
Results
Baseline characteristics and resting values
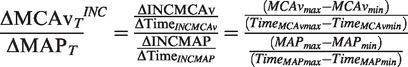
A total of 19 participants (9 females and 10 males) were included in the analysis. One female was excluded from the analysis because they started a new medication before the completion of the study. For the 0.05 Hz analysis, three participants were excluded due to inconsistency in MCAv oscillations, although MAP oscillations were as expected. For the 0.10 Hz analysis, one participant was excluded for the same reason (See Figure 2 for examples of uninterpretable signals). Final sample sizes for 0.05 Hz and 0.10 Hz analyses were 16 and 18, respectively. Baseline characteristics as well as resting systemic and cerebral hemodynamics are shown in Table 1. Among recruited females, two were taking oral contraceptives (Alesse 28®, Loestrin®) and one was using a vaginal ring (Nuvaring®).
Examples of problematic continuous tracing of OLBNP, MAP and MCAvmean during 5-min OLBNP sessions at ∼0.05 Hz (Panel A) and ∼0.10 Hz (Panel B) in two different participants. In these examples, MCAvmean was problematic and uninterpretable at ∼0.05 Hz, whereas MAP was problematic and uninterpretable at ∼0.10 Hz. Of note, these problematic tracings were not caused by devices’ problems. OLBNP: oscillatory lower body negative pressure; MAP: mean arterial pressure; MCAvmean: middle cerebral artery mean blood velocity.
Baseline characteristics and resting seated values.
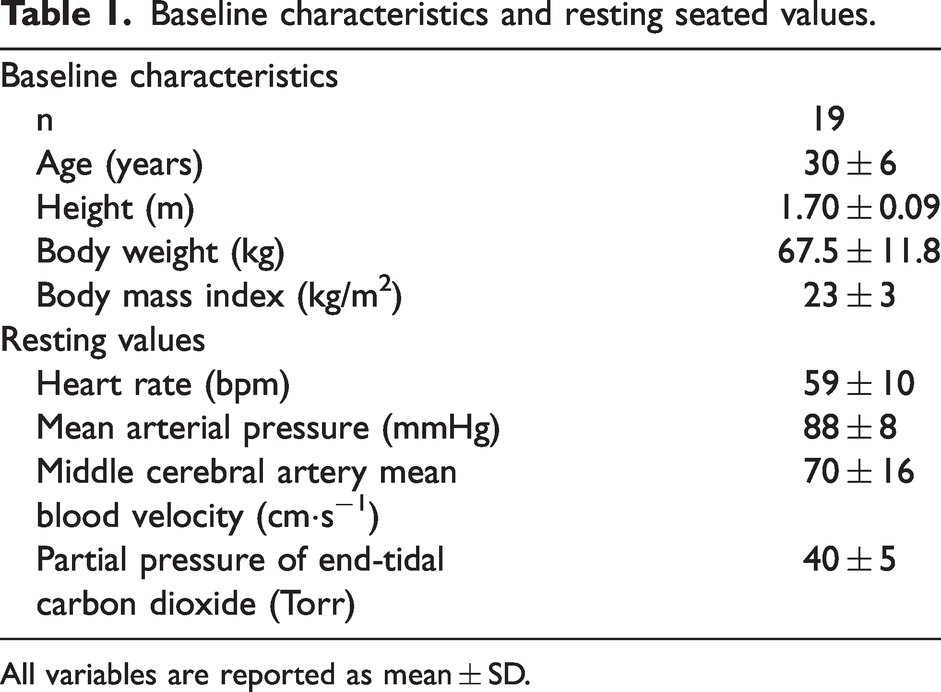
All variables are reported as mean ± SD.
Oscillatory lower body negative pressure
In 12 participants, we were able to record the inside pressure of the OLBNP chamber. The averaged minimal pressure reached during vacuum was −83 ± 4 Torr (range: −74 to −88 Torr) for 0.05 Hz oscillations and −82 ± 4 Torr (range: −74 to −89 Torr) for 0.10 Hz oscillations (p = 0.1266). After validation at the completion of the study, we noticed there was a slight variability over OLBNP sequences in the vacuuming/venting frequency, which resulted in an averaged frequency of 0.0463 Hz (range 0.045–0.048 Hz) and 0.0925 Hz (range 0.087–0.102 Hz). Both frequencies remain in their target frequency domain being very low frequency (0.02–0.07 Hz) and low frequency (0.07–0.20 Hz). Accordingly, ∼0.05 Hz and ∼0.10 Hz were utilized throughout the remaining of the text, in Tables and Figures to denote target frequencies.
Directional sensitivity of the cerebral pressure-flow relationship
At ∼0.05 Hz OLBNP, absolute changes in MAP were +14.0 ± 5.9 mmHg during INC and −14.3 ± 5.8 mmHg during DEC (p = 0.04; Figure 3), whereas absolute changes in MCAv were + 13.4 ± 3.7 cm·s−1 during INC and −13.7 ± 3.7 cm·s−1 during DEC (p = 0.175; Figure 3). During both INC and DEC, time intervals for change in MAP (11.3 ± 1.6 vs. 11.3 ± 1.5 s; p = 0.964; Figure 3) and MCAv (11.5 ± 1.8 vs. 11.2 ± 1.4 s; p = 0.660; Figure 3) were not different. The rate of change in MAP (1.53 ± 0.72 vs. 1.39 ± 0.50 mmHg·s−1; p = 0.362; Figure 3) and MCAv (1.54 ± 0.42 vs 1.52 ± 0.46 mmHg·s−2; p = 0.940; Figure 3) were not different between MAP directions (Table 2). ΔMCAvT/
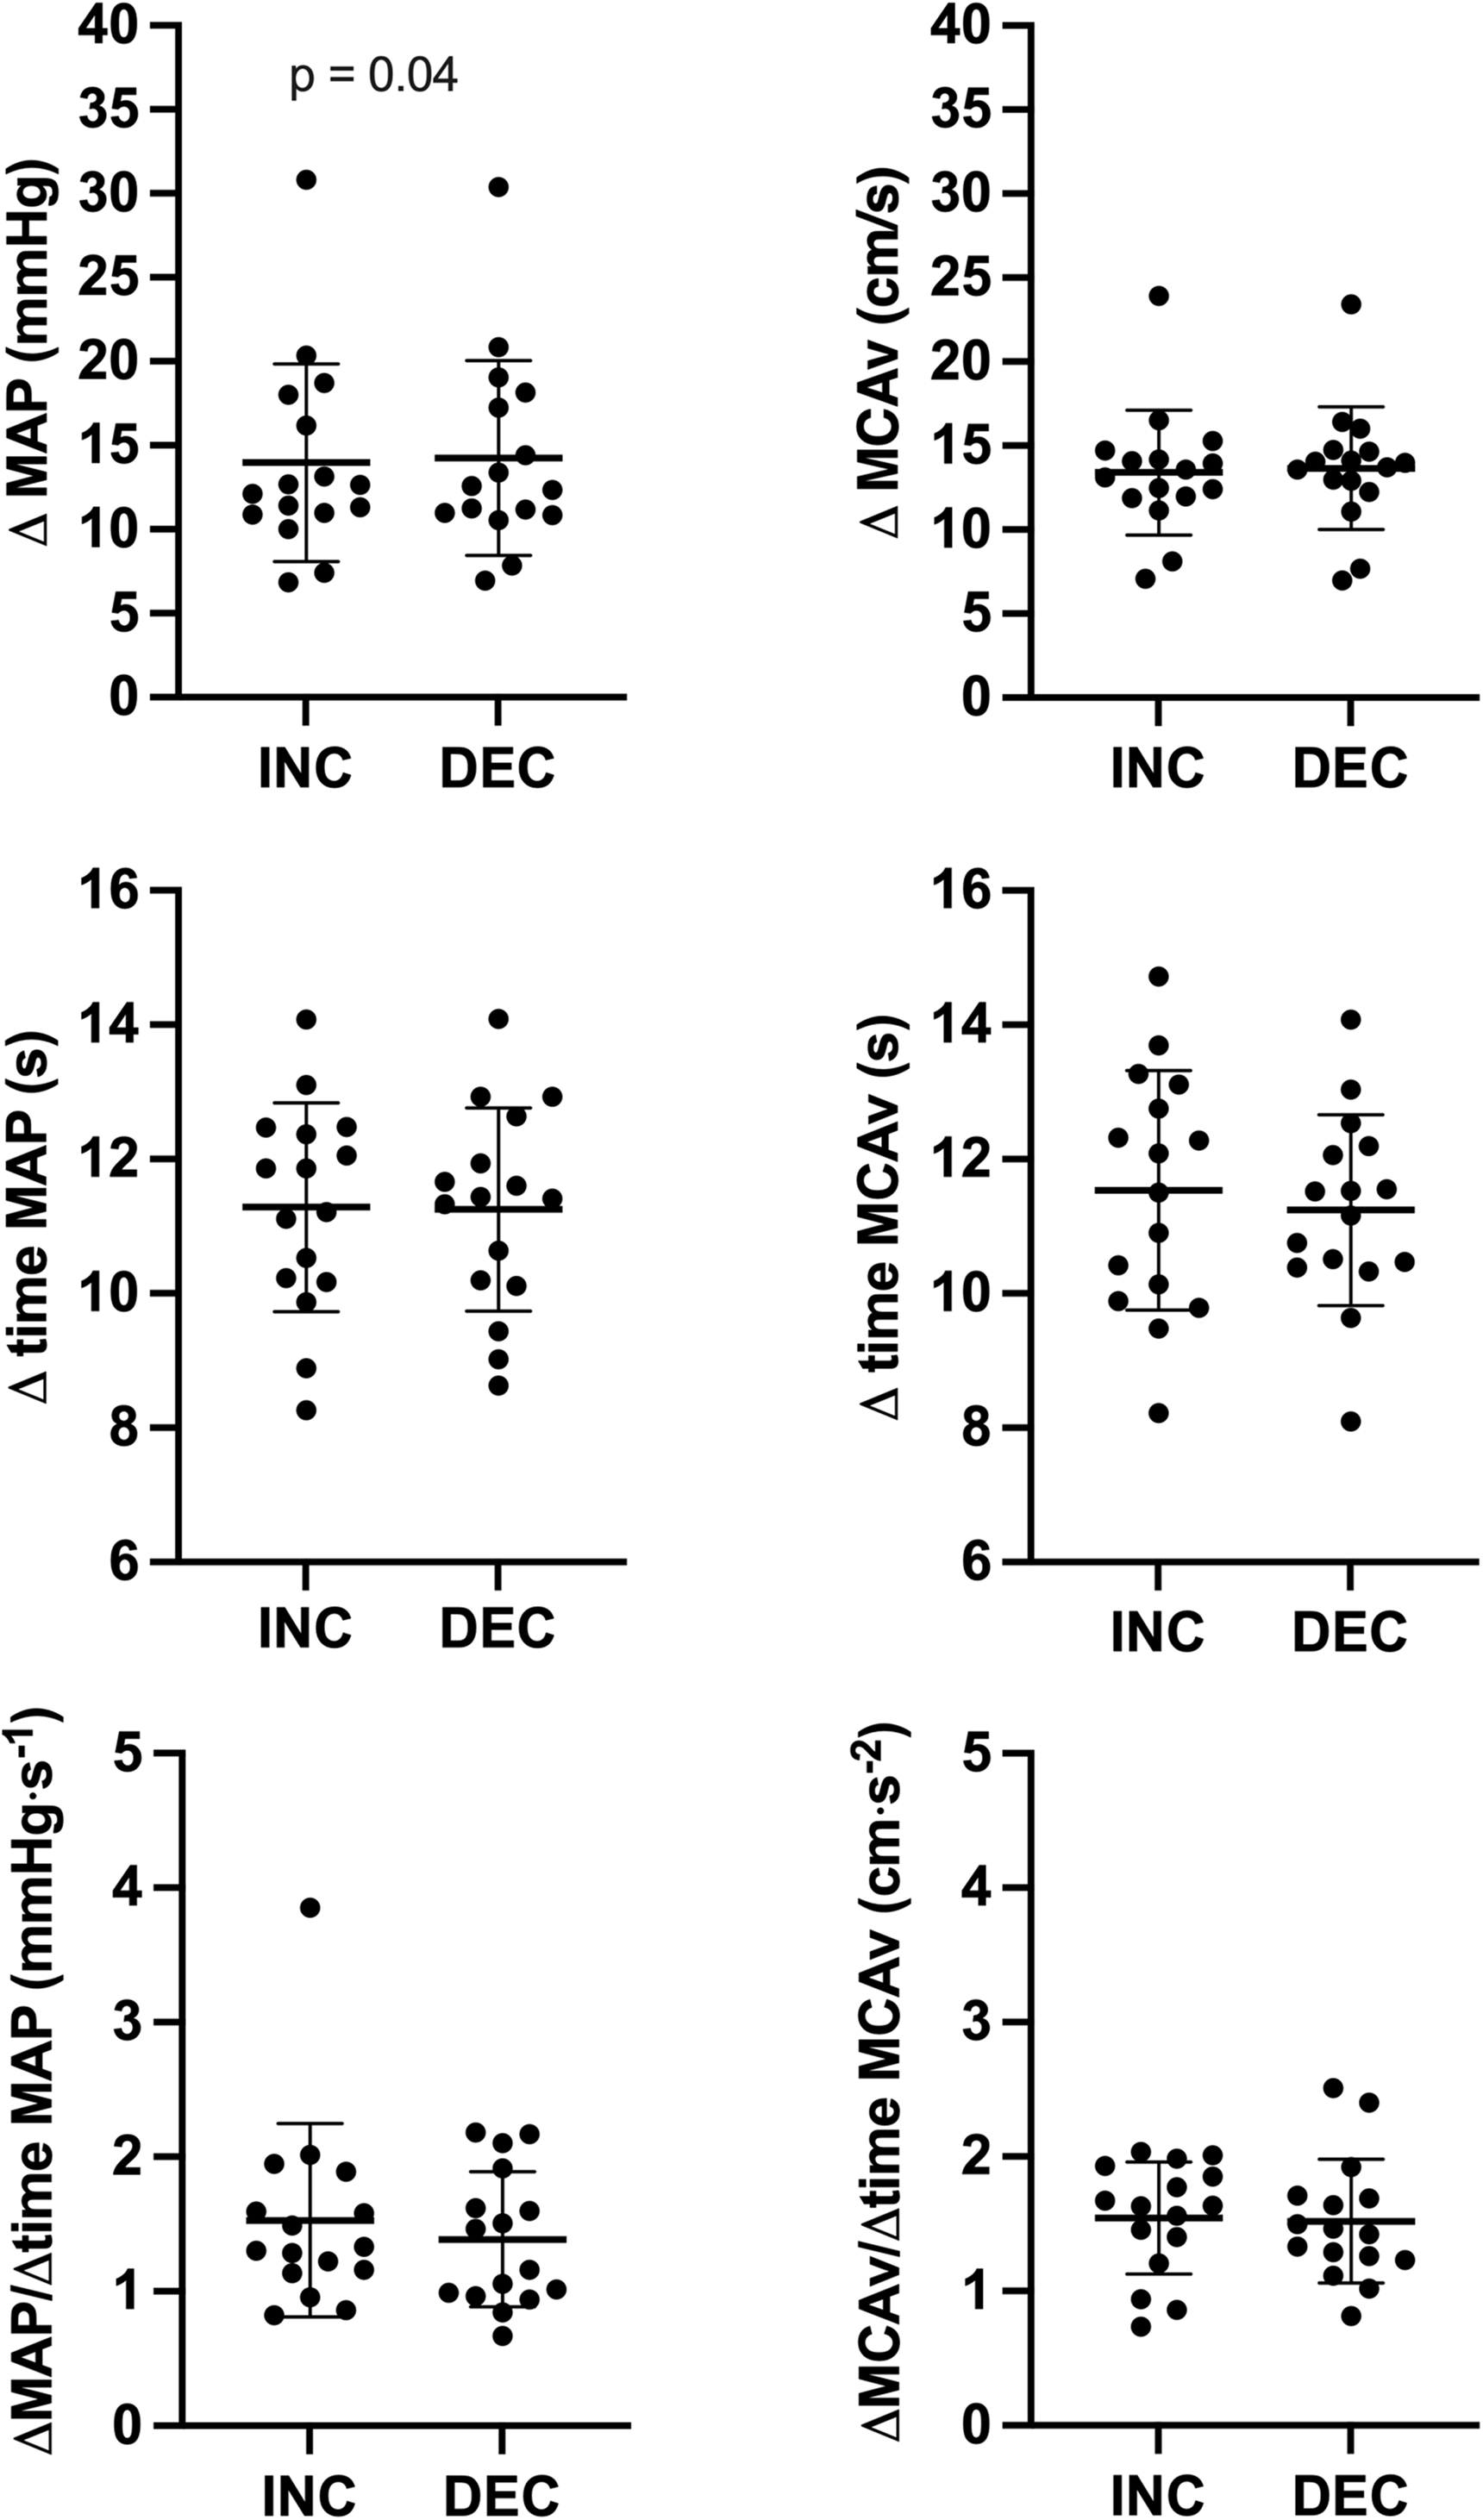
Absolute changes in MAP and MCAv, time interval of changes in MAP and MCAv and rate of change for MAP and MCAv during transient increases (INC) and decreases (DEC) at ∼0.05 Hz OLBNP. Differences were assessed via paired-t test or Wilcoxon signed-rank test. ΔMAP: absolute changes in mean arterial pressure; ΔMCAv: absolute changes in middle cerebral artery mean blood velocity; Δ time MAP: time interval for changes in mean arterial pressure; Δ time MCAv: time interval for changes in middle cerebral artery mean blood velocity; ΔMAP/Δ time MAP: rate of change in mean arterial pressure; ΔMCAv/Δ time MCAv: rate of change in middle cerebral artery mean blood velocity.
Averaged absolute changes, time intervals and rate of change during INC and DEC at 0.05 Hz and 0.10 Hz OLBNP.
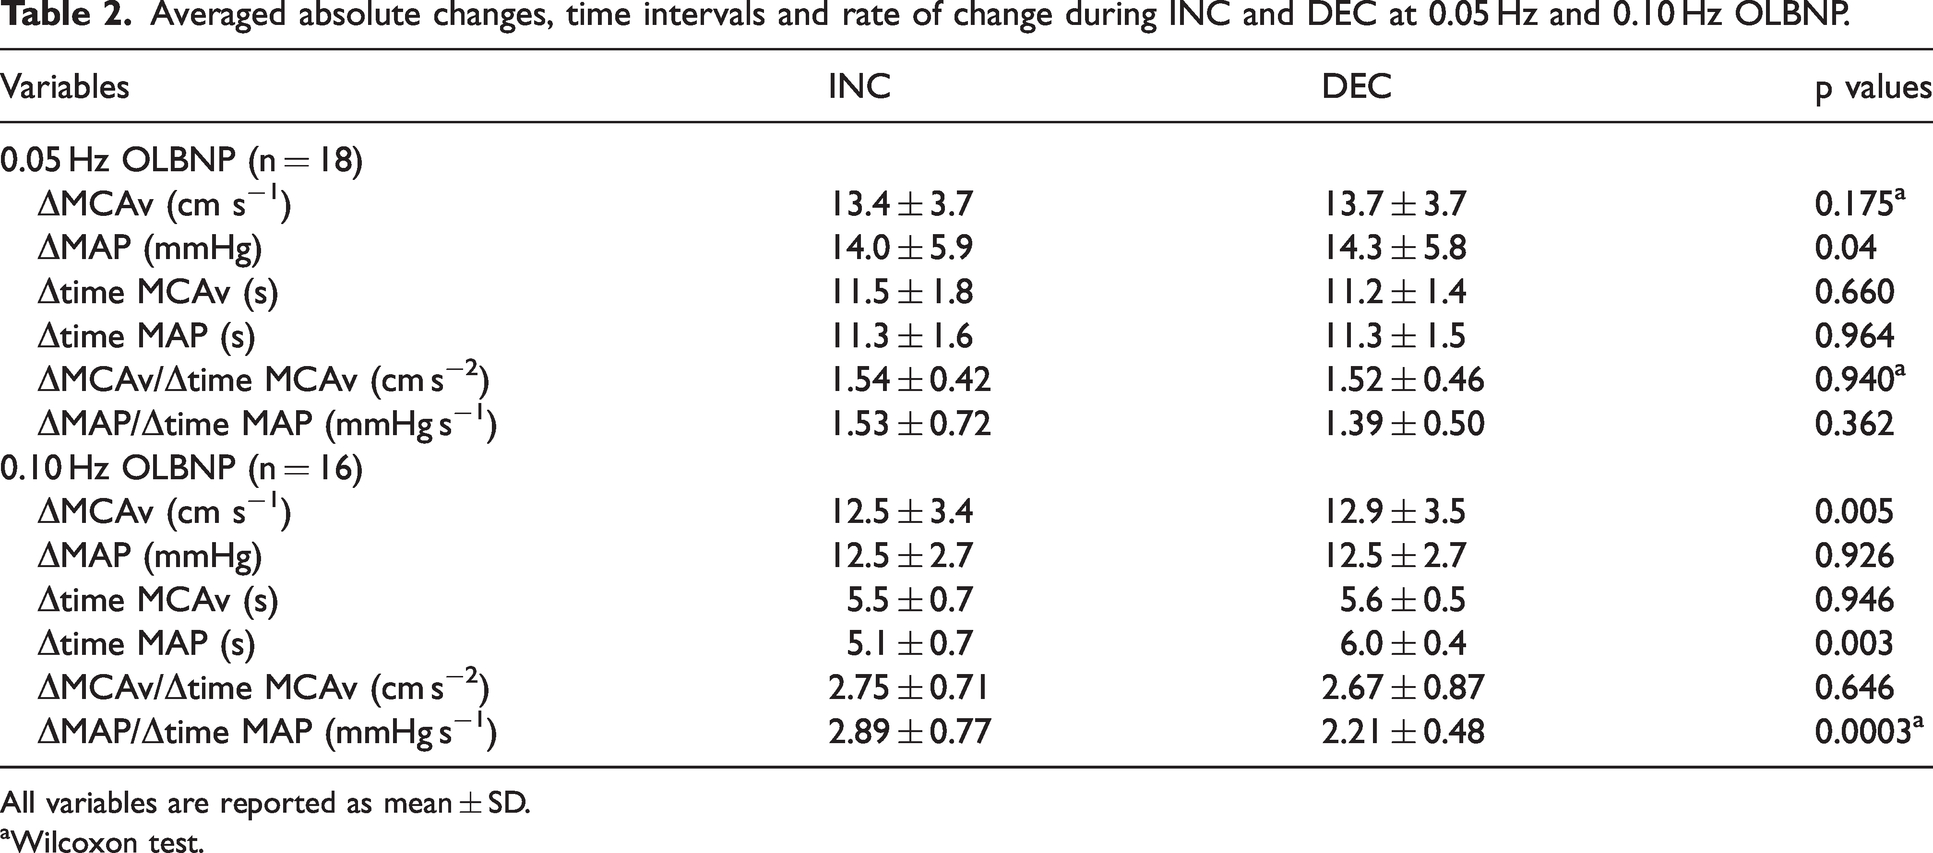
All variables are reported as mean ± SD.
Wilcoxon test.
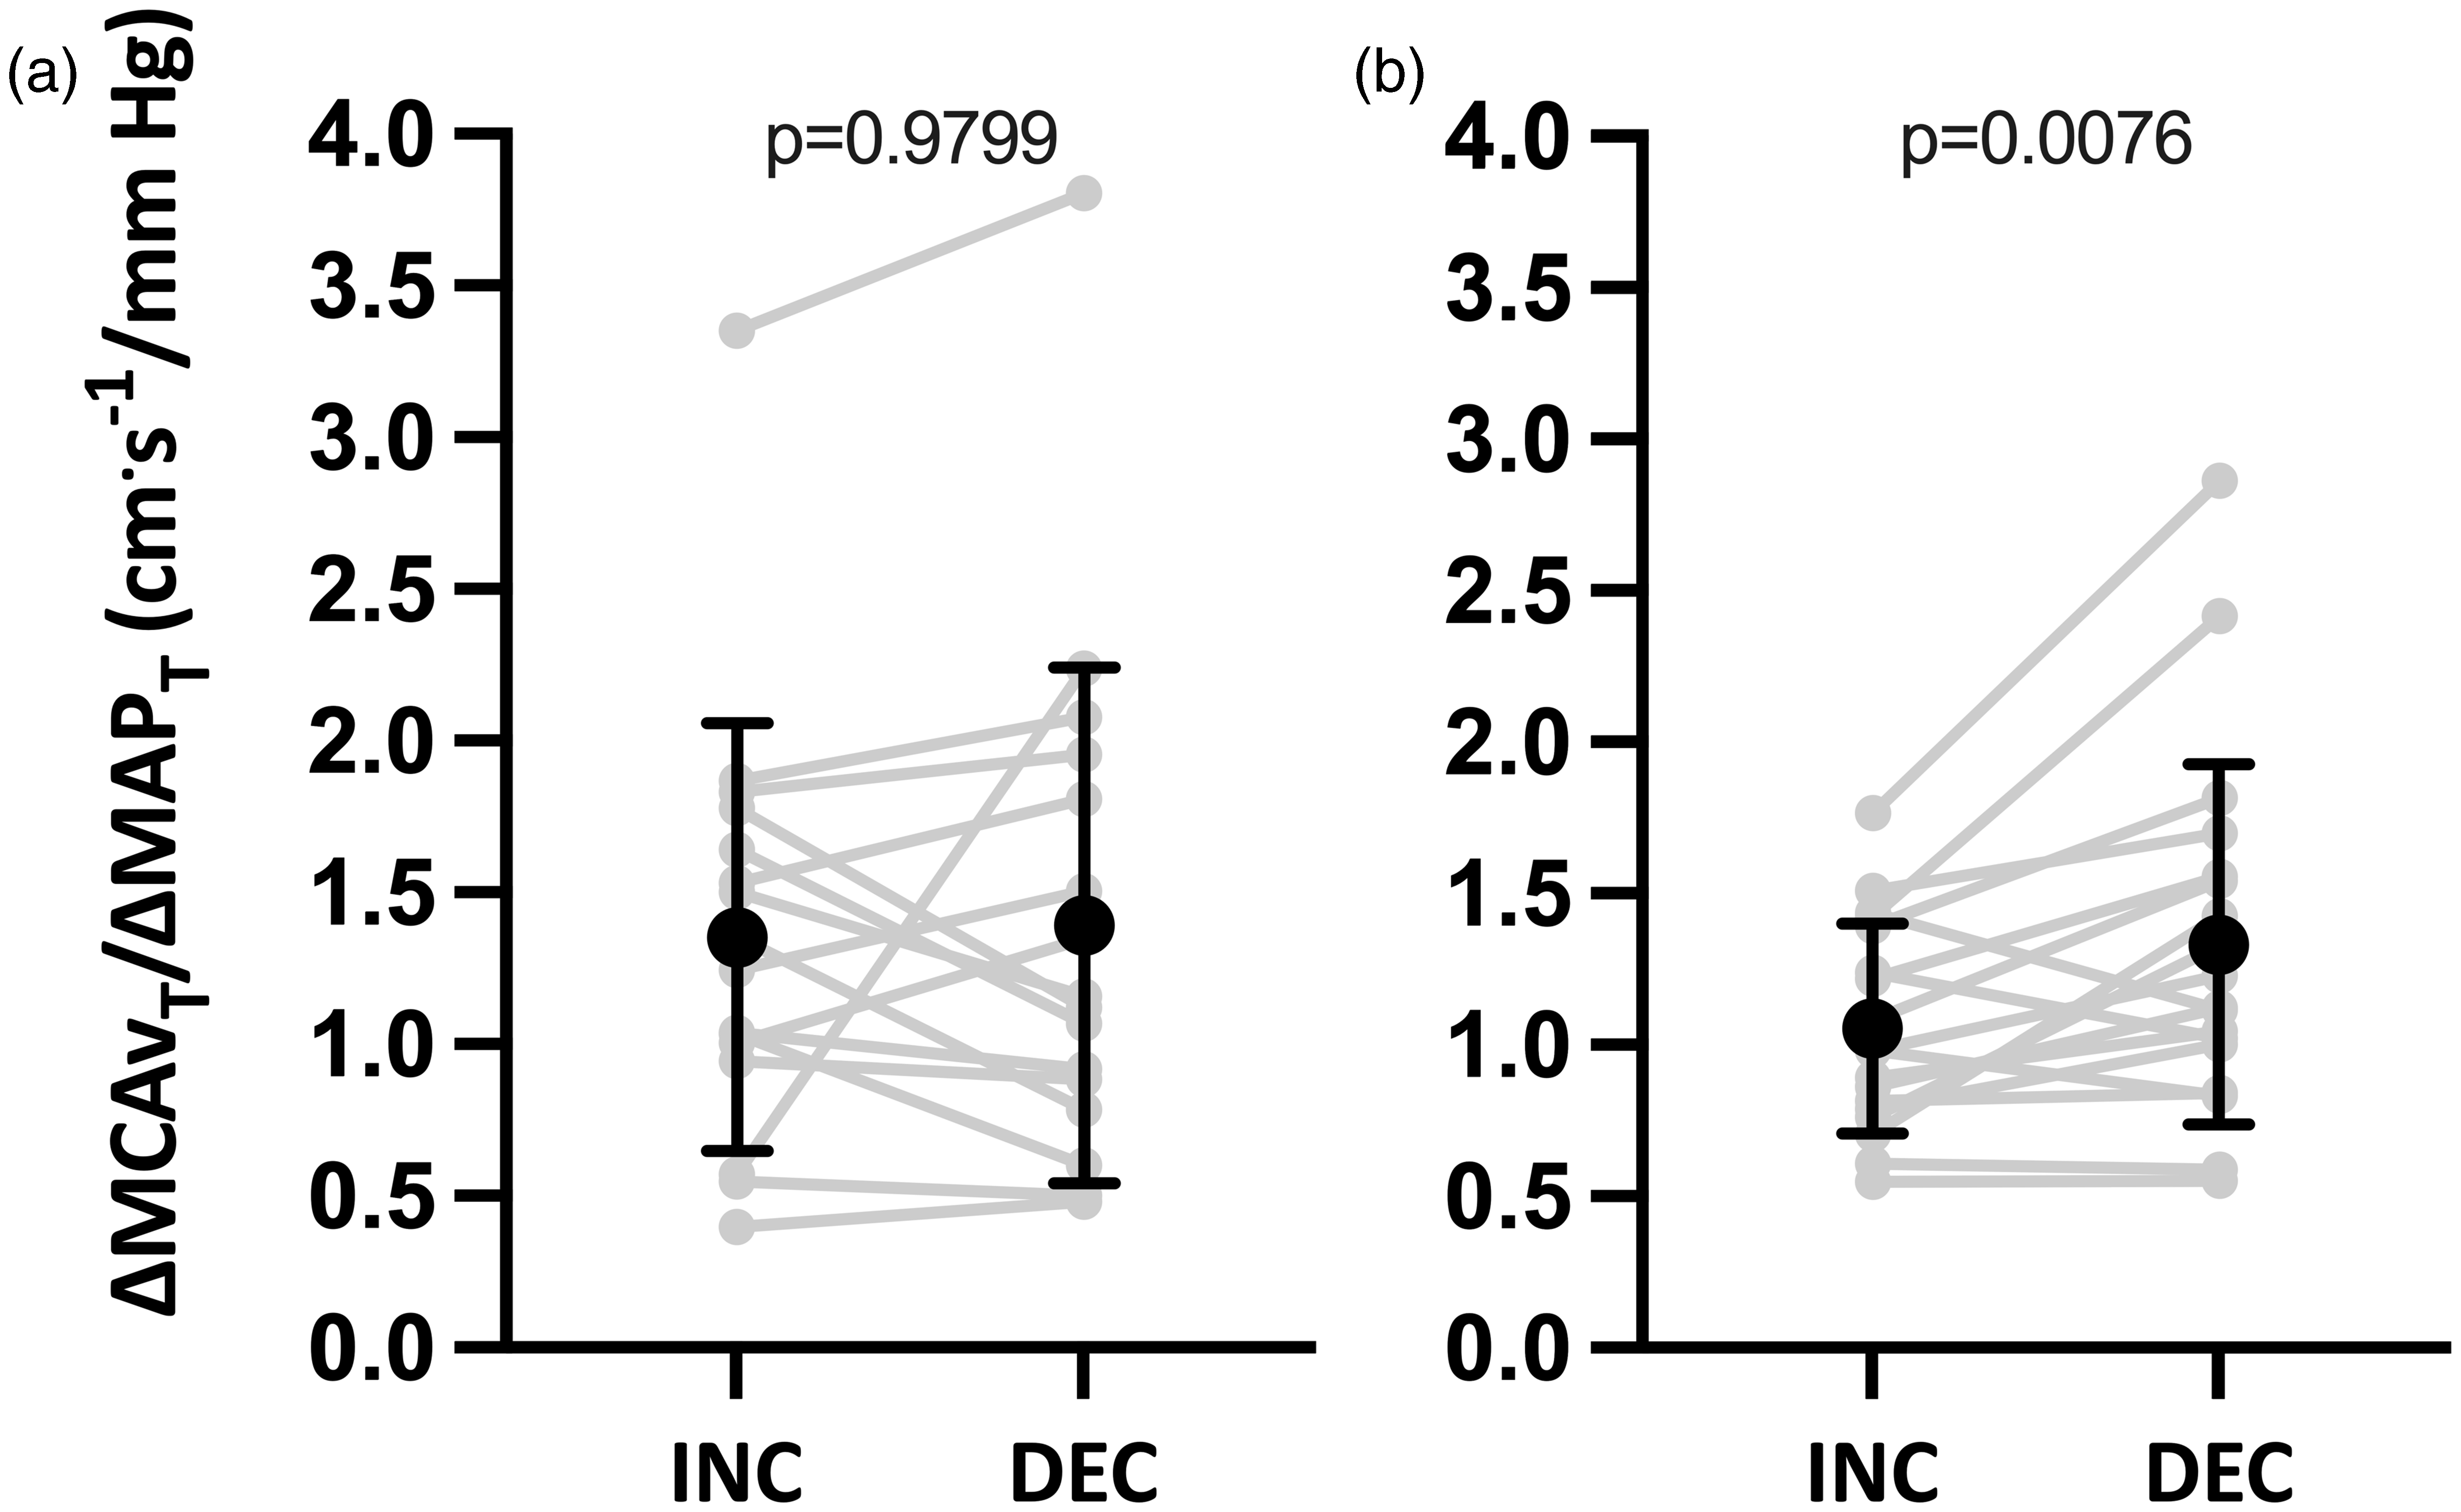
Time-adjusted absolute changes in middle cerebral artery mean blood velocity/time adjusted absolute changes in mean arterial pressure (ΔMCAvT/ΔMAPT) during transient increases (INC) and decreases (DEC) for ∼0.05 (panel A) and ∼0.10 Hz (panel B) OLBNP. n = 16 for ∼0.05 Hz and n = 18 for ∼0.10 Hz. Differences were assessed via Wilcoxon matched-pairs signed-rank test (Panel A) and paired-t test (Panel B). MAP: mean arterial pressure; MCA: middle cerebral artery.
At ∼0.10 Hz OLBNP, absolute changes in MAP were +12.5 ± 2.7 mmHg during INC and −12.5 ± 2.7 mmHg during DEC (p = 0.926; Figure 5), whereas absolute changes in MCAv were + 12.5 ± 3.4 cm/s during INC and −12.9 ± 3.5 cm/s during DEC (p = 0.0052; Figure 5). Time of change in MAP was faster during INC than DEC (5.1 ± 0.7 vs. 6.0 ± 0.4 s; p = 0.003; Figure 5), whereas time of change in MCAv was not different between both MAP directions (5.5 ± 0.7 vs. 5.6 ± 0.5 s; p = 0.946; Figure 5). The rate of change in MAP was higher during INC vs. DEC (2.89 ± 0.77 vs. 2.21 ± 0.48 mmHg·s−1; p = 0.0003; Figure 5), whereas the rate of change in MCAv was not different between both MAP directions (2.75 ± 0.71 vs. 2.67 ± 0.87 cm·s−2; p = 0.646; Figure 5). ΔMCAvT/
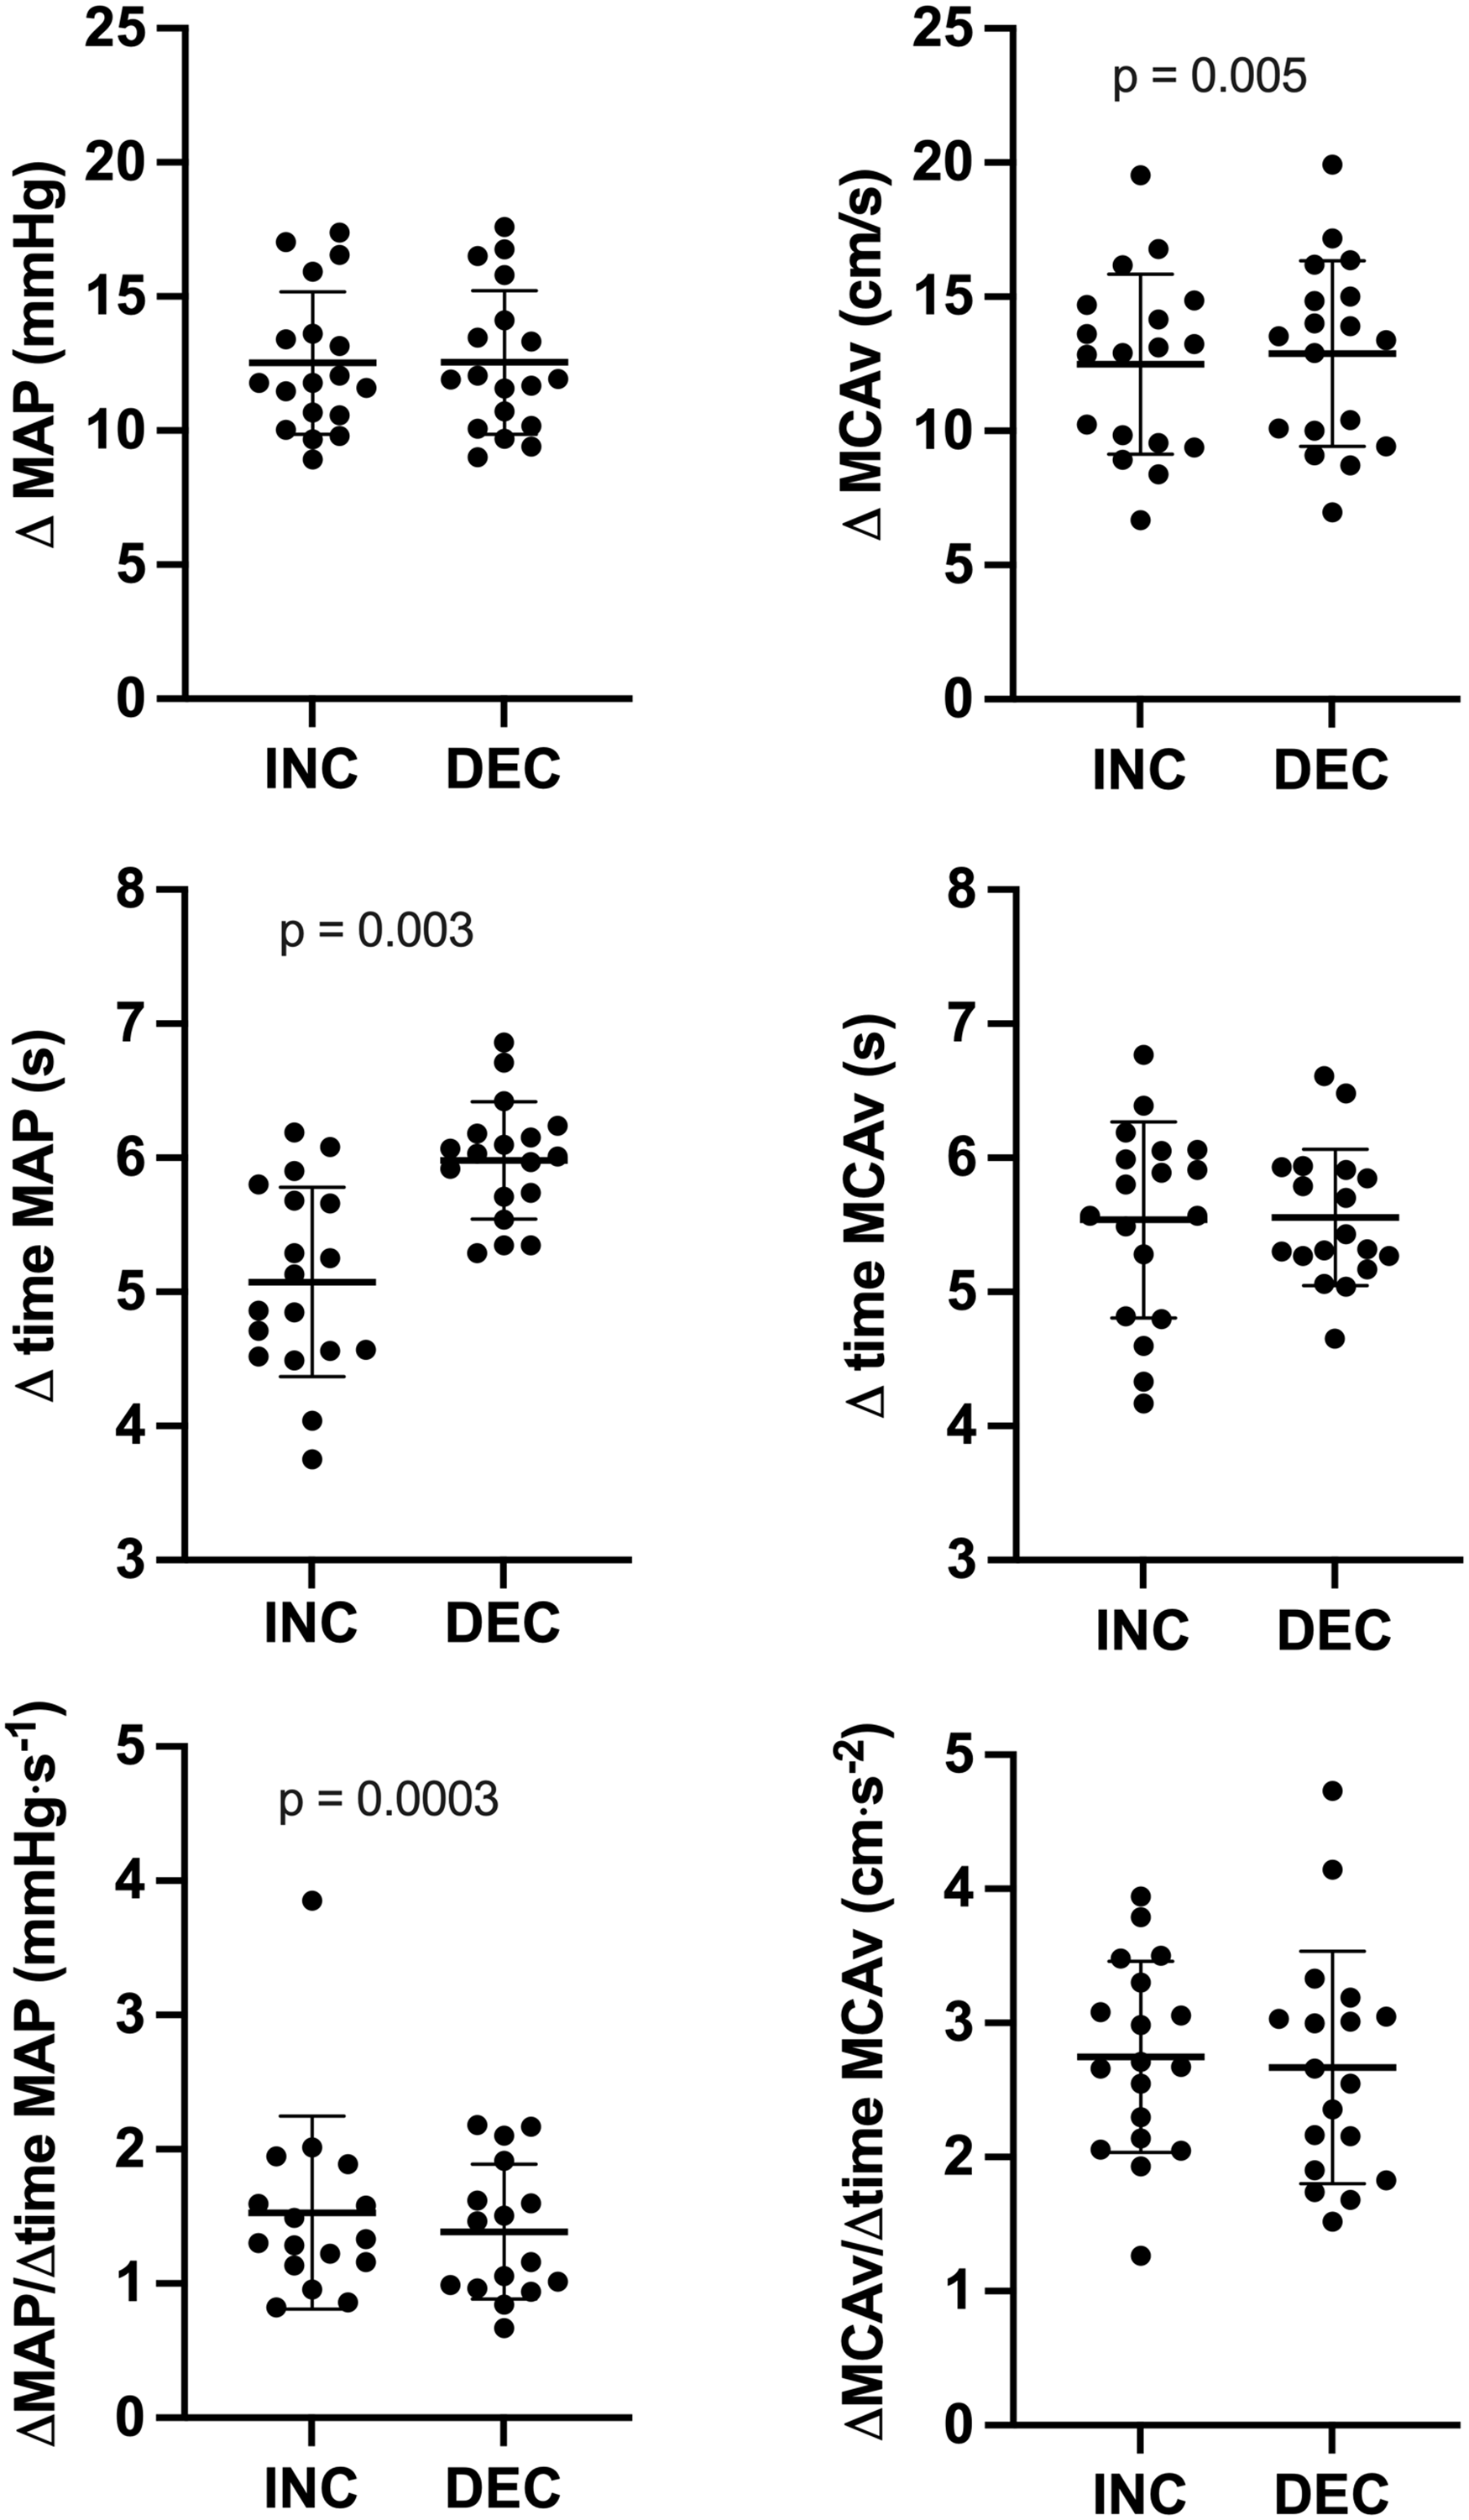
Absolute changes in MAP and MCAv, time interval of changes in MAP and MCAv and rate of change for MAP and MCAv during transient increases (INC) and decreases (DEC) at ∼0.10 Hz OLBNP. Differences were assessed via paired-t test or Wilcoxon signed-rank test. ΔMAP: absolute changes in mean arterial pressure; ΔMCAv: absolute changes in middle cerebral artery mean blood velocity; Δ time MAP: time interval for changes in mean arterial pressure; Δ time MCAv: time interval for changes in middle cerebral artery mean blood velocity; ΔMAP/Δ time MAP: rate of change in mean arterial pressure; ΔMCAv/Δ time MCAv: rate of change in middle cerebral artery mean blood velocity.
Partial pressure of end-tidal carbon dioxide
Averaged PETCO2 over the complete OLBNP period was not different between ∼0.05 Hz and ∼0.10 Hz oscillations (37 ± 3 vs. 36 ± 4 Torr; p = 0.866). Also, the averaged PETCO2 during the first five and last five MAP oscillations were not different at both ∼0.05 Hz (38 ± 4 vs. 38 ± 4; p = 0.6081) and ∼0.10 Hz (38 ± 4 vs. 37 ± 4; p = 0.053).
Discussion
The findings of the current study, which included healthy participants, support the presence of a directional sensitivity of the cerebral pressure-flow relationship in the supine position using OLBNP at ∼0.10 Hz. In other words, when MAP is acutely increased using OLBNP at ∼0.10 Hz, the associated acute increase in MCAv is attenuated compared to when MAP is acutely decreased. Since these results are in line with our previous results using repeated squat-stands,3,10 –12 the current findings support the use of OLBNP as an adequate method to characterize the directional sensitivity of the cerebral pressure-flow relationship in the supine position. In addition to reinforcing the evidence of a hysteresis-like pattern in the cerebral pressure-flow relationship, this study suggests the phenomenon is physiological in nature and not artificially created by the model utilized to force MAP oscillations.
Directional sensitivity of the cerebral pressure-flow relationship using oscillatory lower body negative pressure
An interesting approach to investigate the potential mechanisms underlying the directional sensitivity of the cerebral pressure-flow relationship is the use of pharmacological agents, which is associated to risks such as severe arterial hypotension, particularly in the standing position.19 –21 Therefore, the use of repeated squat-stands is likely not an optimal method to pursue this objective. Moreover, the use of repeated squat-stands does not allow to isolate the influence of the direction of the MAP changes from the potential impact of exercise-induced cardiovascular activation and gravity on dCA. It was therefore important to evaluate whether this OLBNP model, using a passive stress to force MAP and MCAv oscillations with the participants in a supine position, can be used to characterize the directional sensitivity of the cerebral pressure-flow relationship, which we demonstrate herein. Interestingly, as we have previously reported with repeated squat-stands, the directional sensitivity present at ∼0.10 Hz but absent at ∼0.05 Hz, remained when utilizing OLBNP to induce MAP oscillations. This is an important finding since the same mechanisms could be involved both in the standing and supine positions. It should be noted there will be different hydrostatic pressures experienced at the head for these two postures, which may influence the cerebral pressure-flow relationship.
Oscillatory lower body negative pressure at ∼0.05 Hz
The absence of directional sensitivity at ∼0.05 Hz OLBNP could be explained by the baroreflex latency.25,26 Since these oscillations are slower, baroreceptors have time to sense pressure loading or unloading and induce appropriate cardiovascular adjustments. This could mitigate the impact of MAP on MCAv over a 10-s time interval. Importantly, although the absolute change in MAP was significantly different between INC and DEC (Table 2), a difference of 0.3 mmHg is not clinically relevant and does not explain the absence of directional sensitivity at 0.05 Hz. Moreover, the statistically, but not clinically, significant difference in MAP stimulus was not associated with a difference in MCAv changes (Table 2). Using cyclical inflation-deflation of thigh cuffs at 0.03 Hz, Aaslid et al. did not report the presence of a directional sensitivity in healthy participants, which supports our finding at ∼0.05 Hz OLBNP, even using a different metric and methodology. 27 Indeed, these authors used a dynamic autoregulatory gain to compare cerebral pressure-flow relationship responses during acute increases and decreases in MAP. Conversely, using random cyclical inflation-deflation of thigh cuffs, Katsogridakis et al. did not find an evidence of directional sensitivity of the cerebral pressure-flow relationship. 28 However, these authors used a random frequency without providing any additional methodological details, making the comparison between their findings to ours challenging. Contrary to our findings, Panerai et al. did find a directional sensitivity when using the ARI 13 and an autoregressive moving average (ARMA) 14 model during 0.05 Hz repeated squat-stands. This discrepancy between findings from Panerai’s group and ours could be explained by several factors. First, their repeated squat-stand protocol was different than ours since these investigators asked participants to adjust the depth of their squats according to their cardiovascular endurance. Also, the ARI analysis requires to use resting baseline values (before induced MAP and CBv oscillations), which does not reflect the actual MAP and CBv changes between maximal and minimum values. 3 Overall, it is also worth noting that there are differences in reproducibility using various techniques, which could explain the discrepancies between the cited studies. 8
Oscillatory lower body negative pressure at ∼0.10 Hz
An interesting element we found is the greater rate of change in MAP during INC than DEC at 0.10 Hz. This would indicate that for a change of similar amplitude, the increase in MAP is faster than its decrease. However, this is not translated by a difference in the rate of change in MCAv between INC and DEC, although the absolute change in MCAv (ΔMCAv) was greater in DEC. However, we believe this 0.4 cm s−1 difference is more of a statistical than clinical significance. The difference in the rate of change in MAP is apparently explained by the duration (Δtime MAP) of the change that is shorter during INC (Table 2). Although the MAP stimulus during INC is of similar amplitude than in DEC, it reaches its maximal value faster. However, the ΔMCAvT/
Methodological considerations
This study presents some limitations, which need to be further discussed. First, since only healthy males and females aged 18 to 45 years were included in the current study, results cannot be generalized to infants, elderly or clinical populations. Also, only the MCA was insonated, so results cannot be extended to other cerebral territories such as those supplied via the posterior cerebral artery (PCA). This being acknowledged, no differences were found between MCA and PCA when assessing directional sensitivity of the cerebral pressure-flow relationship using repeated squat-stands. 10 In addition, MCAv was measured using transcranial Doppler ultrasound, which is considered representative of blood flow only if the diameter of the vessel is assumed to remain stable. 29 Changes in PETCO2 have been associated with MCA’s diameter variations.30,31 In the current study, participants had to maintain their baseline breathing frequency during OLBNP with the help of a metronome, aiming at minimizing PETCO2 variations, which was successful. Averaged PETCO2 during OLBNP was similar at both frequencies, so we are confident PETCO2 changes do not explain differences between both frequencies. Moreover, PETCO2 was similar at the beginning and the end of OLBNP trials at both frequencies. Therefore, it is unlikely that the small variations in PETCO2 had a major impact on MCA diameter and measured CBv. Although our experimental protocol did not permit to investigate the impact of PETCO2 for each MAP oscillations, we are confident its impact is minimal.
The failure to detect a difference at ∼0.05 Hz could be due to our lower sample size (n = 16) at this frequency. However, we remain confident in our findings considering we did not find difference at 0.05 Hz using repeated squat-stands in a previous study including 74 participants.
3
In addition, we reanalyzed data so only participants with values at both frequencies were included (n = 15) and our findings were unchanged. Indeed, at ∼0.05 Hz, ΔMCAvT/
In addition, the apparent difference in the rate of change in MAP could be due to differences in finger blood volume dynamics that are measured by the Nexfin device rather than differences in blood pressure in the brain. However, Nexfin’s measurements were calibrated with an arm-cuff measure. Therefore, if recorded MAP changes were only explained by finger blood volume changes, our arm-cuff blood pressure would not have corresponded. Of importance, MAP is comparable to cerebral perfusion pressure in supine position. Also, this study used a double-ratio calculation to quantify directional sensitivity of the cerebral pressure-flow relationship, which has not been validated yet for its ability to reflect cerebral blood flow regulation. This could explain why we have not found the presence of directional sensitivity at ∼0.05 Hz OLBNP. Further research is necessary to examine whether, for example, this metric is influenced by hypercapnia or pathological conditions, such as severe head injury. Importantly, while an attenuated MCAvT/
In this study, some females were either taking oral contraceptives (n = 2) or wearing a vaginal ring (n = 1), and they were all in the days 1–10 of their menstrual cycle. We are not able to determine whether the presence and type of contraceptive method had an influence on the results and further research is needed to address that issue.
Although −90 Torr was the desired target, the small difference between this target and the negative pressure achieved was expected. Indeed, we have often observed such small differences in our pilot work. The −90 Torr target was initially chosen since OLBNP between 0 and −70 Torr induced less clear and comparable MAP and MCAv oscillations (which are needed for our analytical approach) for the complete 6-min periods at both 0.05 Hz and 0.10 Hz. This being acknowledged, the negative pressure achieved (i.e. an average of −83 Torr in the current study) was enough to produce well-defined and comparable MAP and MCAv oscillations. Importantly, the negative pressure reached was similar between each frequency for each subject. However, in some cases (as suggested in Figure 1), maximum and minimum values may be challenging to identify in MAP and MCAv with multiple peaks in each cycle of OLBNP, which could have influenced the accuracy of the calculation of our metric. In those rare cases identified through the initial visual inspection, we made sure the maximum MCAv values were matching the associated maximum MAP values.
Perspectives
Although not entirely novel, these findings are crucial for the broader cerebral autoregulatory field and will help design and inform upcoming studies which will examine the underlying mechanism (s) of the hysteresis-like pattern of the cerebral pressure-flow relationship using pharmacological agents such as sympathetic nervous activity and myogenic activity blockers. Now that evidence of directional sensitivity of the cerebral pressure-flow relationship has been established with the OLBNP model, important follow-up studies need to be designed. Indeed, reproducibility (i.e. within-day, between-day, between-month, etc.) of the directional sensitivity metric using the OLBNP model will have to be examined. It would help determine whether the ΔMCAvT/ΔMAPT metric is reliable over time and increase its applicability in various study designs. Moreover, it would be important to study whether a smaller number of OLBNP oscillations could be used. This would be of great interest to evaluate if some inconsistent data collection could be removed or if OLBNP duration could be reduced to optimize some long-lasting study designs. Also, another important issue for future research would be to compare within-individual ΔMCAvT/ΔMAPT during repeated squat-stands and OLBNP. Indeed, while the findings from the current study using OLBNP are comparable to those obtained with repeated squat-stands, there is a need to evaluate whether both models lead to comparable directional sensitivity metrics to exclude with certainty the possibility that this hysteresis-like pattern in the cerebral pressure-flow relationship is model-dependent. Finally, it will be important that future studies include at least two different frequencies to examine this phenomenon since various findings are observed using different hemodynamic stresses and methodological analyses. This will permit to accumulate knowledge to better understand the physiological mechanisms underlying the directional sensitivity of cerebral pressure-flow relationship. Finally, to our knowledge, no studies have examined the relationship between the cerebral pressure-flow directional sensitivity and dCA quantified using transfer function analysis for instance. We consider the utilization of a multi-metric approach would improve the physiological interpretation of the cerebral pressure-flow relationship.
Conclusion
The findings of the current study support the utilization of the OLBNP model to examine the directional sensitivity of the cerebral pressure-flow relationship. This model offers a safe opportunity to investigate the potential underlying mechanisms of this phenomenon, such as sympathetic nervous activity, with the use of pharmacological blockades. Importantly, this model could also be used in clinical populations for whom extended periods in the standing position is not appropriate, or the cardiovascular demand of repeated squat-stands over several minutes is unsustainable.
Footnotes
Funding
The author(s) disclosed receipt of the following financial support for the research, authorship, and/or publication of this article: This study has been supported by a NSERC Discovery grant award (to P.B.). L.L. is supported by a doctoral training scholarship from the Canadian Institutes of Health Research. MA.R. is supported by a doctoral training scholarship from the Société québécoise d’hypertension artérielle – SQHA.
Declaration of conflicting interests
The author(s) declared no potential conflicts of interest with respect to the research, authorship, and/or publication of this article.
Authors’ contributions
LL and PB conceived and designed research; LL, MAR, SSD and MT performed experiments; LL analyzed data; LL and PB interpreted results of experiments; LL prepared figures; LL and PB drafted manuscript; LL, MAR, MT, SSD, JDS and PB edited and revised manuscript; LL, MAR, SSD, MT, JDS and PB approved final version of manuscript.