
Abstract
Quantifying anatomical and hemodynamical properties of the brain vasculature in vivo is difficult due to limited spatiotemporal resolution neuroimaging, variability between subjects, and bias between acquisition techniques. This work introduces a metabolically inspired vascular synthesis algorithm for creating a digital representation of the cortical blood supply in humans. Spatial organization and segment resistances of a cortical vascular network were generated. Cortical folding and macroscale arterial and venous vessels were reconstructed from anatomical MRI and MR angiography. The remaining network, including ensembles representing the parenchymal capillary bed, were synthesized following a mechanistic principle based on hydrodynamic efficiency of the cortical blood supply. We evaluated the digital model by comparing its simulated values with in vivo healthy human brain measurements of macrovessel blood velocity from phase contrast MRI and capillary bed transit times and bolus arrival times from dynamic susceptibility contrast. We find that measured and simulated values reasonably agree and that relevant neuroimaging observables can be recapitulated in silico. This work provides a basis for describing and testing quantitative aspects of the cerebrovascular circulation that are not directly observable. Future applications of such digital brains include the investigation of the organ-wide effects of simulated vascular and metabolic pathologies.
Introduction
Quantifying anatomical and hemodynamical properties of the cerebral vasculature in vivo is difficult to accomplish at individual and group levels due to compromises in spatial/temporal resolutions and coverage of commonly used MRI or CT methods, constraints due to SNR limits intrinsic to those instruments, and inter- and intra-individual variability. Moreover, the lack of consensus ranges for benchmarking in vivo measurements hinders direct comparison of hemodynamic data across different length scales or between modalities.
We propose to expand the utility of in vivo neuroimaging perfusion measurement techniques by digitally augmenting medical imaging data with synthetic vascular networks and advanced computations of cerebral blood flow. Our approach then enables hemodynamic state prediction across multiple relevant length scales followed by validation with advanced neuroimaging. Hemodynamic modeling requires an anatomically sound and connected representation of the vasculature, which for the brain includes arteries entering and exiting the circle of Willis (CoW), the intricate pial network, penetrating arterioles leading down into the capillary networks embedded in the cortex, and eventually the venous drainage. This daunting task amounts to creating a digital replica of the complete cortical human cerebral circulation. A successful implementation of hemodynamic modeling combined with advanced neuroimaging would markedly advance in vivo characterization of brain vascular abnormalities and potentially increase our ability to diagnose disease and evaluate treatment response.
Our group previously presented a framework for synthesizing digital models of the cortical circulation in mouse with prototypical extensions to the human brain.1,2 In digital mice brains, simulation capabilities included blood flow, pressure, hematocrit distribution, micro perfusion and oxygen exchange.3
–5 Recently, Ii
6
assembled generic arterial and venous circuits by combining images from different subjects, but did not attempt blood flow simulations. Unfortunately, the presence of anastomoses in arterial and venous circuits confounded by extreme prominent gyri and sulci of the human cortex thwart the application of prior vascular synthesis methods.6
–10 To guide the synthesis, we explore a new strategy capable of better capturing the building principle of the human cerebral angiome. We hypothesize that cerebro-circulatory blood distribution aims at hemodynamic efficiency to meet neuronal metabolic demand. We tested this plausible -but not mechanistically proven- hypothesis by creating a digital replica of the human cortical circulation. We refer to our mechanistic methodology guided by hemodynamic efficiency as
In this work, our goal is to create a digital model of the entire cerebro-cortical circulation that recapitulates anatomical and hemodynamic properties extracted from human neuroimaging studies.
This task requires supplementing arteries and veins visible in MR with synthetic blood vessels for the inaccessible portion of the circulation and has the potential to substantially augment interpretation of in vivo neuroimaging studies. Guided by the principle of hydraulic loss minimization,11,12 we reconstruct a digital representation of the cerebral angiome. We then perform hemodynamic state prediction across multiple length scales (arterial tree, simplified microcirculatory closure and venous circulation) and compared predictions with metrics accessible with in vivo neuroimaging. Morphometrics and simulated blood flow in digital brains are compared with anatomical and flow data acquired from in vivo human MRI across multiple length and time scales.
Methods: Human imaging
Subjects
Ten subjects were consented under IRB-approved protocols at either the University of Illinois at Chicago (N = 6; 25–32 years of age) or Oregon Health & Science University (N = 4; 28, 29, 67 and 67 years old) and underwent MRI procedures as detailed below.
Human subject study procedures were approved by Institutional Review Boards (IRB) at the University of Illinois/Chicago (UIC; IRB2022-1431) and Oregon Health & Science University Center (OHSU; IRB23031). Research was conducted in accordance with ethical principles described in the Belmont Report following Good Clinical Practice (GCP) guidelines and applicable local statutory requirements. All subjects were informed of study risks, benefits, and requirements and provided signed written informed consent prior to study procedures.
Static MRI measurements
A three-dimensional time of flight (TOF) pulse sequence was used with the following parameters: repetition time (TR) = 26ms, echo time (TE) = 3.4 ms, NEX = 1, Flip Angle (FA) = 18°, acceleration factor = 2, number of slabs = 4, magnetization transfer = on, matrix size = 512 × 512 × 408, voxel size = (0.39 mm)2 × 0.3 mm, scan time = 30 min on a Siemens 3T scanner. More details on parameters of the image acquisitions are described elsewhere.2,13,14
Dynamic MRI measurements
A two-dimensional phase contrast MRI guided by the NOVA software 15 was used to acquire volumetric blood flow rates in left and right main arterial branches (overall N > 100 individual blood flow measurements: internal carotid artery (ICA), basilar artery (BA), anterior cerebral artery (ACA), middle cerebral artery (MCA) and posterior cerebral arteries (PCA)) as well as in main venous vessels (superior sagittal sinus (SSS) and jugular vein (JV)) in 6 subjects. Two sequential dynamic susceptibility-contrast (DSC) measurements (500 GRE EPI volumes of 27 3.1 mm slices, TR =0.5 s, TE = 19 ms, FA = 20°, multiband factor = 3, (2.5 mm)2 in-plane resolution) spaced by approximately 10 minutes and a 3D MPRAGE T1 -weighted sequence (0.7 mm isotropic voxels) were acquired using a Siemens 7T instrument with a 24 channel receive Nova radiofrequency head coil. After one minute of baseline DSC MRI data collection (120 volumes), gadoteridol (0.033 mmol/kg) was injected into the antecubital vein at 3 mL/s and followed by a 20 mL saline chase.
Static MRI processing
Anatomical MR and blood flow MRA/MRV. MRI of the brain were acquired from young healthy subjects (25–32 years old, N = 6) in multiple sequences including time of flight MRA, MRV, T1 and T2. Main arterial and venous branches were reconstructed from TOF volumes using a vesselness filter 13 centerline extraction 16 and diameter assignment methods. 17 Gross anatomy, including tissue type assignments, cortical folding, and regional parcellations, were reconstructed from three-dimensional T1 – weighted experiments using ANTs. 18 Briefly, T1 – weighted volumes were skull stripped (antsBrainExtraction.sh), denoised (Denoiselmage), and voxelwise tissue class memberships, pial surfaces, and 32 neocortical parcels (aparc + aseg) were derived from FreeSurfer 19 Version 7.2.
Dynamic MRI processing
DSC data were processed using AFNI, ANTs, FreeSurfer and MATLAB. Each DSC run was compiled to NIFTI (dcm2niix), slice-time corrected (3dTshift), motion corrected (3dvolreg), and nonlinearly corrected for EPl-based distortions (3dQwarp, 3dNwarpApply). The average neocortical time course was the target function for a voxelwise Hilbert transform (3dmaskave, 3ddelay 20 ); the result was used to find voxels with the earliest bolus arrival (3dhist, 3dTstat, 3dcalc) which was used to generate an arterial input function (AIF). The AIF was used as a target function to generate a bolus arrival time (BAT) map (3ddelay). BATs were averaged across voxels within each of 32 neocortical parcels for each DSC measurement for each subject (3dmaskave). Each voxel’s time course was shifted according to its BAT and interpolated accordingly. A fast Fourier transform method was used to solve the AIF deconvolution 21 and to derive voxelwise capillary bed mean transit times (MTT).
Computational methods – synthesis of vascular networks
The reconstructed vascular tree was augmented digitally by a synthetic network of small pial vessels including a capillary bed to enforce closure between arterial and venous vessels and to obtain a complete and closed representation of the entire cortical circulation. Figure 1 gives an overview of the three-stage VaSim algorithm. A brief description of each stage follows; further implementation and mathematical details are described in Supplement S1.
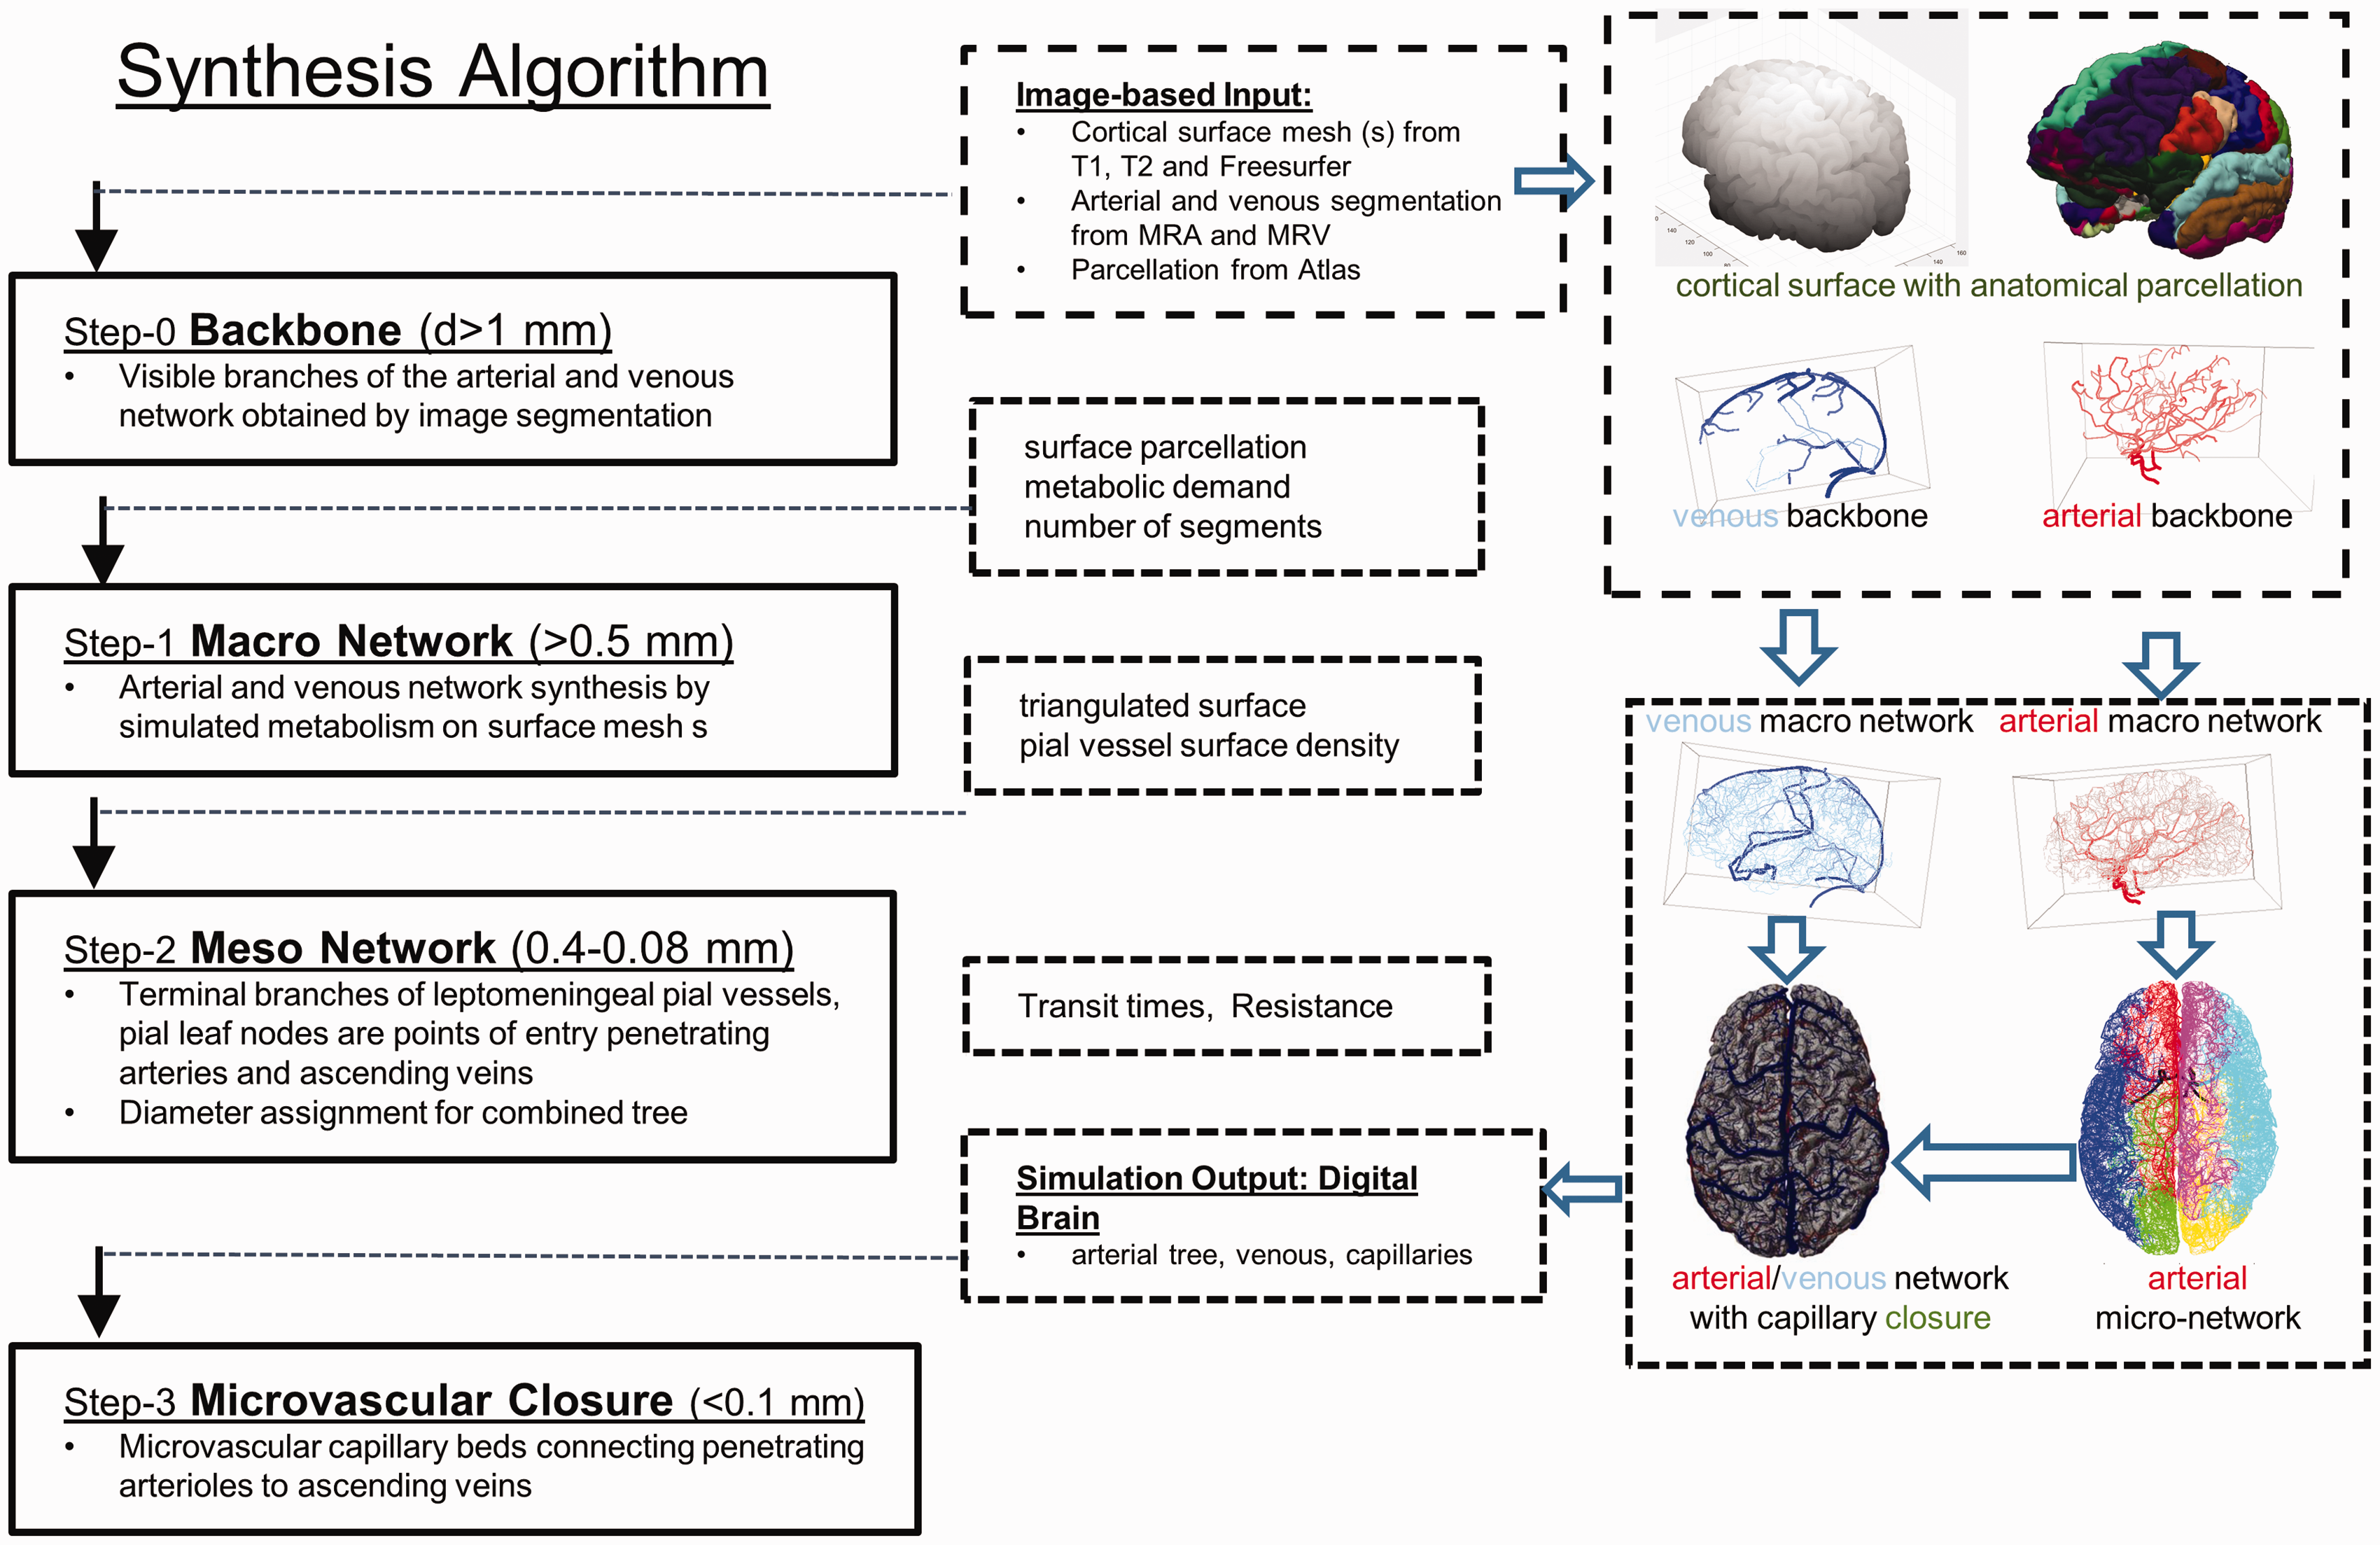
Overview of the metabolically inspired Vascular Synthesis Algorithm (VaSim). (Step-0) A backbone of the visible arterial and venous tree is reconstructed from MRA/MRV neuroimages. A triangulated surface mesh is generated to delineate the cortical surface. (Step-1) Macro Network. Hydraulically optimal paths trace a unique streamline from pial endpoint to the backbone in a virtual heatmap in each step. The network of branches (paths) are assembled into the macro network, which distributes blood from inlets (BA, ICAs) to non-overlapping surface patches. (Step-2) Meso Network. Terminal endpoints are further refined by adding segments in each patch until the desired surface density is reached (arterial: one penetrating arteriole 1PA/mm2; venous ascending veins = 0.5 AV/mm2). (Step-3) Microvascular Closure. Arterial and venous network are closed by connecting each PA to closest AV (d∼3 mm), typically 10–40 connections per PA.
Step-0. Image based input
Main arterial and venous blood vessel centerlines, branching pattern and diameter information reconstructed from static MRA acquisitions were encoded as directed graphs and termed backbone, 2 b. A triangular surface mesh, s, capturing the folding pattern (sulci and gyri) of the cortical surface and a gyrus-based surface parcellation 22 is also used as input to constrain the growth patterns of extraparenchymal vessels to the pia mater which follows the surface of the brain.
Step-1. Macro-tree synthesis
A model for the small diameter portion of the pial circulatory network (not resolvable using routine in vivo MRI) was generated in silico. The VaSim algorithm consists of the sequential addition of minimum resistance paths from a pial terminal node (sink) to an existing vascular backbone segment (source) in a virtual hydraulic pressure potential map (=heat map, see also Fig S1 in Supplement S1). Because infinitely many connections exist between any two points on a contiguous surface, we selected the unique path of least resistance by streamline tracing. Streamlines in the proposed heat map delineate the hydraulically most efficient (=minimum energy dissipation) pathway for drawing fresh blood supply from the closest upstream blood vessel to the arbitrarily chosen pial terminal node position with hemodynamic demand equal to a known local CBF. Pressure potentials and the desired unique streamline 10 from sink to source can be readily found by solving a stationary diffusion equation with (metabolic) reactions. These metabolic/reactive sink terms explain our naming of a metabolically inspired algorithm, whose implementation is conceptually given in Supplement S1. In the mathematical implementation of the proposed heat map, the triangulated surface is treated as continuous permeable medium; following the earlier conductive plate model proposed by Gould. 23 The algorithm is computationally extremely efficient because heat map updates needed at each step are generated using linear algebra, which can be executed with sparse iterative matrix operations;2,3,5,24 streamline calculations merely label surface segments as assigned (vascular segment, low resistance) or unassigned (extravascular, high “tissue” resistance) without the need for simultaneous combinatorial optimization of segment courses and tree volume required in constrained constructive optimization (CCO). 7
Initially, the vascular graph contains only the backbone (b of step-0). Newly generated vascular branches may attach to segments of the original backbone or to previously generated branches. Synthesized vessels are not straight but are allowed to align with the curvature of the gyrated cortical surface. New segments are added until all terminal nodes are covered (see Supplement S1 Fig S1). The algorithm is complete when the carrying capacity of the macro network composed of the backbone augmented by artificially added segments satisfies the blood demand (local CBF in mL/min/100 g tissue) in all cortical regions of the brain. Figure 1-right shows that the arborization of the macro network, m, resembles anatomical structures of the human angiome.
Step-2. Synthesis of the meso-scale circulatory network
We modified the previously developed image based cerebrovascular network synthesis (iCNS) methodology1,3 to generate meso-scale networks, n, that convey blood from pial terminals (=endpoints of macro network, m, of step-1) to small penetrating arteries (PA), which in turn will feed into the subpial microcirculation of small cortical regions (=parcels). In a final step, vessel diameters are assigned simultaneously for both macro- and meso-scale by the balanced network approach together with Murray’s law as described elsewhere.1,3,4 More implementation details are given in Supplement S2.
Step 3. Microvascular closure
After completing steps 1–2, the terminal branches of the arterial and the venous networks (b + m + n networks) are the points of entry for individual parenchymal penetrating arterioles (PA) and ascending veins (AV), respectively. A study of anatomically detailed microvascular closures in Hartung 3 revealed a local one-to-many connectivity pattern between PAs and AVs. Accordingly, we chose a simplified microvascular closure according to which a single PA was connected to all AVs in a local neighborhood (d∼2–3 mm). The proposed one-to-many closure led to a contiguous, highly anastomotic microvascular bed bridging the arterial to the venous side of the model. The effective hemodynamic properties of the capillary closure were set to achieve realistic pressure drops and capillary transit times, see Table 1. Modeling choices for the capillary bed were verified by comparing flow simulations with DSC-MRI. More implementation details are given in Supplement S3.
Overview of VaSim synthesis parameters.
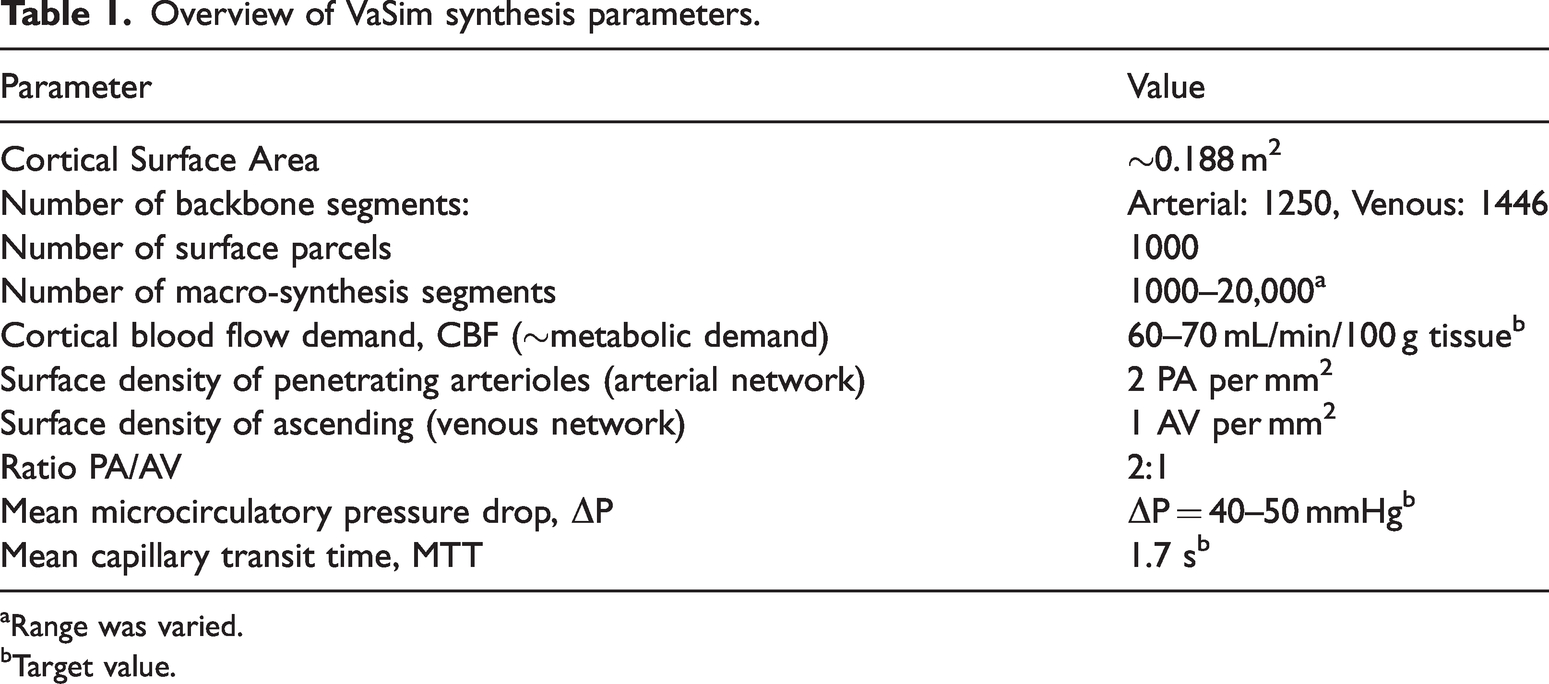
Range was varied.
Target value.
Hemodynamic simulations and validation
Hemodynamic simulations over the entire digital brain were compared to in vivo quantitative flow maps in our research subjects. We simulated tracer passage using dynamic convection equations to generate virtual perfusion images (CT, MR or DSA) images. We compared stationary and dynamic predictions to data acquired with Cine MRI (NOVA, N = 6) and DSC MRI perfusion imaging (BAT, MTT, CBF and CBV for the entire brain, N = 4).
Results
Digital replica of a human cortical circuitry using a metabolically inspired synthesis
The metabolically inspired algorithm (vascular synthesis by
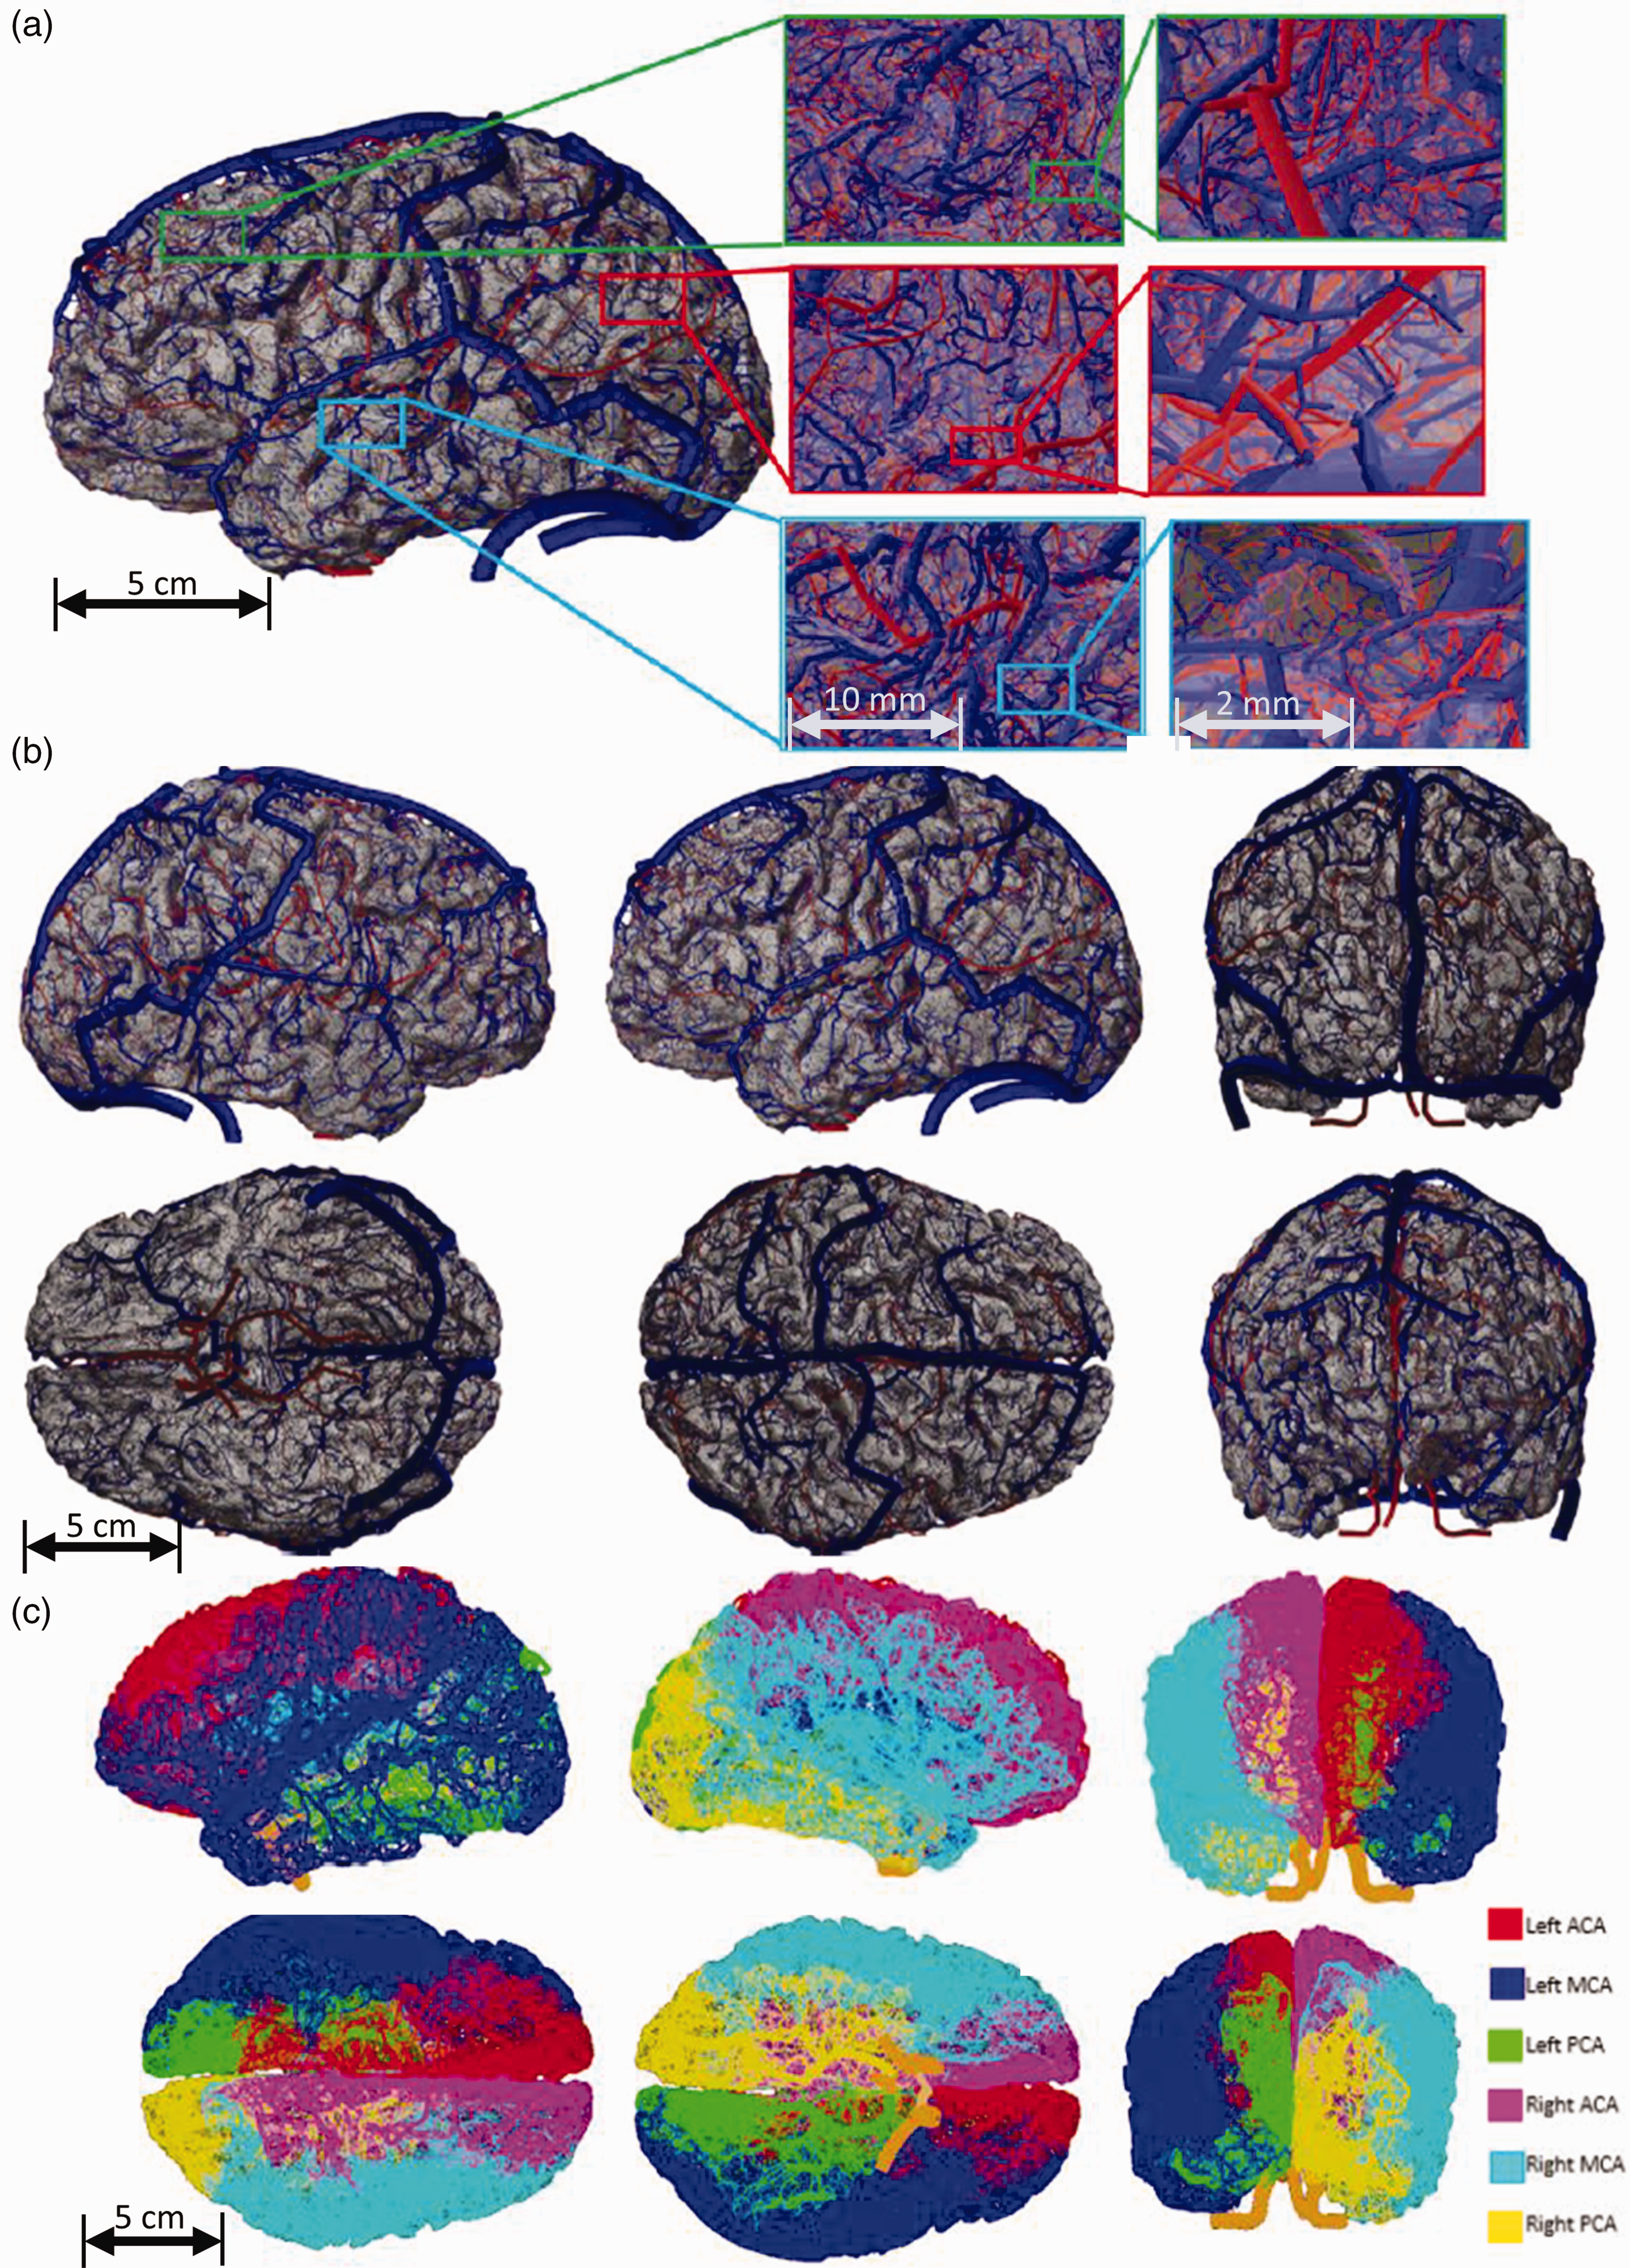
Anatomical view of the synthetic vascular network of a human subject S58. (a) Gross view of the synthesized cortical circulation: arterial (red), venous (blue) network, gyrated cortical surface mesh (gray). The arterial and venous side are fully connected through a simplified microvascular bed (capillaries not shown for clarity). Inlays show pial network in three levels of magnification. (b) Coronal, sagittal anterior posterior views of the synthetic brain and (c) Color coded arterial territories (ACA, MCA and PCA) whose surface partition emerged naturally by following streamlines to the hydraulically most efficient backbone connection.
Gross anatomy
A visual representation of the digitally enhanced angiome for a normal subject (S58) is depicted in Figure 2(a). To demonstrate the versatility of the methodology, a second synthetic brain generated for another volunteer (S64) is depicted in Fig S4 of Supplement S4. Qualitative visual inspection of the digital brain shows similarities in shape, distribution and course of arterial and venous vessels when compared to anatomical brain atlases.25 –27 Branches of the internal carotid and basal arterial, the circle of Willis and principal segments of the ACA A1, MCA M1 and PCA P1 precisely match the subject-specific data MR reconstructions (S58). Mesoscale pial vessels follow the gyrencephalated cortical surface, but with much higher spatial resolution of small branches than can be obtained by advanced medical images. 28 The spatial distribution of the main vascular territories ACA, MCA, PCA in both hemispheres is determined according to the minimum hydraulic dissipation principle without input from anatomical atlas data.
Configurations of fine pial surface vessels resemble photographic images obtained with brain perfusion casting methods. 29 Key anatomical properties of the digital brain listed in Table 2 and derived from hemodynamic principles also agree with anatomical data in the literature13,15,17,21,25,29 –35 including diameter distributions and cortical surface area. Surface distribution and density of penetrating arteries and ascending veins, such as their 2:1 PA/AV ratio, are within physiological ranges.30,31
Comparative table of anatomical and hemodynamic data.
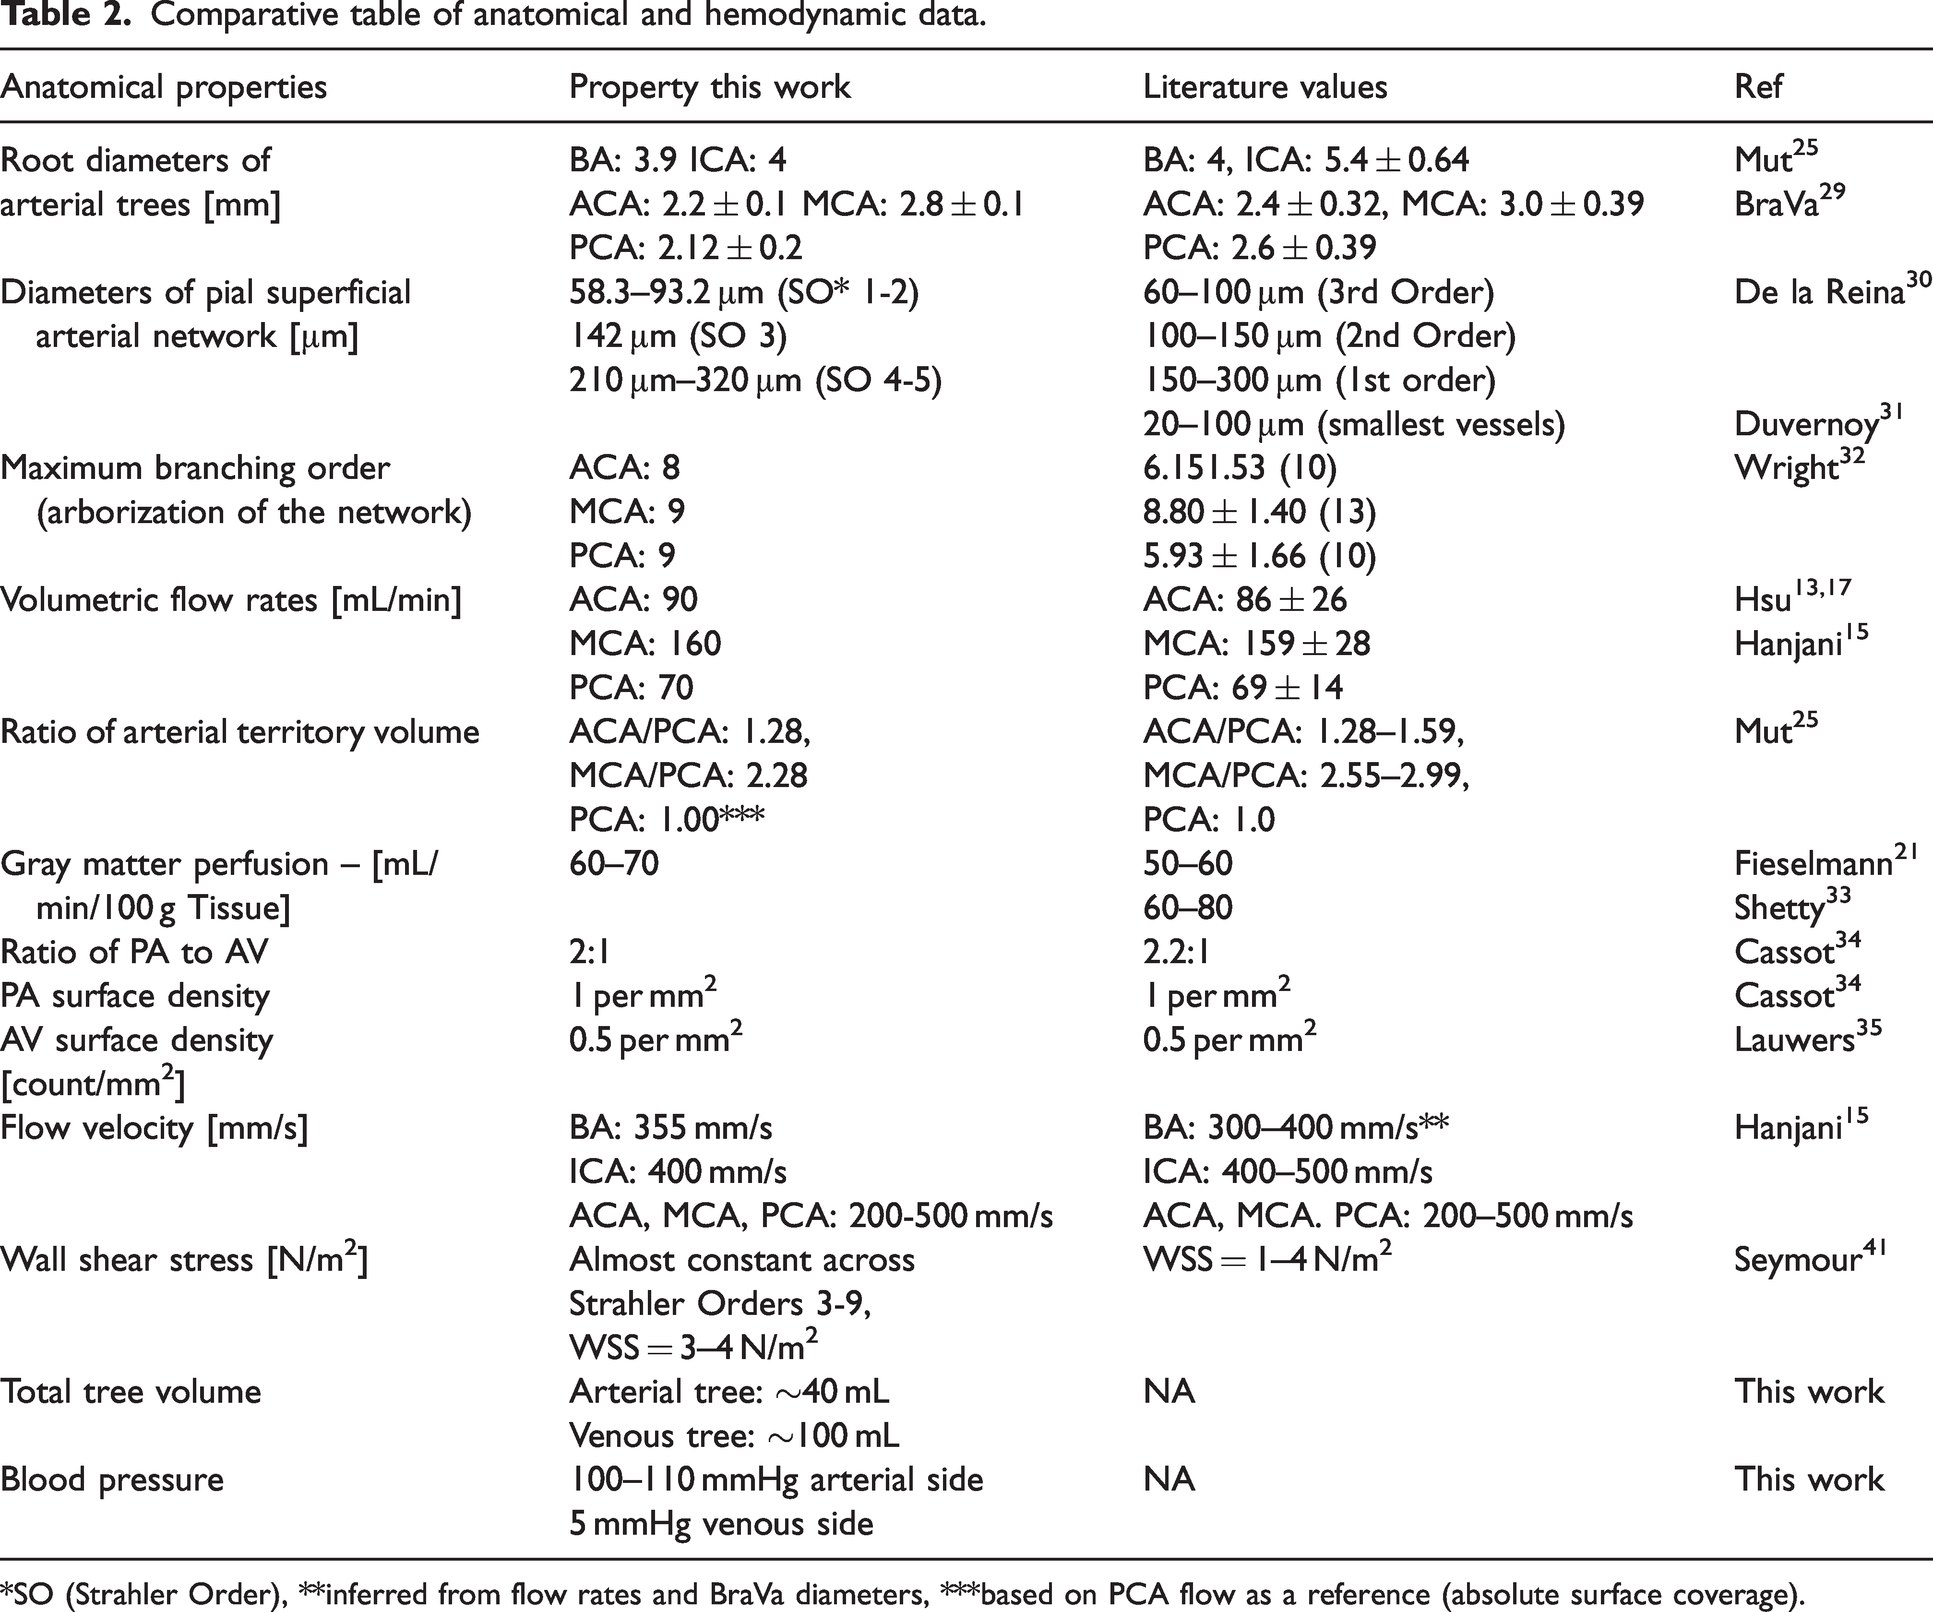
*SO (Strahler Order), **inferred from flow rates and BraVa diameters, ***based on PCA flow as a reference (absolute surface coverage).
Verification of hemodynamic properties with in vivo imaging
Blood flow in the digital cortical circulation spanning arteries, capillary bed and venous drainage was simulated using a commonly used averaged flow model (Hagen Poiseuille) in cylindrical vessels with diameter dependent viscosity.2,4,10,23,36
–40 The flow-pressure relations, 
Macroscopic blood flow (phase contrast, PC, MRI)
The agreement of modeled metrics with in vivo measurements of bulk volumetric flow rates in large vessels are illustrated in Figure 3(a). The means of measured bulk flows in BA and right and left ICA, MCA, PCA, and ACA were not significantly different from those reported by Hanjani, 15 t(8) = 0.58, p = .57, where t() refers to t-statistic value with degrees of freedom in parentheses; these values are in qualitative agreement with simulated values in these same vessels.
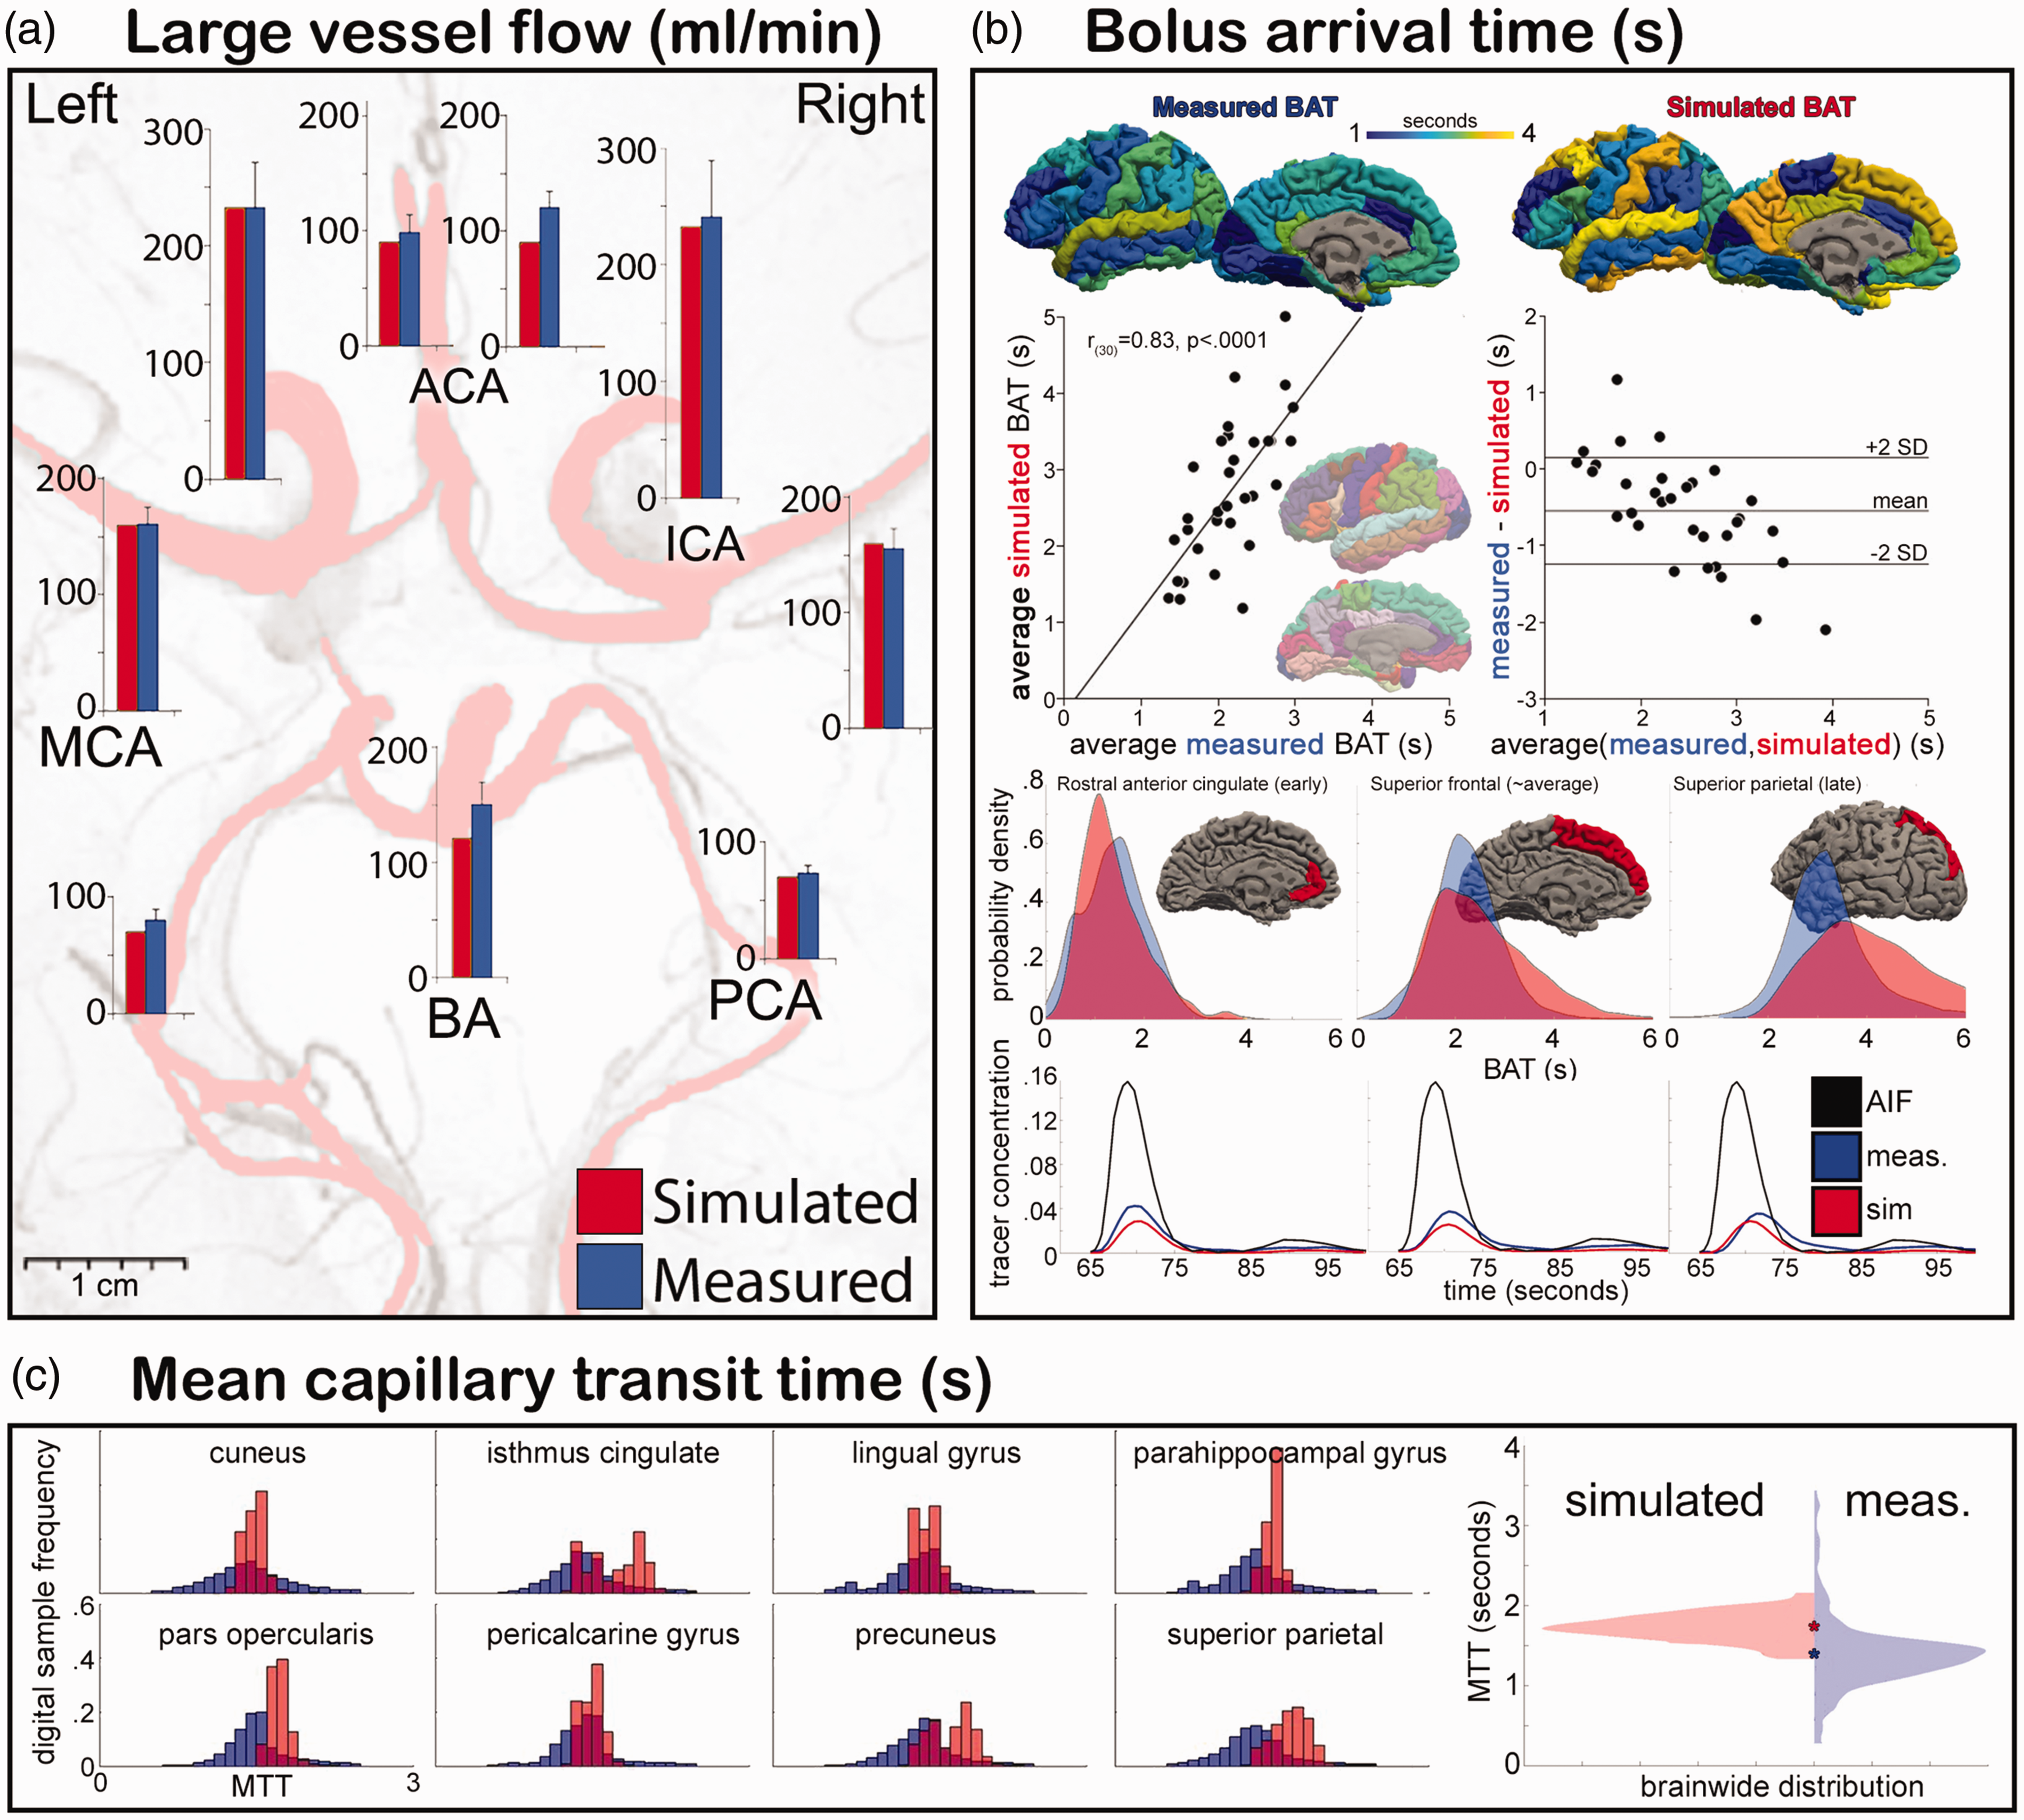
Comparison of in vivo measurements with derived in silico metrics. (a) Simulated and measured (phase contrast MRI) flow rates in large cerebral feeding arteries. (b) Top. In vivo DSC-MRI-derived bolus arrival times (left) and simulated accumulated residence times (right) measured in gyral parcels. Middle top. Measured and simulated values are significantly correlated (left) and in good agreement (Bland-Altman, right). Middle bottom. Probability density functions estimated from measured (blue) and simulated (red) distributions in three selected regions with early (anterior cingulate), middle (superior frontal gyrus) and late (superior parietal) tree traversal times. Bottom. Dynamic traces of bolus passage measured from a large feeding artery (arterial input function, “AIF”), averaged over the three regions above (blue), and simulated (red) and (c) Frequency histograms of capillary bed traversal times over all samples in each of eight selected regions derived from DSC-MRI (blue) and simulated (red). Whole brain distributions are shown in violin plots on the right, medians are marked with corresponding “*”.
Perfusion metrics
Predicted blood flows,
Bolus arrival times, BAT
Bolus arrival times calculated from DSC MRI were correlated across 32 regions of the cortex 22 with simulated accumulated residence times (r(30) = .83, p < .0001, Figure 3(b)) and were in moderate agreement (Bland-Altman, Figure 3(b), 28% of difference scores lay beyond ±2 standard deviations from the mean). Three selected regions are shown in Figure 3(b) to qualitatively assess the correlation of the tracer passage, averaged over samples in that region (e.g. rostral anterior cingulate), in both simulated (from the measured AIF at the MCA) and measured data. As is shown, the time course of the first bolus pass through the region matches that of the simulated time course. Almost equal arrival times suggest that blood delivery to all penetrating arterioles entering the microvasculature have correct timing, since BAT is directly related to the local blood flow from the main arterial segment exiting the CoW to the PAs. It also provides indirect verification that the upstream blood lumina in all branches of the synthetic arterial tree, or more precisely that the ratio of cumulative blood volumes over local blood flow, is sound. The spatiotemporal agreements hold simultaneously in all anatomical regions.
Mean Transit Times, MTT
Mean transit time (MTT) was chosen as the metric by which correlations between capillary-level simulated and measured metrics are compared. While MTT was not regionally correlated between simulated and measured values (not shown), some regions displayed moderate agreement (Figure 3(c), left). Brainwide simulated MTT was longer than measured MTT (t(493598) = 59.2, p < .0001, means =1.71 s and 1.51 s, respectively. t() refers to t-statistic value with degrees of freedom in parenthesis). Qualitatively, it was noted that the distribution of simulated MTT is significantly leptokurtic with remarkably smaller variance in comparison to measured MTT in the parenchymal neocortex (K = 24.0 vs. 15.5, respectively).
Strahler analysis of the cortical vasculature
Anatomical and hemodynamic properties of the whole arterial tree of digital brain (backbone, macro and meso networks) as a function of Strahler order are found in Figure 4(a) to (c). Each vascular territory connected its main arterial branch (A1, M1, P1) to the smallest pial vessel (i.e. entry points of penetrating arterial vessels) in no more than 11 Strahler orders. Diameter spectra, Figure 4(b1), were found to conform to Strahler Horton’s law with slope of m = 0.190 (R2 = 0.99). The strong correlation of Strahler order and diameter ranges can be used to interpret physical properties predictions also in terms of diameter ranges. A correlation and key between Strahler order and non-overlapping diameter ranges is provided in Table S5 of Supplement S5. Length spectra, Figure 4(b2), showed a maximum because thickest segments are often intersected by thin side-branches, which is consistent with clinical observations and in agreement with earlier work by Mut. 25 The element number spectra, Figure 4(b3), showed two regimes with slightly different slopes around order 5.
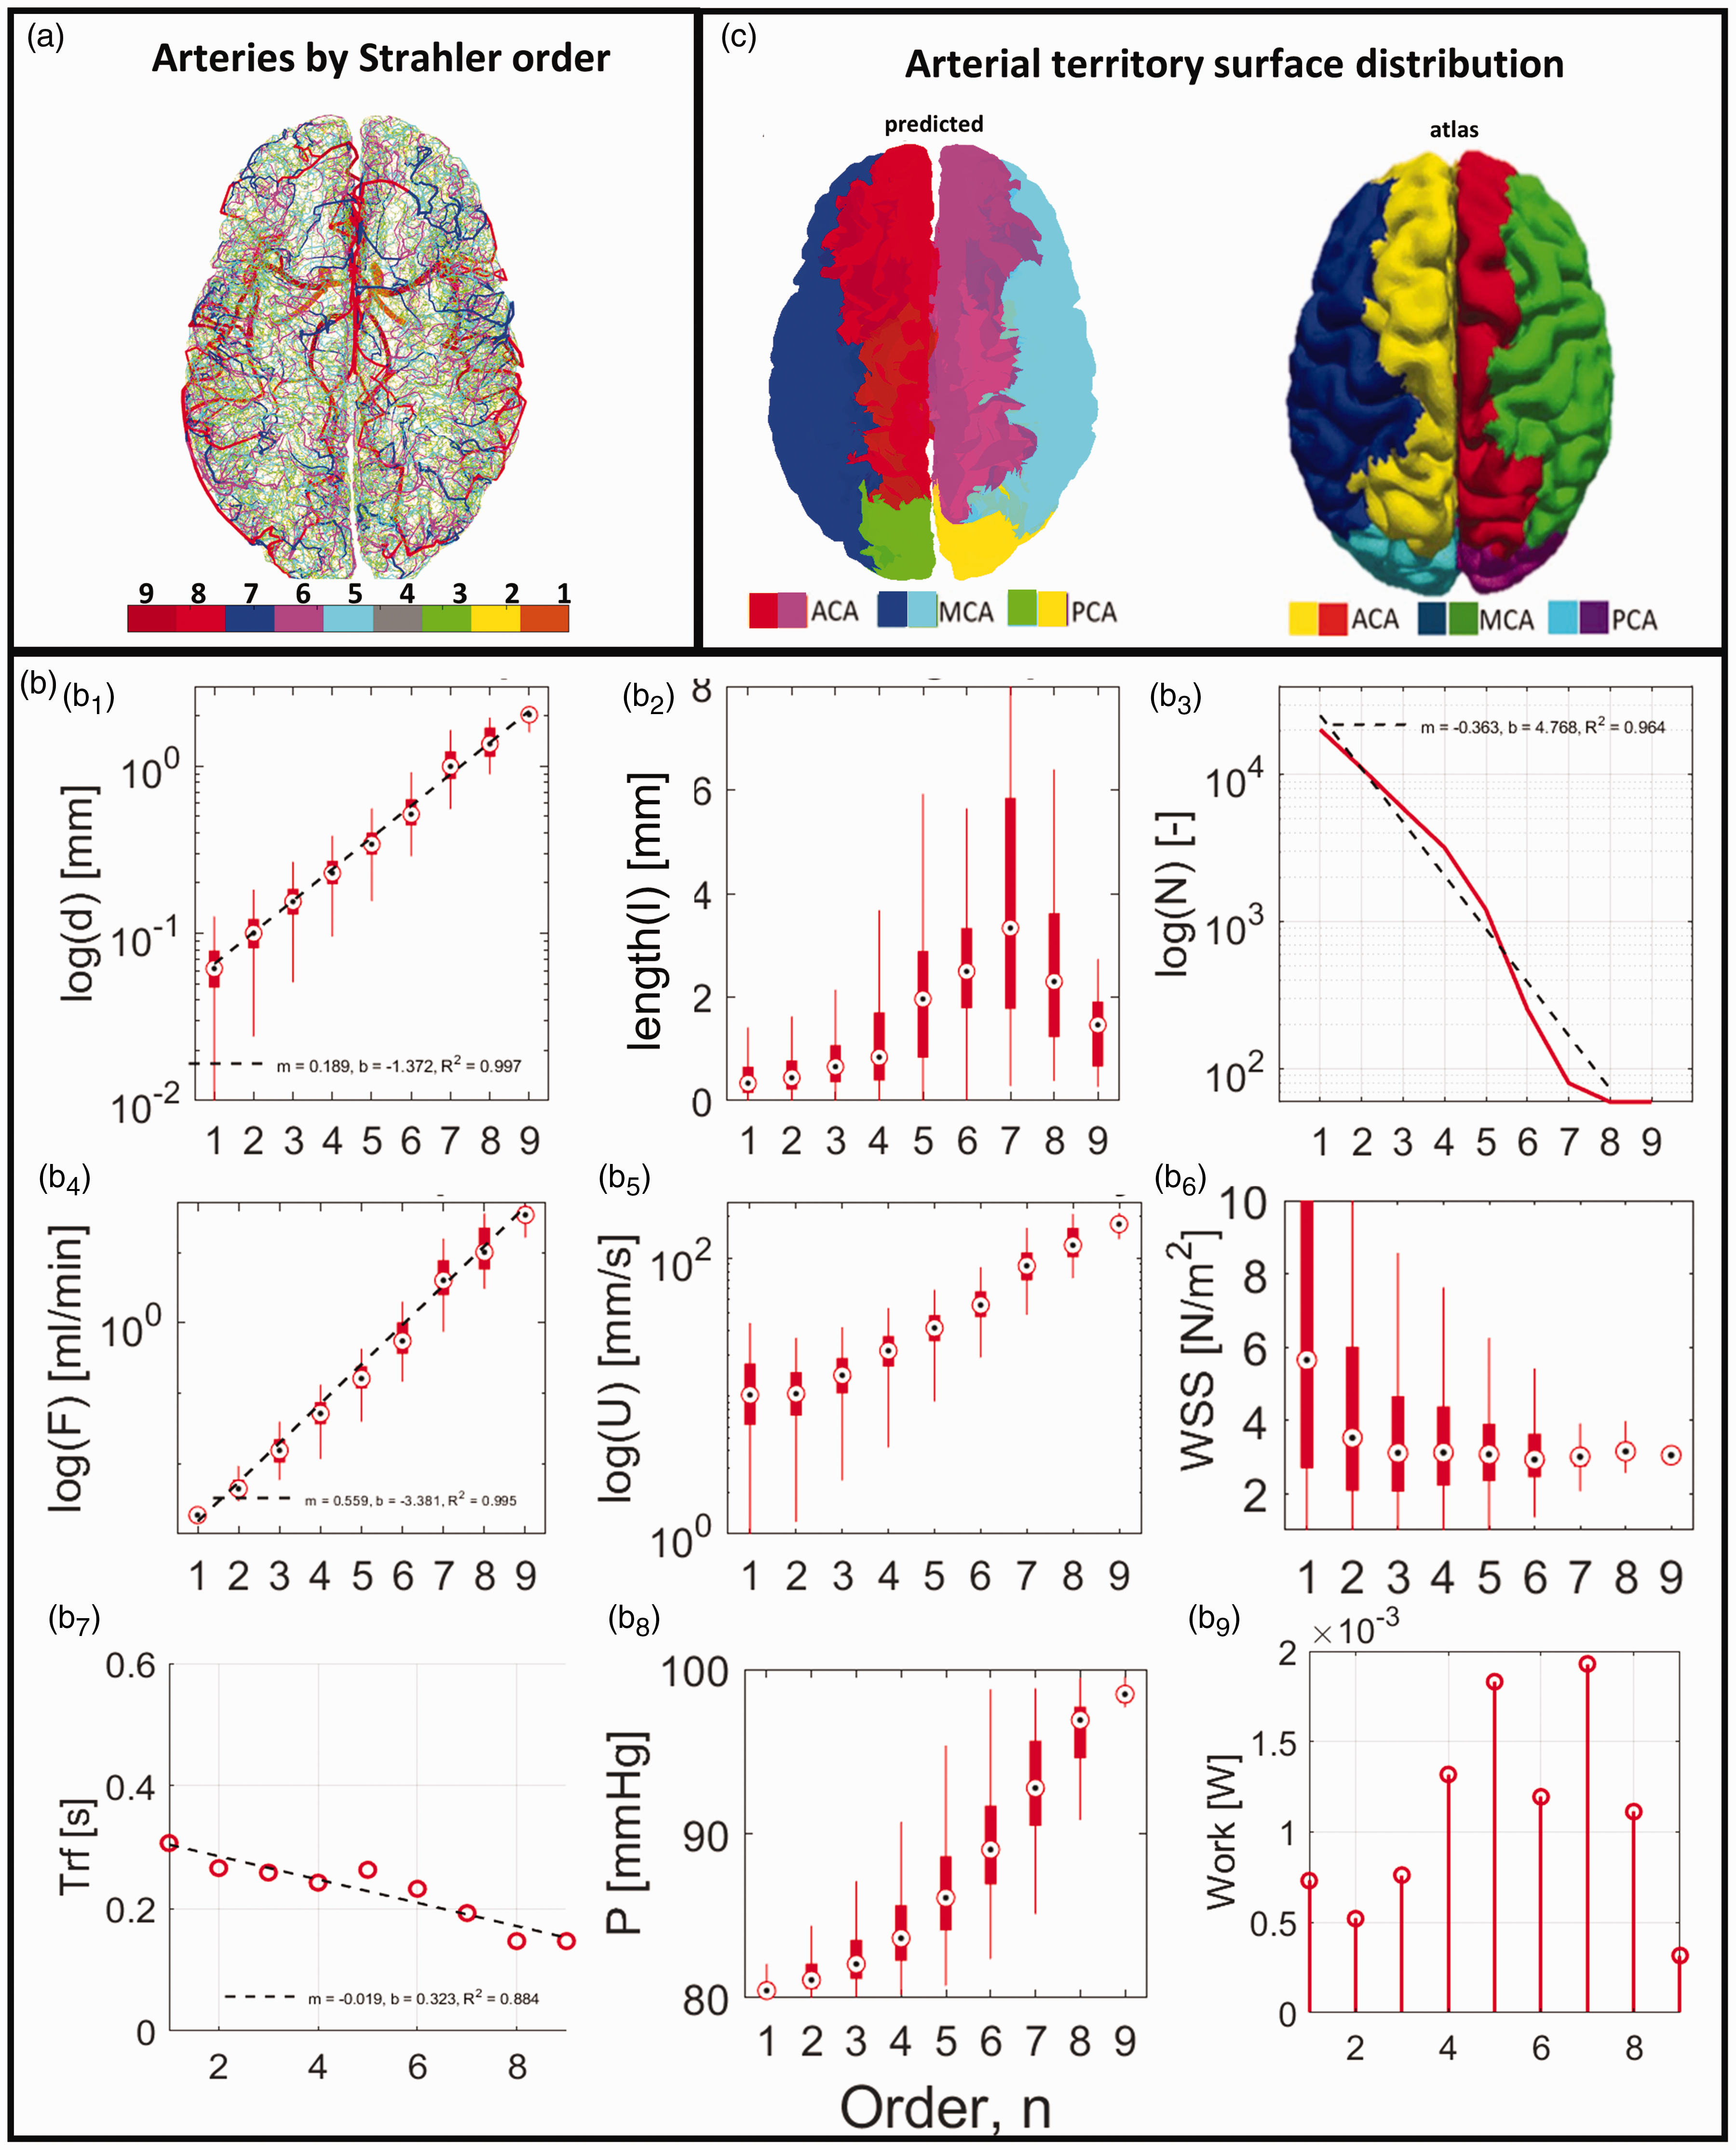
Hierarchical Strahler Analysis of morphometric and hemodynamic properties of the arterial network. (a) Color coded display of Strahler Order for the entire arterial tree (backbone, macro and meso networks, steps 0, 1, 2). No more than 10 orders are needed from the main arterial segment (A1, M1, P1) to the smallest pial surface vessels. Properties can also be keyed in terms of diameters, see Supplement S5. Anatomical properties (b1–b3): (b1) Arterial diameter spectra follow Horton Strahler law with slope m = 0.190 (R2 = 0.99). (b2) Length spectra have a maximum in order 7. (b3) Log (N) Element number is close to linear (m = −0.363, R2 = 0.964). Hemodynamic properties (b4- b9): (b4) Log (f) blood flow spectra are close to linear, m = 0.556, R2 = 0.995 (b5) Average blood flow velocity log(U) = f/A. (b6) Wall shear stress
Specific properties including blood flow, velocity, pressure, wall shear stress (WSS) and aggregated properties: residence time and energy dissipation (loss) as a function of Strahler Order can be found in Figure 4(b4-9). Blood pressure, Figure 4(b8) and velocity, Figure 4(b5) decrease monotonically in flow direction as expected. Wall shear stresses are almost constant across Strahler Orders 3–9, with predicted WSS values in thick vessels comparable to values of 1–4 N/m2 obtained in prior imaging studies.
41
At Strahler order 1, mean and variance of WSS are influenced by boundary effects associated with the microvascular cutoff. Residence time, defined as segment volume over blood flow, is predicted to exhibit a linearly increasing trend in flow direction. For example, the total transit time in the smallest pial vessels of Strahler Order = 1 was t = 0.35s. The total hydraulic loss (=aggregated loss summed over all vessels of a category), defined as the product of resistance and squared flow,
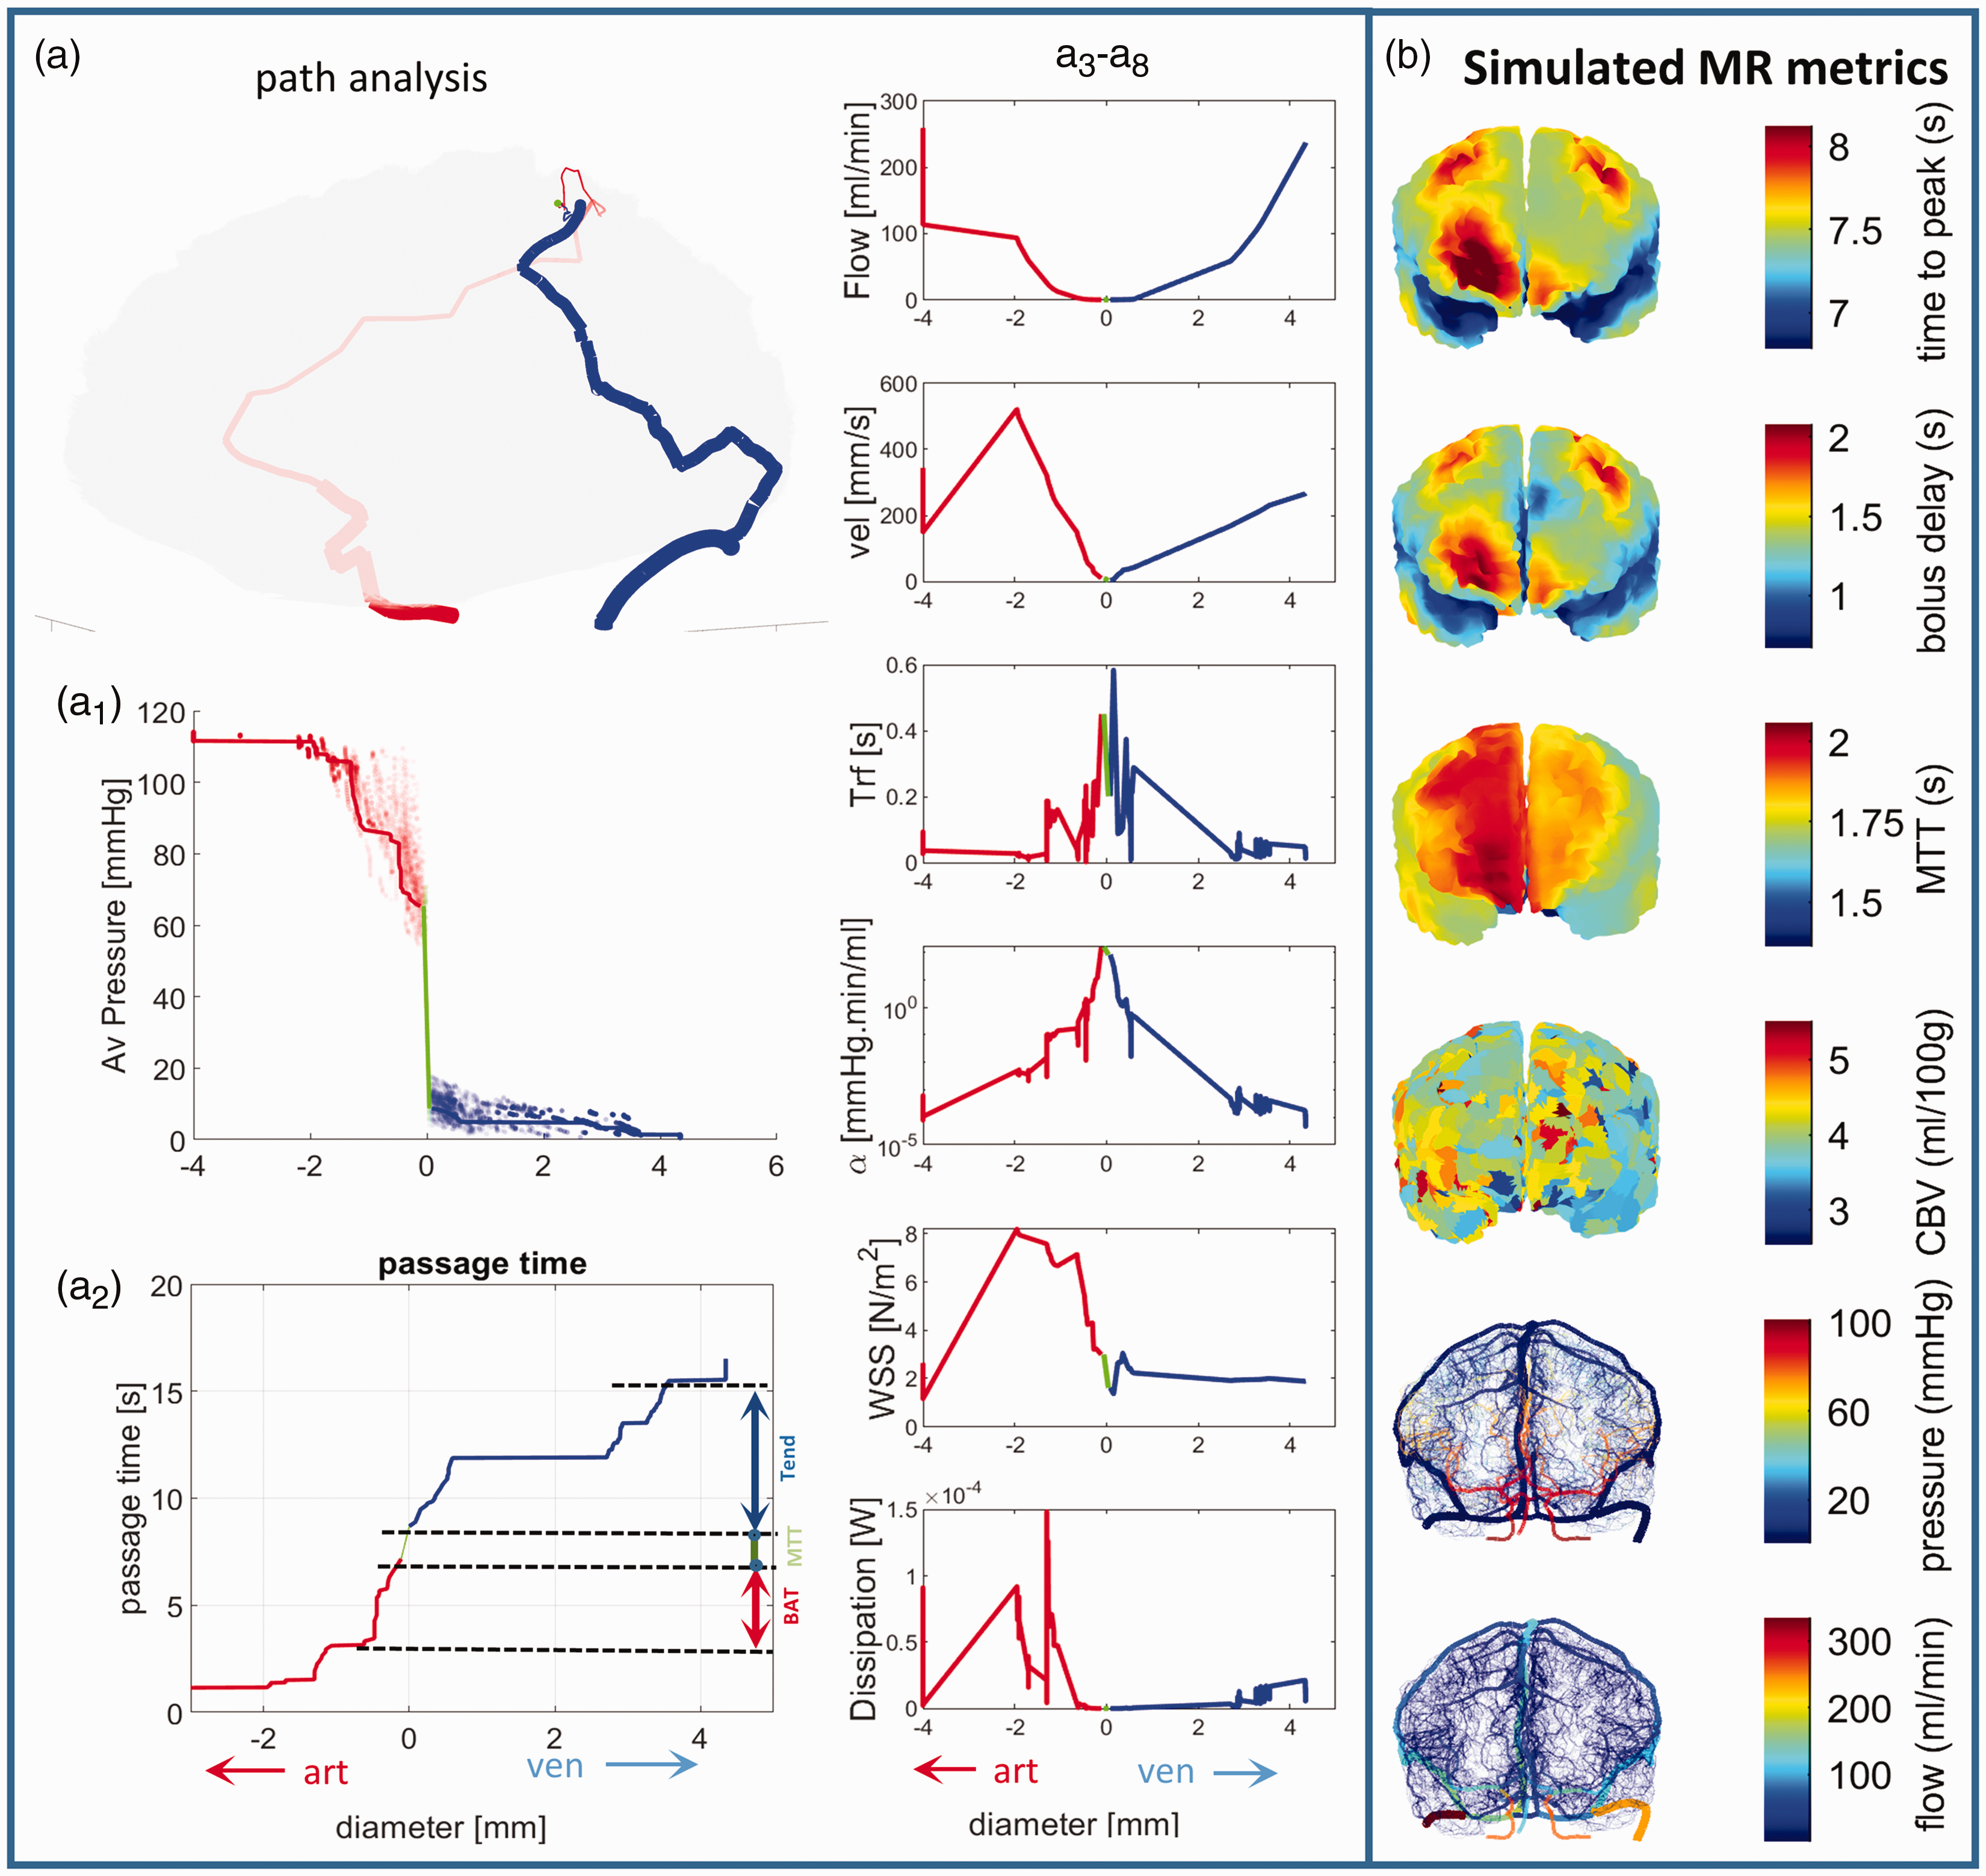
Hemodynamic simulation results for the entire cortical circulation. (a) Brain wide path analysis. (a1) Pressure drops for flow paths (streamlines) connecting arterial to venous side. A single path is given as solid line, x-axis shows arterial diameters with a negative value, positive values are for venous diameters and 0 delineates the small diameters of the capillary closure. More than 5000 paths depicted only as shaded scatters show a clear separation of arterial (red) and venous (blue) pressure and average microvascular pressure drop of 40-60 mmHg (green). (a2) Passage time of a virtual bolus injected in the circulation. (a3) Blood flow, (a4) average velocity, (a5) Segment residence time Trf = segment volume/segment flow = V/f (a6) Segment resistance,
Vascular territories of major cerebral arteries
We discovered that the principle of paths with least resistance naturally generates optimal partitions across the cerebrovascular tree for arterial blood distribution from the main arteries (ACA, MCA and PCA) as shown in Figure 2-bottom row. Moreover, Figure 4(c) depicts synthesized vascular territories, which exhibit striking similarity to an image based on atlas data. 39 The partitions emerged from the application of the minimum hydraulic resistance principle alone without any guidance from atlas data except for the given backbone on the cortical surface mesh. Fractional brain surface coverage of the main territories are compared to literature values in Table 2.
Hemodynamic properties along vascular paths
The total number of separate routes along the arterial to the venous side through the capillary bed in our digital angiome exceeds 10,000,000 distinct paths, a staggering number that cannot well be represented in a single illustration. We displayed typical trends in select streamline paths representative of the entire ensemble; for example, Figure 5(a) shows one trajectory of an ACA path. One blood pressure trajectory from the arterial to the venous network is depicted in Figure 5(a1) as a solid line, with arterial and venous diameters along the path encoded on the negative and positive branches of the abscissa respectively. More than 5000 paths superimposed as scatter shading show a clear hierarchical separation of arterial and venous pressures with fairly even capillary pressure drop in the range of 40–60 mmHg (green).
Flow and velocity, Figure 5(a3-4), along a single vascular path matched trends previously seen for hierarchical analysis according to Strahler orders. Flow drops and rises monotonically in each path. Of note, passage through anterior and posterior communicating arteries in the CoW may introduce discontinuities in the blood flow velocities. We also found that segment resistances,
Simulated perfusion imaging –- virtual MR, CT or DSA
We modelled the dynamic passage of a non-diffusible tracer such as gadoteridol (see methods section). The purely convective solute dispersion model in equation (2) predicts the temporal evolution of tracer concentration 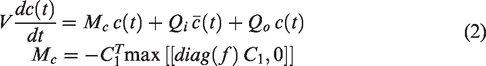
Raw tracer concentration over time was simulated by using AIFs extracted from DSC MRI measurements. A typical simulated raw signal for AIF and cortical microcirculatory voxel or volume of interest (VOI) is shown in Figure 3(b). Virtual simulation of tracer passage shown in the sample results of Figure 5(b) can predict key MR perfusion parameters, T0 (BAT), TMAX, MTT and CBV for the entire cortical surface. As shown in the verification section with results in Figure 3(b), timing of rise, peak and decline of tracer intensity curves agree, except that simulated signals do not contain acquisition artifacts.
Supplement S7 also shows real time movies of a simulated DSA image acquisition, which compares qualitatively to tracer dynamics in clinical endovascular procedures.
Discussion
We introduced a metabolically inspired synthesis algorithm (VaSim) for creating a digital representation of the cortical blood supply in human brains. Spatial layout, connectivity and segment resistances (in terms of diameter and length spectra) of a digitally enhanced cortical angiome could be synthetically generated by following a mechanistic construction principle of hemodynamic efficiency. The observed morphometric and hemodynamic similarity between the human cortical circulation and its digital analog supports our hypothesis that the cerebral vasculature optimally balances metabolic demand with hydraulic loss. Moreover, the surface distribution of fresh blood supply, clinically referred to as arterial territories, could be inferred by conforming to minimal energy dissipation (=loss of pressure head) without input from anatomical atlases.
Our observation that hemodynamic efficiency may be an active construction principle rests on two facts: (i) Streamlines in the virtual pressure map track the direction of steepest descent, thus each branch addition follows the path of least resistance and is therefore hydraulically optimal. (ii) Arterial territories emerged naturally from least resistance segment addition which carved out watershed boundaries from dynamically updated heat maps. The mechanistic argument for hemodynamic efficiency of the vascular networks does not imply global optimality, since multiple realizations of “efficient” networks can emerge depending on random sample order, while a strictly globally optimal solution in the purely mathematical sense would have to be unique. Theoretical foundations for optimal transport in networks (e.g. Tellegen’s theorem) can be found elsewhere.11,12
Every synthesis run (steps-1 and 2) produces different network realizations depending on order and position of new terminal points. However, the initial heat map is independent of the later random processes, so that pressure gradients that exist around the backbone remain fairly constant in the beginning as shown in Supplement Fig S1. The relative stability of initial pressure landscape tends to impart on the macro network layout a degree of robustness against large changes due to random seed selection. In our experiments, randomness in location and seed point order was observed to act on the orientation and length of thicker vascular branches at the scale of 5–30 mm. In networks of equal node numbers, these differences do not impact gross (Strahler) morphometrics or hemodynamic parameters metrics significantly. Different macrotree realizations may reflect variations consistent with subject-specific differences in branching patterns seen in human brains. The random element in VaSim synthesis may be exploited systematically for studying the effects of subject-specific differences between individual brains.
This work highlights some new synthesis features. The ability to incorporate cyclic structures is a substantial improvement over prior work on constrained constructive optimization (CCO), 7 which is not able to model anastomotic loops such as the Circle of Willis. VaSim was also able to generate an anatomically sound model of the venous circulation, which contains loops or star-like junctions such as the confluence of the anterior and posterior anastomotic veins with branches of the middle cerebral surface vein. Synthesizing arched tortuous branches on the highly curved cortical surface overcomes the limitation of perfectly straight segments whose geometry merely minimizes tree volumes in planar bifurcation geometries which fails on the undulated human cortex. The proposed graph theoretical implementation is inexpensive, enabling whole brain synthesis and simulation at modest computational cost on a personal computer (Intel Xeon W-2125, 4.00 GHz processor and 256 GB of memory). A digital brain can be built in less than 20 min (see Figure 2); whole brain blood flow simulation takes less than 10 seconds (see Figures 4 and 5), and virtual bolus passage (∼36 s) can be simulated faster than real time (see Figures 2 and 5 and Supplement).
Validation
Simulated quantities of both static and dynamic hemodynamic properties recapitulated values for those same metrics found in the literature and in prospectively collected data from velocity-encoded phase contrast MRI in large feeding arteries and from tracer-based DSC MRI metrics BAT and MTT measured in the parenchymal neocortex. Simulated flows were smaller than measured flows entering the circle of Willis (BA and ICA), because the simulation supplies blood only to the neocortex without accounting for demand in other parenchymal tissues. However, given the dependence of wall shear stress, pressure, and energy loss on bulk flow (Figures 4 and 5), and the inability to provide sensitive and specific measurements of these quantities in vivo as well as the likelihood of clinically significant findings in these vessels (e.g., embolus, aneurysm, rupture) relative to smaller, lower flow vessels of the cerebrovasculature, the convenience of accurately modeled flow with commensurate simulated calculations of these finer metrics in these vessels represents a novel adjuvant to advanced neuroimaging measures.
Additionally, the whole brain simulated vascular model, despite having been synthesized from a gross backbone that included only a small fraction of vessels necessary to complete the perfusion of the neocortical mantle, was able to accurately capture the time needed to traverse the entire arterial tree to each terminus (=point of entry to the penetrating arteriole). The accumulated residence times were quantified explicitly over each vascular segment, typically over 8–11 branch orders, thereby providing convincing evidence of the algorithm’s ability to synthesize a leptomeningeal arterial network that recapitulates the true weighted and directed graph of the human cerebrovascular circulatory network. It is notable that the accumulated residence times reported here resulted from closed network simulations. This demonstrates that an accurate estimate of the time it takes for blood to traverse the pial arterial portion requires that the parenchymal capillary bed and venous network contribute balanced resistance. Finally, the time to traverse the capillary bed was found to be longer in the simulated blocks than the measured and modeled parenchymal tissue blocks. It is possible that in this instance these mean transit times were influenced by the numerous factors that shape measured MRI signals, including partial volume effects, that are certainly present in these measured data which contain 2.5 mm voxels in a cortical ribbon that is no thicker than 4 mm across the entire mantle, and sensitivity of our DSC MRI technique to larger caliber vessels making it likely that venule and arteriole egress and ingress are included in the capillary transit time measurement. In fact, the inclusion of these signals easily explains the relative platykurtosis of the measured MTT data. However, given that the mean difference was on the order of tenths of seconds, and that this difference is found to be well within the bounds of interindividual difference, we predict that a multisubject study with the ability to produce simulations across variables that are known to exert significant influence on capillary bed flow (e.g. age, sex, and blood pressure) will find that the variability in these measurements is of particular interest and not to be dismissed as methodological artifact. We appreciate that mesoscale imaging approaches (e.g. MRI) will always have biases for the reasons discussed above. Given the ubiquity of mesoscale imaging techniques in the clinic, their combination with the VaSim approach offers an important opportunity to augment clinical measures with digital information that has the potential to refine clinical interpretation.
We were able to incorporate in vivo measurements into the digital brain models using the calibration procedure given in Supplement S6. Digital reconstruction of brain wide blood flow patterns enabled spatio-temporal comparison between simulated and neuroimaging data acquired with several MR or CT modalities at different length scales. Such virtual neuroimage acquisitions (MR, CT, DSA) may in the future help establish origin and magnitude of unavoidable imaging errors such as partial volume effects, bolus delay, undesired arterial/venous/microvascular signal overlap, limited resolution and physical uncertainty sources (magnetization, projection errors) affecting the signal to noise ratio. Some of these biases are apparent in Figure 3. One such example is a more disperse MTT histogram for in vivo measurement compared to simulation, discussed above. A full simulation of the MRI signal, as was demonstrated by Gagnon 42 and Damseh 43 could help elucidate this question in a future study. These multiscale mathematical models may also be useful for in silico sequence optimization or assessing necessary hardware requirements (spatial or temporal resolution, SNR) and to augment clinical measurement to detect microscopic vascular defects such as micro-strokes or capillary stalling believed to occur in aging. 44
The mathematical modeling framework presented here establishes a mechanistic basis for integrating hemodynamic simulations with rigorous prediction of neuroimaging signals expected in vivo, and as such is able to directly predict the effects of anatomical abnormalities or neuropathologies on flow and perfusion, but also indirectly quantify the impact and severity of hemodynamic changes on observables such as bolus passage times, transit time and heterogeneity 45 in MR or CT. Other modalities such as time course of intra-arterial tracers used in acute neurovascular intensive care (i.e. digital subtraction angiography, DSA) can be easily replicated as shown in Supplement S7. Correspondence between in vivo and virtual acquisitions (MR, CT, DSA) will aide in consolidating benchmarks demarcating healthy against abnormal flow/perfusion ranges (such as T0, MTT, TMAX, CBF, CBV). 46
Future directions
Anatomically sound models of leptomeningeal blood supply networks presented here could further improve coupling of blood flow and perfusion models (for example the conductive plate coupling by Gould, 47 or recent work by Padmos et al. 39 ). Another exciting next step would be to incorporate micro anatomical network models, for example data by Lorthois et al., 36 into a few regions of interest within the VaSim synthetic networks. Microanatomical capillary beds would extend the rigor of the predictions to the micron level. Execution time of less than 10 CPU seconds for whole brain blood flow and dynamic tracer simulations in real time shows promise that the current approach can be extended to resolving also microvessels with existing computer capabilities.
Limitations
While VaSim is a milestone towards models for the entire cerebral vasculature in humans, it is important to recognize limits associated with the study.
Subject-specificity
Our current approach, although in principle suitable for subject-specific modeling, was tested against averaged observables obtained from subject groups (N = 6 for main vessel blood flow, N = 4 for perfusion imaging). Our choice for averaged data was made because multimodal image data were acquired for different cohorts during multiple imaging sessions. We plan in future steps to acquire anatomy, blood flow and perfusion data for the same subject (ideally in a single session) to test whether subject-specific reconstruction of vascular status for an individual human brain is practical.
Collateralization
We have also generated circulatory models with various degrees of collateral blood vessels straddling the ACA, MCA, PCA vascular territories. In blood flow simulations under normal conditions, collateralization contributed no significant fluxes, thus results reported here did not include collaterals. Our synthesis methodology also does not aim at mimicking angiogenesis.
Boundary effects
Some metrics of the current model show boundary effects due to the incomplete resolution of the capillary bed. For example, a slight dip in the length spectra at the lowest level is an artifact likely due to the horizontal cutoff of pial vessels. Wall shear stress computations at Strahler order 1 experience high variance due to the boundary dependence of terminal segment diameter (a consequence of tree balancing) and should therefore not be considered in further comparisons. These effects are expected to vanish when complete microvascular closures are incorporated, as demonstrated already in mouse models. 3 A practical choice of confining meso-scale synthesis to independent patches kept the computational effort tractable, but it is not a methodological necessity.
Verification of multimodal flow metrics was not done automatically. An interesting path for future work was discussed in Park et al, 2 where observed imaging quantities entered a unique cost function of a distributed parameter estimation problem. This approach would enable rigorous error trade-off48,49 across modalities, length, and time scales as well as more rigorous uncertainty quantification for the entire brain.
Conclusion
We generated a digital representation of the human cortical angiome by combining subject-specific medical image data with a metabolically inspired vascular synthesis algorithm (VaSim). The computer platform unifies neuroimaging data across different length scales and imaging modalities with mechanistic simulations of flow and virtual MRI/CT signals to increase the specificity of neuroimaging of brain vasculature.
The results indicate that hemodynamic simulations of the human cortical blood supply down to individual capillary resolution are feasible with commonly available computer hardware.
The validated digital brain model has the potential to expand the understanding of the effects of vascular pathology, such as the effects of collateralization in stroke, or loss of microvascular function due to aging or in Alzheimer’s disease, which can be simulated easily, but are impossible to non-invasively observe directly in vivo. The proposed whole brain simulation models may in the future offer clinical decision support for hemodynamic assessment in real time.
Supplemental Material
sj-pdf-1-jcb-10.1177_0271678X231214840 - Supplemental material for Vascular synthesis based on hemodynamic efficiency principle recapitulates measured cerebral circulation properties in the human brain
Supplemental material, sj-pdf-1-jcb-10.1177_0271678X231214840 for Vascular synthesis based on hemodynamic efficiency principle recapitulates measured cerebral circulation properties in the human brain by Andreas A Linninger, Thomas Ventimiglia, Mohammad Jamshidi, Mathieu Pascal Suisse, Ali Alaraj, Frédéric Lesage, Xin Li, Daniel L Schwartz and William D Rooney in Journal of Cerebral Blood Flow & Metabolism
Supplemental Material
sj-avi-2-jcb-10.1177_0271678X231214840 - Supplemental material for Vascular synthesis based on hemodynamic efficiency principle recapitulates measured cerebral circulation properties in the human brain
Supplemental material, sj-avi-2-jcb-10.1177_0271678X231214840 for Vascular synthesis based on hemodynamic efficiency principle recapitulates measured cerebral circulation properties in the human brain by Andreas A Linninger, Thomas Ventimiglia, Mohammad Jamshidi, Mathieu Pascal Suisse, Ali Alaraj, Frédéric Lesage, Xin Li, Daniel L Schwartz and William D Rooney in Journal of Cerebral Blood Flow & Metabolism
Supplemental Material
sj-avi-3-jcb-10.1177_0271678X231214840 - Supplemental material for Vascular synthesis based on hemodynamic efficiency principle recapitulates measured cerebral circulation properties in the human brain
Supplemental material, sj-avi-3-jcb-10.1177_0271678X231214840 for Vascular synthesis based on hemodynamic efficiency principle recapitulates measured cerebral circulation properties in the human brain by Andreas A Linninger, Thomas Ventimiglia, Mohammad Jamshidi, Mathieu Pascal Suisse, Ali Alaraj, Frédéric Lesage, Xin Li, Daniel L Schwartz and William D Rooney in Journal of Cerebral Blood Flow & Metabolism
Footnotes
Funding
The author(s) disclosed receipt of the following financial support for the research, authorship, and/or publication of this article: Financial support from NIH NIA 1R01AG079894-01, 1R56AG066634-01, and 1U19NS123717-01 is gratefully acknowledged. Infrastructure support at OHSU through NIH 1S10OD021701-01, 1S10OD018224-01, and 1S10RR027694-01 is gratefully acknowledged.
Declaration of conflicting interests
The author(s) declared no potential conflicts of interest with respect to the research, authorship, and/or publication of this article.
Authors’ contributions
All authors have contributed and read the manuscript.
AL: Conceptualization, Imaging, Theory, Software, Supervision, Composition
TV: Theory, Software, Composition
MJ: Data Analysis, Composition
MPS: Data Analysis, Composition
AA: Imaging, Composition
FL: Conceptualization, Supervision, Composition
XL: Imaging, Data Analysis, Theory, Software, Composition
DS: Conceptualization, Imaging, Data Analysis, Theory, Software, Composition
WR: Conceptualization, Imaging, Supervision, Composition
Supplementary material
Supplemental material for this article is available online.
References
Supplementary Material
Please find the following supplemental material available below.
For Open Access articles published under a Creative Commons License, all supplemental material carries the same license as the article it is associated with.
For non-Open Access articles published, all supplemental material carries a non-exclusive license, and permission requests for re-use of supplemental material or any part of supplemental material shall be sent directly to the copyright owner as specified in the copyright notice associated with the article.