
Abstract
Pericytes are the mural cells of the microvascular network that are in close contact with underlying endothelial cells. Endothelial-secreted PDGFB leads to recruitment of pericytes to the vessel wall, but this is disrupted in Pdgfbret/ret mice when the PDGFB retention motif is deleted. This results in severely reduced pericyte coverage on blood vessels. In this study, we investigated vascular abnormalities and hemodynamics in Pdgfbret/ret mice throughout the cerebrovascular network and in different cortical layers by in vivo two-photon microscopy. We confirmed that Pdgfbret/ret mice are severely deficient in pericytes throughout the vascular network, with enlarged brain blood vessels and a reduced number of vessel branches. Red blood cell velocity, linear density, and tube hematocrit were reduced in Pdgfbret/ret mice, which may impair oxygen delivery to the tissue. We also measured intravascular PO2 and found that concentrations were higher in cortical Layer 2/3 in Pdgfbret/ret mice, indicative of reduced blood oxygen extraction. Finally, we found that Pdgfbret/ret mice had a reduced capacity for vasodilation in response to an acetazolamide challenge during functional MRI imaging. Taken together, these results suggest that severe pericyte deficiency can lead to vascular abnormalities and altered cerebral blood flow, reminiscent of pathologies such as arteriovenous malformations.
Introduction
Pericytes are vascular mural cells in close contact with endothelial cells on capillaries. Brain pericytes have essential roles in angiogenesis, 4 maintenance of the blood-brain barrier (BBB), 5 and blood flow control.1,6 Multiple lines of evidence suggest that different types of pericytes exist within distinct microvascular zones,2,3,7–9 and they can be further classified by their morphology,2,8,9 gene expression, 10 and cellular dynamics (in terms of intracellular calcium signaling 11 and contractility3,6,12,13). Ensheathing pericytes enwrap the vessels within 4 branches of the penetrating arteriole and express high levels of the contractile protein α-smooth muscle actin (α-SMA), which facilitates dynamic fluctuations in vessel diameter11–13 and rapid dilation during neurovascular coupling. 3 Debate exists over the nomenclature for this microvascular zone, including “precapillary arterioles”,13,14 “capillaries”,3,15 or the “arteriole-capillary transition region”.9,12 Capillary pericytes have long thin-strand processes and are located in the higher-order capillary bed (≥5 branches from the penetrating arteriole). These pericytes express little to no α-SMA, but they can dilate 11 or contract 16 capillaries, albeit at much slower time-scales than ensheathing pericytes. Venous pericytes have shorter truncated processes compared to capillary pericytes,8,11 no α-SMA expression, 9 and are found within 4 branches of the ascending venule. Such morphological diversity in pericyte types along the arterio-venous axis suggests specialized roles for these cells within the vascular network and within the known functions of pericytes such as regulation of blood flow and BBB integrity.
During aging and in pathologies such as Alzheimer’s disease, diabetic retinopathy and arteriovenous malformations,6,17–23 pericytes potentially degenerate contributing to BBB leakage, changes in vascular structure, and reduced brain blood flow. Several animal models of pericyte deficiency have been generated to recapitulate disease and to study the impact of pericyte loss on the brain vascular network. Mostly, these mouse models have a range of pericyte deficiency and were generated by modifying the platelet-derived growth factor subunit B (PDGFB)/platelet-derived growth factor receptor beta (PDGFRB) signaling axis. The Pdgfbret/ret strain, lacking the retention motif on the PDGFB necessary for the binding of PDGF-BB to the extracellular matrix for optimal presentation to pericytes, shows severe pericyte loss in the brain.24,25 Depending on the anatomical brain region, Pdgfbret/ret mice have up to a ∼75% reduction in pericyte coverage5,24 and enlarged capillaries particularly in the cortex and hippocampus. 26 Several studies have shown that pericyte loss in Pdgfbret/ret mice leads to reduced BBB integrity via increased transcytosis across endothelial cells.5,26 Furthermore, these mice are known to have decreased resting cortical perfusion, 26 but the specifics of hemodynamics and the impact that severe pericyte deficiency has on blood flow has not been determined, particularly in specific microvascular zones where distinct populations of mural cells are known to reside.
The goal of this study was to investigate whether severe pericyte deficiency in Pdgfbret/ret mice influences the structure, hemodynamics, and blood oxygen concentrations in vessels across cortical Layers 1 and 2/3 located in the arteriole-capillary transition region, capillaries, and what we refer to as the capillary-venule transition where venule pericytes are known to reside. We also considered the impact of pericyte-deficiency on cortical cerebrovascular reactivity. Our findings have potential implications for cortical pathological conditions with significant pericyte loss, such as arteriovenous malformations.
Materials and methods
Mice
Male and female Pdgfbret/ret mice and littermate controls (Pdgfbret/wt) were housed under an inverted 12-hour light/dark cycle. For two-photon imaging experiments, mice were positive for Pdgfrb-eGFP (Gensat.org. Tg(Pdgfrb-eGFP)JN169Gsat/Mmucd) in order to visualize the mural cells. Genotyping of Pdgfbret/ret was conducted as described previously.27,28 Each animal was 2–3 months of age at the time of surgery and at 3–4 months of age two-photon imaging commenced. All procedures were approved by the Canton of Zurich veterinary authorities, in accordance with the guidelines of the Swiss Animal Protection Law (Act of Animal Protection 16 December 2005 and Animal Protection Ordinance 23 April 2008) (ZH151/2017). We adhered to the ARRIVE 2.0 guidelines when reporting animal data in this study. 29
Cranial window surgery
A cranial window was prepared in two surgical procedures as previously described.27,30 During the first surgery, animals were anesthetized with isoflurane (4% for induction, 1–2% for maintenance), fixed in a stereotaxic frame and an incision was made to expose the skull. The bone was cleaned and then a bonding agent (Prime & Bond, Dentsply) followed by dental cement (Coltene SYNERGEY D6 Flow) was applied and polymerized with blue light. A custom-made aluminum head post restraint was attached with dental cement. In the second surgical procedure conducted 48 to 72 hours later, the animal was anesthetized with midazolam (5 mg/kg), fentanyl (0.05 mg/kg) and medetomidine (0.5 mg/kg) to cut a craniotomy over the somatosensory cortex with a dental drill. A sapphire glass window (3×3 mm; ValleyDesign) was fixed in place with dental cement over the exposed brain. Buprenorphine (0.1 mg/kg s.c. during the day and 1 mg/kg in drinking water at night) was administered for 3 days following the surgery and animals were allowed to recover at least two weeks before imaging.
Tail vein injection
Before the imaging procedures outlined below, mice were anesthetized with isoflurane (4% for induction, 1–2% for maintenance) and the tail vein was canulated with a 30 G needle attached to polyurethane tubing (inner diameter 0.3 mm) with a 28 G insulin needle/syringe filled with saline. 31 Once the 30 G needle was confirmed to be in the tail vein following i.v. injection of 10–20 µl of saline, the insulin syringe was switched from the end of the cannula with a syringe containing 2.5% dextran-Texas Red (70 kDa, Molecular Probes) or PO2 probe (see below). Then, 30 µl of dye was injected into the vein and the cannula was rinsed with saline. Animals received a maximum volume of 100 µl i.v.
Two-photon fluorescent imaging and analysis
Fluorescent images of pericytes and blood vessels were acquired through the cranial window of lightly anesthetized animals (∼1% isoflurane) with a custom-built two-photon laser-scanning microscope 32 equipped with a 20× water immersion objective (W Plan-Apochromat 20×/1.0 DIC VIS-IR, Zeiss). GFP and Texas-red dextran were excited at 940 nm with a Ti:sapphire laser (Mai Tai; Spectra-Physics) directed by galvanometric scanners. Fluorescence emission was separated by a 560 nm dichroic mirror (BrightLine; Semrock) and detected with GaAsP photomultiplier modules (Hamamatsu Photonics) fitted with a green 520/50 nm band pass filter or a red 607/70 band pass filter. A customized version of ScanImage (r3.8.1; Janelia Research Campus) was used to control the microscope, which was modified to enable gating the laser output during imaging (necessary for phosphorescence lifetime imaging as outlined below).
At the beginning of each imaging session, a z-stack of images was acquired from the surface pial vessels up to ∼300 µm deep in the tissue with 1–2 µm steps in the z plane. The laser power was exponentially adjusted to account for the increasing depth in the tissue. Once the eGFP positive pericytes and branches of the vascular network were identified, high resolution (512 × 512 pixels, 0.74 Hz) images were collected of each vessel as a reference. To measure vascular diameter, the galvanometric scanners were directed in a line scan bisecting the vessel at 90° perpendicular to the vessel flow at scan rates up to 1500 Hz, as has been done previously. 33 To measure RBC velocity and other hemodynamic parameters, the galvanometric scanners were directed in a line scan parallel to the vessel flow at scan rates up to 1500 Hz. Line scan data of diameter or RBC velocity was acquired for 30 s. Data was acquired regularly (2–3 imaging sessions per week) over several months.
Experimenters were not blinded to the genotype of the animals prior to analysis because the phenotype of Pdgfbret/ret vessels (Figure 1) made the genotype readily distinguishable from the microscope images. However, the diameter and RBC line scans were processed with standard parameters for both genotypes using our semi-automated image processing tool box for MATLAB (Cellular and Hemodynamic Image Processing Suite (CHIPS
34
); R2016a; MathWorks) to maintain consistency. The vessel diameter was calculated from the full-width at half maximum fluorescence signal within the line scan. A Radon transformation of the RBC streak angle in the line scan was used to approximate RBC velocity.
35
The RBC flux was approximated from the number of RBC streaks that crossed the line scan during the image acquisition time (cells/s). The linear density was defined as the length of space occupied by RBCs divided by the total vascular length measured in the line scan.
36
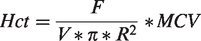
Vascular tube hematocrit was calculated from our two photon hemodynamic measurements of vessel radius (R; i.e. half of the diameter), the RBC flux (F); and the RBC velocity (V) as follows:37,38
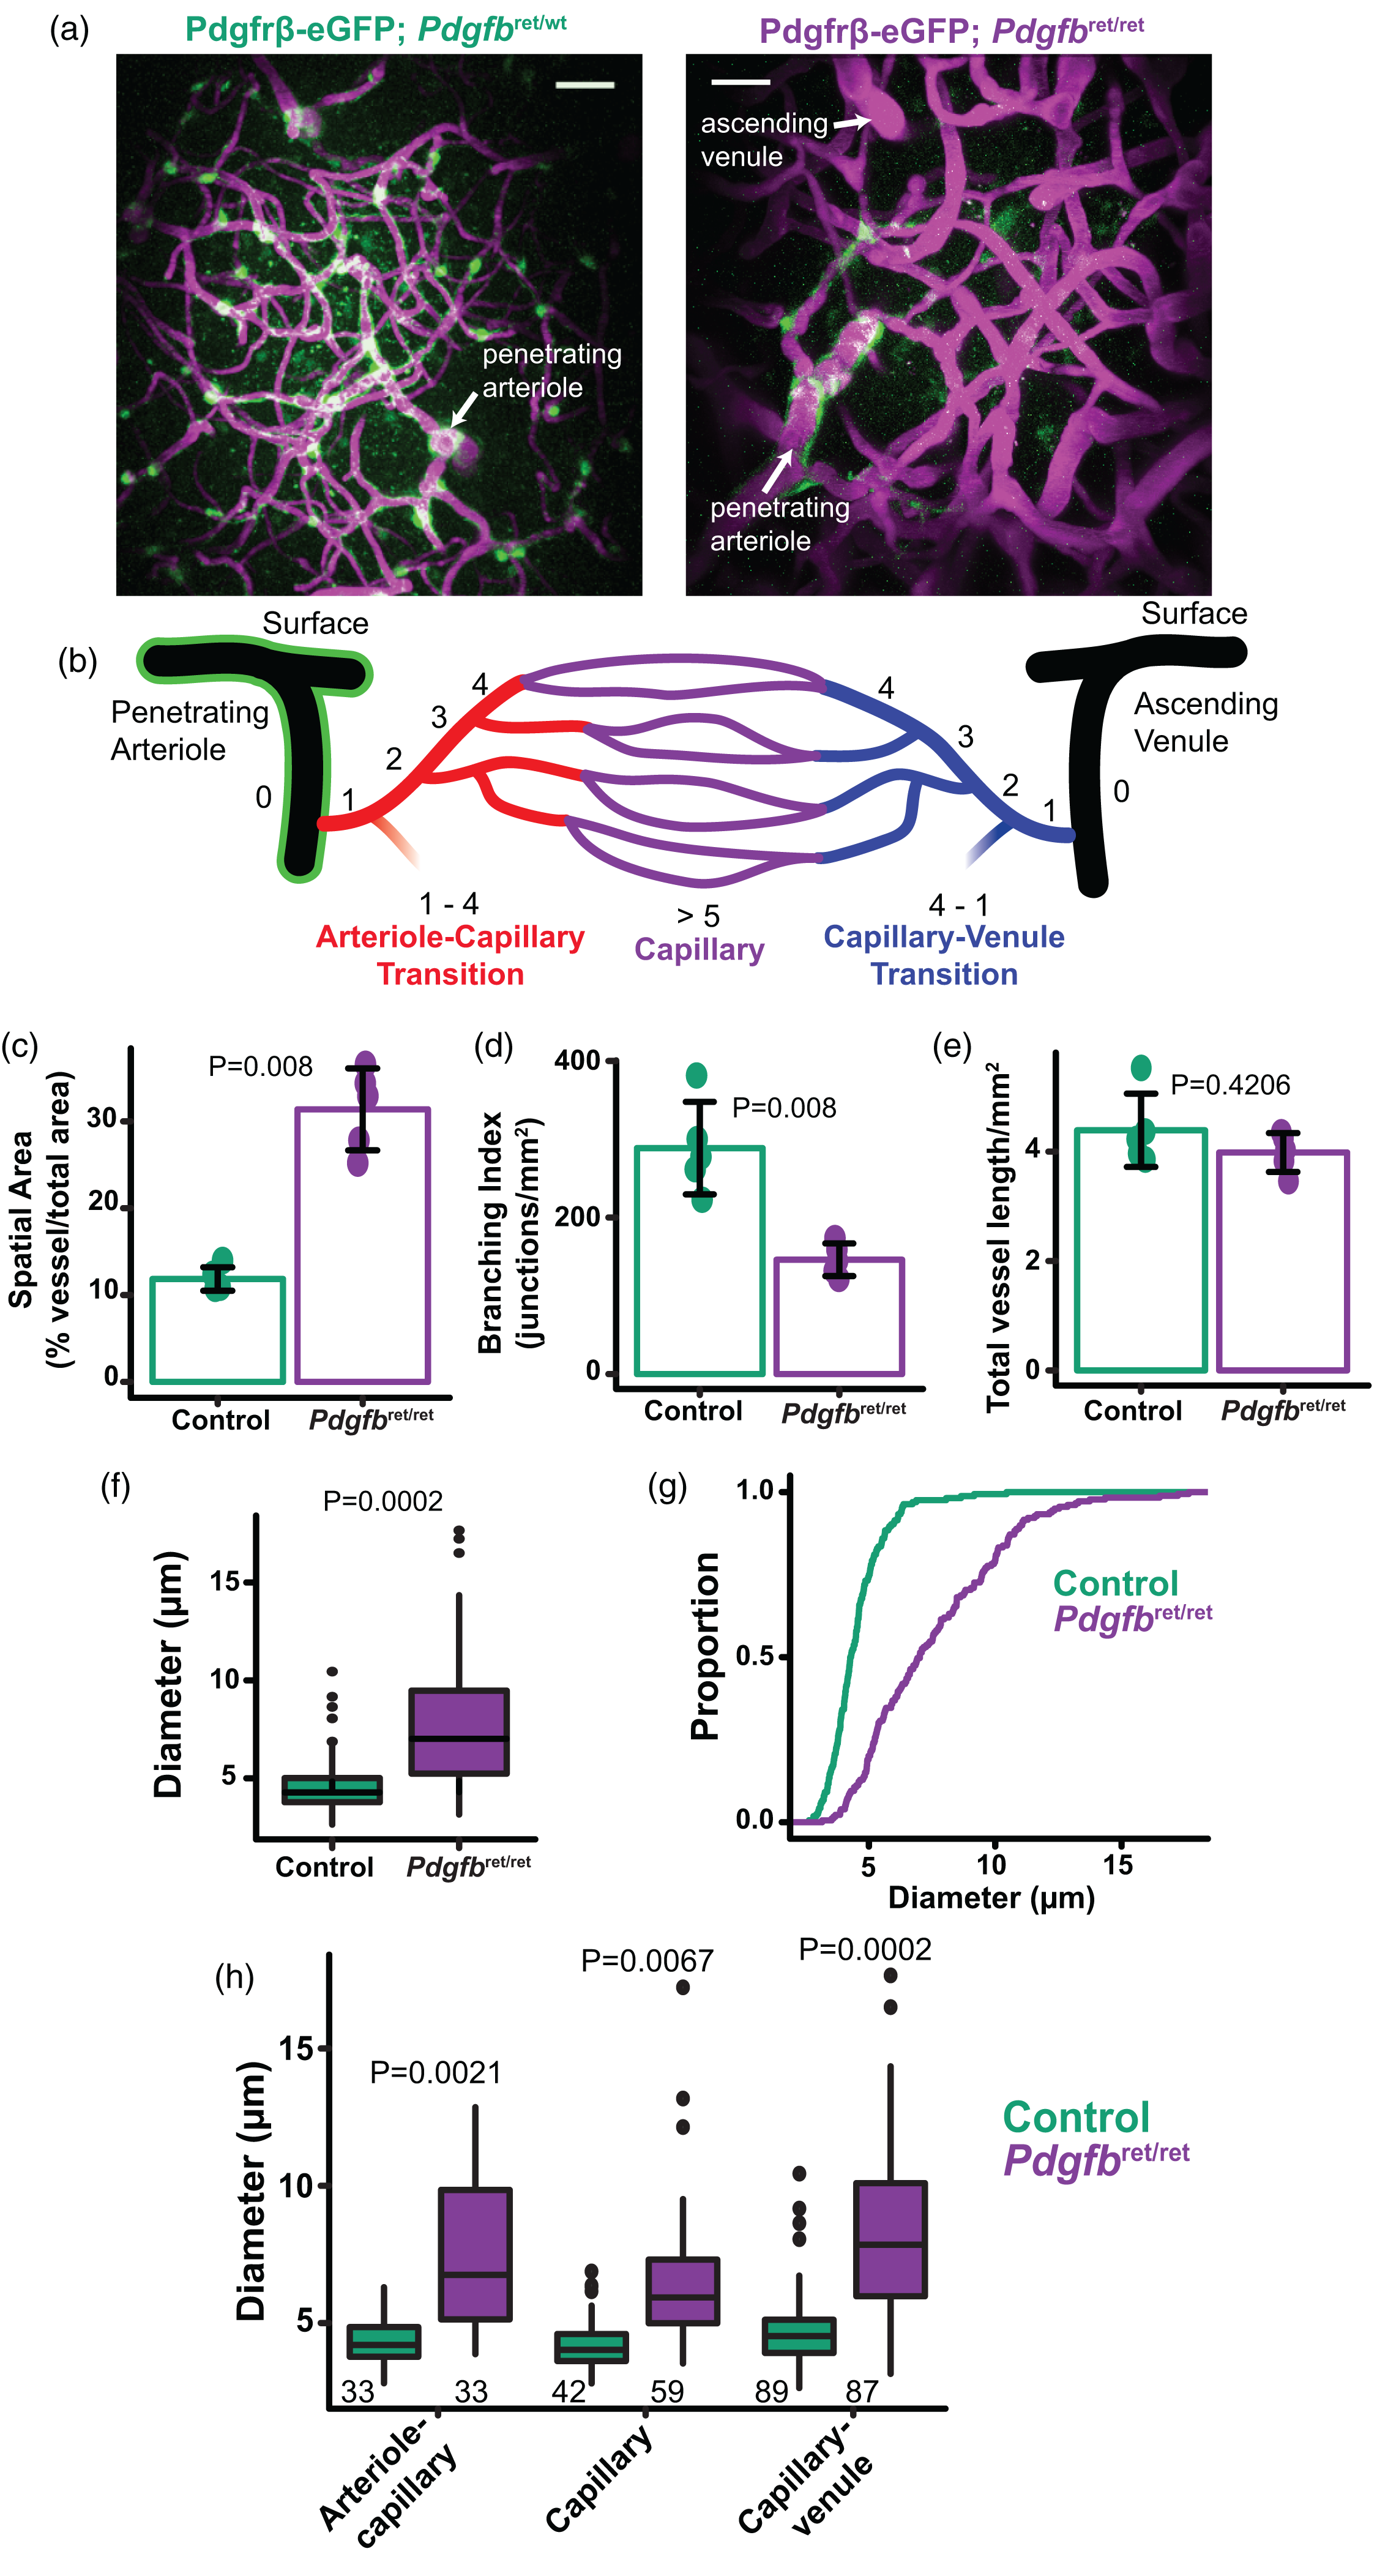
Vessel enlargement throughout the cerebrovascular network in Pdgfbret/ret mice. (a) Example maximum intensity projections from a Pdgfrb-EGFP; Pdgfbret/wt mouse (Control; left) and Pdgfrb-eGFP; Pdgfbret/ret mouse (right). Blood plasma was labelled withContinued.dextran-Texas Red (magenta) and mural cells expressing eGFP were visible (green). Pdgfbret/ret mice have smooth muscle cells labelled with eGFP, but lack pericytes. Scale bar = 50 µm. (b) Diagram of the cerebrovascular tree indicating the branch order for the arteriole-capillary transition zone, capillaries, and the capillary-venule transition zone. (c, d, e) Structural analysis of Z stacks from 5 Pdgfbret/ret mice and 5 controls examined spatial vessel area (% vessel/total image area), branching index, and total vessel length. Dot plots are represented as mean ± SD. Mean statistics were calculated using Mann-Whitney U tests. (f, g) Box plot and cumulative distribution plot of vessel diameters measured by line scan. n = 164 vessels from 7 Control mice; n = 179 vessels from 9 Pdgfbret/ret mice. (e) Vessel diameters for microvascular zones: arteriole-capillary transition, capillary, and capillary-venule transition (n indicated on graphs from 7 control mice and 9 Pdgfbret/ret mice). Statistics were calculated using linear mixed-effects models and Tukey post hoc tests.
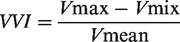
MCV was the mean corpuscular volume of mouse RBCs which has previously been measured at 45 µm3.37,39 We also calculated a velocity variability index (VVI) for each vessel based on Bouvy et al. (2014)40 as:
Vascular structural analysis was conducted with AngioTool, 40 using maximum-intensity projection images of 50 µm z-stacks of Texas Red-dextran from control and Pdgfbret/ret mice. Based on the microscope parameters, the scale was set to 0.9 pixels/µm and all small particles were removed in AngioTool. Output parameters considered were: vascular area, total length of vessels, and branch index (junctions/mm2).
Two-photon phosphorescence imaging for oxygen measurements
In order to measure local vascular oxygen levels, oxygen probe PtP-C343 was used as described previously. 41 Briefly, following i.v. injection of the probe, phosphorescence was excited by the two-photon laser at 920 nm localized to specific points within the vascular network. Each phosphorescence cycle consisted of a 10 ms train of femtosecond pulses (800 pulses), followed by a 270 ms phosphorescence photon collection period. The emitted light was detected by a highly sensitive photomultiplier tube (PMT; H10770PA-50 SEL, Hamamatsu) fitted with a 690/25 nm band pass filter. Phosphorescence lifetimes were calculated by fitting the decays with single exponentials using non-linear least squares, and the standard error in the lifetimes was estimated with a bootstrap resampling approach. The lifetimes and standard errors were converted to PO2 measurements using a Stern-Volmer-like calibration plot, obtained as described previously. 41
Immunohistochemistry
Deeply anaesthetized animals were perfused for 1–2 min with PBS, followed by 5 min perfusion with 4% PFA in PBS, pH 7.2. Brains were collected and post-fixed in 4% PFA in PBS, pH 7.2 at 4°C for 6 h. Free floating brain 60 μm coronal sections (cut with Leica VT1000S) were incubated in the blocking/permeabilization solution (1% bovine serum albumin, 0.5% Triton X-100 in PBS) overnight at 4°C, followed by incubation in primary antibody solution (0.5% bovine serum albumin, 0.25% Triton X-100 in PBS; anti-HIF1α from Novusbio, Cat # NB100-479SS and anti-podocalyxin (PODXL) from R&D Systems, Cat # AF1556, dilution 1:100) for three days at 4°C, and subsequently in secondary antibody solution (donkey anti-rabbit IgG (H + L)-Cy3 Cat # 711-165-152 and donkey anti-goat IgG (H + L)-Alexa 488 #705-545-147,1:600, Jackson ImmunoResearch) overnight at 4°C. Sections were incubated with DAPI (4′,6-Diamidino-2-phenylindole dihydrochlorid) in PBS (D9542, Sigma-Aldrich, 1:10000) for 7 minutes at RT. Brain sections were mounted in ProLong Gold Antifade mounting medium (cat. #P36930, Life Technologies). Images were taken with Slidescanner Zeiss Axio Scan.Z1 (Leica Microsystems). Image processing was done using Fiji and Zen2. All images are represented as maximum intensity projections.
Magnetic resonance imaging
Blood flow changes in 5 month old Pdgfbret/ret mice and controls were measured with a pharmacological fMRI protocol as described previously.42,43 Briefly, a 7/16 small animal MR Pharmascan (Bruker Biospin GmbH, Ettlingen, Germany) equipped with an actively shielded gradient set of 760 mT/m with a 80 µs rise time was used together with a cryogenic transmitter-receiver radiofrequency coil and operated by a Paravision 6.0 software platform. Mice were endotracheally-intubated and maintained at 1.5% isoflurane in oxygen/air (100:400 ml/min) mixture and actively ventilated at a rate of 90 breaths/minute and a tidal volume of approximately 0.3 ml/breath using a small animal ventilator (MRI-1, CWE inc. USA). The tail veins of the mice were cannulated for administration of drugs and contrast agent. A neuromuscular blocking agent, gallanmine triethiode (Sigma-Aldrich GmbH, Switzerland) was administered twice as a bolus (40 μl, 7 mg/ml) at the beginning and before i.v. injection of contrast agent while the isoflurane level was reduced to 1.2%. T2-weighted anatomical reference images were acquired using a spin echo rapid acquisition with relaxation enhancement (RARE) sequence with the same anatomical geometry as RARE sequence at pre- and post-injection of vessel dilator acetazolamide. Fifteen minutes after injection of contrast agent gallamine was injected i.v. (21 mg/kg body weight). Then, eight sequential pre-contrast agent scans at baseline signal intensity Spre (CBV0 image) were acquired using a RARE sequence: temporal resolution = 40 s, repetition time = 3333 ms, echo time eff = 81 ms, RARE factor = 32, field-of-view = 20 × 20 mm, imaging matrix = 133 × 103, slice thickness = 1 mm, 1.5 mm gap, resolution = 150 ×200 μm. FLASH sequence NR = 50 was used for ensuring the successful injection of the contrast agent. After 10 repetitions, iron oxide contrast agent Endorem (50 mg Fe/kg body weight, Guerbet SA, Roissy, France) was administered i.v. A RARE sequence was started after five minutes after repetition = 100 and 8 averages, when the contrast agent concentration had reached steady state. After the 30th repetition (20 minutes), acetazolamide (30 mg/kg body weight; Diamox® parenteral, Goldshield Pharmaceuticals Ltd, Croydon, UK) was administered i.v. as a bolus. An additional 70 images were collected (46.7 minutes), yielding the image series S( t ).
Image analysis was carried out using Biomap software (Novartis Institute for Biomedical Research, Basel, Switzerland). Regions of interest (ROIs) were defined for the cortex according to the mouse brain atlas by Paxinos et al. (2001).
44
Baseline CBV values CBV0 were measured for each ROI. Relative changes of CBV in percent of prestimulation CBV values (


Values for left and right sides of the brain were averaged.
Statistics
All statistics were performed in R (version 4.1.3). Sample sizes were calculated using the smpsize_lmm function from the jstats package with a moderate effect size of 0.2, a power of 0.8, and a significance level of 0.05. Statistics for single-vessel blood flow and oxygen measurements were performed using the lme4 package for linear mixed-effects models to account for repeated measures from the same animals. The Shapiro-Wilk test was used to test for normality. Data not normally distributed was log transformed before use in the mixed model. We used genotype (control vs ret/ret), microvascular zone, cortical layer and also the interaction of some pairs (e.g. genotype and cortical layer) as fixed effects. We used intercepts for individual animals as random effects. Likelihood ratio tests comparing models without fixed effects to models with fixed effects were used for the best fit while accounting for the different degrees of freedom. Residuals were plotted for visual inspection for deviations from homoscedasticity. P-values for different parameter comparisons were obtained using the lsmeans package with Tukey post-hoc tests. Statistical analysis was performed on ΔCBV%(t) profiles using a two-way ANOVA with Tukey post-hoc tests (ggpubr package). Mann-Whitey U tests were used for comparisons between groups when single measures from individual animals were made such as the area under the curve for ΔCBV%(t) profiles and vessel structural properties from AngioTool, as the Shapiro-Wilk test suggested these were not normally distributed.
Software availability
CHIPS toolbox for MATLAB is freely available on GitHub (https://ein-lab.github.io/).
34
Further information and requests for resources and reagents should be directed to and will be fulfilled by Bruno Weber (
Results
To record resting single vessel hemodynamics at different locations of the cerebrovascular network in Pdgfbret/wt (control) and Pdgfbret/ret mice, we implanted a chronic cranial window and performed two-photon imaging of cortical blood vessels under isoflurane anesthesia (1–1.5%) following intravenous injection of 70 kDa Dextran-Texas Red (Figure 1(a)). Mice were also positive for the Pdgfrb-eGFP transgene to label mural cells. Previous studies found that only approximately 25% of the capillary bed is covered by pericytes in Pdgfbret/ret mice. 5,26 Similarly, we found Pdgfbret/ret mice had eGFP positive cells mostly on pial arteries and the penetrating arterioles with minimal labeling on all microvascular zones and ascending venules, highlighting their deficiency in pericytes (Figure 1(a)).5,25,46 EGFP expression was used to distinguish penetrating arterioles from ascending venules when classifying microvascular zones as the arteriole-capillary transition region (1–4 branches from the penetrating arteriole), capillary bed (≥5 branches from the penetrating arteriole or ascending venule) and capillary-venule transition region (1–4 branches from the ascending venule; Figure 1(b)). Maximum intensity projections of dextran Z-stack images from the cortex ∼100–150 µm deep were analyzed using AngioTool (Supplementary Fig. 1), which compared the percentage of vessel area in the total image area, the number of vessel junctions/mm2 (branching index) and the total vessel length/mm2. Pdgfbret/ret mice had a greater vessel spatial area relative to the total image area (Figure 1(c), i.e. the vessels covered a larger field in the image) and fewer vascular branches (Figure 1(d)) compared to control mice, but the total length of vessels was the same (Figure 1(e)). The diameter of vessels in Pdgfbret/ret mice were larger than controls (Figure 1(f) and (g); Pdgfbret/ret 7.52 ± 2.81 µm vs. control 4.50 ± 1.15 µm; mean ± S.D.) 26 throughout the vascular network from the arteriole-capillary transition zone to capillaries to the capillary-venule transition region (Figure 1(b) and (h)). 14
The velocity of red blood cells (RBCs) in single vessel segments was measured by line-scans parallel to the vessel, which generated kymographs with black lines for the passage of RBCs (Figure 2(a) and (b)). Overall, RBC velocities were reduced in Pdgfbret/ret mice compared to controls (Figure 2(c) and (d); Pdgfbret/ret 0.45 ± 0.52 mm/s vs. control 0.80 ± 0.69 mm/s), despite larger vessel diameter (Figure 2(e)). This goes against the principle that increasing vessel diameter is associated with faster velocity,14,47,48 as seen in control animals (Figure 2(e); diameter vs. velocity Pearson’s correlation coefficient for controls; r = 0.414, p < 0.0001; Pearson’s correlation coefficient for Pdgfbret/ret; r = −0.089, p = 0.236). The most significant reduction in RBC velocity in Pdgfbret/ret mice was observed in the arteriole-capillary transition zone covered by ensheathing pericytes, over capillaries and the capillary-venule transition area (Figure 2(f)). RBC velocities had a higher degree of variability in Pdgfbret/ret mice, often fluctuating greatly during the line scan measurements (Figure 2(b)). To capture this fluctuation, we calculated a velocity variability index 49 , which is the fold change in velocity relative to the mean ((max velocity-min velocity)/mean velocity). The velocity variability index was greater in Pdgfbret/ret mice (Figure 2(g)), and most prominent in vessels with slower velocities (<1 mm/s; Figure 2(h)). In control mice, we also detected the occasional non-flowing or stalled blood vessel (1.2% of vessels), but only in the capillary bed. However, Pdgfbret/ret mice had more frequent stalling events throughout the vascular network (8.6% of vessels from all investigated vessel zones).
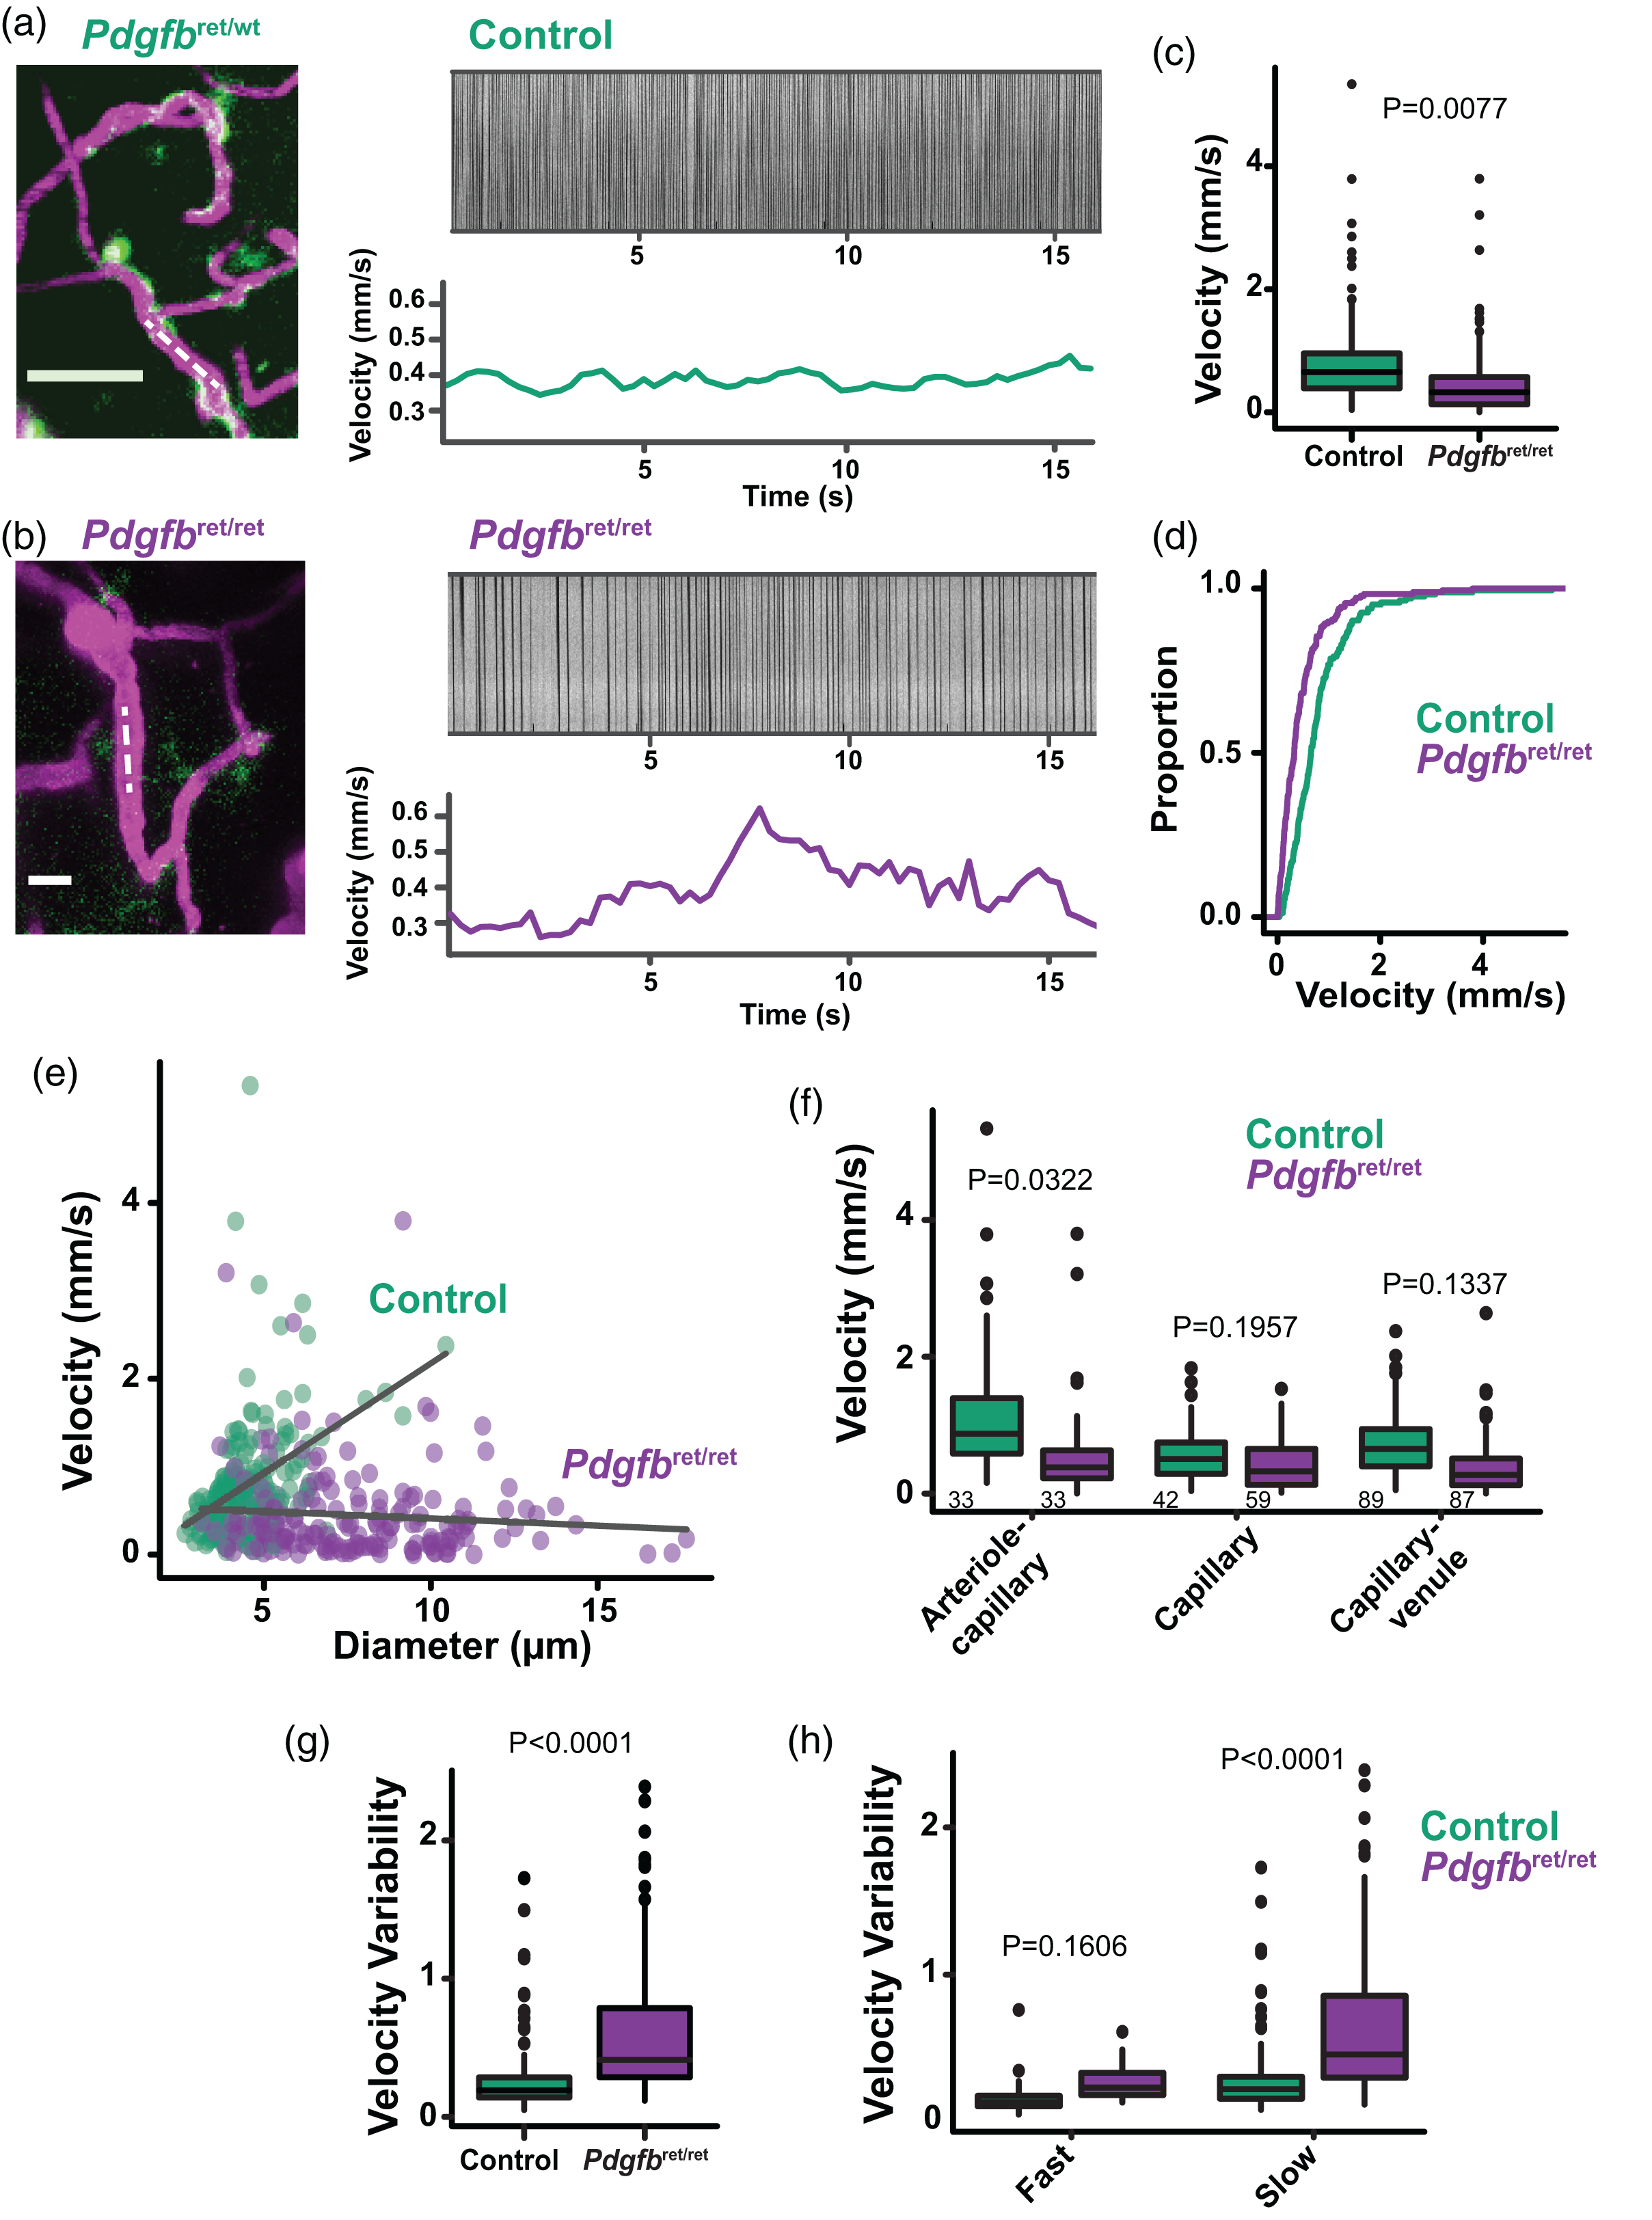
Red blood cell (RBC) velocity is reduced in Pdgfbret/ret mice. (a) An example capillary network in a Control mouse (left). Line scans parallel to RBC flow (dotted line on left, kymograph top right) allows the velocity to be calculated from the streaks (bottom right). (b) An example capillary network in a Pdgfbret/ret mouse (left). The RBC velocity was more variable during the scan (bottom right). (c, d) Box plot and cumulative distribution plot of RBC velocities measured by line scan. n = 164 vessels from 7 Control mice; n = 179 vessels from 9 Pdgfbret/ret mice. (e) Scatterplot of velocity vs. diameter for each blood vessel. (f) RBC velocity at different points in the vascular tree. (n indicated on graphs from 7 control mice and 9 Pdgfbret/ret mice). (g) The velocity variability index representing the dynamics or pulsatility in all vessels and (h) Slower vessels (velocity <1mm/s) had more variable velocities. (n = 38 Fast vessels and n = 123 Slow vessels from 7 Control mice; n = 18 Fast vessels and n = 160 Slow vessels from 9 Pdgfbret/ret mice). Mean statistics were calculated using linear mixed-effects models and Tukey post hoc tests.
We next extracted other hemodynamic properties from the line-scan analysis such as RBC flux, linear density, and tube hematocrit. Even though the RBC velocities were slower, the RBC flux (cells/s) did not differ between Pdgfbret/ret mice and controls (Figure 3(a) and (b); Pdgfbret/ret 33.60 ± 32.54 cells/s vs. control 42.51 ± 34.00 cells/s), likely due to the wider overall vessel diameter in Pdgfbret/ret mice. The RBC flux was also similar between genotypes within different cortical layers or microvascular zones (Supplementary Fig. 2 A, B). We calculated the linear density of RBCs as a fraction of vessel length occupied by RBCs to the total length of the line scan, and found that in Pdgfbret/ret mice overall linear density was reduced (Figure 3(c) and (d); Pdgfbret/ret 0.39 ± 0.16 cells/mm vs. control 0.50 ± 0.14 cells/mm), particularly in superficial cortical Layer 1, but not in specific microvascular zones (Supplementary Fig. 2 C, D). We also calculated the vascular tube hematocrit from the vessel radius, the RBC flux, and the RBC velocity37,38, assuming that the mean corpuscular volume of mouse RBCs was 45 µm3.37,39 The hematocrit was lower in Pdgfbret/ret mice compared to controls (Figure 3(e) and (f); Pdgfbret/ret 0.13 ± 0.07 vs. control 0.23 ± 0.09 cells/mm) across all cortical layers (Figure 3(h)) and microvascular zones, but the reduction was most pronounced in capillaries and the capillary-venule transition (Figure 3(g)). Linear density and tube hematocrit have the greatest influence on efficient oxygen delivery, 50 so a reduction in these parameters could indicate impaired oxygen delivery in Pdgfbret/ret mice.
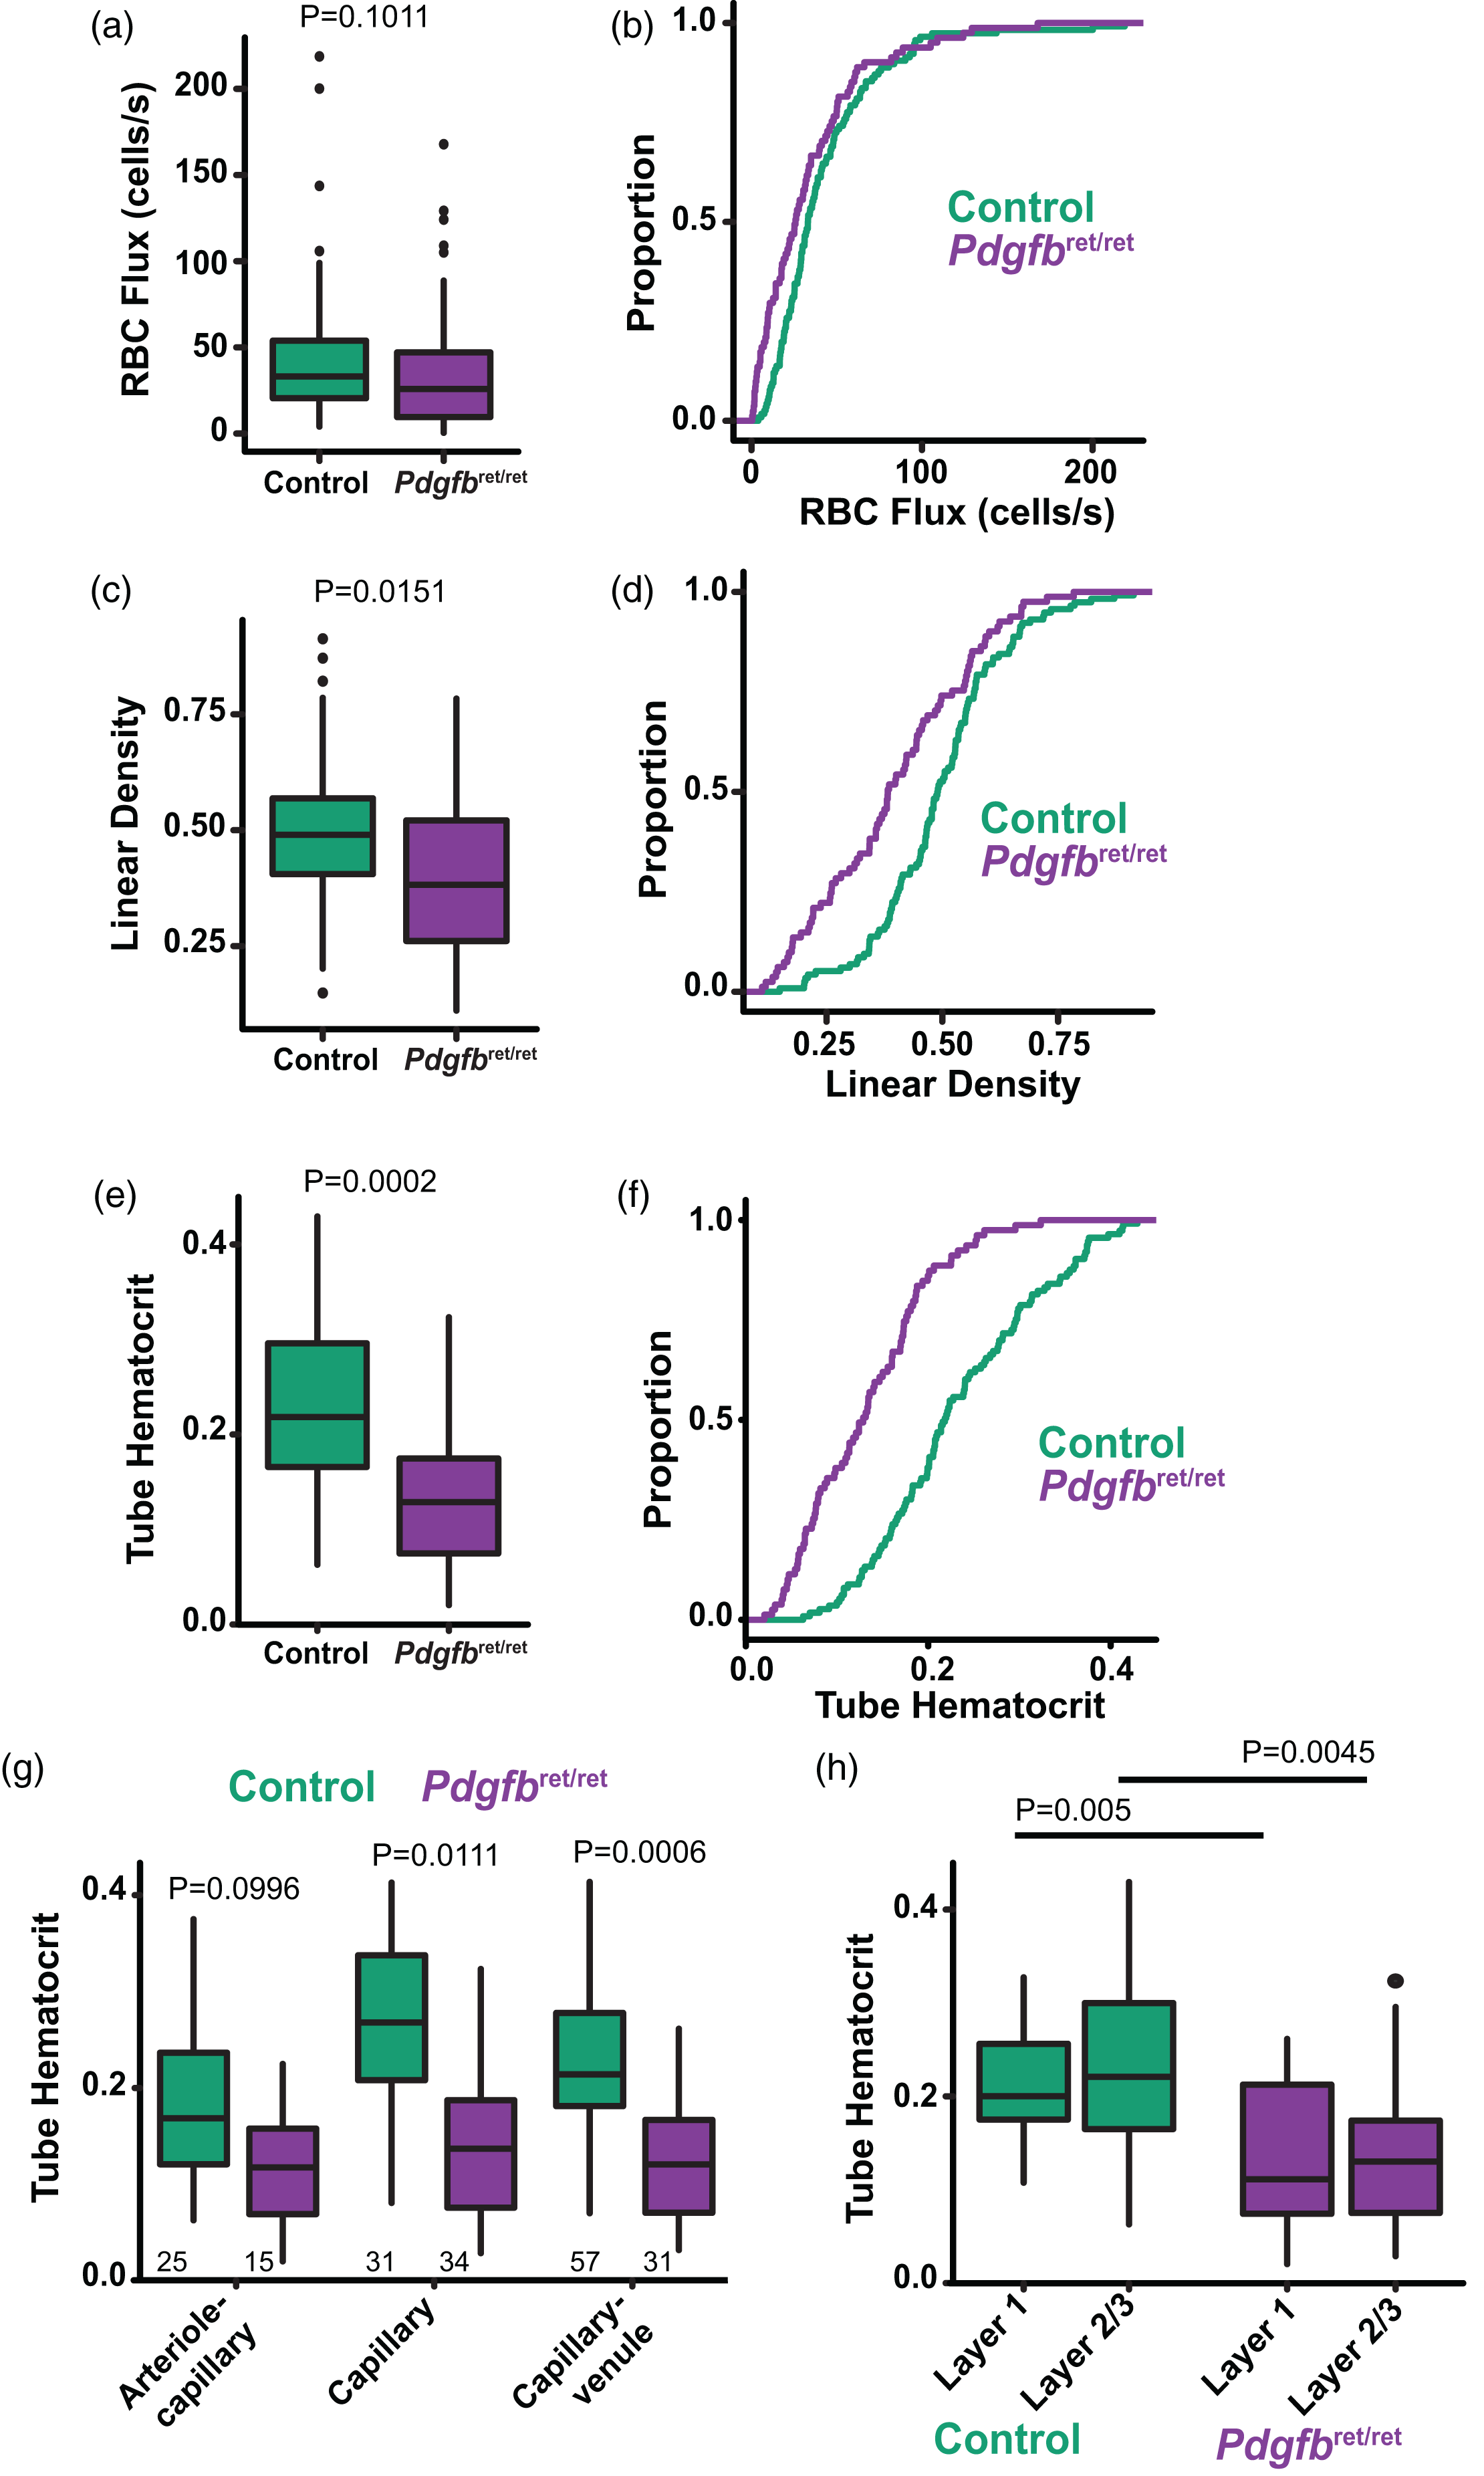
Red blood cell (RBC) density and hematocrit are reduced in Pdgfbret/ret mice. (a, b) Box plot and cumulative distribution plot of RBC flux. (c, d) Box plot and cumulative distribution plot of RBC linear density. (e, f) Box plot and cumulative distribution plot of tube hematocrit. (g) Tube hematocrit in different microvascular zones and (h) Tube hematocrit in different cortical layers. N = 116 vessels from 7 Control mice; n = 81 vessels from 9 Pdgfbret/ret mice for all graphs. Mean statistics were calculated using linear mixed-effects models and Tukey post hoc tests.
Following this, we measured blood oxygen concentrations (PO2) in individual vessels with the phosphorescent oxygen probe, PtP-C343.51,52 PO2 imaging was performed at specific depths up to 200 µm into the cortex with an inter-plane distance of 25 µm. Point-based PO2 measurements were acquired from penetrating arterioles, vessels in the arteriole-capillary transition, capillaries, vessels in the capillary-venule transition, and ascending venules (defined as in Figure 1(b)) from five control and five Pdgfbret/ret mice (Figure 4(a)). All together, we did not detect a difference in intravascular PO2 between Pdgfbret/ret mice and controls (Figure 4(b) and (c); Pdgfbret/ret 41.08 ± 13.67 vs. control 39.84 ± 10.84 mmHg). A previous study of mean PO2 in different cortical layers in wildtype mice found that concentrations are similar between Layer 1 and Layer 2/3, 53 and we made similar observations in control animals (Figure 4(d)). However, blood oxygen concentrations were higher in Pdgfbret/ret mice in Layer 2/3 than Layer 1 (Figure 4(d);. L1: 37.24 ± 14.26 vs. L2/3: 44.10 ± 12.36 vs mmHg). Within Layer 2/3, the capillary and capillary-venule transition zones tended to have higher oxygen concentrations in Pdgfbret/ret mice compared to controls (Figure 4(e)), but this did not reach statistical significance. Nevertheless, this suggests that there could be reduced oxygen extraction from the blood leading to higher vessel concentrations in deeper cortical layers. However, we did not detect accumulation of hypoxia-inducible factor-1 alpha (HIF-1α) in the brain tissue of Pdgfbret/ret mice by HIF-1α immunostaining (Supplementary Fig. 3), which suggests that resting tissue oxygen levels are stable in this mouse line.
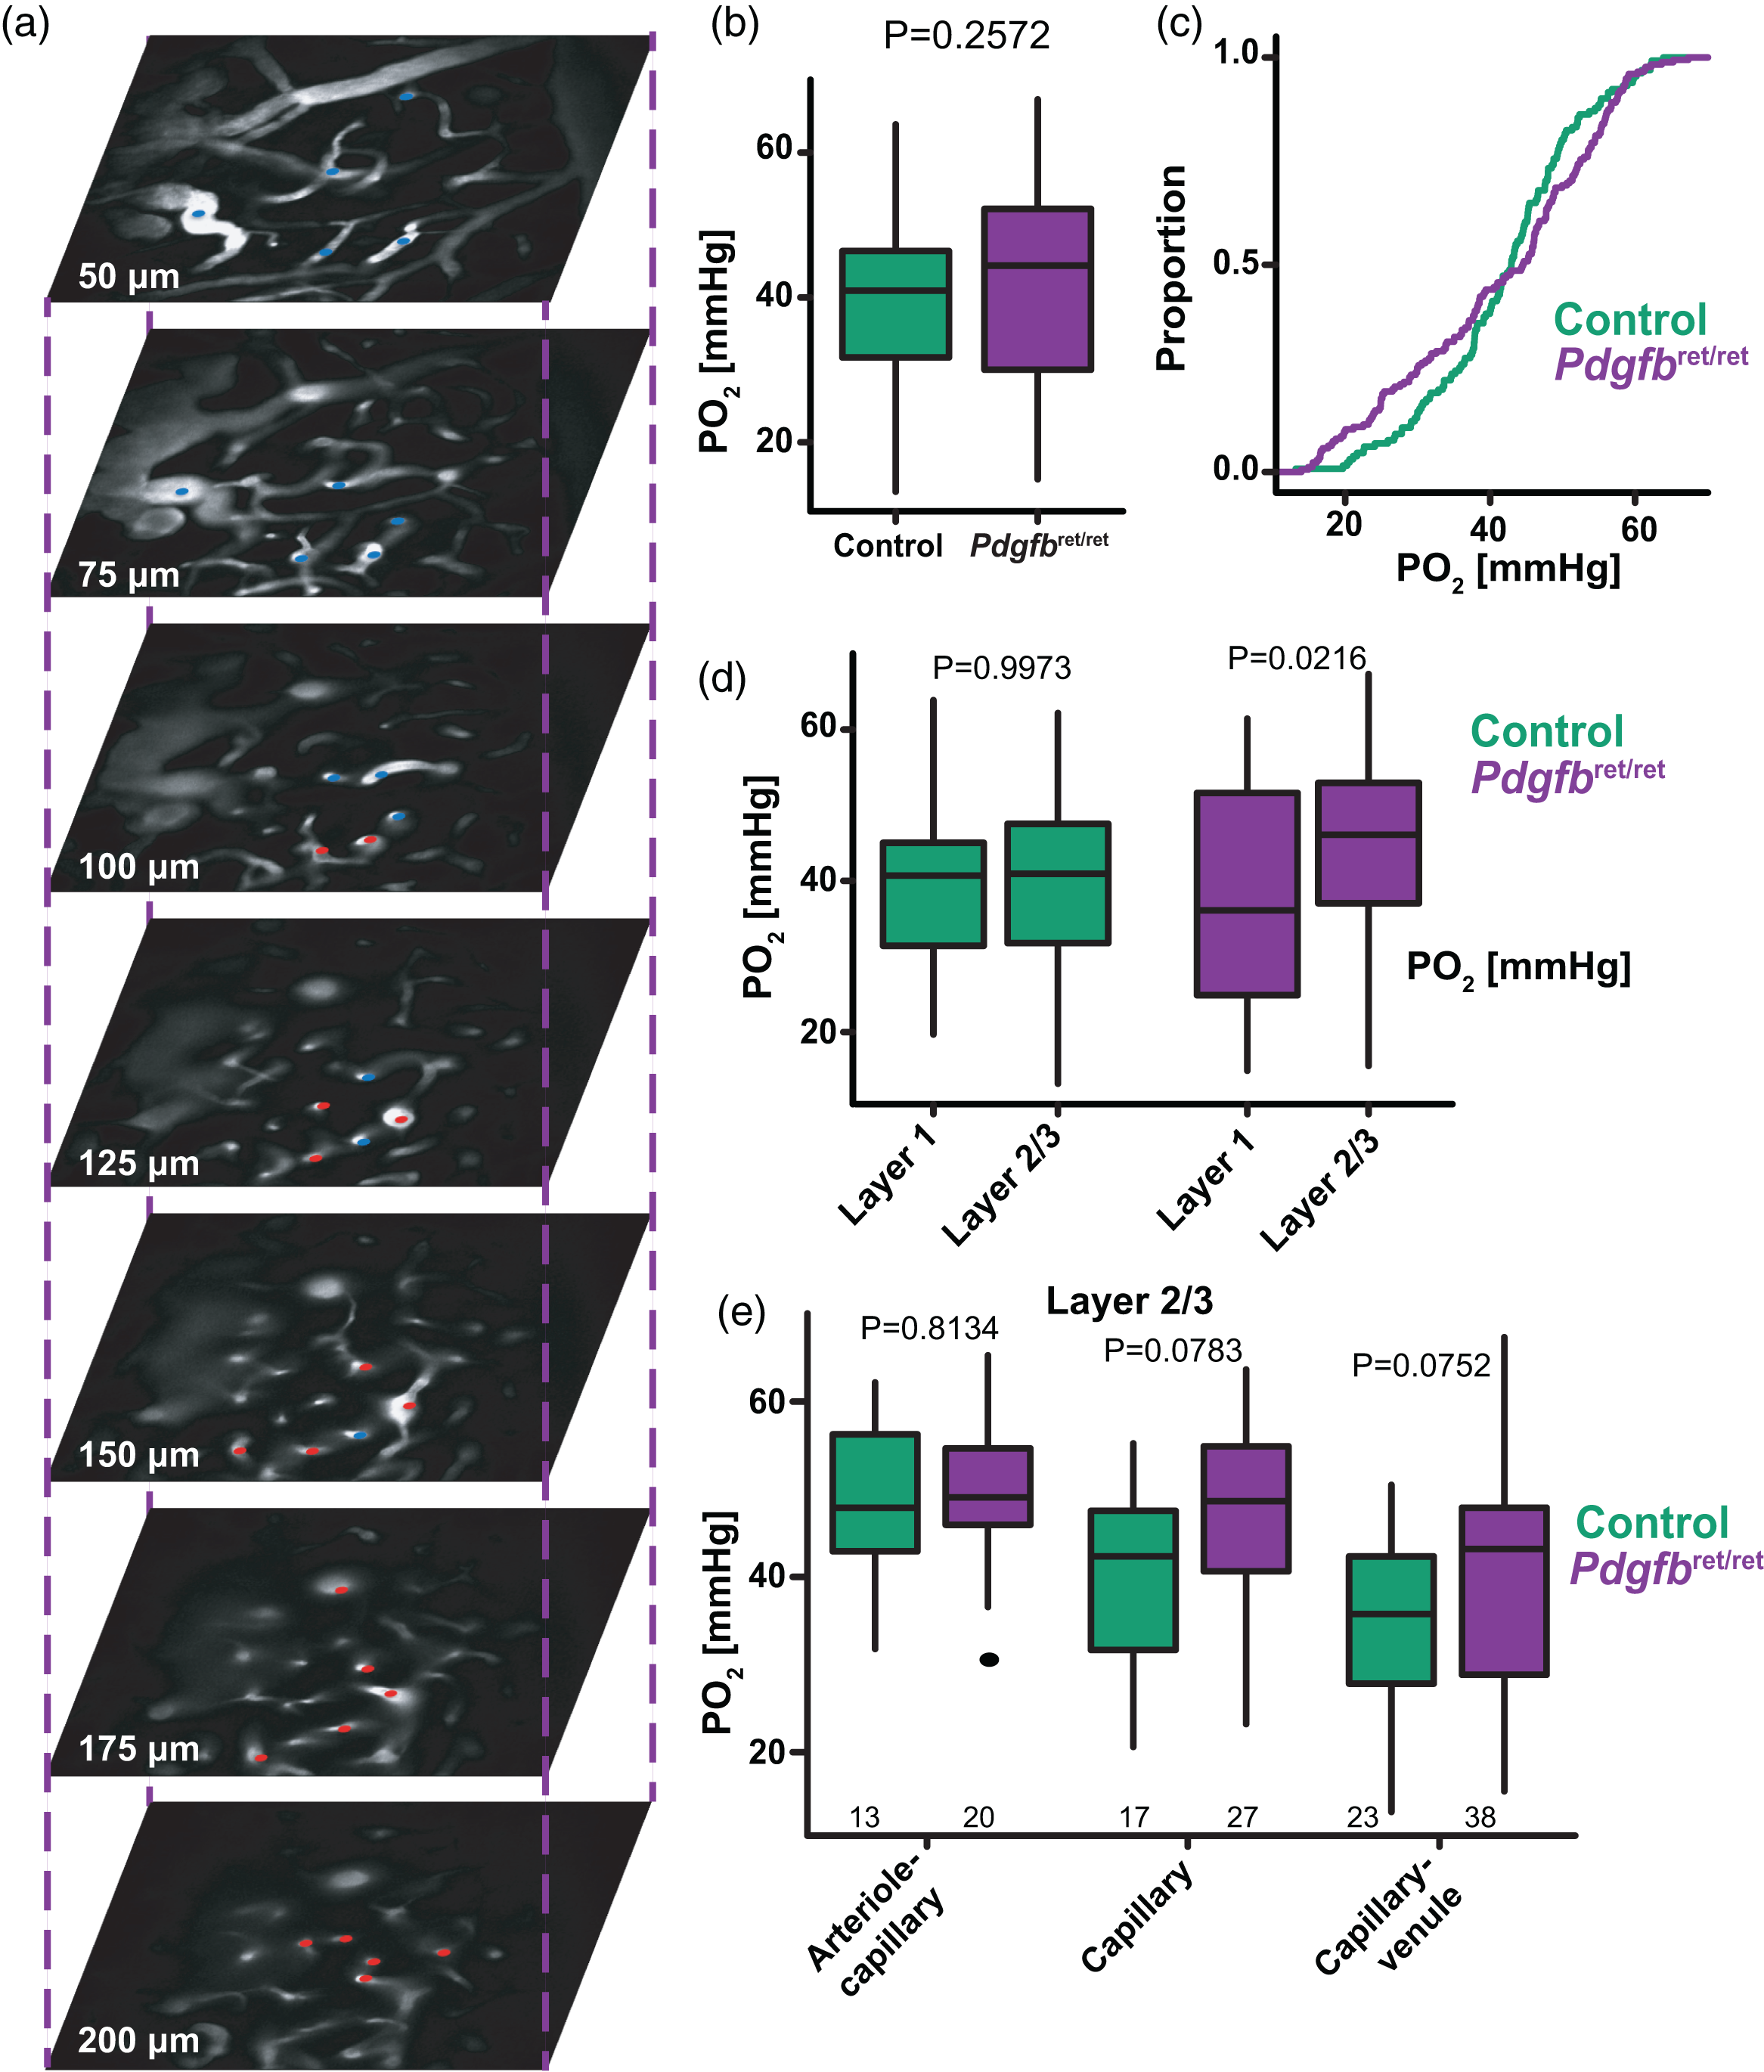
Blood oxygen levels are different between cortical layers in Pdgfbret/ret mice. (a) Oxygen was measured in individual vessels at different points in the vascular tree and at different depths. Red dots indicate vessels close to the arterial side of the network, while blue dots indicate vessels on the venous side. (b, c) Box plot and cumulative distribution plot of mean intravascular oxygen levels (PO2). N = 91 vessels from 5 Control mice; n = 147 vessels from 5 Pdgfbret/ret mice. (d) Box plots of PO2 in cortical Layer 1 and Layer 2/3. n = 38 Layer 1 and n = 53 Layer 2/3 from 5 Control mice; n = 62 Layer 1 and n = 85 Layer 2/3 from 5 Pdgfbret/ret mice and (e) Box plots of PO2 in different microvascular zones within Layer 2/3. Mean statistics were calculated using linear mixed-effects models and Tukey post hoc tests.
To assess the vasoreactivity of Pdgfbret/ret mice, we used vasodilator, acetazolamide 54 , during functional magnetic resonance imaging (fMRI). Acetazolamide injection increased cerebral blood volume (CBV) in controls and significantly less so in Pdgfbret/ret mice (Figure 5(a) and (b)), which suggests an impairment in cerebrovascular reactivity in Pdgfbret/ret mice.
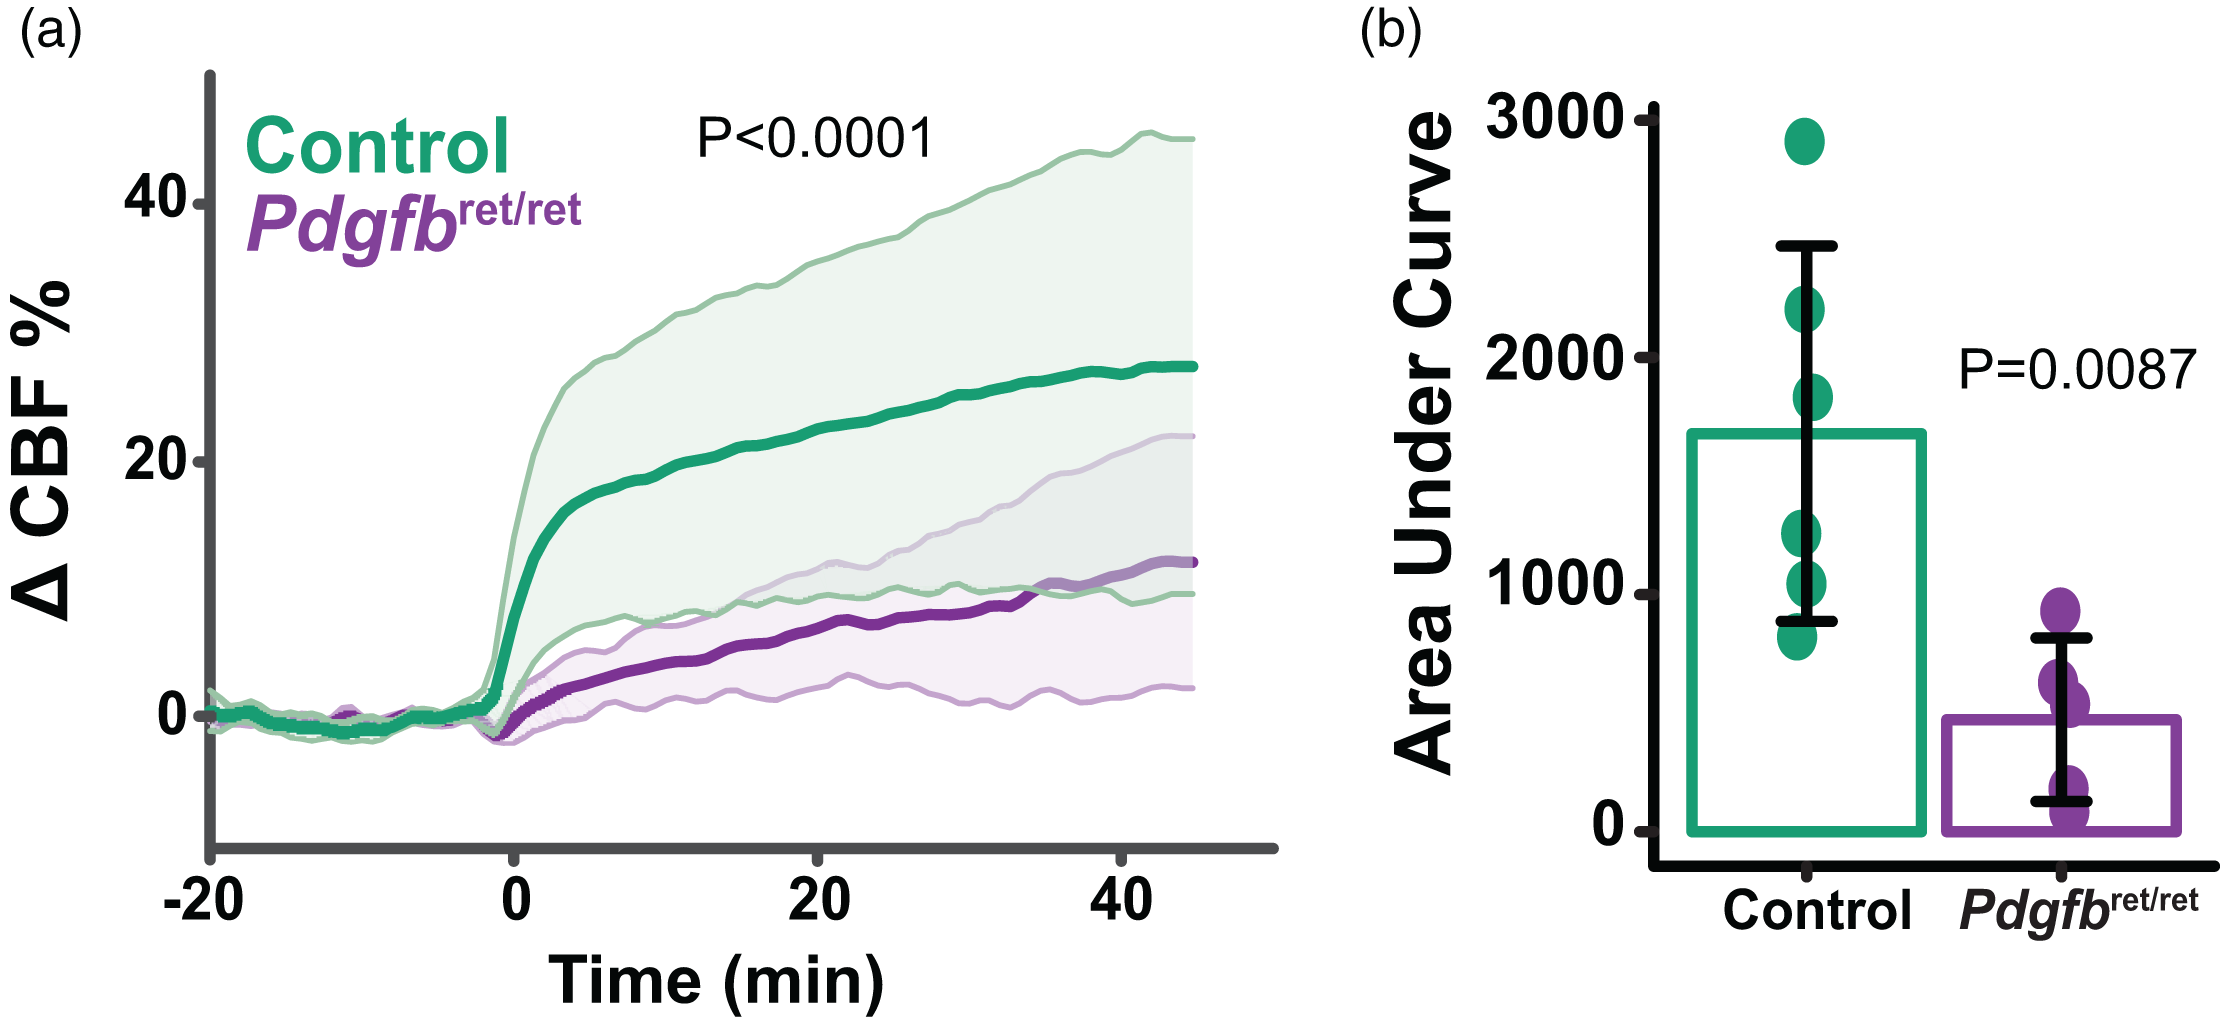
Impaired dilatory cerebral blood volume responses in Pdgfbret/ret mice by fMRI. (a) Cortical blood volume changes to acetazolamide injection (30 mg/kg; Time 0) over time. Mean ± SD (shaded area) and (b) Area under the curve (AUC) was calculated from Time 0 until the end of scanning. Each value represents the AUC for one animal. n = 6 Control mice; n = 5 Pdgfbret/ret mice. Dot plot is mean ± SD.
Finally, we used male and female animals of both control and Pdgfbret/ret genotypes in each experiment and we found no effect of sex on any vascular parameter measured above (diameter, velocity, pO2, etc.; data not shown). Therefore, the Pdgfbret/ret mutation causes vascular dysfunction indiscriminately of sex.
Discussion
In this study, we surveyed hemodynamics and intravascular oxygen levels in a mouse model of severe pericyte deficiency, the Pdgfbret/ret strain. Compared to littermate controls, we found that the cortical vasculature in Pdgfbret/ret mice was malformed, with wider vessel diameter across different microvascular zones and fewer branch junctions (Figure 1), consistent to previous histological studies with this strain.5,24 These malformations contributed to slower RBC velocities that had a high degree of variability and lacked correlation between diameter and velocity which is typical in normal vascular networks (Figure 2).14,47 Even though RBC velocity was reduced, there was no change in RBC flux in Pdgfbret/ret mice. However, the linear density and hematocrit were decreased (Figure 3), which are critical parameters for proper oxygen diffusion to the tissue. Overall, Pdgfbret/ret mice had similar mean vascular PO2 to controls, but deeper vessels in layer 2/3 had higher PO2 levels, suggesting reduced oxygen extraction (Figure 4). These altered hemodynamic parameters may contribute to observed impairments in cerebrovascular reactivity in Pdgfbret/ret mice (Figure 5), but also changes in other critical processes such as cerebral autoregulation and neurovascular coupling that warrant further investigations.
The Pdgfbret/ret model highlights the consequences on cerebrovascular structure that occur when pericyte coverage of vessels is incomplete and not present from early stages of development, which profoundly changes the vessel diameter and branching pattern (Figure 1). Previous studies have characterized the reduced pericyte coverage in Pdgfbret/ret mice by immunostaining for pericyte markers,5,24,26 but details about the branch order and microvascular regions were lost in thin tissue sections. By crossing in a reporter mouse strain (Pdgfrb-eGFP), we are the first to report an absence of all pericyte types (ensheathing, capillary and venous pericytes) across different microvascular zones in Pdgfbret/ret mice. Another model of pericyte deficiency, Pdgfrb+/− mice, have a progressive loss of pericytes between 27% 14 and 70% by 14–16 months old.55,56 It is not clear in this strain what types of pericytes are lost over time. Therefore, the Pdgfbret/ret model is perhaps better for studying pericyte deficiency at all levels of the microvascular network. The reduced vessel branching in Pdgfbret/ret mice can make it difficult to define the capillary bed because there are fewer branches in between the arterial and venous networks. Based on the branch pattern, such structure is similar to arteriovenous malformations where there is a limited capillary bed in the nidus 21 and pericyte-loss is commonly found. 22 Furthermore, mouse models with disrupted Notch signaling in pericytes develop arteriovenous malformations,57,58 emphasizing a role for pericytes in this pathology.
Overall, our findings suggest Pdgfbret/ret mice are useful for studying the consequences of severe pericyte deficiency on the blood flow and vasoreactivity and show similar impairments to Pdgfrb+/− mice when pericyte loss has progressed to significant levels (>70%).55,56 However, in terms of hemodynamics, we observed an overall reduction in RBC velocity, which was unexpected, since the vascular resistance decreases with increased vascular diameter. When fewer pericytes are lost (∼27%) in Pdgfrb+/− mice, there is no significant change in vessel diameter, but local velocities increase, particularly in the arteriole-capillary transition region. 14 We also found the greatest change in velocity in this microvascular zone, highlighting the importance of this part of the vascular network for local hemodynamics, as has been shown previously.3,7,12,13 When a greater number of pericytes are lost (up to 70%) in Pdgfrb+/− mice, capillary perfusion and neurovascular coupling responses are reduced.55,56 We observed a similar reduction in cerebrovascular perfusion, particularly in reduced velocity, RBC linear density, hematocrit, and dilatory responses to acetazolamide. Taken together, our work with Pdgfbret/ret mice and studies with Pdgfrb+/− mice that report a significant loss of pericytes (>70%)55,56 emphasize the importance of pericytes for optimal blood flow through the vascular network.
We also found an increased incidence of stalled blood flow in Pdgfbret/ret mice. This is interesting because stalled flow in capillaries is associated with a number of pathologies, including poor reperfusion after ischemia 59 and Alzheimer’s disease.60,61 In these cases, stalled flow is caused by adhesion of neutrophils within capillaries,59–61 potentially due to changes in endothelial cells and BBB integrity. 61 These pathologies are also associated with pericyte dysfunction or loss,6,19,20,62–64 and it is tempting to speculate that a loss of pericytes as seen in Pdgfbret/ret mice may contribute to endothelial dysfunction, BBB leakage, and neutrophil adhesion that causes stalled flow in microvessels. However, a link between pericytes and stalled blood flow has not yet been determined in different disease states and we did not investigate neutrophil adhesion in Pdgfbret/ret mice. This warrants further investigation in future studies and disease models.
Previous studies have shown that RBC flux is highly correlated with mean vascular PO2,51–53 so it is unsurprising that we did not find an overall difference in mean PO2 (Figure 4(a) to (c)) when flux (Figure 3) was the same between control and Pdgfbret/ret mice. In control mice, PO2 levels were consistent between cortical Layers 1 and 2/3, similar to a recent study. 53 However, blood PO2 was elevated in Pdgfbret/ret mice in Layer 2/3 compared to Layer 1, mainly in capillaries and the capillary-venule transition region (Figure 4(d) and (e)). This suggests that Pdgfbret/ret mice have less oxygen extraction from the blood. We also found that Pdgfbret/ret mice had a reduced linear density and hematocrit, which is known to lead to increased intravascular resistance to oxygen transport into the tissue. 50 Slow RBC velocities are correlated with greater oxygen extraction,53,65 so it might be expected that reduced velocity in Pdgfbret/ret mice would decrease PO2 across the microvascular network. However, the observed variability in velocities (Figure 2(g) and (h)) is suggestive of heterogenous, possibly non-laminar, blood flow. Oxygen extraction is facilitated by homogenous blood flow 53,66 and thus, the observed variability in blood flow in Pdgfbret/ret mice may also contribute to the higher PO2 levels we detected in cortical Layer 2/3. Though there is potentially less oxygen extraction from the vessels in Pdgfbret/ret mice, this does not cause significant tissue hypoxia in adult brain tissue at rest (no accumulation of HIF-1α, was detected; Supplementary Fig. 3). However, Pdgfbret/ret mice have a limited metabolic and oxygen reserve in skeletal muscle, and their performance is reduced in a physical exhaustion test. 25 Therefore, we expect that Pdgfbret/ret mice are more likely to suffer brain hypoxia during metabolic challenges, such as ischemic stroke.
It should be noted that the Pdgfbret/ret mice have increased cardiac output and heart muscle size to maintain a normal blood pressure with dilated vessels. 25 There is no change in resting heart rate in Pdgfbret/ret mice, 25 so the reduced cerebral RBC velocities we observed are likely not caused by a decreased heart rate (Figure 2). Analysis of mesenteric arteries in Pdgfbret/ret mice found a normal response to vasodilators and vasoconstrictors, suggesting typical resistance vessel capabilities. 25 However, our results with vasodilator, acetazolamide, suggest the brain has a limited capacity for increased perfusion in Pdgfbret/ret mice (Figure 5). Decreased responses to acetazolamide in Pdgfbret/ret mice may occur because ensheathing pericytes are lost from the arteriole-capillary transition zone. While the response of ensheathing pericytes to acetazolamide has not yet been directly studied, multiple lines of evidence suggest that these pericytes express the contractile protein machinery2,13,16 for rapid changes in vessel diameter and that they are the main cells to dilate during neurovascular coupling.3,7,11,12 Therefore, the reduced perfusion we observed in response to acetazolamide in Pdgfbret/ret mice may occur because ensheathing pericytes that induce vasodilation within this region are lost and only smooth muscle cells on large arteries remain.
There are several limitations to this study. First, we used isoflurane anesthesia, which is known to affect neurovascular coupling 67 and increase mean blood PO2 levels. 52 As a result, anesthesia may have altered the hemodynamics and elevated the oxygen concentrations measured here. Furthermore, we did not measure blood pressure nor blood gasses such as CO2 during the experiments. Blood pressure is known to be similar between Pdgfbret/ret and control mice 25 , but nevertheless, variations in pressure and blood gasses between animals could have affected our results. Finally, we found that Pdgfbret/ret mice had a deficient response to a cerebrovascular reactivity challenge, and further differences may emerge when considering other parameters such as neurovascular coupling and the response to sensory stimuli, particularly relating to oxygen consumption by the tissue.
In conclusion, Pdgfbret/ret mice are a useful model to study hemodynamics of vasculature presenting a severe pericyte deficiency. These alterations in brain hemodynamics are similar to other mouse models with significant pericyte loss.55,56 Pericyte loss and dysfunction is commonly reported across multiple pathologies including Alzheimer’s Disease,18,19 ischemic stroke6,20 and diabetic retinopathy 23 , leading to reduced cerebral perfusion. In particular, vascular abnormalities during arteriovenous malformations are associated with pericyte-deficiency and show similarities in vascular structure to Pdgfbret/ret mice (e.g. reduced branching and capillary network).21,22 Future studies will provide new information about how pericyte loss and vascular malformations contribute to neurovascular coupling, vascular health, and brain circuit activity, which has potential implications for pathology, such as arteriovenous malformations.
Supplemental Material
sj-pdf-1-jcb-10.1177_0271678X221147366 - Supplemental material for Altered hemodynamics and vascular reactivity in a mouse model with severe pericyte deficiency
Supplemental material, sj-pdf-1-jcb-10.1177_0271678X221147366 for Altered hemodynamics and vascular reactivity in a mouse model with severe pericyte deficiency by Jillian L Stobart, Eva Erlebach, Chaim Glück, Sheng-Fu Huang, Matthew JP Barrett, Max Li, Sergei A Vinogradov, Jan Klohs, Yvette Zarb, Annika Keller, Bruno Weber in Journal of Cerebral Blood Flow & Metabolism
Footnotes
Funding
The author(s) disclosed receipt of the following financial support for the research, authorship, and/or publication of this article: B.W. was supported by the Swiss National Science Foundation and is a member of the Clinical Research Priority Program of the University of Zurich on Molecular Imaging. A.K. was supported by the Swiss National Science Foundation (grant 31003A_159514, 310030_188952) and Swiss Multiple Sclerosis Society. J.L.S. was supported by postdoctoral fellowships from the Heart and Stroke Foundation of Canada and the University of Zurich Forschungskredit. JK received funding from the Swiss National Science Foundation (320030_179277), in the framework of ERA-NET NEURON (32NE30_173678/1), and the Synapsis Foundation.
Acknowledgements
We acknowledge the technical assistance of Diana Kindler.
Declaration of conflicting interests
The author(s) declared no potential conflicts of interest with respect to the research, authorship, and/or publication of this article.
Authors’ contributions
Conceptualization, J.L.S., A.K. and B.W.; Methodology, S.V.; Software, M.J.P.B; Investigation, J.L.S., C.G., S-F.H., E.E., J.K. Y.Z. and M.L.; Formal Analysis, J.L.S., J.K. and E.E.; Writing – Original Draft J.L.S.; Writing – Review & Editing, J.L.S., C.G., E.E., A.K., and B.W.; Funding Acquisition, B.W., A.K., J.K.
Supplementary material
Supplemental material for this article is available online.
References
Supplementary Material
Please find the following supplemental material available below.
For Open Access articles published under a Creative Commons License, all supplemental material carries the same license as the article it is associated with.
For non-Open Access articles published, all supplemental material carries a non-exclusive license, and permission requests for re-use of supplemental material or any part of supplemental material shall be sent directly to the copyright owner as specified in the copyright notice associated with the article.