
Abstract
Due to its cardiovascular effects sedentary behaviour might impact cerebrovascular function in the long term, affecting cerebrovascular regulatory mechanisms and perfusion levels. Consequently this could underly potential structural brain abnormalities associated with cognitive decline. We therefore assessed the association between sedentary behaviour and brain measures of cerebrovascular perfusion and structural abnormalities in community-dwelling older adults. Using accelerometery (GENEActiv) data from The Irish Longitudinal Study on Ageing (TILDA) we categorised individuals by low- and high-sedentary behaviour (≤8 vs >8 hours/day). We examined prefrontal haemoglobin oxygenation levels using Near-Infrared Spectroscopy during rest and after an orthostatic challenge in 718 individuals (66 ± 8 years, 52% female). Global grey matter cerebral blood flow, total grey and white matter volume, total and subfield hippocampal volumes, cortical thickness, and white matter hyperintensities were measured using arterial spin labelling, T1, and FLAIR MRI in 86 individuals (72 ± 6 years, 55% female). While no differences in prefrontal or global cerebral hemodynamics were found between groups, high-sedentary individuals showed lower hippocampal volumes and increased white matter hyperintensities compared to their low-sedentary counterparts. Since these structural cerebral abnormalities are associated with cognitive decline and Alzheimer’s disease, future work exploring the causal pathways underlying these differences is needed.
Introduction
The neuropathology underlying Alzheimer’s disease (AD) and other dementias is characterised by structural and functional brain changes. 1 Regular physical exercise is demonstrated to positively impact some of these parameters.2,3 Absence of these protective effects in physically inactive persons might explain the impact of physical inactivity on the increased risk of AD caused by multiple modifiable risk factors. 4 In addition to absence of exercise, physical inactivity also relates to high levels of sedentary behaviour (SB; awake behaviour in a sitting posture characterised by an energy expenditure ≤1.5 metabolic equivalents (METs)), which may be a risk factor for cognitive impairment in its own right.
The past few years studies have therefore started to explore the effects of SB on the brain as well. Siddarth et al. for example found a negative association between SB and total medial-temporal lobe thickness. 5 Additionally, lower brain volumes were found for people who were highly sedentary compared to their low-sedentary counterparts, 6 as well as a negative association between SB and frontal cerebral blood flow (CBF). 7 Some of these studies however used subjective measures of SB, small sample sizes, or only looked at a single outcome measure. We therefore aim to generate a broad overview of the associations between objective SB and multiple structural MRI brain measures, using data from The Irish Longitudinal Study on Ageing (TILDA). Moreover, we hypothesise that excessive exposure to prolonged SB might impact vascular function in the long term, affecting cerebrovascular regulatory mechanisms and cerebral perfusion levels. In consequence this could underly potential structural brain abnormalities that result in the risk of cognitive decline. Therefore, we also investigated if participants with higher levels of objective SB had lower levels of cerebral perfusion, and a reduced capacity to maintain stable prefrontal haemoglobin oxygenation levels after an orthostatic challenge.
Methods
Dataset and participants
TILDA is a large cohort study of older adults with multiple waves of data collection which started data collection in 2009. Ethical approval for TILDA was received from the Health Sciences Research Ethics Committee at Trinity College Dublin, Dublin, Ireland, and conducted in accordance with the Declaration of Helsinki of 1975, as revised in 2008, for additional details see. 8 All participants gave written informed consent. In the first wave, data from 8,504 eligible community-dwelling adults aged 50+ and their spouses (excluded in this study if aged <50 years) was collected. 9 Data were collected via a computer-aided personal interview (CAPI), self-completion questionnaire (SCQ), and extensive nurse-administered health assessment. For this study we utilised the cross-sectional data from Wave 3 collected in 2014-2015. Of the participants who took part in the health assessment during this wave, approximately 30% (due to device availability) were randomly recruited to wear a GENEActiv accelerometer to objectively measure physical activity, SB, and sleep patterns. 9 Sample characteristics were broadly similar to the whole sample. 10 After the health assessment, a group of participants were invited to take part in an MRI substudy. For the MRI substudy additional ethics approval was granted (St James’s Hospital/Adelaide and Meath Hospital, inc. National Children’s Hospital, Tallaght Research Ethic Committee, Dublin, Ireland). Additional informed consent for the TILDA MRI substudy was provided by all participants. Initially participants aged 65+ were prioritised during recruitment, later participants aged 50-64 years were targeted.9,11 This resulted in the inclusion of 578 participants. Sample characteristics and response rates of the different waves have been reported previously. 9 Participants with Parkinson’s disease, a history of stroke, or in need of a proxy interview were excluded in this analysis.
GENEActiv accelerometer
To measure objective SB levels, participants were asked to wear a triaxial GENEActiv accelerometer (Gravity Estimator of Normal Everyday Activity, ActivInsights, Ltd, Cambridgeshire, UK) for seven full consecutive days on their non-dominant wrist. With the accelerometers being light weight and water resistant, participants were asked to wear them 24/7. The data, with a sampling frequency of 100Hz, was converted to epochs of 15 seconds. With a previously validated algorithm sleep time was identified and excluded. 10 SB was extracted from the data with a modified version of the Sedentary Sphere, where time is classified based on activity intensity and posture determined by arm elevation. 12 Sedentary time, categorised as low activity intensity (<95) and horizontal arm elevation, was calculated per day and averaged over the wear period. The health effects of SB are unlikely characterised by a linear relationship. 13 Based on earlier observations, the effects of SB are especially detrimental for health after eight hours of sitting. Exceeding eight hours of SB, additional sitting time greatly increases the hazard ratio of all cause and cardiovascular disease mortality. 14 Given this non-linear effect, a pre-defined cut-off was used to make a dichotomous variable dividing people with ≤8 hours of SB a day (‘low-SB’) or >8 hours of SB a day (‘high-SB’).
Near-infrared spectroscopy
During the health assessment, haemoglobin oxygenation levels in the prefrontal cortex were continuously measured at 50Hz by NIRS using a Portalite (Artinis Medical Systems, Zetten, The Netherlands) device. With three infrared light transmitters and one receiver in a single probe placed on the participant’s forehead (FP1 position of the ten-twenty electrode system), oxygenated (02Hb) and deoxygenated (HHb) cerebral haemoglobin concentrations were determined based on spatially resolved spectroscopy. 15 With these levels the tissue saturation index (TSI) was calculated (O2Hb/(O2Hb + HHb) × 100), expressed as a percentage. Continuous resting-state cerebral oxygenation levels were measured during five minutes of supine rest. 16 Data was downsampled to 5Hz, filtered, and mean values were taken from the last minute of this five minute period.
After resting in a supine position for approximately 10 minutes, participants were asked to stand, assisted by a research nurse if needed, to assess responses to an orthostatic challenge. Oxygenation levels were continuously monitored during this transition and measured for an additional three minutes, while participants stood quietly. 15 Data was recorded using Oxysoft software (V3.0.53), Artinis Medical Systems, Zetten, The Netherlands), and processed with MATLAB (R2018a, TheMathWorks, Inc., MA, USA). Active stand data was downsampled to 1Hz, and filtered with a 10-second moving average and median filter. Active stand values at 10-second intervals were taken and used relative to the mean baseline supine values obtained 60-30 seconds before standing.
MRI protocol and acquisition
MRI data were acquired with the use of a 3T scanner (Achieva TX, Philips, The Netherlands) with 32-channel head coil at the National Centre for Advanced Medical Imaging (CAMI) at St. James’s Hospital in Dublin. T1-weighted scans were acquired using a 3D Magnetisation-Prepared Rapid Gradient Echo (MP-RAGE) sequence (FOV(mm): 240x240x162; SENSE factor: 2; TR: 6.7 ms; TE: 3.1 ms; flip angle: 8°; voxel size(mm): 0.8x0.8x0.9). 17 Images were analysed with FreeSurfer v.6.0, 18 and inspected by a trained operator for motion artifacts and lesions. Total volumetric data (mm3) for grey and white matter, as well as hemisphere-wise hippocampal volume were calculated with the FreeSurfer recon-all processing pipeline. Global cortical thickness was measured as the mean distance (mm) between the white matter surface and pial surface. The hippocampal subfield option, described previously, 19 was used to segment the hippocampus into eleven subfields. In short, this procedure uses a probabilistic atlas based on ex-vivo manual segmentations and in-vivo T1 scans, to segment new T1 images based on probabilities. 11 Segmentations were checked by trained operators. 11 All volumetric analyses were corrected for estimated total intracranial volume (eTIV), calculated based on the method of Buckner et al. 20
Fluid attenuated inversion recovery (FLAIR) images were acquired using a 2D turbo spin-echo sequence (FOV (mm): 230x230; TR: 11000 ms; TE: 125 ms; TI: 2800 ms; flip angle: 90°; number of slices: 30; slice thickness: 4 mm; slice gap: 1 mm; voxel size (mm): 0.45x0.45). 21 One trained radiologist scored all images with the Scheltens scale to grade WMHs, with a part (n = 100) independently scored by two radiologist (strong coefficient of agreement, 0.82). 22 The Scheltens visual rating scale is a semi-quantitative method to calculate the extent of white matter disease that is well validated and commonly used. 23 Participants under 65 years of age were excluded from this scoring system. Scores were applied per region (three periventricular regions, four lobar white matter areas, basal ganglia, and infratentorial region) and summed to get a global score for WMHs.
Lastly, a pseudo-continuous arterial spin labeling (pCASL) MRI scan was used to measure global grey matter CBF. Detailed acquisition and analysis methods have been described by Knight et al. 24 Briefly, 30 image pairs were acquired, alternating with and without arterial spin labelling (ASL) resulting from a magnetic inversion plane positioned at the neck. For this 2D multi-slice single shot echo-planar imaging with background suppression was used (FOV (mm): 240x240; TR: 4000 ms; TE: 9 ms; flip angle: 90°; number of slices: 13; slice thickness: 8 mm; slice gap: 1 mm; voxel size (mm): 3x3; SENSE factor: 2.5). During the analysis in Oxford_ASL (FMRIB Software Library, FSL; The University of Oxford, UK), perfusion-weighted images were generated by subtracting control and tagged images, after correcting for magnetic field inhomogeneities. Absolute CBF values per voxel (ml/100g/min) for global grey matter were calculated based on separately-acquired proton density images (same geometry as the pCASL scans, with TR: 10000 ms; TE: 9 ms), using T1-weighted data for brain extraction and tissue segmentation.
Covariates
Based on the strategy proposed by VanderWeele 25 several variables, associated with either SB and/or brain measures, collected during the CAPI and SCQ were used as confounders in this study: age, sex, education (none/primary, secondary, tertiary/higher), smoking (never, past/current), potential alcohol problems (CAGE questionnaire: 0/1 no, 2–4 yes, no response), BMI measured during the health assessment, self-reported cardiovascular conditions (none, one or more of the following conditions: angina, hypertension, myocardial infarction, cardiac failure, diabetes, transient ischemic attack, high cholesterol, cardiac murmur, or cardiac arrhythmia), self-reported anti-hypertensive drug (AHD) use, 26 depressive symptoms (CES-D8), and objectively measured moderate-to-vigorous physical activity (MVPA; extracted with the Sedentary Sphere for time with activity intensity of >202). To characterise the sample, the mini-mental state examination (MMSE) was used as a global measure of cognitive function, assessed during the CAPI, as well as the Montreal Cognitive Assessment (MoCA) and average seated systolic and diastolic blood pressure (SBP/DBP) assessed twice with an Omron monitor (Omron Healthcare Inc., Kyoto, Japan) during the health assessment.
Statistical analysis
Regression analysis was used to assess the cross-sectional association between low- and high-SB individuals and resting state NIRS as well as the MRI outcome measures. Three models, differing in confounders adjusted for, were used; model 1 adjusted for age, sex, and education, model 2 additionally adjusted for smoking, alcohol use, BMI, cardiovascular conditions, AHD use, and depression. The literature is inconclusive about the potential confounding role of MVPA on health associations of SB, due to the potential collinearity between the two and risk of collider bias. 27 Therefore, we used a final model (3) to additionally adjust for objectively-measured MVPA. Models regressing grey matter, white matter, hippocampal total, and hippocampal subfield volumes on SB were also corrected for eTIV. Hippocampal subfield volumes were analysed with a linear mixed model with subfields nested in hemispheres, nested in participants. 11 Interactions between the categorical variable subfield and SB were used to assess the effect of SB on each subfield volume.
NIRS active stand data was analysed with a linear mixed effects model with time points nested within participants. TSI change relative to baseline over time after standing is characterised by a drop, followed by a rapid recovery phase and later more stable recovery phase. Therefore, time was parameterised using linear splines with knots at 10, 20, 30, and 50 seconds from standing up. Main and interaction terms of all covariates with the time variables were included in the model, with the interaction between time and SB representing the effect of sitting on the rate of TSI drop and recovery after standing. An autoregressive correlation matrix was used for the residual errors to account for the fact that closer time points are more strongly correlated. On top of the confounders previously mentioned, height was additionally corrected for in this NIRS active stand analysis. A sensitivity analysis was conducted with an additional correction for the variable time participants took to stand, which has been calculated by O’Connor et al. based on the height correction unit from the Finometer data simultaneously collected. 28
Residuals were checked for normality and heteroscedasticity with Shapiro-Wilk tests. Deviations from normality were only seen for the WMHs, which were counterbalanced by transforming (square root) the outcome variable. Since the results after this transformation were similar, for ease of interpretation the untransformed regression results are shown. For visual representation estimated marginal means were used in the figures to show the adjusted means of specific models for both the low- and high-SB group. All analyses were performed in Stata 15.1 (StataCorp: Release 15. StataCorp LLC, College Station, USA), with two-sided testing and p-values less than 0.05 considered significant.
Results
At wave 3, 1,596 participants wore an accelerometer as part of the health assessment. Data from participants who wore the accelerometer on their dominant hand, had recording issues, or had invalid sleep times were excluded (Figure 1). Of the remaining 1,294 valid records, both valid resting state NIRS and active stand data were present in 718 participants. A subsample of 112 participants of the 1,294 individuals with accelerometer was also part of the MRI substudy, with 86 complete valid cases (Figure 1). The characteristics of both the NIRS and MRI sample are presented in Table 1. The group with both accelerometer and MRI data was slightly older, caused by the prioritisation given to participants of 65 years of age and over during the initial recruitment procedure of this subsample.
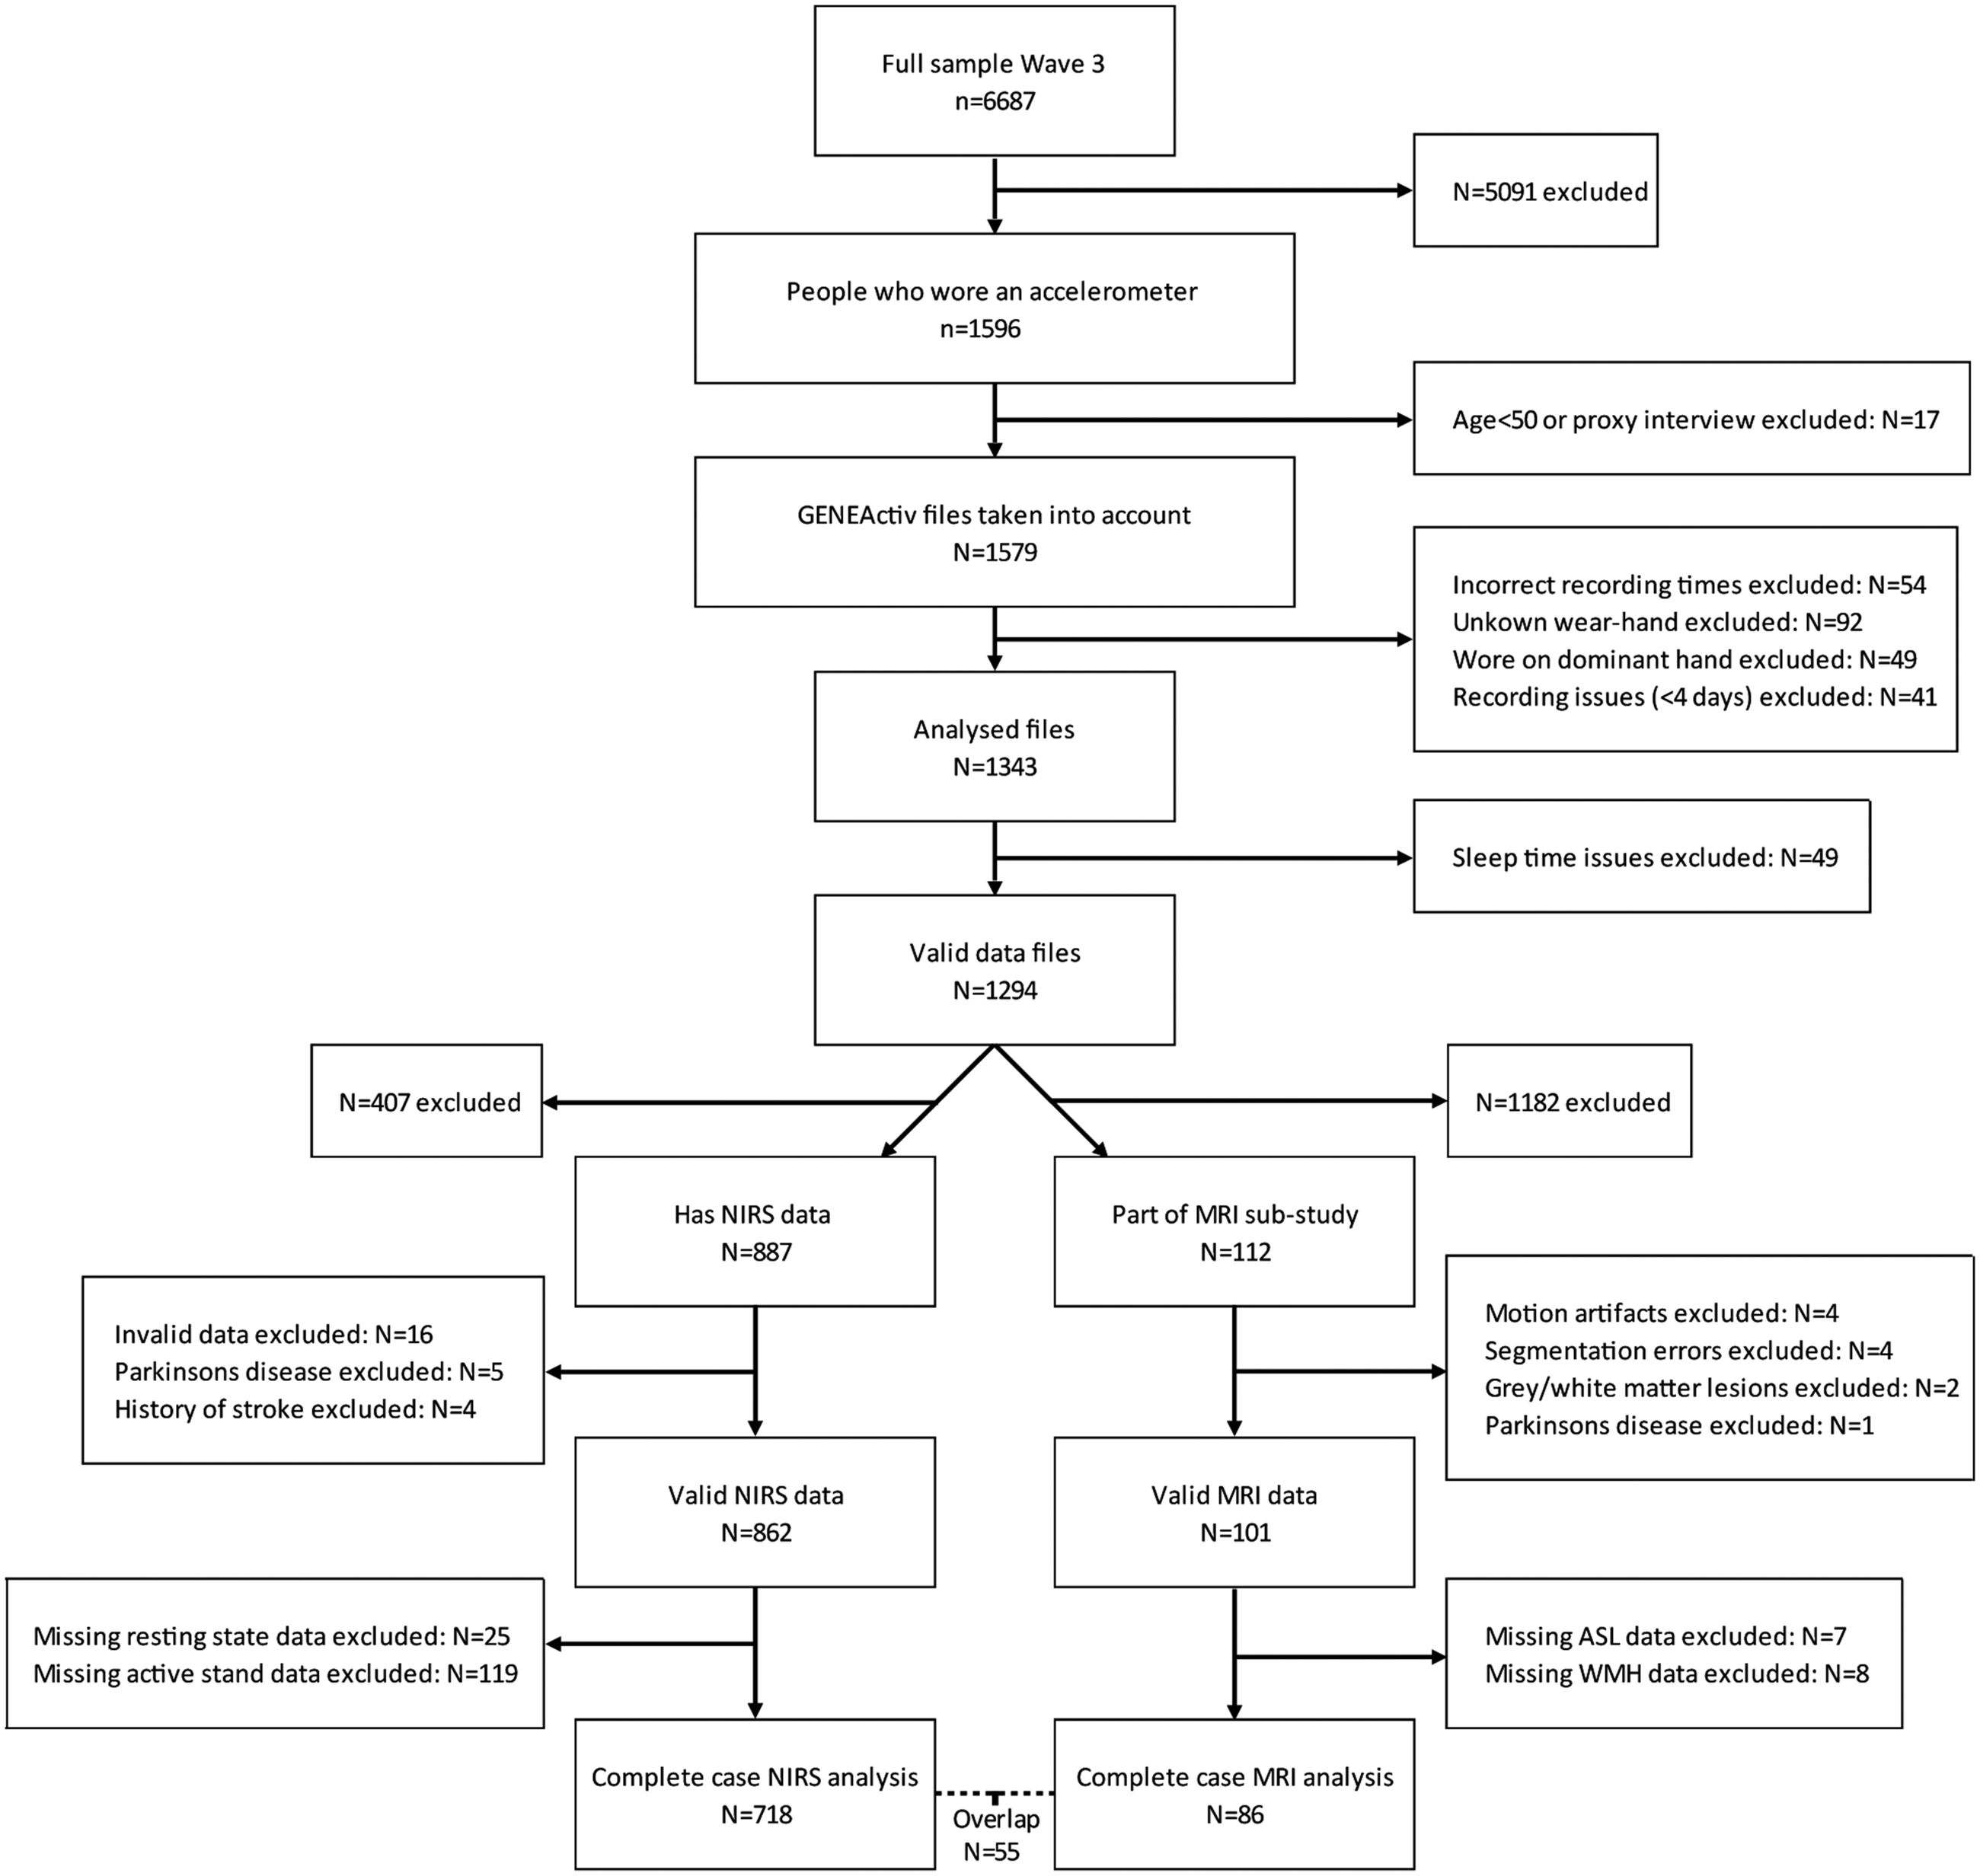
Flow chart sample.
Participant characteristics of the two analysis samples by sedentary group.
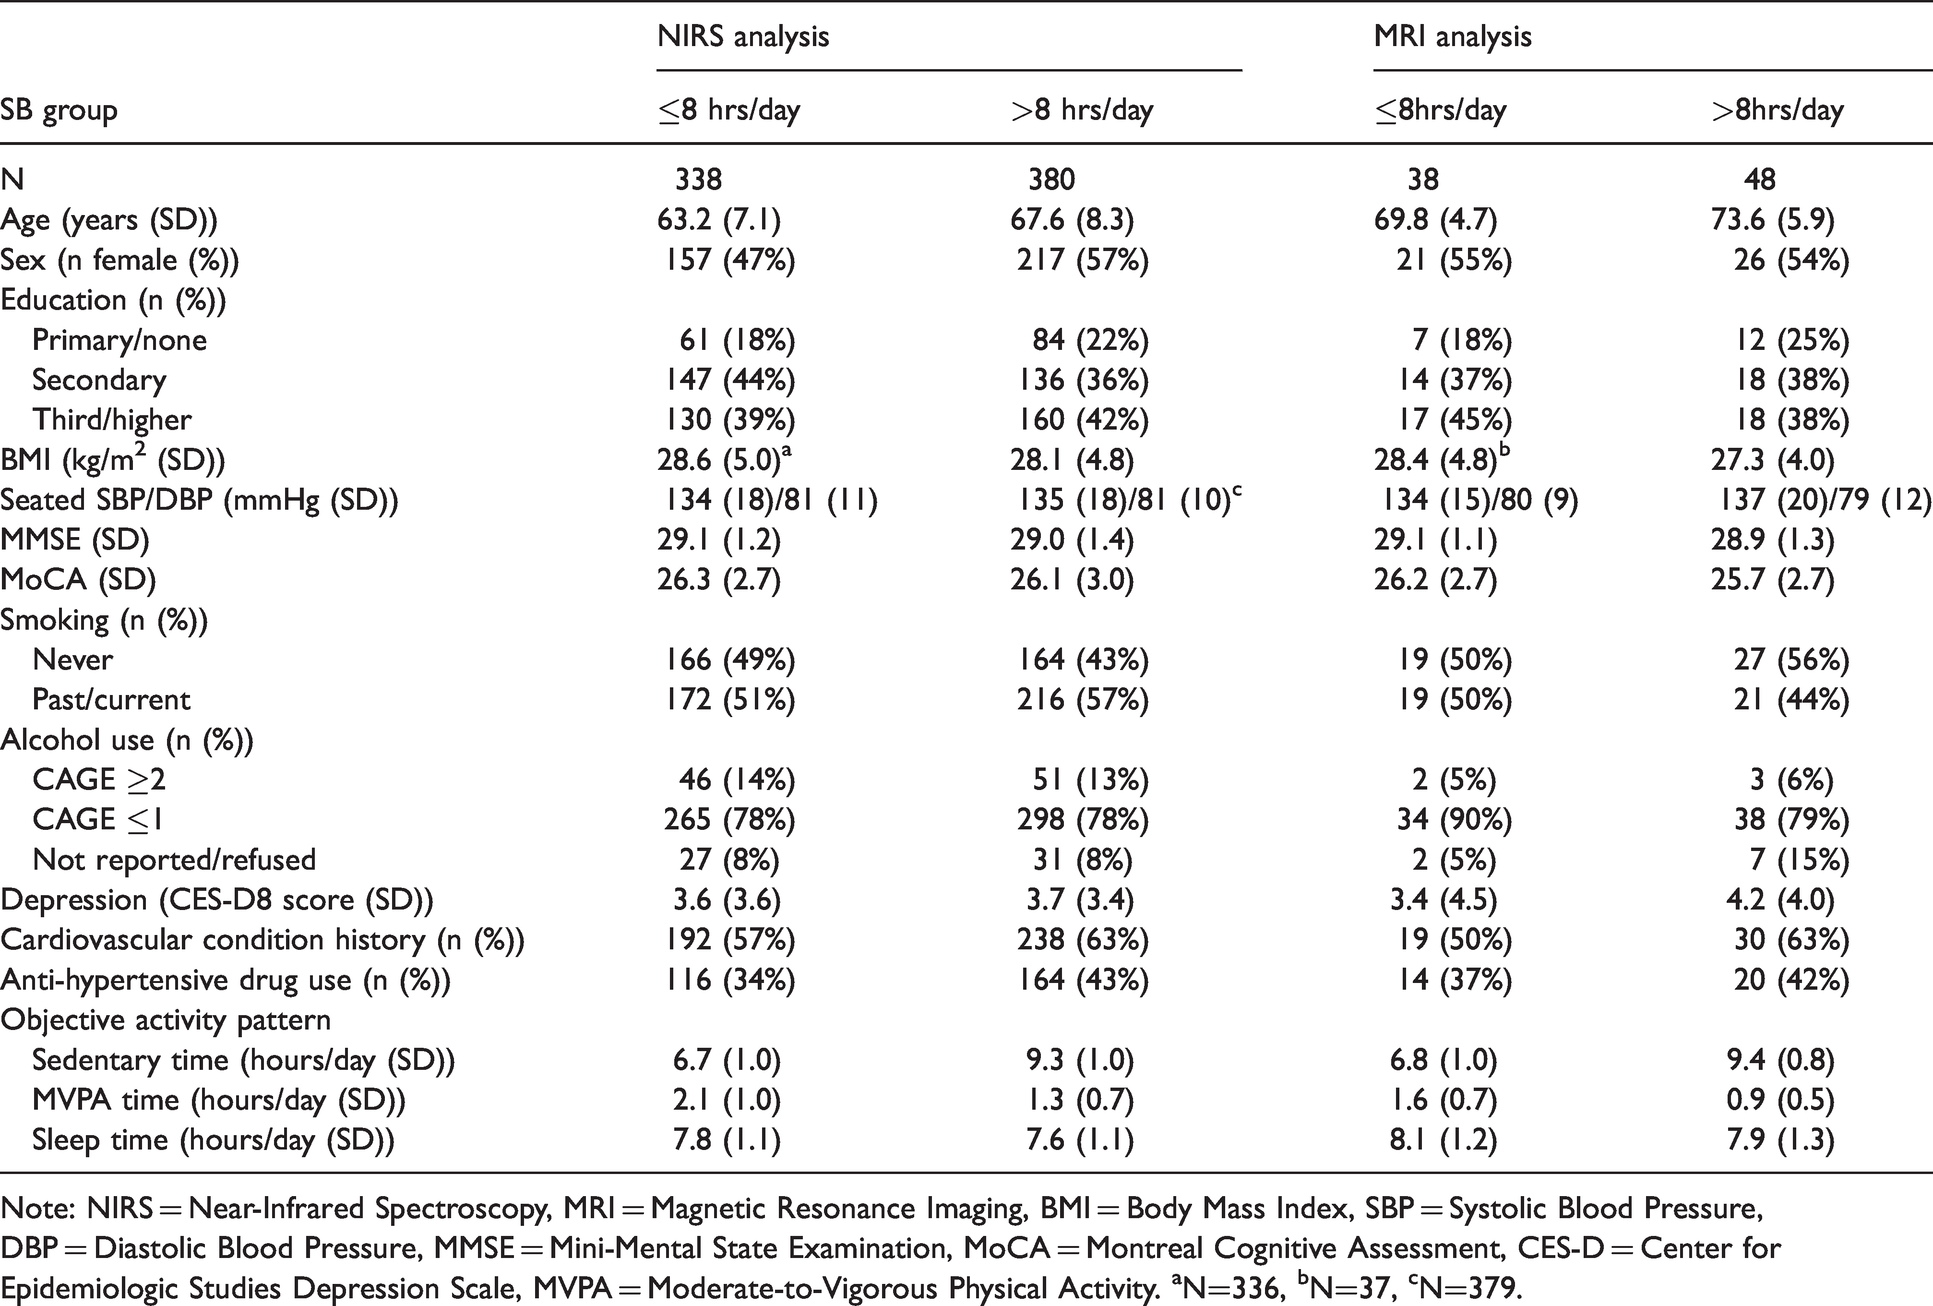
Note: NIRS = Near-Infrared Spectroscopy, MRI = Magnetic Resonance Imaging, BMI = Body Mass Index, SBP = Systolic Blood Pressure, DBP = Diastolic Blood Pressure, MMSE = Mini-Mental State Examination, MoCA = Montreal Cognitive Assessment, CES-D = Center for Epidemiologic Studies Depression Scale, MVPA = Moderate-to-Vigorous Physical Activity. aN=336, bN=37, cN=379.
Prefrontal oxygenation and global perfusion
No differences between low- and high-SB participants were seen for TSI levels, representing prefrontal oxygenation, during rest (Model 1: −0.13 (95% CI −0.88;0.63), p = 0.74; Model 2: −0.07 (95% −0.82;0.68), p = 0.86; Model 3: −0.23 (95% CI −1.04;0.57), p = 0.57). TSI levels after an orthostatic challenge, i.e. the active stand, were similar for both groups as well (Figure 2). This was the case across all three models, and independent of additional correction for standing time (data not shown). Examining global perfusion using MRI, total grey matter CBF was not different between groups (Figure 3).
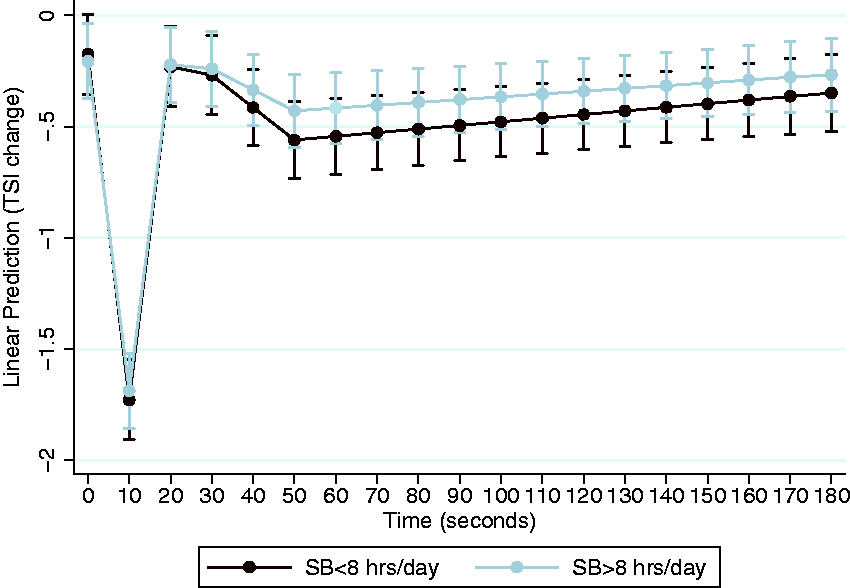
Hemodynamic response during active stand. Results shown are TSI change from baseline (%) during active stand for participants with more or less than eight hours of SB a day from model 2, corrected for age, sex, education, height, standing time, smoking, alcohol use, BMI, cardiovascular conditions, AHD use, and depression. N = 716 due to 2 cases with missing BMI.
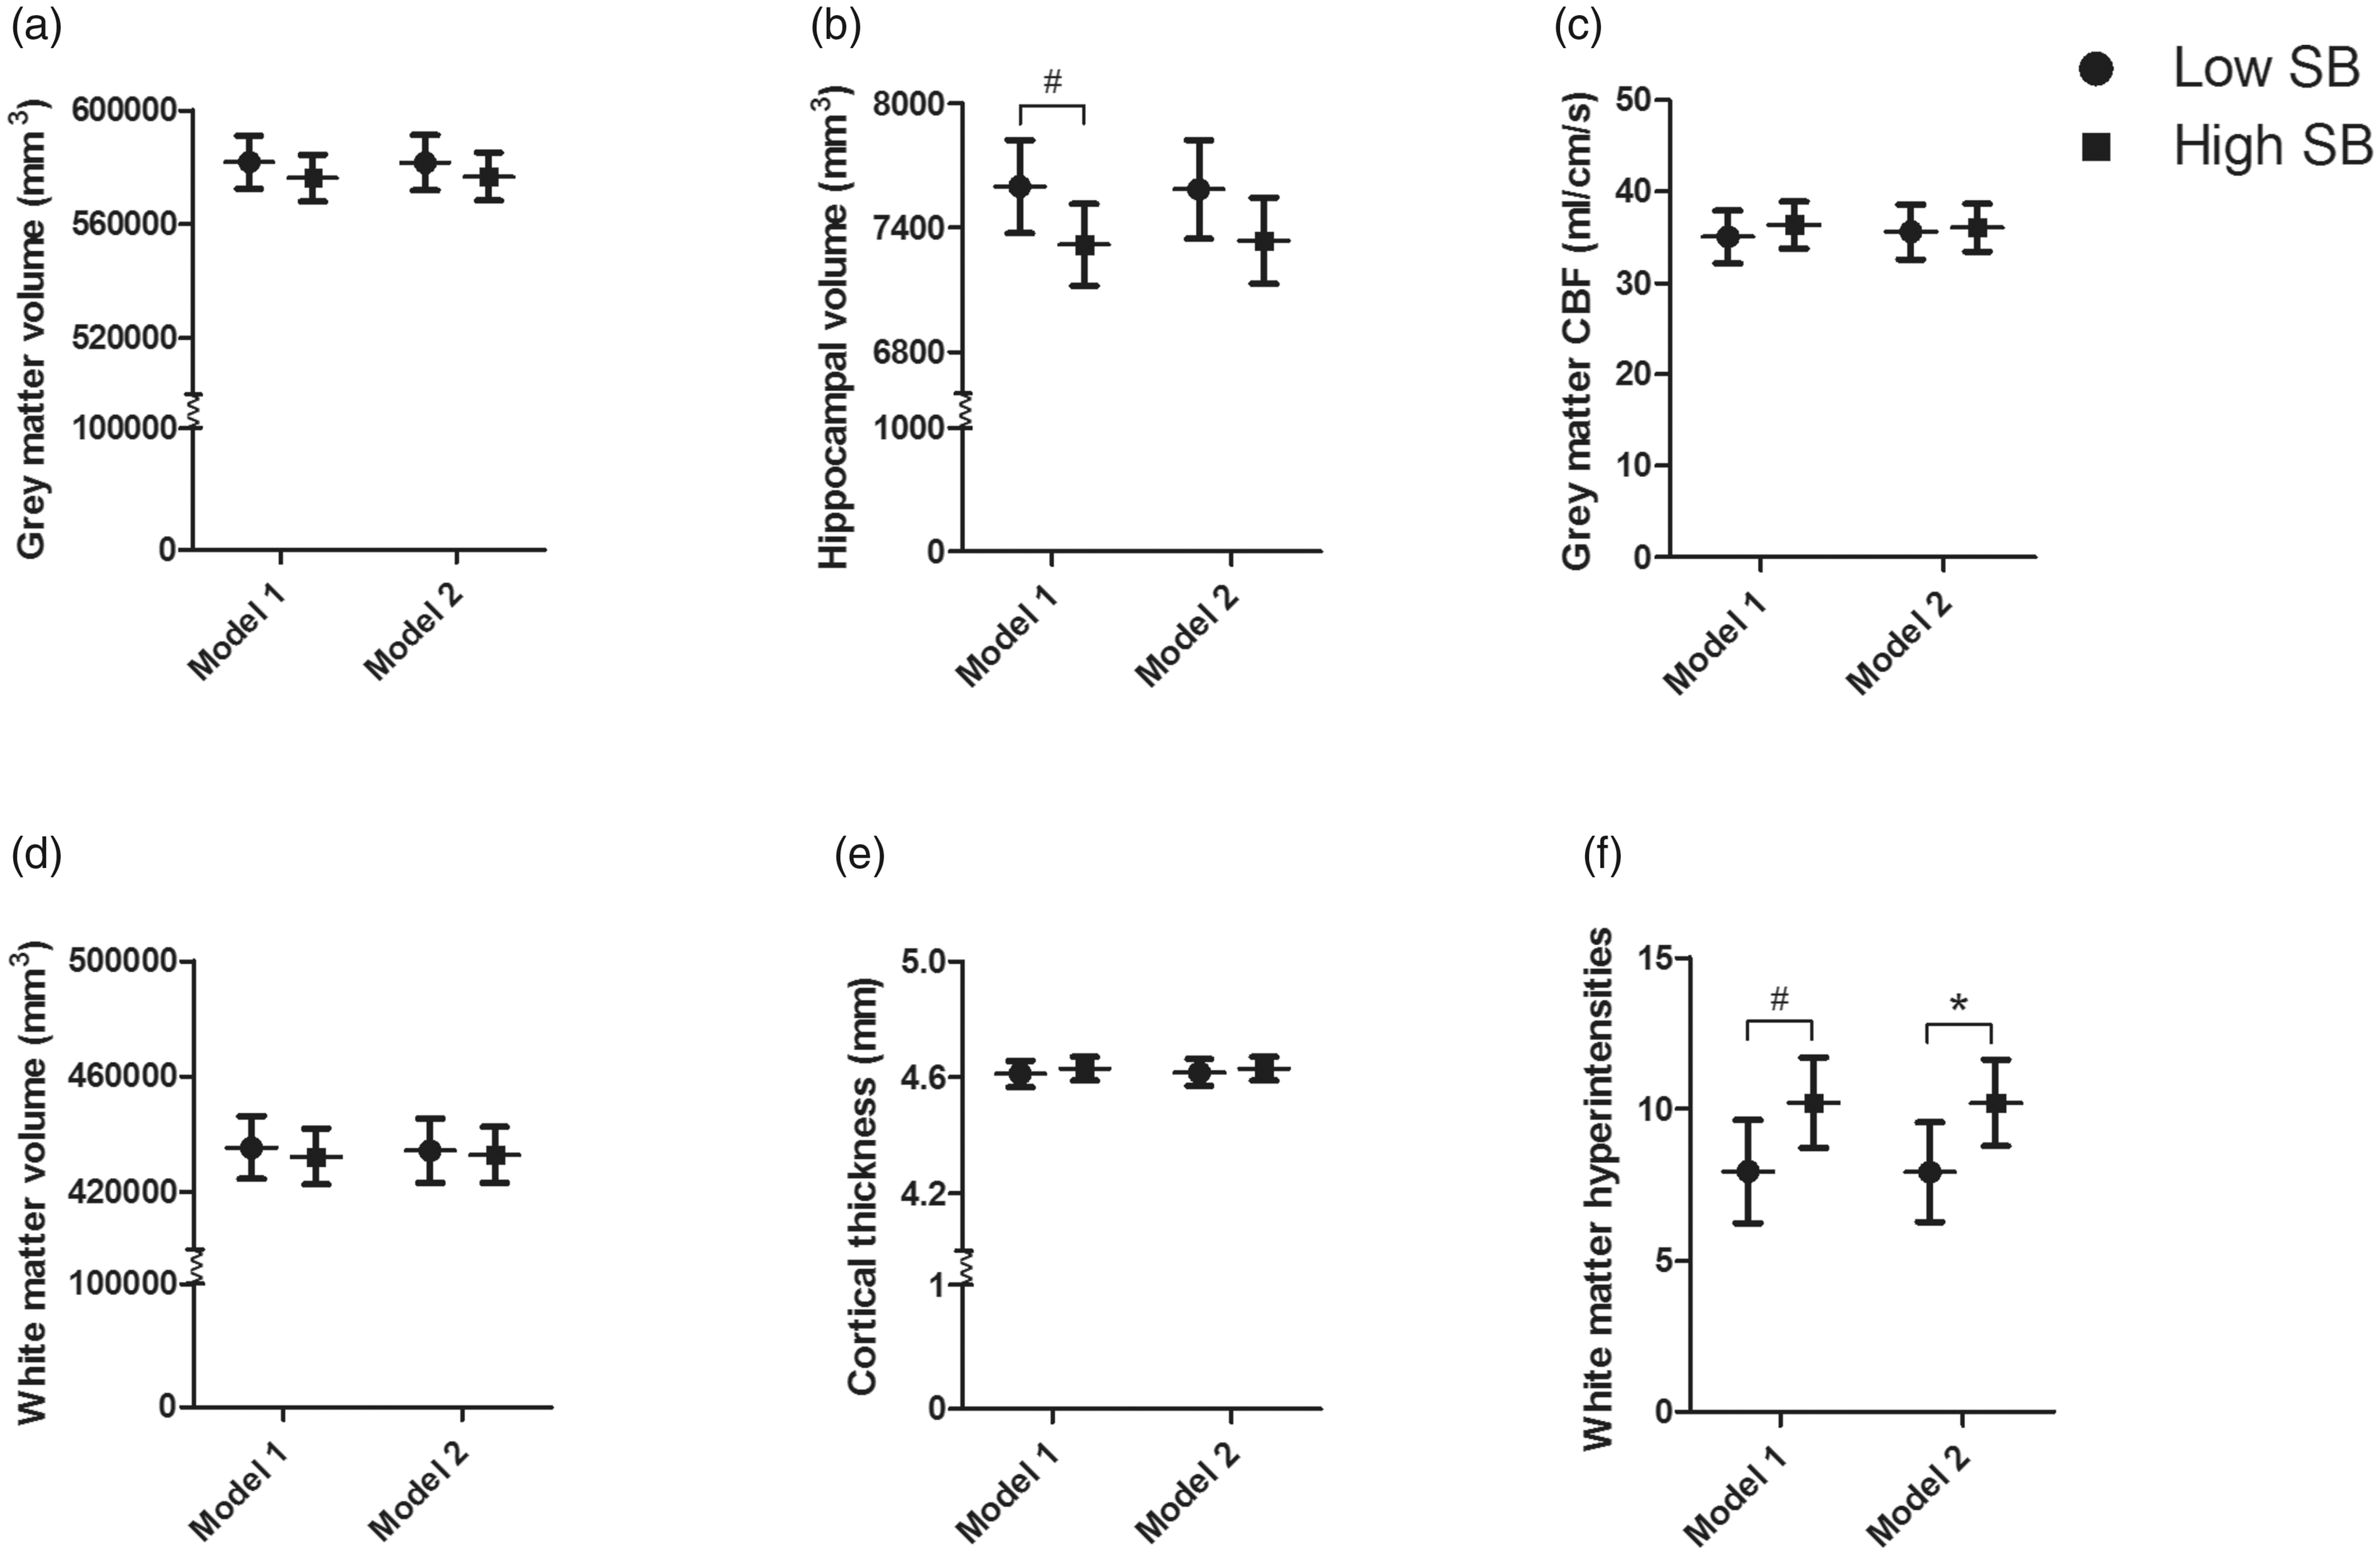
Estimated marginal means of low- and high-SB for six MRI outcome measures. Results represent the estimated marginal means (95% CI) of less (low-SB) or more (high-SB) than eight hours of SB a day. Model 1 corrected for age, sex, education, and eTIV (only for grey matter, white matter, and hippocampal volume). Model 2 additionally corrected for smoking, alcohol use, BMI, cardiovascular conditions, AHD use, and depression. A grey matter volume, B hippocampal volume, C grey matter CBF, D white matter volume, E cortical thickness, F WMHs. Model 1 N=86, Model 2 N=85. *significant p<0.05, #trend p<0.10.
Structural brain measures
No differences between groups were observed for total grey matter volume, total white matter volume, or cortical thickness (Figure 3). However, a trend towards a lower hippocampal volume in the high-SB individuals was found (model 1: −282 mm3 (95% CI −591;27), p = 0.07). This difference was no longer observed after controlling for MVPA in model 3 (see Supplementary Table 1 for full model estimates). The hippocampal subfield analysis showed that high-SB individuals had significantly lower volumes in three subfields in model 2: tail (−35 mm3 (95% CI −49;−21), p < 0.001), CA1 −18 mm3 (95% CI −32; −4), p = 0.01), and molecular layer HP (−20 mm3 (95% CI −34;−6), p = 0.01) (Figure 4 shows the results from model 1, which were similar to model 2 (data not shown)). After correction for MVPA (model 3), only a difference in tail volume remained significant between the low- and high-SB group (−26 mm3 (95% CI −42; −10), p < 0.01). Lastly, a higher WMH burden was present in the high-SB group (Figure 3), for which a trend remained present after correcting for MVPA (2.4 (95% CI −0.2; 5.0), p = 0.08) in model 3.
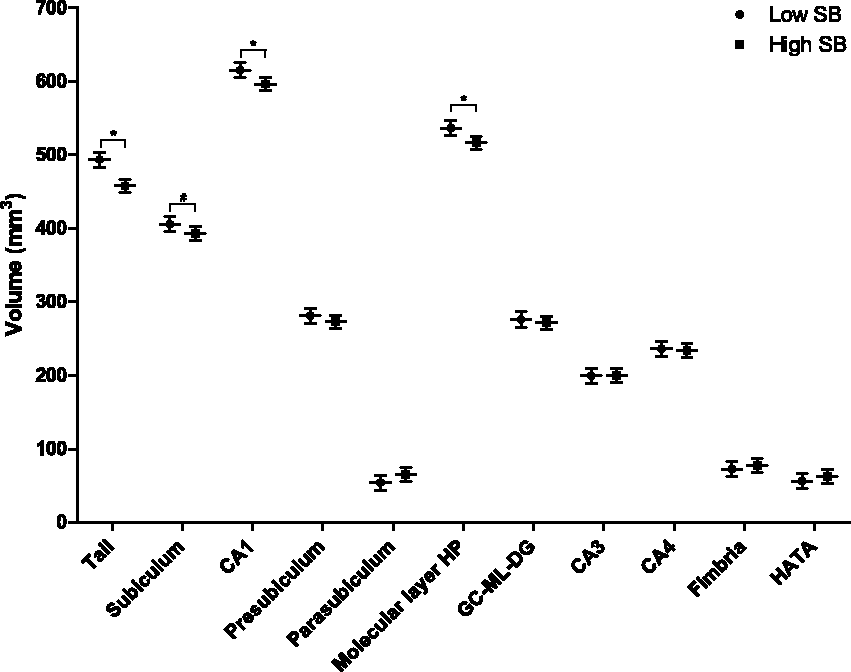
Estimated marginal means of low- and high-SB for hippocampal subfield volumes. Results represent the estimated marginal means (95% CI) of less (low-SB) or more (high-SB) than eight hours of SB a day for the volumes of eleven hippocampal subfields from model 1, corrected for age, sex, education, eTIV. N=86. *significant p<0.05, #trend p<0.10.
Discussion
The aim of this cross-sectional study was to compare cerebrovascular hemodynamics and structural brain measures between low-SB (≤8 hours/day) and high-SB (>8hours/day) older adults using both NIRS and MRI techniques. For cerebral hemodynamics, we found no differences in global grey matter CBF, resting state prefrontal haemoglobin oxygenation levels, or prefrontal oxygenation responses to an orthostatic challenge between low-SB and high-SB individuals. For structural brain measures, global grey and white matter volumes were not different between groups either. However, our results suggest lower hippocampal total and specific subfield volumes in high-SB individuals compared to the low-SB group. Lastly, high-SB individuals showed more WMHs compared to their low-SB counterparts. Taken together, SB in older individuals is associated with structural cerebral abnormalities (i.e. hippocampal atrophy and WMHs), suggestive of early onset neurodegenerative disease. This may place these individuals who are sedentary at increased risk for future cognitive decline. However, we found no indications that these structural abnormalities were related to changes in global CBF, or cerebral hemodynamic regulation.
Hippocampal atrophy, which results in memory loss, is one of the earliest neurological changes seen years before a clinical AD diagnosis. 29 Specifically, one of the subfields found to be associated with SB, CA1, is considered to be most affected in these preclinical stages of AD. 30 Even though only a trend towards lower total hippocampal volume was seen in the high-SB individuals, the effect size and hippocampal subfield volumes point towards a clinically relevant difference. Previous results linking SB to reduced medial temporal lobe thickness, 5 support our finding of lower hippocampal volume in high-SB participants. Although correcting for MVPA caused most of these associations to become insignificant, the adjustment for MVPA in research on SB is controversial due to their potential collinearity and the risk of collider bias. 27 More research on causal pathways is therefore needed to better understand the potential impact of SB and MVPA on each other and the brain. In addition to the lower hippocampal volume in high-SB individuals, we also found higher levels of WMHs (difference of 2.3 in Scheltens score). Such a positive association was also found by two previous studies using subjective measures for SB.6,31 Importantly, high levels of WMHs represent a characteristic associated with preclinical AD and increased risk of cognitive decline. 32 This effect size was comparable to differences found between the age groups 65-74 and 74-85 year olds (Scheltens score 17.0 vs 19.3) in previous research. 33
Given that both hippocampal atrophy and WMHs are associated with an increased risk of dementia,32,34 it is important to raise the question what mechanism potentially underlies the differences between low- and high-SB individuals. One hypothesis explaining this physiological pathway is based on the known acute BP-raising effect of uninterrupted periods of SB. 35 Excessive repeated exposure to these increased BP levels could lead to structural cerebrovascular remodelling, 36 subsequently leading to hypoperfusion, 37 and ultimately impacting brain integrity in the long-term. Indeed, studies of hypertension have shown that chronic elevations in BP are associated with lower CBF. 38 However, our results showed no significant difference in BP levels and do not indicate lower levels of global perfusion in high-SB participants. Even after an orthostatic challenge, we found similar prefrontal cortex oxygenation levels between low- and high-SB individuals, indicating unaffected regulation mechanisms which were equally able to restore oxygenation to baseline in both groups. Therefore, our results do not endorse the hypothesis that SB would have detrimental effects on the brain via global hypoperfusion or cerebrovascular dysfunction. Nevertheless, it should be noted that we only measured prefrontal oxygenation and global grey matter perfusion, while regional CBF might be a better predictor of cognitive decline. 39 Therefore, it could still be true that regional perfusion levels (e.g. hippocampal blood flow) are affected by high levels of SB and thereby result in neurological changes. Zlatar et al. for example found negative associations between SB and frontal CBF. 7 At the same time, regional CBF changes might also reflect changes in metabolism (i.e. neuronal function) and therefore be a marker of neurodegeneration instead of an underlying cause. 40
A second hypothesis that might explain the differences in brain measures between low- and high-SB participants involves effects of SB via distinct pathways other than chronic hypoperfusion. SB is linked to multiple cardiovascular risk factors such as poorer insulin sensitivity and higher cholesterol levels.41,42 These risk factors in midlife have been associated with an increased risk of late life dementia. 43 Poor glycaemic control is for example considered to impair brain integrity by making the brain more susceptible to hypoglycaemia and thereby resulting in apoptosis of neuronal cells. 44 Moreover, high cholesterol levels are positively associated with WMHs, 45 although the pathways leading to and originating from these areas characterised by demyelination and axonal loss are still speculative. Cardiovascular risk factors that are the result of too much sitting, might thus be able to negatively impact brain health leading to the higher levels of atrophy and WMHs observed in this study. If this is the case, that would be beneficial for feasibility with regard to prevention, as e.g. postprandial responses are already improved when prolonged sitting is interrupted with short light-intensity walking breaks. 46
Lastly, the reverse hypothesis could also be true. Besides WMHs, hippocampal atrophy is one of the earliest neurological changes of AD seen in the pre-symptomatic stages. 29 In people without dementia, these reduced temporal lobe volumes were already associated with greater apathy symptoms. 47 As these structural brain abnormalities are accompanied by apathy and initiative loss, 48 they might thereby contribute to high levels of SB seen in dementia patients. 49 Accordingly, these structural brain abnormalities may be the cause for high levels of SB in our participants. This could potentially be plausible given the range in MoCA scores seen in the MRI subsample (i.e. mean(SD) of 25.9 (2.7) with min – max of 18 – 30). To support this hypothesis, the 28-year follow-up of the Whitehall II cohort, showed that up to nine years before the dementia diagnosis, PA levels began to decline, while the risk of dementia was not associated with preceding PA. 50 Therefore, one should consider that the direction of an association between SB and structural brain measures may work in the reverse or in both ways.
Strengths and limitations
Although this study used objective SB data, included a large number of participants, and combined NIRS and MRI measures, some limitations must be considered. Even though objective accelerometer data was used, a thigh-worn device may be better for assessing SB due to its ability to discriminate postures. Secondly, a global measure of ASL-measured grey matter perfusion was used and NIRS only captures the oxygenation of a relatively small volume below the scalp. Therefore, cerebral perfusion in subregions should be researched to exclude SB from having a local effect of hypoperfusion. Although the outcome measures are unlikely to be very responsive to change over a short period of time, it should be kept in mind that the used measures were taken from different data collection types (e.g. CAPI and SCQ) that were slightly delayed in time. Lastly, it should be noted that the sample used is a specific subsample of the TILDA cohort. Both the GENEActiv and MRI measurements were only performed in a selection of the whole cohort. Together with the fact that the overlap between the used NIRS and MRI sample is limited (n = 55), this reduces the generalisability of the results.
Conclusion
Participants who were sedentary for more than eight hours a day showed indications for preserved prefrontal oxygenation and global cerebral perfusion. However, lower hippocampal total and specific subfield volumes, as well as higher WMHs, were seen in high-sedentary older adults compared to their low-sedentary counterparts. These structural cerebral abnormalities are involved in cognitive decline and AD, which might suggest that these high-sedentary older individuals are at increased risk for cognitive decline. The pathways and causality underlying our results should be investigated further, as these with cognitive decline associated structural brain deviations are associated with sedentary behaviour.
Supplemental Material
sj-pdf-1-jcb-10.1177_0271678X211009382 - Supplemental material for Hemodynamic and structural brain measures in high and low sedentary older adults
Supplemental material, sj-pdf-1-jcb-10.1177_0271678X211009382 for Hemodynamic and structural brain measures in high and low sedentary older adults by Carlijn M Maasakkers, Dick HJ Thijssen, Silvin P Knight, Louise Newman, John D O'Connor, Siobhan Scarlett, Daniel Carey, Anne Buckley, Jason P McMorrow, Caoilfhionn Ní Leidhin, Joanne Feeney, René JF Melis, Rose Anne Kenny, Jurgen AHR Claassen and Céline De Looze in Journal of Cerebral Blood Flow & Metabolism
Footnotes
Funding
The author(s) disclosed receipt of the following financial support for the research, authorship, and/or publication of this article: TILDA is funded by the Department of Health, Irish Life, and The Atlantic Philanthropies. MRI data collection was funded by the Health Research Board (HRB) [HRA-PHR-2014-667] and supported by the National Centre for Advanced Medical Imaging (CAMI). CM was supported by a personal international research internship grant awarded by Alzheimer Nederland. Sponsors played no role in the design, execution, analysis and interpretation of data, or writing of the paper.
Acknowledgements
The authors would like to thank TILDA study participants and research team.
Declaration of conflicting interests
The author(s) declared the following potential conflicts of interest with respect to the research, authorship, and/or publication of this article: D. Carey is now an associate of Novartis Pharmaceuticals AG. The author's contributions to this work were made before joining Novartis. Remaining authors report no disclosures relevant to the manuscript.
Authors’ contributions
CM designed and conceptualized study, analysed and interpreted the data, drafted the manuscript. DT and RM contributed to study design and data interpretation, and revised the manuscript. SK contributed to data interpretation, acquisition of data, and revised the manuscript. LN, JOC, SS, DC, AB, JMM, CNL, and JF contributed to the acquisition and analysis of data, and revised the manuscript. RAK designed and conceptualized study, contributed to acquisition of data, and revised the manuscript. JC designed and conceptualized study, contributed to data interpretation, and drafted the manuscript. CDL designed and conceptualized study, contributed to acquisition of data, contributed to data interpretation, and drafted the manuscript.
References
Supplementary Material
Please find the following supplemental material available below.
For Open Access articles published under a Creative Commons License, all supplemental material carries the same license as the article it is associated with.
For non-Open Access articles published, all supplemental material carries a non-exclusive license, and permission requests for re-use of supplemental material or any part of supplemental material shall be sent directly to the copyright owner as specified in the copyright notice associated with the article.