
Abstract
Hyperglycemia has been linked to worsening outcomes after subarachnoid hemorrhage (SAH). Nevertheless, the mechanisms involved in the pathogenesis of SAH have been scarcely evaluated so far. The role of hyperglycemia was assessed in an experimental model of SAH by T2 weighted, dynamic contrast-enhanced magnetic resonance imaging (T2W and DCE-MRI), [18F]BR-351 PET imaging and immunohistochemistry. Measures included the volume of bleeding, the extent of cerebral infarction and brain edema, blood brain barrier disruption (BBBd), neutrophil infiltration and matrix metalloprotease (MMP) activation. The neurofunctional outcome, neurodegeneration and myelinization were also investigated. The induction of hyperglycemia increased mortality, the size of the ischemic lesion, brain edema, neurodegeneration and worsened neurological outcome during the first 3 days after SAH in rats. In addition, these results show for the first time the exacerbating effect of hyperglycemia on in vivo MMP activation, Intercellular Adhesion Molecule 1 (ICAM-1) expression and neutrophil infiltration together with increased BBBd, bleeding volume and fibrinogen accumulation at days 1 and 3 after SAH. Notably, these data provide valuable insight into the detrimental effect of hyperglycemia on early BBB damage mediated by neutrophil infiltration and MMP activation that could explain the worse prognosis in SAH.
Introduction
Subarachnoid hemorrhage (SAH) is a devastating disease defined by bleeding in the subarachnoid space with high morbidity and mortality that leaves SAH survivors with a wide range of neurological deficits from subtle cognitive impairment to disabling strokes. 1
SAH pathophysiology involves two phases comprising an early brain injury (EBI) occurring during the first two days after SAH, and a second phase affecting one third of the patients who develop delayed cerebral ischemia (DCI) during the following 3-14 days. 2 The accumulation of subarachnoid blood may play a major causal role for the early depolarizations and early brain ischemia. Subarachnoid blood elevates intracranial pressure, decreases cerebral blood flow, and may trigger early blood-brain barrier disruption (BBBd) generating brain edema and inflammation resulting in neuronal death.2 –4 Spreading depolarizations (SDs) occur with two peaks after SAH, the first observed during the early brain injury period followed by a second period when SDs act as trigger of spreading ischemia in previously nonischemic or mildly ischemic tissue, thereby leading to cerebral infarction. 5 Human studies using brain surface optoelectrodes and serial magnetic resonance imaging (MRI) scans demonstrated that spreading ischemia is a pathogenic mechanism of delayed infarcts.6,7 Thus, SD related variables during the delayed period are a significant predictor of DCI. 8 Likewise, SDs act as mediators between the presence and volume of subarachnoid blood and the incidence of delayed infarction, which show a weak correlation with the presence of angiographic vasospam. 9 Indeed, no association between angiographic vasospasm and patient outcome after SAH has been consistently demonstrated, 10 in contrast to the clear association between DCI and poor outcome. 11
Hyperglycemia is an independent predictor of poor SAH outcome and is associated with an increased incidence of complications and risk of death or functional disability, among others.12 –15 In a recent clinical study, individuals who maintained glucose levels below 9.2 mmol/L (∼166 mg/dl) showed a significant decrease in their risk of unfavorable outcomes at 3 months. 16 On the contrary, patients with high blood glucose levels on admission or during disease progression develop more frequently DCI and cerebral infarction partially due to the activation of the coagulation cascade along with enhanced inflammatory reaction and oxidative stress.12 –15,17 –21 Altogether these complications can disrupt the integrity of the blood-brain barrier (BBB) contributing to the infiltration of immune cells and the formation of brain edema following SAH. 22 In addition, preclinical studies of SAH have shown that hyperglycemia influences the threshold for SDs and is associated with exacerbated cerebral vasospasm, aggravated neuronal apoptosis and impaired neurological outcome.23,24 Despite these previous findings, the mechanisms that link hyperglycemia to SAH pathophysiology and poor clinical outcome remains largely unknown. In this context, in vivo imaging modalities such as MRI and positron emission tomography (PET) can be extremely helpful to gain knowledge on the role of hyperglycemia on SAH. These imaging techniques have been used to measure different features of preclinical SAH progression, such as brain perfusion, bleeding evolution, cerebral infarction, vasospasm, brain metabolism and neuroinflammation,25 –28 improving the early prediction of outcomes in the course of SAH.29,30
Therefore, our study aims to further understand the role of hyperglycemia on preclinical SAH pathogenesis using multimodal imaging modalities. We were interested in deciphering the relationship of hyperglycemia with bleeding, cerebral infarction, brain edema, BBBd and matrix metalloprotease (MMP) activation using in vivo MRI and [18F]BR-351 PET imaging in combination with neurofunctional evaluation. In addition, ex vivo cellular and molecular techniques were used to evaluate neuronal damage, myelinization, neutrophil infiltration and MMPs with gelatinase activity during the acute and subacute phases of an experimental model of SAH in rats. The results reported here provide novel insights into the role of hyperglycemia on EBI in a preclinical model of SAH that could pave the way for developing new targeted glucose-lowering therapies after SAH.
Materials and methods
Animal model and experimental set-up
Adult male Sprague-Dawley rats (n = 242; 350 ± 50 g body weight; Charles River, France) were used for in vivo imaging and ex vivo immunohistochemical studies. Animal experimental protocols and relevant details regarding welfare were approved by our institutional animal care and use committees, our Institutional Animal Care and Use Committee (IACUC) and Comité Ètic d’Experimentació Animal (CEEA)-University of Barcelona (UB) and local authorities and were conducted in accordance with the Spanish legislation (Real Decreto 53/2013) and the Directives of the European Union on animal ethics and welfare. Results are reported following the ARRIVE guidelines. All the studies were conducted under same experimental conditions in collaboration between CIC biomaGUNE and IIBB in AAALAC certified animal facilities.
Rats were anaesthetized with 4% isoflurane and maintained with 2-2.5% of isoflurane in a 30/70% mixture of O2/N2 and experimental SAH was induced using a modification of the endovascular perforation model as described earlier. 31 During the surgical procedure, body temperature was maintained at 37 °C by an electric blanket controlled by a rectal probe. Briefly, the right common, external, and internal carotid arteries were exposed through a ventral cervical midline incision. After electrocoagulation, the external carotid artery was ligated and cut 3–5 mm distal to the bifurcation. The pterygopalatine artery was ligated, and micro-clips were placed across both the common and external carotid arteries. A 4.5-cm length polyetrafluoroethylene tube (I.D.: 0.15 mm, O.D.: 0.30 mm; Braintree Scientific, MA, USA) was inserted into the external carotid artery through a puncture and gently advanced into the internal carotid artery until the circle of Willis was reached. Subsequently, a tungsten wire (I.D.: 0.076 mm; Scientific Instruments Services, MCA) was introduced inside the tube and advanced until puncturing the posterior communicating artery before the bifurcation between the proximal anterior cerebral artery and the middle cerebral artery. Finally, both the tube and the wire were gently removed and rats were kept in their cages with free access to food and water. Perioperative and postoperative pain management was assessed by subcutaneous injection of buprenorphine (0.05 mg/Kg) 15 minutes before SAH and every 12 hours for the following 72 hours, respectively.
In the first experimental group, hyperglycemia was induced by IP injection of 2.5 ml of dextrose in sterile H2O (Sigma; 25% mass/volume percentage) 30 minutes before SAH (Severe Hyperglycemia, SH, n = 28). In the second group, the dose of dextrose was reduced to 1.5 ml of dextrose (Mild Hyperglycemia, MH, n = 120). Finally, Normoglycemic (N) animals received the vehicle solution (sterile H2O; n = 94). Glycemic conditions were established in a blinded fashion and animals were randomly assigned to N, MH or SH groups for each imaging session. Of these animals, 57 (N), 62 (MH) and (9) (SH) rats survived at day 1 after SAH (Table S1).
All groups of SAH rats that survived to day 1 (52 out 57 (N), 47 out 62 (MH) and 9 (SH)) were subjected to T2-weighted (T2W), Dynamic Contrast Enhanced (DCE)-MRI scans and neurological evaluation at day 1 after SAH onset to assess the effect of hyperglycemia severity on brain infarction volume, midline displacement, bleeding volume, BBBd and neurological outcome during the first 24 hours and the rest of animals died just before or during MRI scans. (Figure 1(a), Table S2).
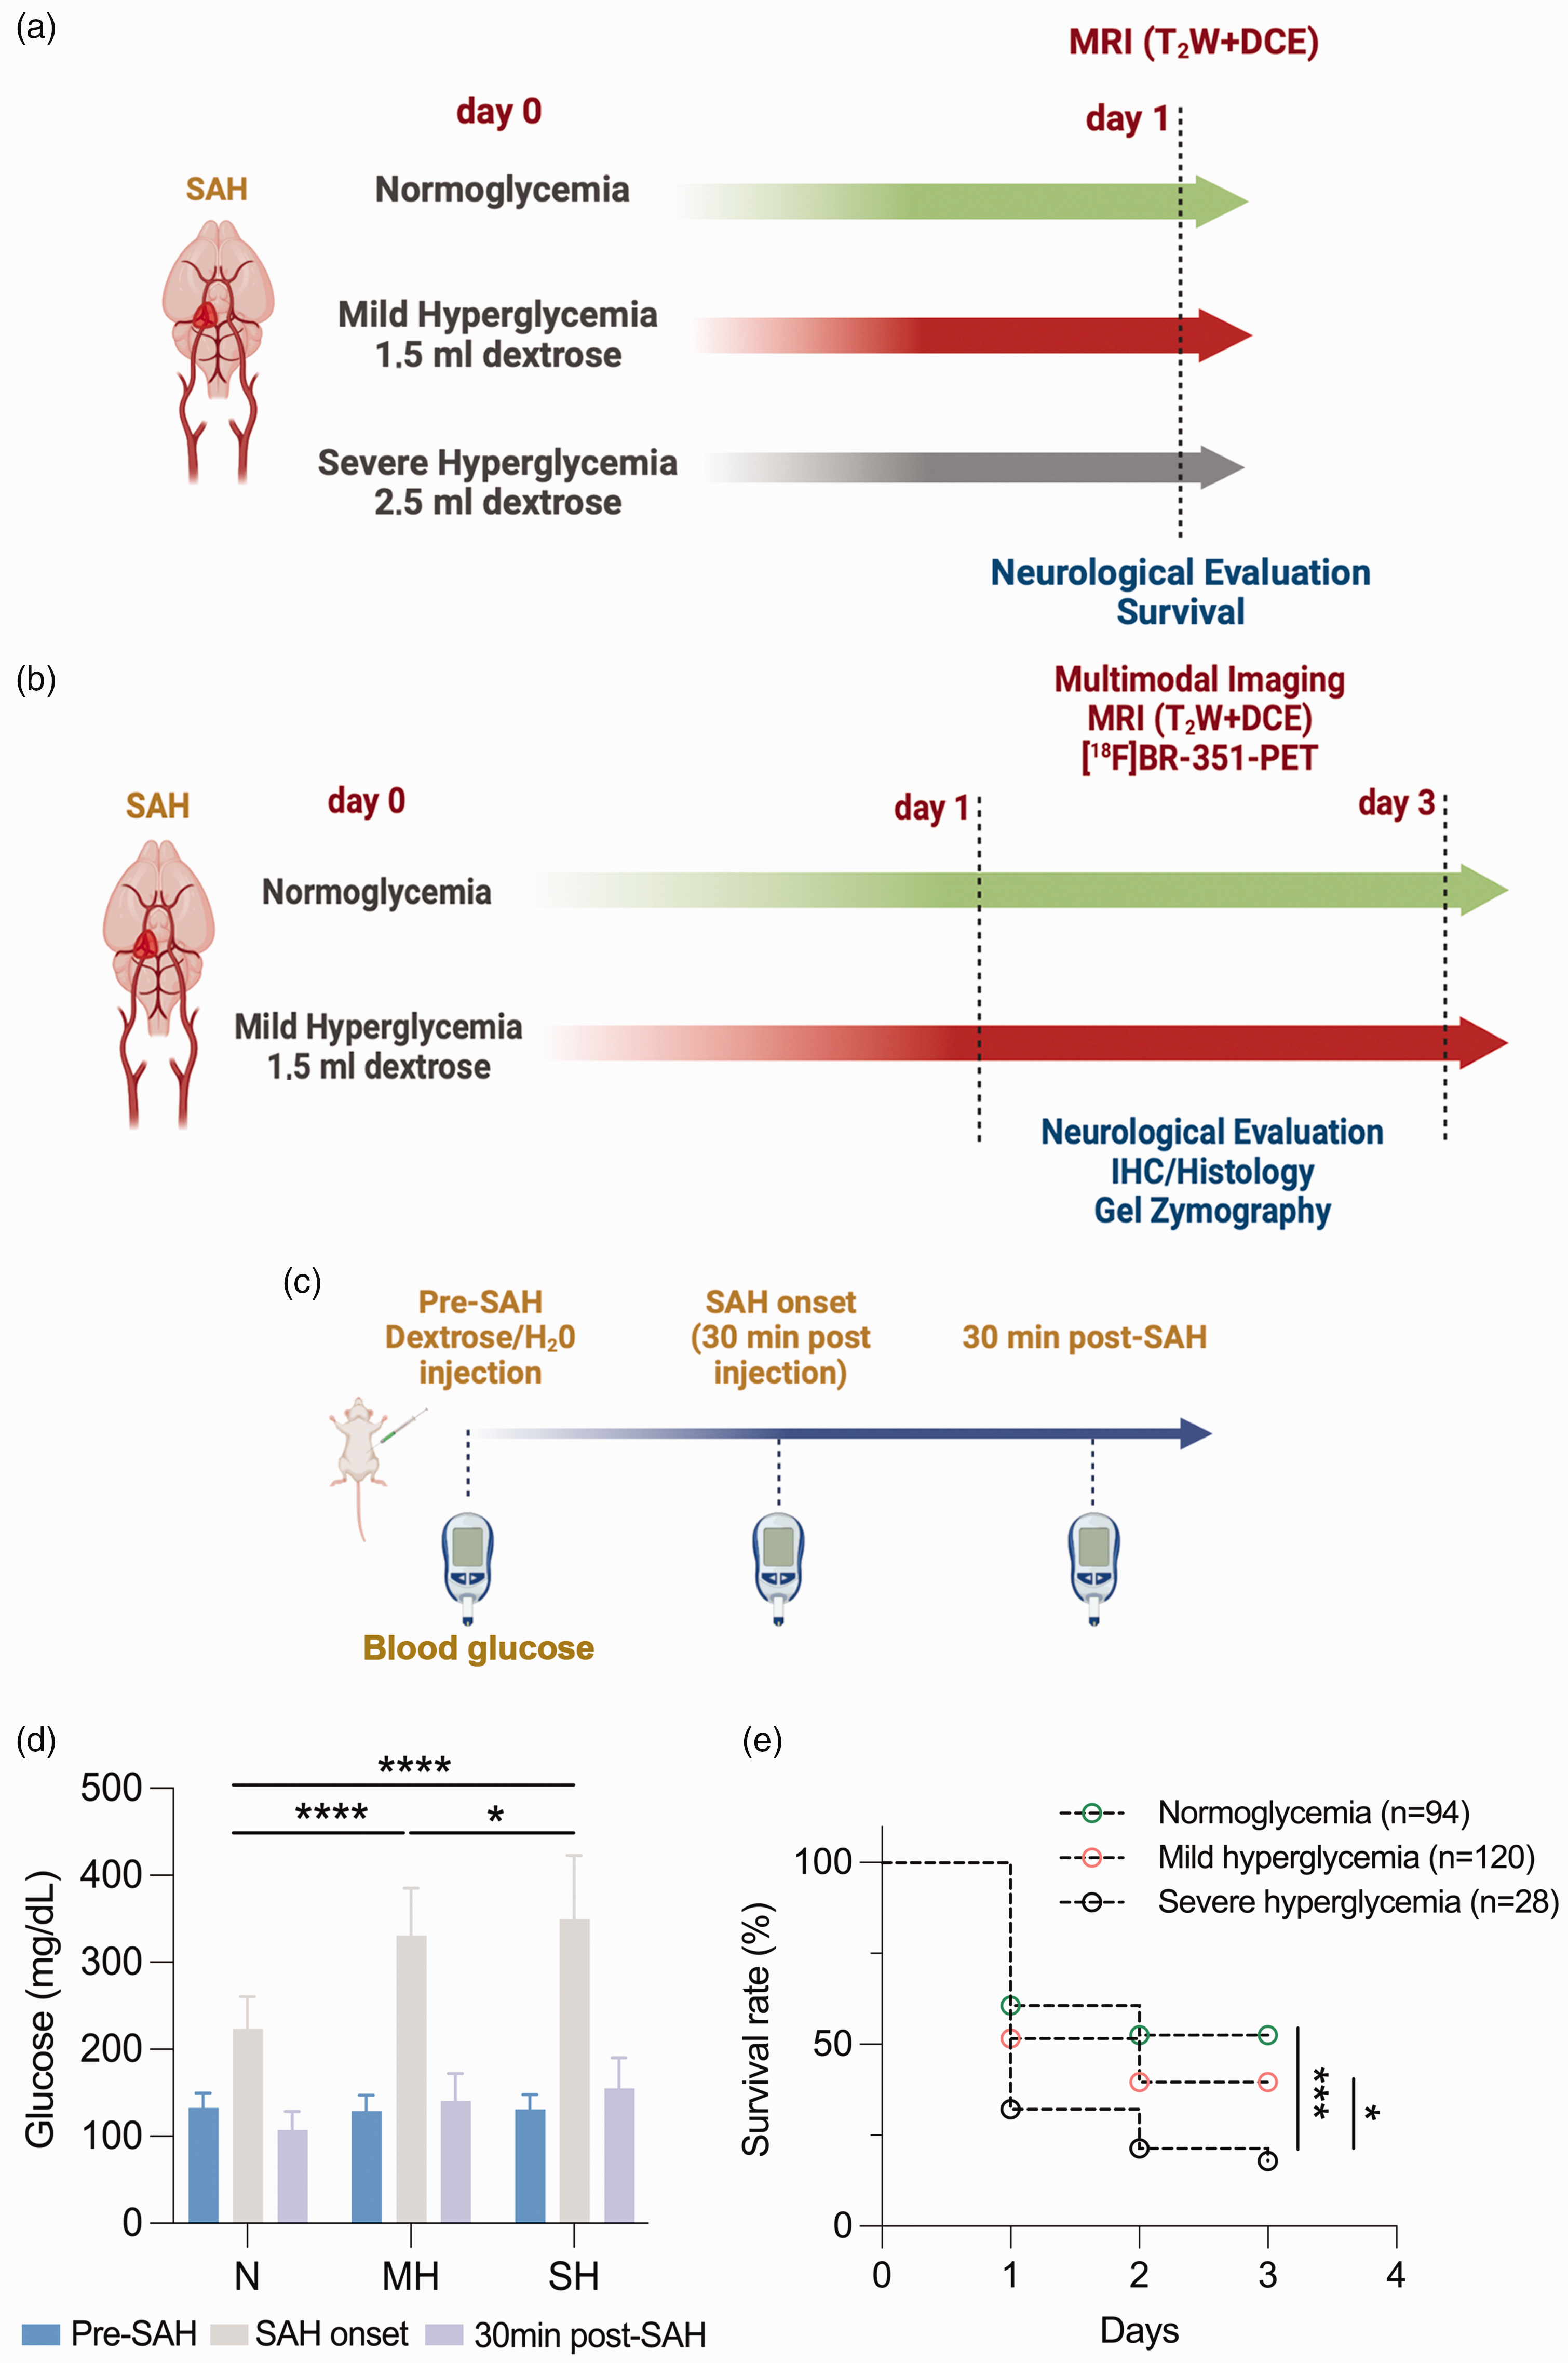
Experimental set-up of imaging and treatments studies, glucose levels and survival rate following SAH in rats. (a, b) Temporal imaging characterization of hyper and normoglycemic rat brains and the hyperglycemia induction protocol (c) after SAH. (d) Glucose levels (mean ± SD) were measured before (pre-SAH), at the SAH onset and 30 min post SAH. *p < 0.05, ***p < 0.001 and ****p < 0.0001; two-way ANOVA followed by Tukey’s multiple-comparison tests. (e) Survival rate (%) at N (n = 94), MH (n = 120) and SH (n = 28) was evaluated during the first 3 days after SAH. *p < 0.05, ***p < 0.001 and ****p < 0.0001; Log rank test.
Subsequently, both N and MH rats were subjected to MRI (n = 34 (N), n = 33 (MH)) and PET imaging of matrix metalloproteinases with [18F]BR351 (n = 9 (N), n = 6 (MH)) at days 1 and 3 after SAH to evaluate the effect of hyperglycemia on brain damage and MMP expression. Ex vivo ICH studies, Fluoro-Jade staining and gel zymography were also performed on those animals to validate in vivo imaging findings (Figure 1(b), Table S2). Blood samples were collected before treatment (Pre-SAH) at SAH onset (30 min post-injection of dextrose), and 30 min after the induction SAH to measure blood glucose levels (Glucometer and glucose test strips, Acofar, Barcelona) (Figure 1(c)). Finally, the exclusion criteria used in this study was established as follows; animals showing (i) infarct volumes larger than 550 mm3, (ii) contralateral ischemic lesions and (iii) and bleeding larger than 100 mm3.
Magnetic resonance imaging
MRI studies were used to assess the effect of SAH and hyperglycemia on bleeding and infarction volumes, mass effect (midline displacement) and BBBd using T2-weighted (T2W), Susceptibility weighted imaging (SWI) and Dynamic Contrast Enhanced (DCE)-MRI scans at days 1 and 3 after SAH induction. MRI in vivo scans were performed in rats anaesthetized with 4% isoflurane and maintained by 2-2.5% of isoflurane in a 30/70% mixture of O2/N2. Animals were placed into a rat holder compatible with the MRI acquisition system and normothermia was maintained using hot air self-controlled heating system (SAII Instruments, Stony Brook, NY, USA). To ensure animal welfare, temperature and respiration rate were continuously monitored while they remain in the MRI magnet, using a SAII M1030 system (SA Instruments, Stony Brook, NY, USA). In vivo MRI studies were performed on a 7 T horizontal bore Bruker Biospec USR 70/30 MRI system (Bruker Biospin GmbH, Ettlingen, Germany), interfaced to an AVANCE III console, and with a BGA12-S imaging gradient insert (maximal gradient strength 400 mT/m, switchable within 80 µs). These measurements were performed with a 72-mm volumetric quadrature coil for excitation and a 20-mm rat brain surface coil for reception. The imaging session started with the acquisition of a scout scan, which was used to plan the whole study focusing on the region of interest. The technical details of different MRI sequences used in the experimental procedure are described in detail in the Supporting Information.
Magnetic resonance imaging analysis
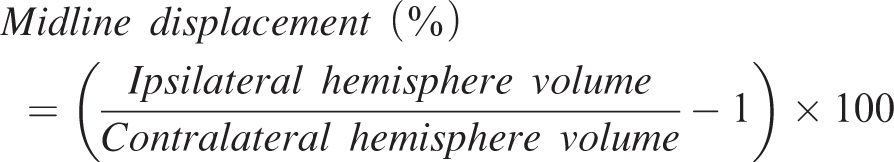
For image analysis, regions of interest (ROIs) were manually defined in areas showing hyperintense signals (infarction) and bleeding in all slices affected by the lesion with the Image J (Version 2, NIH, USA) software. The calculation of final infarct and bleeding volumes from each animal was carried out by adding the areas of the selected ROIs of all the slices and multiplying the result by the slice thickness (1 mm). Midline displacement, reflecting brain edema, was quantified using the following formula:
BBB permeability maps (Ktrans) of the whole brain were calculated with ROCKETSHIP software 32 using the Patlak pharmacokinetic model and input parameters: contrast agent relaxivity = 4.24 mM−1 s−1, hematocrit = 0.43. Arterial Input Function (AIF) as measured from a region of interest located at the carotid artery and pixel-by-pixel T1 relaxivity values determined using the parametric modelling module of ROCKETSHIP. 32
Radiochemistry
[18F]BR351 was carried out following a previously published method with minor modifications. 33 Radiochemical purity was always >95% at the time of injection, and molar activity values were in the range 90-220 GBq/µmol (EOS). This experimental procedure is described in detail in the Supporting Information.
PET scans and data acquisition
PET scans were performed using an eXplore Vista PET-CT camera (GE Healthcare, Waukesha, WI, USA). Scans were performed in rats anaesthetized with 2-2.5% of isoflurane in 100% O2. Animals were placed into a rat holder compatible with the PET acquisition system and maintained in normothermia using a water-based heating blanket at 37 °C. To ensure animal welfare, temperature and respiration rate were continuously monitored while they remained in the PET camera, using a SAII M1030 system (SA Instruments, NY, USA). The tail vein was catheterized with a 24-gauge catheter for intravenous administration of the radiotracers. For the evaluation of MMP expression, the radiotracer [18F]BR351 was injected into the tail vein and after an uptake period of 100 min, rats were anesthetized and placed on the PET camera for 30 min brain static acquisition. After each PET scan, CT acquisitions were also performed (140 mA intensity, 40 kV voltage), to provide anatomical information of each animal as well as the attenuation map for the later PET image reconstruction. Static acquisitions were reconstructed (decay and CT-based attenuation corrected) with filtered back projection (FBP) using a Ramp filter with a cut-off frequency of 0.5 mm−1.
PET image analysis
PET images were analyzed using PMOD image analysis software (Version 3.5, PMOD Technologies Ltd, Zurich, Switzerland). For the analysis of PET signal, both PET images and an MRI (T2W) rat brain template from Pmod were separately manually co-registered to the CT of the same animal to generate a spatial normalization. Subsequently, MRI brain template was automatically co-registered to PET images. Volumes of Interest (VOIs) were manually drawn in the entire ipsilateral and contralateral hemispheres, brain infarction and bleeding on slices of the MRI (T2W) images for each animal to study the [18F]BR351 PET signal. PET static scans of a frame of 30 minutes were used to quantify the [18F]BR351 uptake. Average values in each VOI were determined and expressed as percentage of injected dose per cubic centimeter (%ID/cc).
Immunohistochemistry
At 24-h or 72-h post-SAH and immediately after the last MRI acquisition, the rats were anesthetized with isoflurane and transcardially perfused with saline followed by 4% paraformaldehyde. The brain was removed and kept overnight with the same fixative, then, it was cryoprotected in 30% sucrose and frozen at −80°C. Cryostat brain sections (20-μm thick) were fixed with cold ethanol, blocked with either rabbit or donkey serums, and incubated overnight at 4 °C with either a mouse monoclonal primary antibody against ICAM-1 (no.554967, BD bioscience) diluted 1:400, a sheep polyclonal antibody against Fibrinogen (PA1-85429, Invitrogen), a rabbit polyclonal antibody against myelin basic protein (MBP) (A0623, DAKO) diluted 1:400. Then, sections were incubated for 2 h at room temperature with appropriate secondary antibodies (Alexa Fluor 488; Alexa Fluor 546; Molecular Probes; Life Technologies S.A.). Immunoreaction controls were carried out by omission of the primary antibodies. Sections were counterstained with 4′,6-Diamidino-2-phenyindole dilactate (DAPI) (D9564, Sigma-Aldrich) to visualize the cell nuclei and were observed under either a spinning disk confocal microscope (Andor Dragonfly, Oxford Instruments) or a stereologic microscope (BX51 Olympus). Superimages of different coronal sections were generated after taking pictures with the ×10 objective through all the sectional area in the stereological microscope and three rectangular ROIs were automatically selected in each hemisphere using the VIS 3.2.4 software. The spinning disk microscope with the x20 oil immersion objective was used for higher magnification images.
Fluoro-Jade, luxol fast blue and Evans blue
For Fluoro-Jade, sections were dried at room temperature overnight, and rehydrated with 100% ethanol (3 min) 70% ethanol (1 min) and washed with ultrapure water for 1 min. Fluorescent background blocking was performed with potassium permanganate (0.06%) in MilliQ water during 15 min under constant shacking at room temperature. After 1 min MilliQ water washing, samples were stained with Fluoro-Jade C (Millipore, California, USA) staining solution (0.0001%) in acetic acid (0.1% in MilliQ water) for 30 min and washed again (3 × 1 min) in MilliQ water. Sections were dried overnight at room temperature, cleared using xylene (3 × 2 min) and mounted with DPX (Sigma-Aldrich, Spain). Standardized images acquisition was performed with Axio Observer Z6 (Zeiss, Tres Cantos, Spain). Cells were manually counted in ten representative and different fields at 20× magnifications by using Image J (Version 2, NIH, USA) software. The experimental procedures for Luxol fast blue staining and assessment of Evans blue extravasation are described in detail in the Supporting Information.
Gel zymography
Tissues were homogenized with lysis buffer and centrifuged, the supernatants were used for extraction of gelatinolytic activity. Same concentration of protein in lysis buffer was incubated with gelatin-sepharose (Gelatin Sepharose 4B, GE Healthcare, Uppsala, Sweden). Subsequently, the pellet with gelatin-sepharose was washed and centrifuged before the separation of gelatinases with elution buffer. Protein extracts were loaded in acrylamide gels containing porcine gelatin. After electrophoresis, gels were washed and incubated in incubation buffer. After incubation, gels were stained and washed. Finally, the gels were imaged and analyzed to determine intensity of the bands (ChemiDoc and Image Lab software, BioRad, Alcobendas, Spain). This experimental procedure is described in detail in the Supporting Information.
Neurological assessment
The neurological outcome assessment of SAH was based on a previously reported 18-behaviour test adapted from Garcia and colleagues.34,35 Before imaging evaluations, six consecutive tests were performed at days 1 and 3 after SAH induction as follows: (a) spontaneous activity (normal = 3, slightly affected = 2, severely affected =1, no moving =0); (b) parachute reflex (symmetric = 3, asymmetric = 2, hemiplegic = 1; (c) Forelimb activity (symmetric = 3, mild asymmetric = 2, marked asymmetric = 1, no movement on one forelimb = 0); (d) climbing (climbed = 3, one side impaired =2, failed to climb =1); (e) body proprioception (equally on both sides = 3, reacted slowly on one side = 2, no response on one side = 1; (f) response to vibrissae stimulation (symmetric = 3, asymmetric = 2, no response on one side = 1). Total score could range from 4 (highest handicap) to an 18 (normal) point-scale.
Statistical analyses
The effect of hyperglycemia on survival rate at 1 and 3 days after SAH was evaluated using the Log rank test. For MH and SH effects in infarct volume, midline displacement, bleeding volume, BBBd and neurological score values at day 1 after SAH were averaged and compared with the averaged values of every glycemic condition using a non-parametric Kruskal-Wallis test. Likewise, the effect of mild hyperglycemia in infarct volume, midline displacement, bleeding volume, BBBd, neurological score and MMP values at days 1 and 3 after SAH were averaged and compared with the averaged values of different time points and glycemic condition with the Mann-Whitney test two-by-two. PET uptake, MPO, ICAM-1, Fibrinogen, Fluoro Jade, MBP and LFB values at days 1 and 3 after SAH were averaged and compared with the averaged values of every time point and brain region using repeated measures two-way ANOVA followed by Tukey’s multiple-comparison tests for post-hoc analysis. Glucose levels at pre, onset and post-SAH under different glycemic conditions were compared using repeated measures two-way ANOVA followed by Tukey’s multiple-comparison tests for post-hoc analysis. Finally, Ktrans and Evans Blue values at 1 and 3 days after SAH were compared using unpaired t-Test. Normal distribution was assessed with the Kolmogorov-Smirnov test. The level of significance was regularly set at P < 0.05 and statistical analyses were performed with GraphPad Prism version 9 software.
Results
Effect of hyperglycemia on survival after SAH
SAH was performed in N, MH and SH rats to assess the damage caused by hyperglycemia during early brain injury (24 hours) after SAH onset. Blood glucose levels of each animal were evaluated before the IP injection of dextrose or vehicle (Pre-SAH), at SAH onset and at 30 minutes after SAH. These results showed an increase of blood glucose levels at the time of SAH induction as follows, 223.88 ± 36.54 mg/dl in N rats (n = 94), 330.63 ± 54.78 mg/dl in MH rats (n = 120) and 349.57 ± 73.17 mg/dl in SH rats (n = 28). These findings showed significant higher blood glucose levels at SAH onset in both MH and SH groups compared to the N group (p < 0.0001, Figure 1(d)). In addition, the SH group displayed higher blood glucose values at SAH onset than those showed by the MH group (p < 0.05, Figure 1(d)). SH induced higher mortality during the first 72 hours after SAH induction in comparison to N and MH SAH rats (p < 0.001 and p < 0.05, Figure 1(e), Table S1). Thus, the low survival rates showed at days 1 (32.14%) and 3 (17.86%) by the SH group after SAH was a limitation for experimental studies (Table S1). For this reason, we have used MH conditions to evaluate the effect of hyperglycemia beyond 24 hours after SAH.
Role of hyperglycemia on SAH imaging, histological, and neurological outcomes
To study the role of hyperglycemia in the development of EBI, N (n = 52), MH (n = 47), and SH (n = 9) SAH rats were assessed using neurological evaluation and in vivo MRI imaging at day 1 after SAH. T2W imaging acquisitions were obtained to quantify volumes of bleeding, brain infarction and edema (midline displacement). Finally, DCE imaging and SWI acquisitions were applied to measure the disruption of the BBB and to obtain a qualitative visualization of brain hemorrhage, respectively (Figure 2(a) to (c)). Both MH and SH conditions increased midline displacement and infarct volume as a result of edema formation and acute ischemia in comparison to N SAH rats (p < 0.001, p < 0.0001, Figures 2(d) and (e)). Nevertheless, volume of bleeding did not show significant differences among different experimental conditions despite some SH animals displayed the highest volumes of bleeding than N and MH SAH rats at 24 hours (Figure 2(f)). Notably, MH significantly increased Ktrans values compared to N rats (p < 0.05, Figure 2(g)). However, these differences were not observed in SAH rats with SH due to the low number of animals included in this study compared to rats with MH. Finally, hyperglycemia worsened the neurological score in comparison to normoglycemic condictions after SAH (p < 0.0001, Figure 2(h)), although no significant differences were observed between MH and SH rats. Subsequently, the effect of hyperglycemia in the progression of the disease between days 1 and 3 after SAH was evaluated in N (n = 34) and MH (n = 33) animals using the neurological evaluation and T2W, SWI and DCE-MRI (Figures 3(a) to (c)). Both midline displacement and volume of infarction were affected by the progression of the disease during days 1 and 3 after SAH in both experimental groups of rats (p < 0.05, p < 0.001, p < 0.0001, Figures 3(e) and (f)). MH induced a significant increase of brain edema at day 1 followed by a worsening at day 3 in comparison to N SAH rats (p < 0.05, p < 0.0001, Figure 3(e)). A total of 88.24% of normoglycemic rats developed brain infarctions at day 1 after SAH compared to the 100% of MH rats that developed larger ischemic lesions (Table S3). In addition, hyperglycemic condition displayed a significant infarct volume increase from days 1 to 3 following SAH versus N (p < 0.001, p < 0.0001, Figure 3F). Both N and MH rats showed a bleeding increase of 32-39%, between days 1 to 3 after SAH, reflecting delayed rebleeding. Despite these results, hyperglycemia did not significantly increase bleeding volumes over time after SAH (Figure 3(g)). Likewise, the integrity of the BBB measured by in vivo DCE-MRI showed non-significant higher Ktrans values in MH compared to N rats during the first 72 hours after SAH (Figures 3(h)). In this study, the effect of MH did not show significant changes at 1 day versus N, unlike when the effect of MH and SH was compared to N in Figure 2(g). Indeed, these differences can be attributed to the high mortality showed by this animal model (Figure 1(e)) and therefore, the inclusion of only those rats that survived the following 3 days after SAH showing lower Ktrans values than those animals included in the previous study during the first 24 hours. DCE-MRI showed to be a reliable method to assess BBBd in SAH since both Ktrans and Evans blue signals were co-localized in the brain lesion with similar percentage of positive signals at days 1 and 3 after N conditions and SAH (Figure S1). Moreover, the accumulation of fibrinogen in the region of the injury as consequence of disruption of BBB displayed a significant signal increase following MH compared to N conditions at both days 1 and 3 after SAH (p < 0.001, Figure 4(i)). Likewise, the induction of MH at onset of SAH resulted in worsening neurological outcome at days 1 and 3 following SAH in relation to N conditions (p < 0.0001, Figure 3(i)). However, the worsening on the neurological outcome after MH was not attributable to a significant increase of neurodegenerative neurons (Fluoro Jade positive cells) at the region of the brain injury in relation to N and different days after SAH (Figure 4(j)). Likewise, evaluation of myelination under MH conditions after SAH showed no changes in myelin content at the level of the corpus callosum ipsilateral to the lesion compared to N conditions, neither by myelin basic protein immunostaining nor by Luxol fast blue staining (Figure S2).
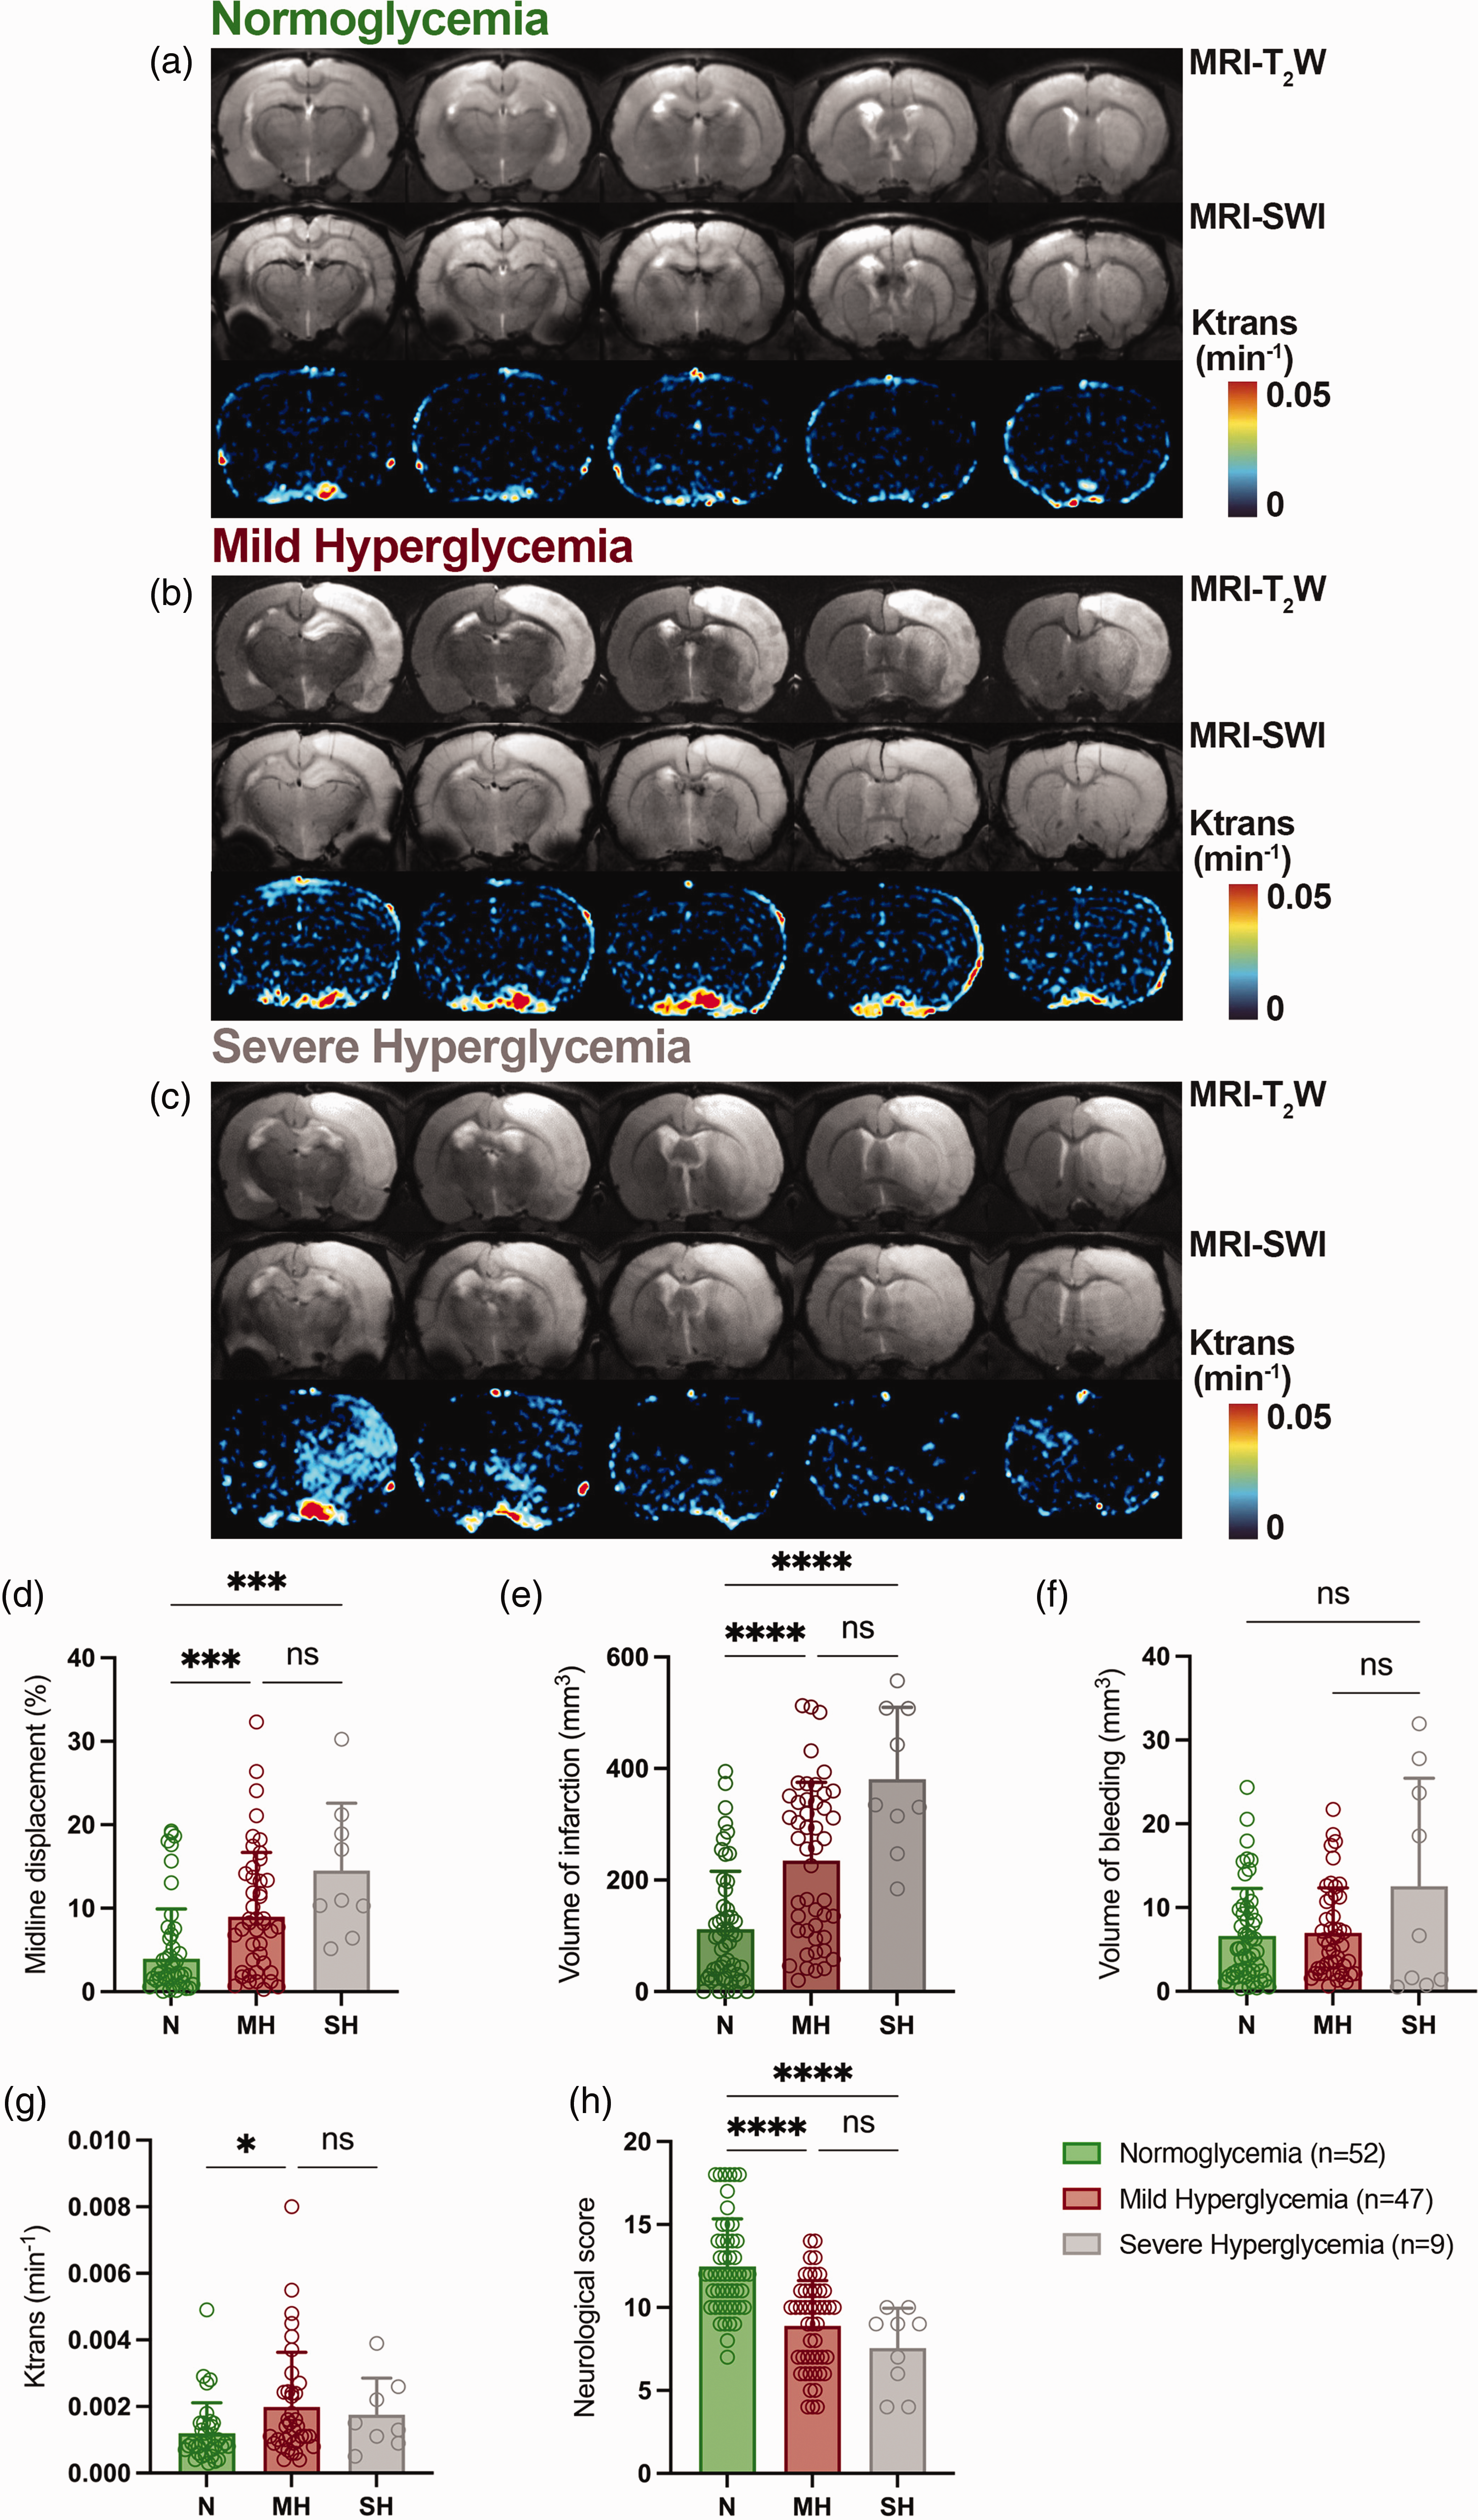
MRI-T2W, MRI-SWI and DCE-MRI images at day 1 after SAH in N, MH and SH rats. (a-c) MRI axial images show the ischemic lesion, bleeding and blood brain barrier disruption (BBBd) (Ktrans) at the level of the lesion. (d) Midline displacement, (e) volume of infarction, (f) volume of bleeding, (g) Ktrans and (h) neurological impairment were quantified at day 1 after SAH in N (n = 52), MH (n = 47) and SH (n = 9). *p < 0.05, **p < 0.01, ***p < 0.001 and ****p < 0.0001; Kruskal-Wallis test. Values are presented as scatter dot plot (mean ± SD).
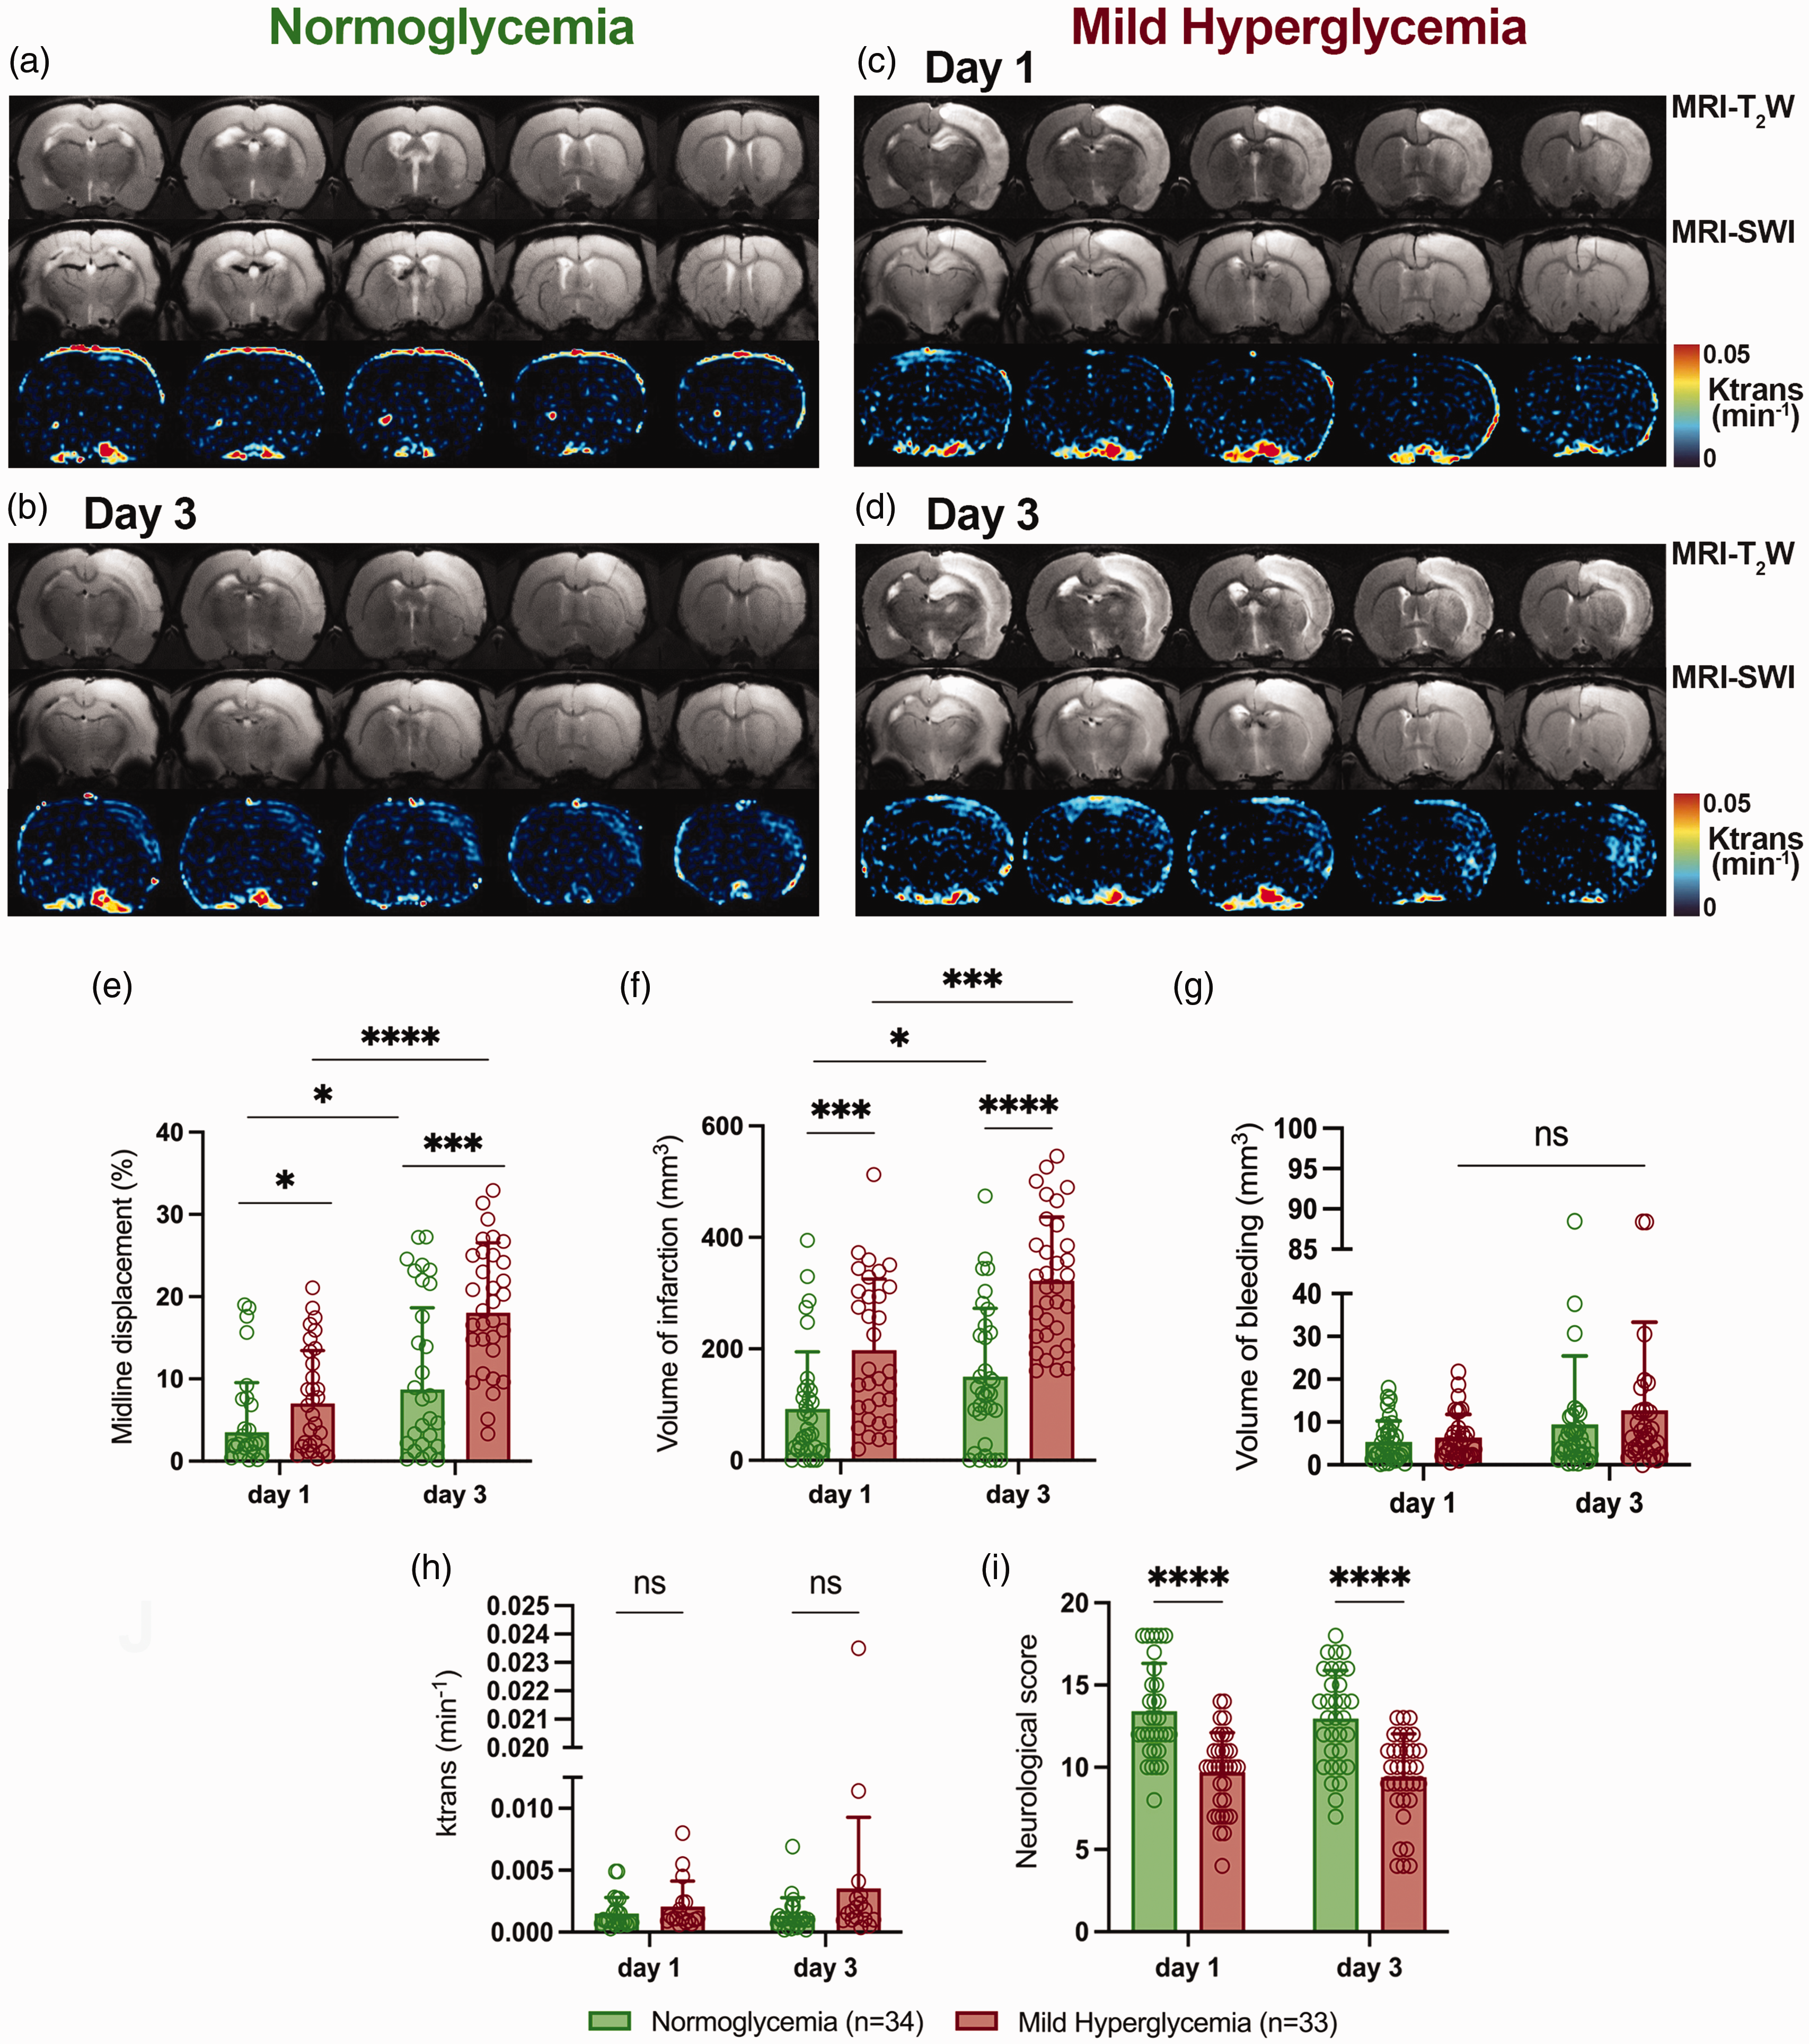
MRI-T2W, MRI-SWI and DCE-MRI images at days 1 and 3 after SAH in N and MH rats. (a-d) MRI axial images show the ischemic lesion, bleeding and blood brain barrier disruption (BBBd) (Ktrans) at the level of the lesion. (e) Midline displacement, (f) volume of infarction, (g) volume of bleeding, (h) Ktrans and (i) neurological impairment were quantified at days 1 and 3 after SAH in N (n = 34) and MH (n = 33). **p < 0.01, ***p < 0.001 and ****p < 0.0001; Mann-Whitney test two-by-two. Values are presented as scatter dot plot (mean ± SD).
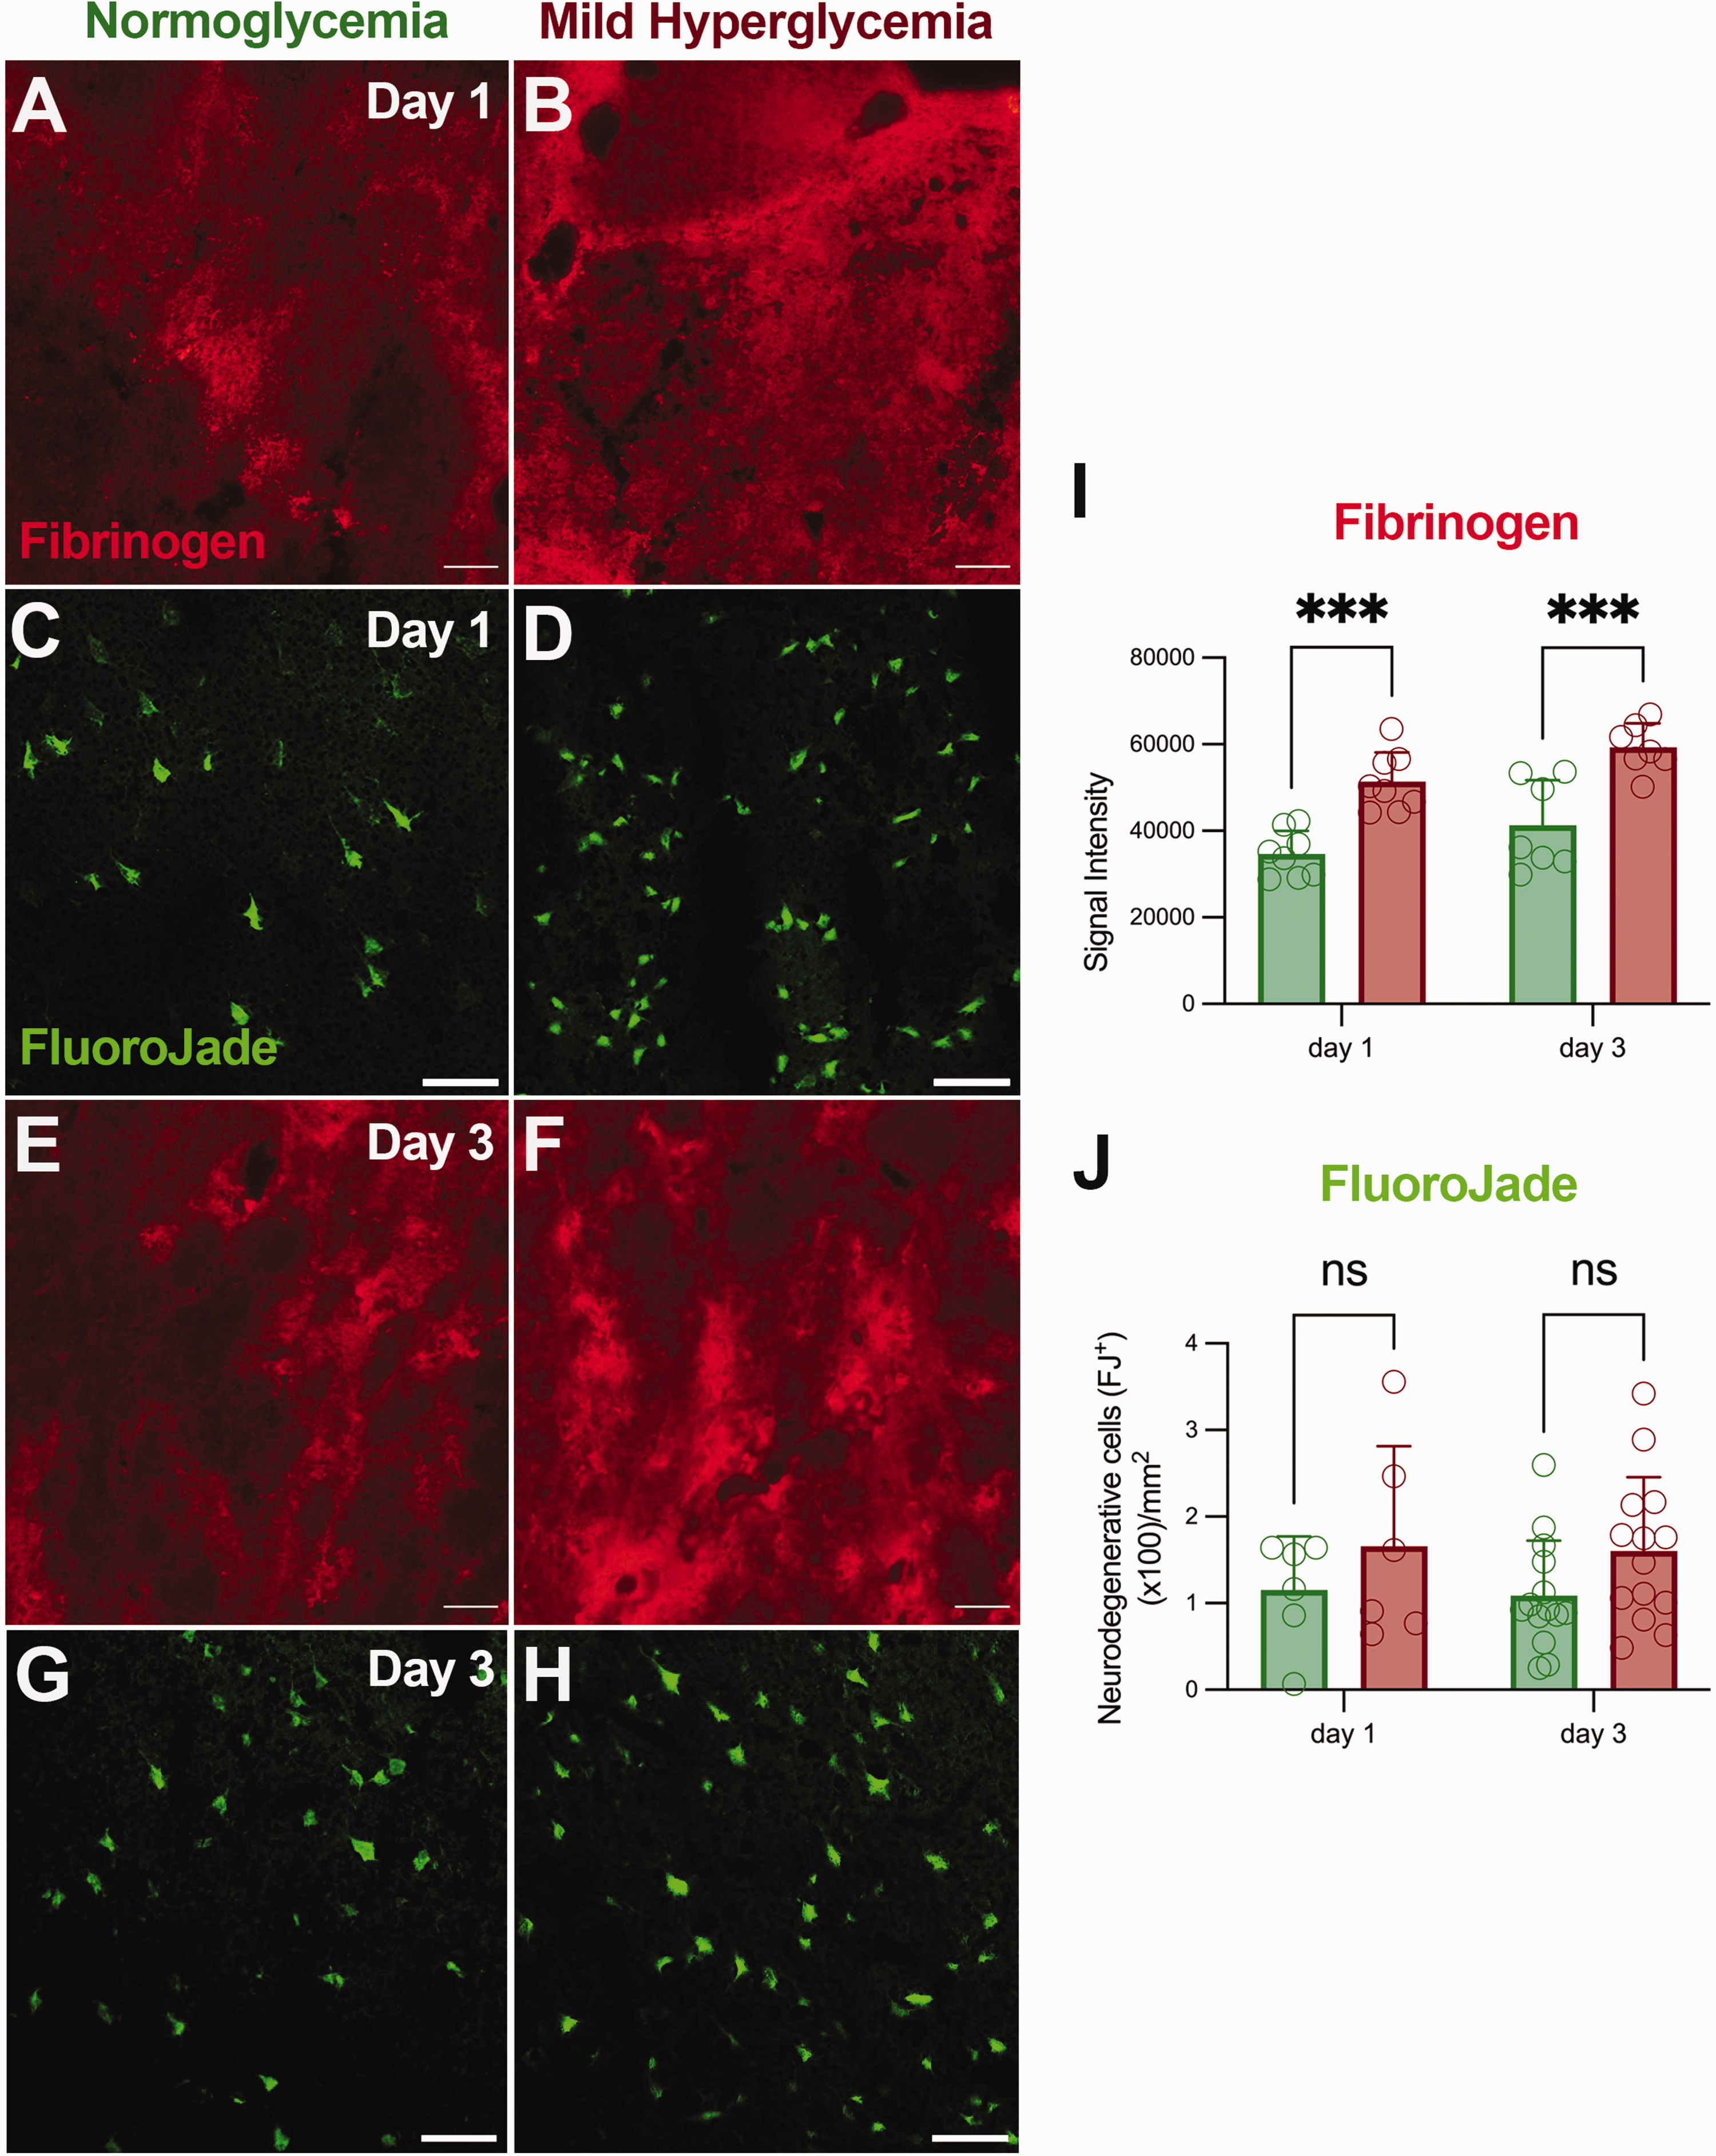
Fibrinogen accumulation and neurodegenerative cells at days 1 and 3 after SAH. (a–h) Immunofluorescent labelling of fibrinogen (red) and Fluoro-Jade positive cells (green) in the region of the lesion. (i) Fibrinogen signal intensity and (j) neurodegenerative cells (FJ+) were evaluated at days 1 and 3 after SAH in N (n = 6-14) and MH (n = 7-14) conditions. ***p < 0.001; two-way ANOVA followed by Tukey’s multiple-comparison tests. Values are presented as scatter dot plot (mean ± SD). Scale bars, 50 μm.
Influence of hyperglycemia on MMP activation after SAH
The role of hyperglycemia on MMP activation was explored with PET imaging of MMP activity using the radiotracer [18F]BR-351 at days 1 and 3 after treatment with dextrose and vehicle. All images were quantified in standard units (%ID/cc). Co-registered axial brain images of [18F]BR-351 PET brain signals to T2W-MRI in N and MH SAH rats showed spatial-temporal MMP activation changes in the region of the infarction at different days after SAH onset (Figure 5). PET imaging of in vivo MMP activation with [18F]BR-351 showed a non-significant increase signal uptake during the first 72 hours after SAH in the different analyzed brain regions (whole brain, infarction and bleeding) (Figures 5(e) to (h)). Hyperglycemia induced a significant [18F]BR-351 signal increase at days 1 and 3 after SAH in the ipsilateral (injured) hemisphere compared to N conditions (p < 0.01, Figure 5(e)). Conversely, the contralateral hemisphere did not show MMP activation changes in response to glycemic conditions following SAH (Figure 5(f)). Similar to the entire ipsilateral whole brain hemisphere, the infarcted cortex showed a significant [18F]BR-351 PET signal uptake at both 1 and 3 days in MH SAH rats versus N animals (p < 0.05, Figure 5(g)) that was not observed in the region of hemorrhage (Figure 4(h)).
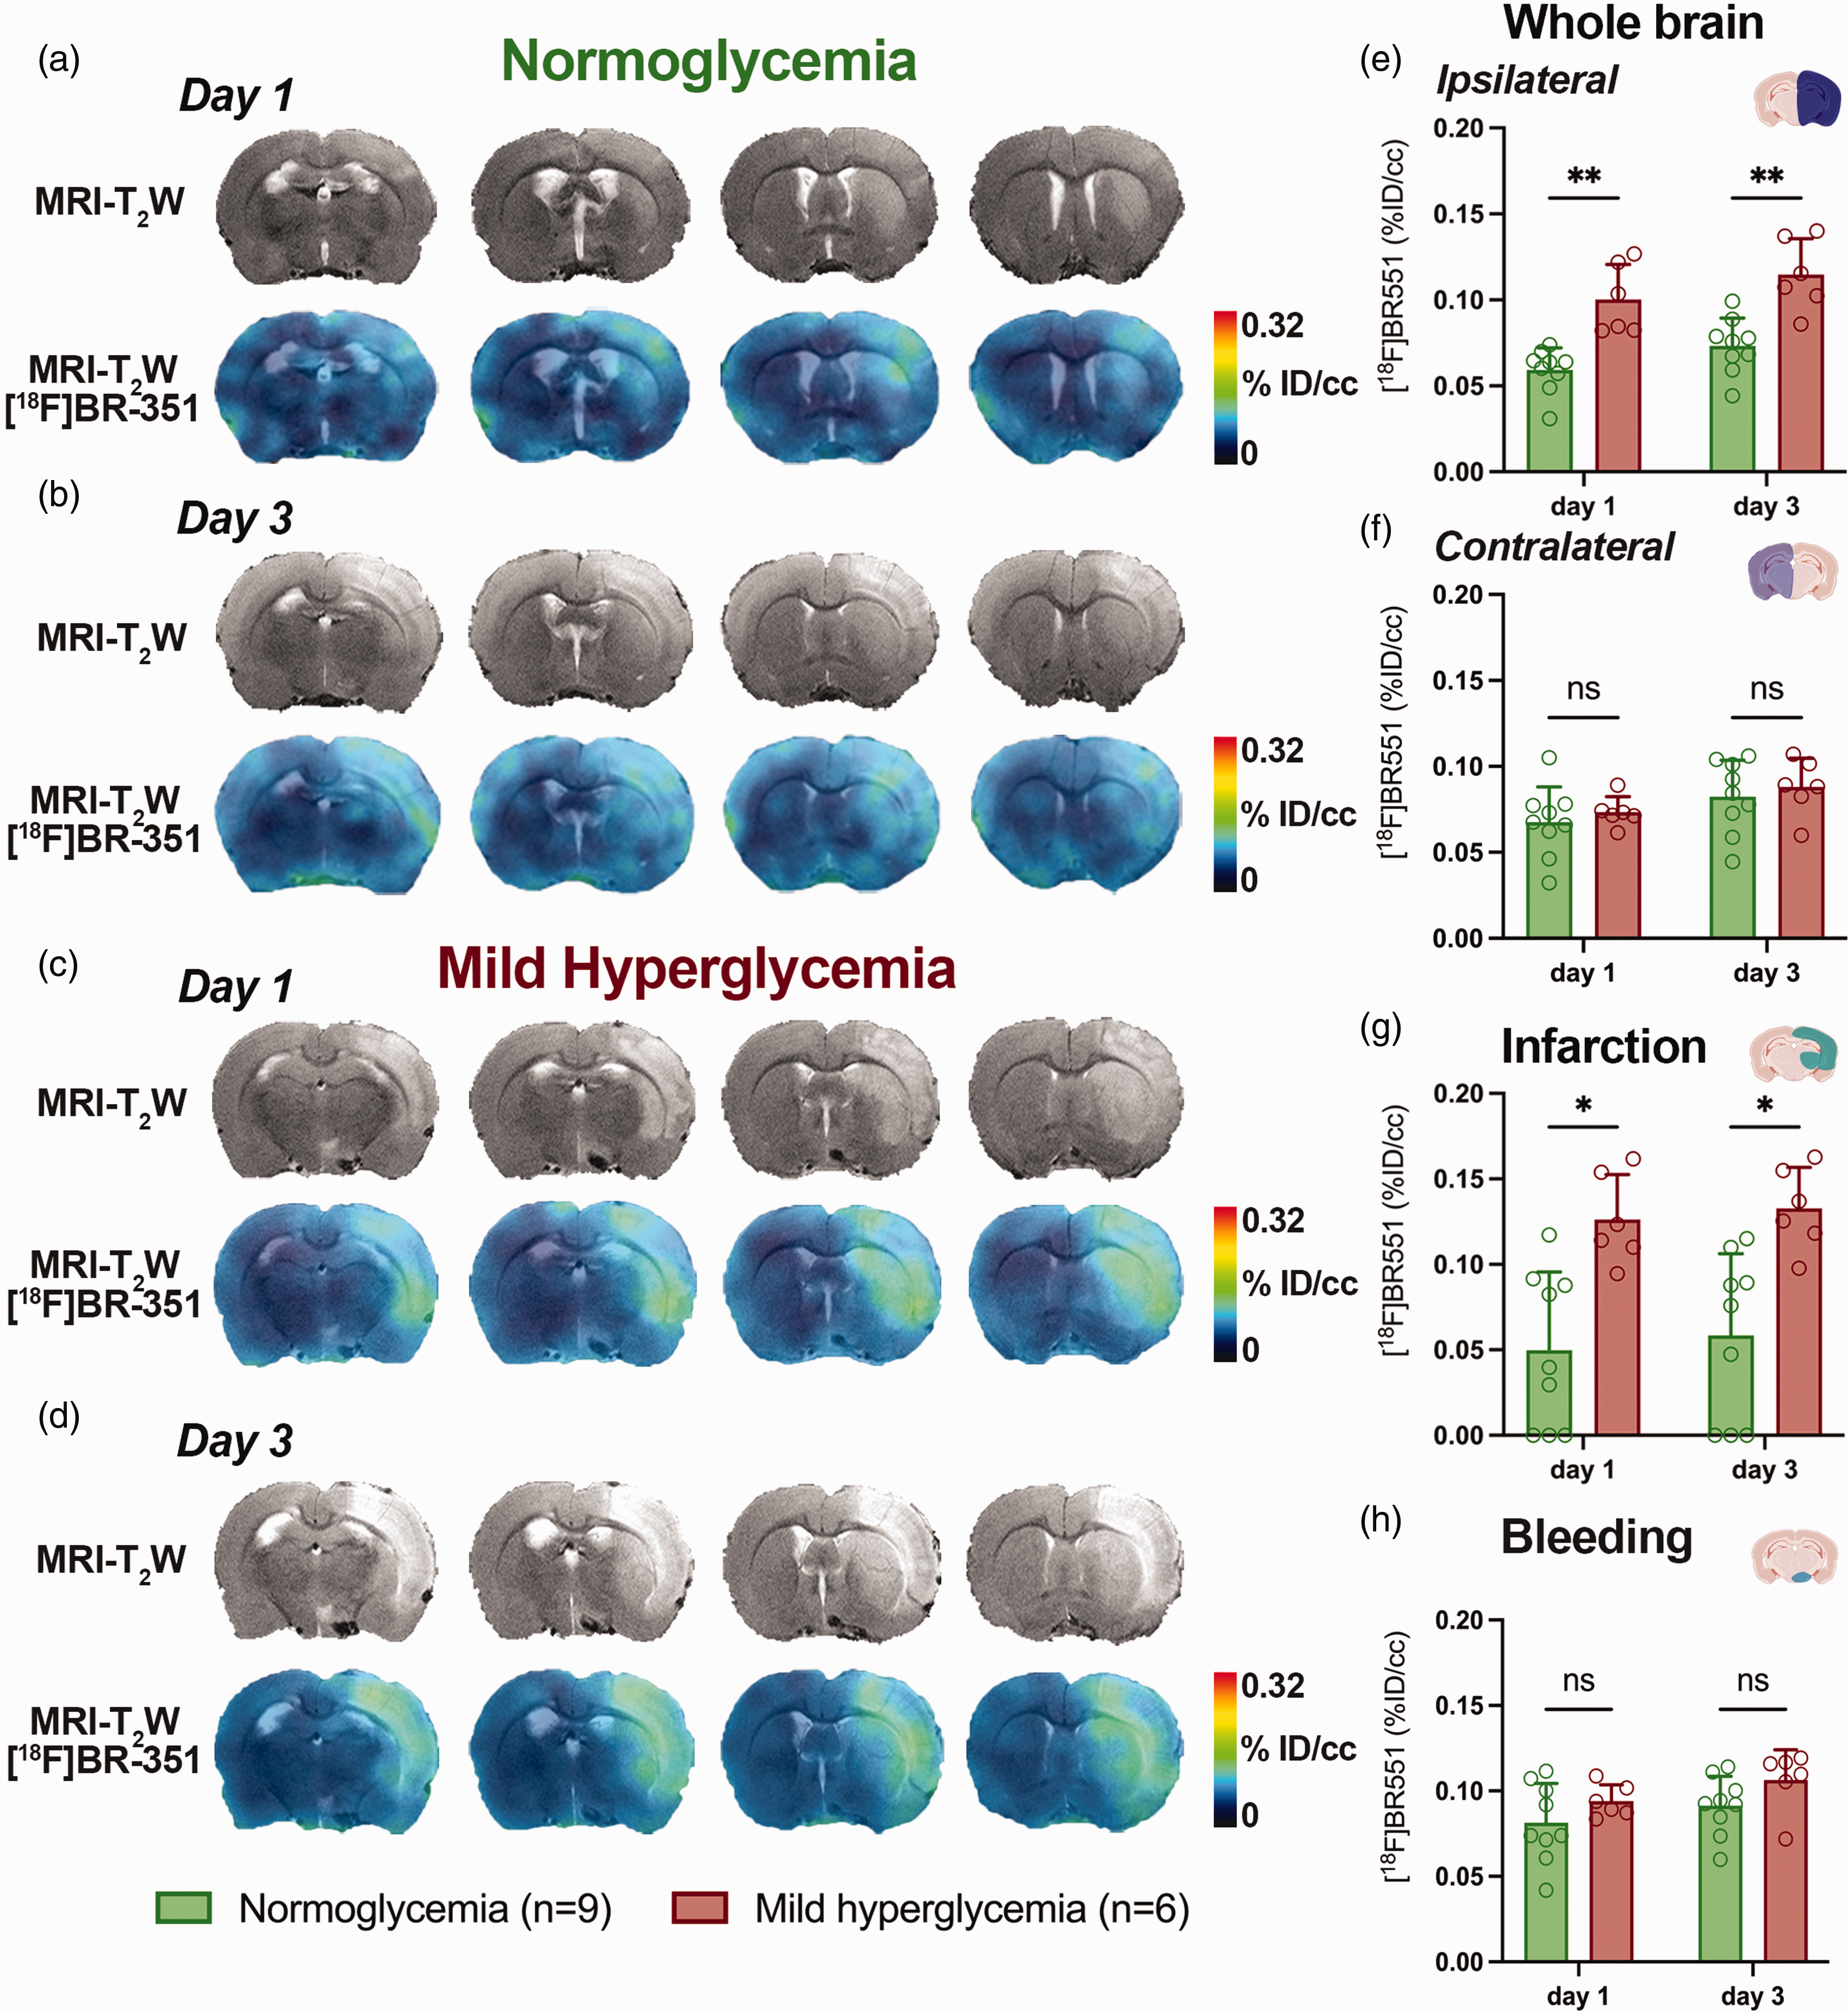
MRI-T2W and co-registered MRI-T2W-PET images of [18F]BR-351 at days 1 and 3 after SAH in N and MH rats. (a–d) MRI (T2W) and MMP PET signal images of axial planes at the level of the lesion. [18F]BR-351 PET signal was quantified at days 1 and 3 after SAH in N (n = 9) and MH (n = 6) rat brains. PET uptake signal (%ID/cc) was measured in (e) the ipsilateral and (f) contralateral brain hemispheres, and both (g) infarcted and (h) bleeding regions. *p < 0.05 and **p < 0.01; two-way ANOVA followed by Tukey’s multiple-comparison tests. Values are presented as scatter dot plot (mean ± SD).
Both MMP-9 (bands a and b, corresponding to 95 and 88 kDa) and MMP-2 (bands a and b, corresponding to 72 and 67 kDa) gelatinase activities under N and MH at days 1 and 3 following SAH were carried out with the semiquantitative analysis of the gelatin zymography (Figure 6(a)). The zymogram analysis showed the highest intensity of MMP-9 band a (proenzyme) at day 1 in both MH and N rats followed by a decline at day 3 after SAH in both ipsilateral and contralateral hemispheres which showed significant differences under MH conditions (p < 0.05, Figure 6(b)). Likewise, the active form of MMP-9 (band b) displayed a mild decrease from day 1 to day 3 in the ipsilateral hemisphere of MH rats, remaining active during sub-acute phase of SAH (p < 0.05, Figure 6(c)). Conversely, both MMP-2 bands showed a slight increase from day 1 to day 3 after SAH under N conditions which was significantly increased at day 3 after MH supporting the in vivo MMP activation increase observed with [18F]BR-351 PET imaging (p < 0.001 and p < 0.01 at day 3 vs day 1, p < 0.01 at ipsilateral vs contralateral and p < 0.05 at MH vs N, Figures 6(d) and (e)). In addition, both intercellular adhesion molecule 1 (ICAM-1) signal intensity and myeloperoxidase (MPO)-positive cells, used as surrogate markers of neutrophil infiltration and source of MMPs, showed a progressive significant increase following disease progression and under MH conditions in comparison to N (p < 0.01, p < 0.001 and p < 0.0001, Figures 6(f) to (i)).
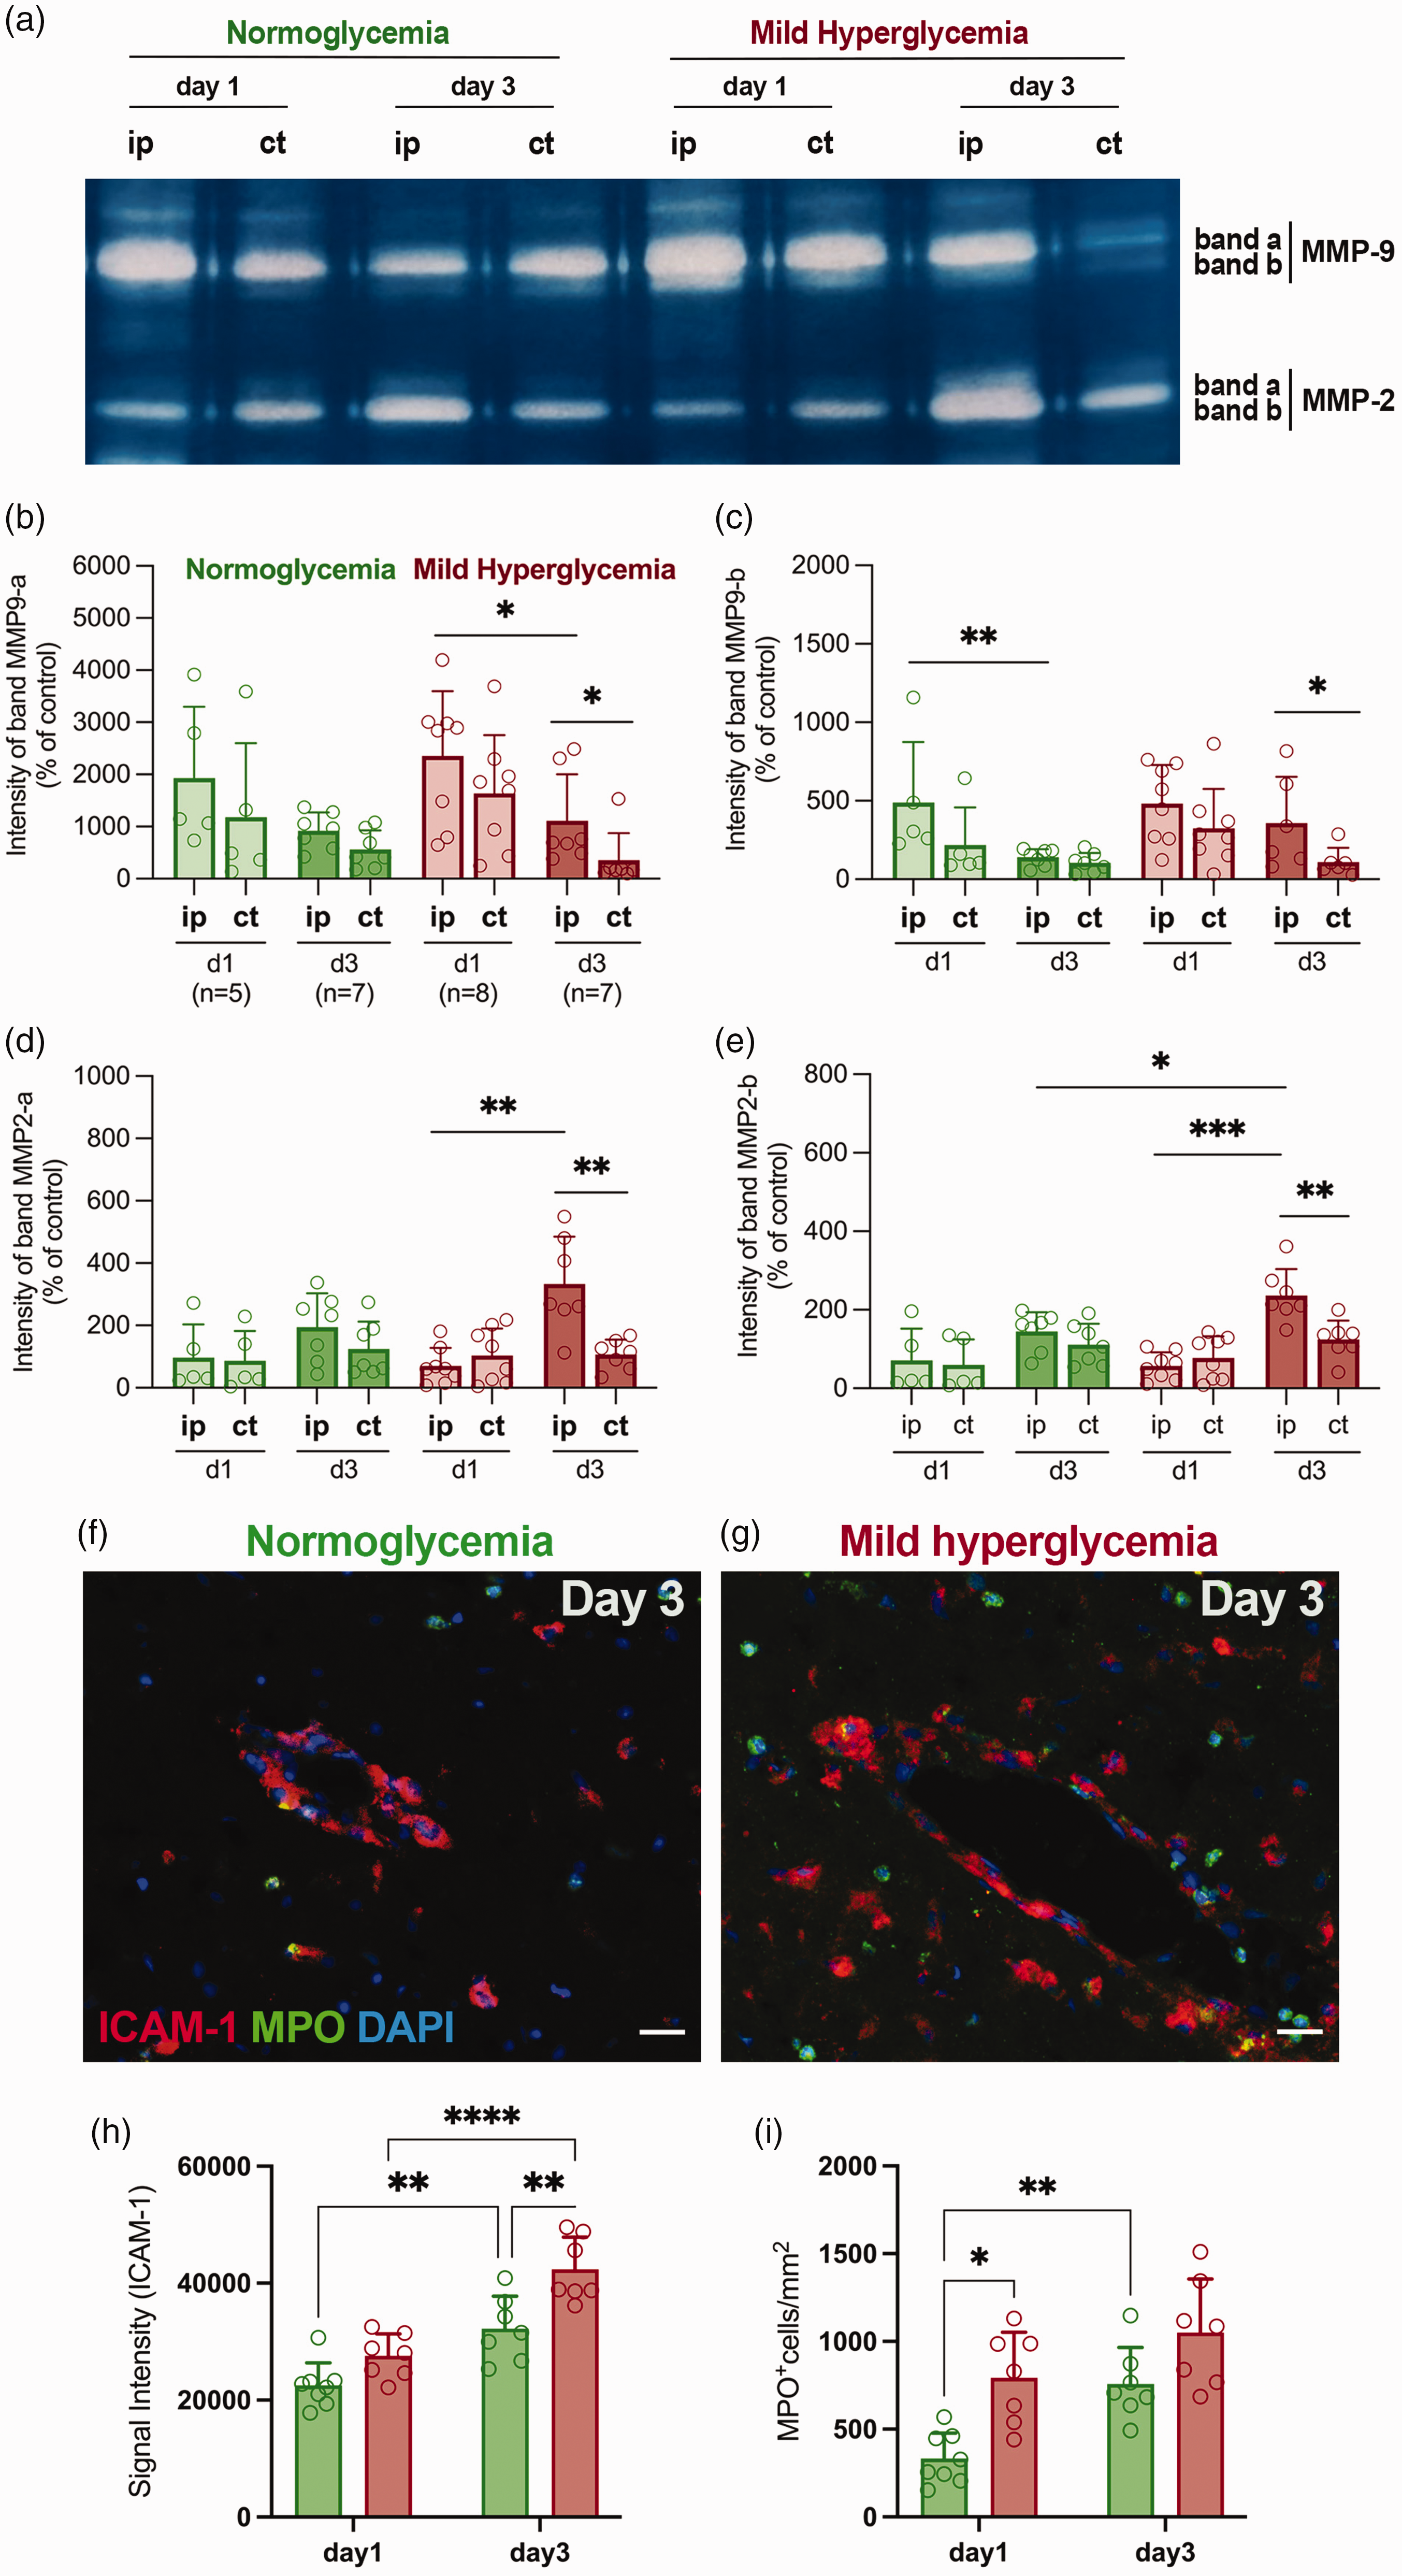
Gelatin zymography of MMP-2/-9 at days 1 and 3 after SAH in N (n = 5–7) and MH (n = 7-8) rats. (a) Activity of a (proenzyme) and b (active form) bands of gelatinases MMP-9/-2 in zymogram shown as white bands in the ipsilateral and contralateral hemispheres after SAH. (b, d) Intensity of bands a and (c, e) bands b of MMP-2/-9 were quantified in both ipsilateral and contralateral hemispheres after SAH. *p < 0.05, **p < 0.01, ***p < 0.001; Mann-Whitney test two-by-two. Values are presented as scatter dot plot (mean ± SD). (f, g) Immunofluorescent merged images of ICAM-1 (red), MPO (green) and DAPI (white) in the lesion at day 3 after SAH. (H, I) Signal intensity (ICAM-1) and MPO+ cells were evaluated in the brain lesion at days 1 and 3 after SAH in N (n = 8–7) and MH (n = 7). *p < 0.05, **p < 0.01, ***p < 0.001 and ****p < 0.0001; two-way ANOVA followed by Tukey’s multiple-comparison tests. Values are presented as scatter dot plot (mean ± SD). Scale bars, 20 μm.
Discussion
The clinical management of hyperglycemia has been generally limited to glucose-lowering treatments. 36 However, these therapies have not always been beneficial. The development of effective treatments will require understanding the mechanisms underlying the negative effect of hyperglycemia in SAH.12,37 In this study, we performed extensive in vivo MRI and PET analyses together with ex vivo histological and biochemical studies to evaluate the worsening effect of hyperglycemia on the neurological function, edema, acute ischemia, bleeding, BBBd, protease activation, neurodegeneration and myelinization at different time points after preclinical SAH.
Hyperglycemia impairs survival after preclinical SAH
Since Myers and Yamaguchi first demonstrated the worsening effect of the administration of glucose prior to cerebral ischemia, 38 many other studies have reproduced same detrimental effects of hyperglycemia on brain damage following an ischemic event.39 –41 However, to our knowledge, this is the first study of acute hyperglycemia in a preclinical rat model of SAH. The SH group showed higher blood glucose values and higher mortality rates during the following 72 hours after SAH (Figure 1) in comparison to both the N and the MH groups. These results agree with clinical studies showing an association between glucose burden and serious hospital complications, longer length of intensive care unit stay, and increased risk of death or severe disability after SAH.14,42 Accordingly, the induction of SH in our study led to high mortality rates ranging from 68 to 82% during the first 72 hours after experimental SAH, limiting the utility of high-glycemic experimental conditions to assess the effect of hyperglycemia in SAH outcome beyond the first 24 hours.
Hyperglycemia worsens brain damage after SAH in rats
MH and SH groups of SAH rats showed worse neurological function, larger infarct volumes and midline displacement, which highlighted the detrimental effect of hyperglycemia on the development of cerebral ischemia and edema during the first 24 hours after experimental SAH. Furthermore, the exacerbated infarction and edema formation observed in SH animals at day 1 after SAH onset suggested a relationship between blood glucose levels and the degree of brain damage during EBI (Figure 2). These findings agree with those reported by Song and colleagues who described the deleterious effect of hyperglycemia on the formation of cerebral edema with neural cell death after intracerebral hemorrhage in rats. 43 This early negative effect of hyperglycemia during EBI can be explained by the damage of the cerebral vasculature generating a pro-constrictive, inflammatory and pro-thrombotic vascular phenotype leading to vulnerable vasculature and decreased reperfusion blood flow which result in increased BBBd. 44 Supporting these findings, our study showed that MH conditions induced a significant BBBd increase in relation to normoglycemia following SAH in rats.
The study of disease progression over time showed significant worsening in all SAH animals, which was further exacerbated by MH. Our study showed the negative effect of hyperglycemia on the progression of cerebral injury through the increase of infarct volume and brain edema at day 3 in relation to day 1 after SAH onset (Figure 3). Vasospasm, apoptosis, oxidative stress and neurological impairment have been linked with negative evolution of experimental SAH and these effects were aggravated under hyperglycemia23,24,45 . Unlike these previous studies that used streptozotocin to raise blood glucose to levels ranging between 433 ± 98.3 mg/dl and 496 ± 73.9 mg/dl,23,24 we observed lower blood glucose values at 30 min after injection of dextrose. Despite these differences, we report for the first time the detrimental effect of acute hyperglycemia induced by dextrose during the following 72 hours after SAH induction.
Additionally, MH and SH conditions induced a non-significant bleeding volume increase at days 1 and 3 following SAH, respectively (Figures 2 and 3), which was supported by a fibrinogen signal increase in the region of lesion (Figure 4). Fibrinogen is synthetized in liver and has been considered as a marker of pathological inflammation after bleeding, 46 and fibrinogen extravasation is a marker of BBB breakdown. 47 Likewise, the albumin-fibrinogen ratio has been independently associated with the outcome of SAH patients and could be used as prognostic value to help the decision-making of SAH treatment. 48 Finally, our study showed the relationship between fibrinogen accumulation with worsening neurological impairment and the increase in neurodegenerative cells shown by hyperglycemic rats during the following 72 hours after experimental SAH (Figures 3 and 4).
Hyperglycemia modulates MMP activation after SAH
Matrix metalloproteinases (MMPs) are an extended family of zinc-dependent endopeptidases including gelatinase-type MMP-2/-9 which are well characterized as key players in the degradation of the neurovascular matrix integrity contributing to the infarct extent, brain damage and BBBd.49,50 Previous studies have described the influence of hyperglycemia on the enhancement of MMP activation and its relation to some pathological features of secondary ischemic damage following experimental stroke in rats.51,52 The temporal and spatial MMP activation evaluation during acute and subacute phases after ischemic stroke has been possible due to the development of the PET radiotracer [18F]BR-351, an 18F-labelled derivative of an inhibitor for MMP-2, -8, -9 and -13.53 –55 To our knowledge, this is the first study to monitor MMP activation with PET imaging following SAH which showed a time-dependent MMP activation enhancement during the following 3 days after SAH in rats (Figure 5). Indeed, these results stand in agreement with those observed by Zinnhardt and colleagues that showed in vivo MMP activation during the first 24/48 hours followed by non-significant increased values at day 7 after ischemia. 54 Gelatin zymography showed similar MMP-2/-9 activation levels in both N and MH animals at day 1 after SAH which did not reflect the MMP signal uptake observed with PET and neutrophilic infiltration (ICAM-1 and MPO) under MH conditions in relation to N (Figures 4 to 6). Indeed, these differences could be attributed to the detection of gelatinases (MMP-2/-9) and collagenases (MMP-8/-13) by [18F]BR-351 and suggest the activation of collagenases under hyperglycemia during the first 24 hours after SAH. Additionally, neutrophils express a large number of different metalloproteinases including gelatinase MMP-9 and collagenase MMP-8 which has been identified as a novel neuroinflammatory mediator in activated microglia after focal cerebral ischemia. 56 In addition, our results confirmed the role of hyperglycemia on the enhancement of neutrophil infiltration following experimental SAH in rats (Figure 6).
Summary and conclusions
In summary, multimodal imaging studies contributed to decipher the role of hyperglycemia after experimental SAH in rats. Hyperglycemia increased mortality, volume of infarction, brain edema and worsened neurological outcome during the first 3 days following SAH. In addition, high glucose levels induced MMP activation together with an increase of BBBd, bleeding and neutrophilic infiltration during the 72 hours following SAH in rats. Taken together, our results suggest the involvement of MMPs and neutrophils on early BBB damage and neurological outcome following SAH under hyperglycemic conditions, and open new avenues for the identification of new therapeutic approaches for the clinical management of hyperglycemia.
Limitations
The pathophysiological processes underlying SAH in humans are complex and therefore difficult to fully replicate in rodent models of SAH. The assumed limitation of the rodent models of SAH is that thick layers of subarachnoid blood on admission CT scans are consistently among the most important predictors of delayed infarction and unfavorable outcome in patients with SAH. 57 In contrast, the small lissencephalic brain of rodents does not allow the accumulation of large volumes of subarachnoid blood that may lead to delayed infarction. Hence, the animal model used in this study can essentially assess early brain injury processes and therefore, is not suitable for the study of delayed brain ischemia as known in patients. 58 In addition, artificial vascular perforation is substantially different from aneurysm rupture since the mechanism underlying spreading depolarizations after vessel puncture may cause mechanical disruption of local blood flow at the level of the middle cerebral artery (MCA) and therefore may better mimic the mechanism underlying spreading depolarizations after MCA occlusion rather than SAH. 59 , 60 Despite these limitations, this animal model is suitable for the evaluation of those subcellular processes underlying hyperglycemic conditions.
Supplemental Material
sj-jpg-1-jcb-10.1177_0271678X231197946 - Supplemental material for Multimodal imaging of the role of hyperglycemia following experimental subarachnoid hemorrhage
Supplemental material, sj-jpg-1-jcb-10.1177_0271678X231197946 for Multimodal imaging of the role of hyperglycemia following experimental subarachnoid hemorrhage by Ana Joya, Sandra Plaza-García, Daniel Padro, Laura Aguado, Leyre Iglesias, Maider Garbizu, Vanessa Gómez-Vallejo, Carlos Laredo, Unai Cossío, Ramon Torné, Sergio Amaro, Anna M Planas, Jordi Llop, Pedro Ramos-Cabrer, Carles Justicia and Abraham Martín in Journal of Cerebral Blood Flow & Metabolism
Supplemental Material
sj-jpg-2-jcb-10.1177_0271678X231197946 - Supplemental material for Multimodal imaging of the role of hyperglycemia following experimental subarachnoid hemorrhage
Supplemental material, sj-jpg-2-jcb-10.1177_0271678X231197946 for Multimodal imaging of the role of hyperglycemia following experimental subarachnoid hemorrhage by Ana Joya, Sandra Plaza-García, Daniel Padro, Laura Aguado, Leyre Iglesias, Maider Garbizu, Vanessa Gómez-Vallejo, Carlos Laredo, Unai Cossío, Ramon Torné, Sergio Amaro, Anna M Planas, Jordi Llop, Pedro Ramos-Cabrer, Carles Justicia and Abraham Martín in Journal of Cerebral Blood Flow & Metabolism
Supplemental Material
sj-pdf-3-jcb-10.1177_0271678X231197946 - Supplemental material for Multimodal imaging of the role of hyperglycemia following experimental subarachnoid hemorrhage
Supplemental material, sj-pdf-3-jcb-10.1177_0271678X231197946 for Multimodal imaging of the role of hyperglycemia following experimental subarachnoid hemorrhage by Ana Joya, Sandra Plaza-García, Daniel Padro, Laura Aguado, Leyre Iglesias, Maider Garbizu, Vanessa Gómez-Vallejo, Carlos Laredo, Unai Cossío, Ramon Torné, Sergio Amaro, Anna M Planas, Jordi Llop, Pedro Ramos-Cabrer, Carles Justicia and Abraham Martín in Journal of Cerebral Blood Flow & Metabolism
Footnotes
Funding
The author(s) disclosed receipt of the following financial support for the research, authorship, and/or publication of this article: This study was funded by grants from the Spanish Ministry of Education and Science/FEDER RYC-2017-22412, and PID2019-107989RB-I00, PID2020-118546RB-I00 and La Marató de TV3 (17/C/2017) and by Instituto de Salud Carlos III (PI19/00936, co-funded by the European Regional Development Fund). Jordi Llop also acknowledges the Spanish Research Agency for financial support (MCIN/AEI/10.13039/501100011033; PID2020-117656RB-I00). Part of the work was performed under the Maria de Maeztu Units of Excellence Programme – Grant MDM-2017-0720 funded by MCIN/AEI/10.13039/501100011033. This work was also performed thanks to the human and technical equipment of the Magnetic Resonance Imaging Core facility at IDIBAPS (IBPS15-EE-3688 co-funded by MCIU and by ERDF).
Acknowledgements
The authors would like to thank A. Lekuona and V. Salinas for technical support in the radiosynthesis, and J. Nova for technical support in histology and image analysis. The authors also thank for technical and human support the Analytical and High-Resolution Microscopy in Biomedicine Service of Bizkaia provided by SGIker (UPV/EHU), and the IIBB-CSIC Microscopy Unit.
Declaration of conflicting interests
The author(s) declared no potential conflicts of interest with respect to the research, authorship, and/or publication of this article.
Authors’ contributions
AJ, SPG, DP, LA, LI, VGV, CJ, AM performed experiments and acquired data; RT, SA, JLl, PRC, CJ, AM designed experiments; AJ, SPG, MG, CL, UC, SA, AMP, JLl, PRC, CJ, AM analyzed data, prepared the manuscript and approved the final version of the manuscript.
Supplementary material
Supplemental material for this article is available online.
References
Supplementary Material
Please find the following supplemental material available below.
For Open Access articles published under a Creative Commons License, all supplemental material carries the same license as the article it is associated with.
For non-Open Access articles published, all supplemental material carries a non-exclusive license, and permission requests for re-use of supplemental material or any part of supplemental material shall be sent directly to the copyright owner as specified in the copyright notice associated with the article.