
Abstract
Few have characterized miRNA expression during the transition from injury to neural repair and secondary neurodegeneration following stroke in humans. We compared expression of 754 miRNAs from plasma samples collected 5, 15, and 30 days post-ischemic stroke from a discovery cohort (n = 55) and 15-days post-ischemic stroke from a validation cohort (n = 48) to healthy control samples (n = 55 and 48 respectively) matched for age, sex, race and cardiovascular comorbidities using qRT-PCR. Eight miRNAs remained significantly altered across all time points in both cohorts including many described in acute stroke. The number of significantly dysregulated miRNAs more than doubled from post-stroke day 5 (19 miRNAs) to days 15 (50 miRNAs) and 30 (57 miRNAs). Twelve brain-enriched miRNAs were significantly altered at one or more time points (decreased expression, stroke versus controls: miR-107; increased expression: miR-99-5p, miR-127-3p, miR-128-3p, miR-181a-3p, miR-181a-5p, miR-382-5p, miR-433-3p, miR-491-5p, miR-495-3p, miR-874-3p, and miR-941). Many brain-enriched miRNAs were associated with apoptosis over the first month post-stroke whereas other miRNAs suggested a transition to synapse regulation and neuronal protection by day 30. These findings suggest that a program of decreased cellular proliferation may last at least 30 days post-stroke, and points to specific miRNAs that could contribute to neural repair in humans.
Introduction
MicroRNAs (miRNAs) are small (∼22 nucleotide) endogenous non-coding RNAs that regulate biological processes primarily by inhibiting expression of their target genes. 1 Each miRNA can alter the expression of one to hundreds of separate genes. 2 Due to their small size and packaging within hydrophilic extracellular vesicles (EVs), miRNAs can cross the blood-brain barrier.3,4 MiRNAs are protected from degradation by containment within EVs or through binding to Argonaut proteins or lipoproteins. 5 Given their wide-ranging effects and dynamic changes in health and disease, miRNAs have become attractive targets to characterize and treat various disorders including stroke. 6
Many clinical investigators have explored changes in miRNA expression related to acute ischemic stroke,7 –13 but few have done so in the recovery phase. Acute phase (0–72 hrs post-stroke) miRNAs show good sensitivity and specificity for diagnosing stroke in some studies, but none are validated in large multicenter investigations.7,11 –14 There remains a great deal of heterogeneity in the literature that likely stems from variability in sample fluid (plasma, serum, whole blood, or CSF), analytic technique (quantitative real-time PCR or RNA sequencing) and inadequate control groups.8,15 Clinical miRNA studies in the recovery phase (>72 hrs post-stroke) remain sparse. We performed an untargeted preliminary study with samples collected ∼19 days post-stroke and found a panel of plasma miRNAs that could accurately predict upper limb recovery. 16 Other investigations in the recovery phase were limited to 2–3 miRNAs. To summarize these targeted studies, they showed dysregulation of: miR-125a-5p at 7 and 90 days, 11 Let-7f from day 1–7, 7 miR-210 and Let-7e from <72 hrs to >14 days,17,18 miR-21-5p from 8 to >14 days, 19 and miR-146a which was downregulated <5 days, but upregulated >6 days post-stroke. 20 Thus, few clinical investigators have studied miRNAs in the recovery phase and an untargeted approach with longitudinal sampling remains unexplored.
The first month after stroke encompasses an important transition from a period of injury, inflammation and edema to neural repair and recovery. Depending on the level of ischemia, neural tissue may become necrotic within hours or undergo a process of apoptosis that can last up to 3 weeks.21,22 Brain inflammation peaks within 24–48 hours with activation of resident microglia and accumulation of inflammatory cells including neutrophils, macrophages and lymphocytes that steadily declines over the ensuing weeks.23,24 Cerebral edema reaches an apex around 5 days post-stroke in humans.25,26 In the midst of these processes there is a transition to neural repair. Successive waves of growth-promoting gene expression induce axonal sprouting in perilesional cortex from 7–28 days post-stroke in rodent models.27,28 Synaptogenesis occurs from 14–30 days after stroke in the rodent with synaptic pruning shortly thereafter.29,30 Somewhat similar timing and patterns of gene expression are suspected to lead to neural repair in humans, but this remains unclear. 31 In terms of behavioral recovery, most rodent stroke models describe maximal recovery by 30 days, whereas human recovery plateaus around 3–6 months depending on the severity of injury.32,33 Nonetheless, most of the clinical recovery that humans experience occurs over the first month post-stroke. 33
In this study we sought to capture changes in plasma miRNA expression over the early recovery phase (5–30 days post-stroke) that might shed light on molecular mechanisms contributing to neural repair in humans. We predicted that from 5 to 30 days post-stroke, different miRNA populations would show increased or decreased expression in stroke participants relative to controls at different time points, reflecting the transition from injury to neural repair. We further hypothesized that the number of miRNAs with significant differential expression in stroke participants versus controls would decrease with time post-stroke as inflammation and cellular injury resolve.
Materials and methods
Ischemic stroke participants
Ischemic stroke participants were recruited prospectively between 2014 and 2020 from 3 studies: Biomarkers of Stroke Recovery (BIOREC, MedStar Georgetown University Hospital, Washington, DC, n = 46), Markers of Stroke Recovery Study (MORSE, Spectrum Health, Grand Rapids, MI, n = 9), and Critical Periods After Stroke Study (CPASS, MedStar National Rehabilitation Hospital, Washington, DC, n = 48). All study protocols were approved by the local IRBs and carried out according to their guidelines and regulations (BIOREC – Georgetown University IRB # 2015-0288; MORSE – Spectrum Health IRB # 2018-016; CPASS – MedStar Health Research Institute IRB # 2014-065). BIOREC and MORSE were longitudinal observational studies that collected blood plasma at 5, 15, and 30 days after stroke with nearly identical inclusion/exclusion criteria (see supplementary data); participants were required to have mild, moderate, or severe arm motor impairment. CPASS was a clinical trial that randomized stroke participants with mild-moderate arm motor impairment to 20 hours of intensive arm motor therapy at 3 different time points post-stroke. 34 All CPASS blood plasma samples were collected at baseline prior to any study interventions. Samples from BIOREC and MORSE were combined into a single longitudinal discovery cohort. A validation cohort for the 15-day timepoint was created from the CPASS samples as follows (figure S1). The range for the 15-day sample collection in BIOREC/MORSE was 9–21 days post-stroke. We therefore included all baseline CPASS samples collected 9–21 days post-stroke for the validation cohort (48/72 total CPASS participants). The analysis described herein represents a retrospective analysis of data collected prospectively from these 3 studies.
Control participants
Control participants were recruited prospectively under the BIOREC and CPASS protocols using a HIPPA waiver to screen the electronic health record (EHR) followed by full consent prior to sample collection. We used a computer algorithm to screen all patients in the MedStar EHR and identify near perfectly matched controls for previously enrolled stroke participants based on age, race, ethnicity, sex, and cardiovascular comorbidities including hypertension, diabetes, atrial fibrillation, smoking, and statin use. 15 Note that hyperlipidemia and statin use interact and we preferentially matched for statin use instead of hyperlipidemia based on planned metabolomics studies. Ultimately all BIOREC stroke participants and half of the CPASS stroke participants had near perfectly matched control samples available. For the discovery cohort controls in the present study we included all 46 controls matched to BIOREC stroke participants and an additional 9 from the pool of CPASS controls matched to the MORSE stroke participants preferentially by age, race, ethnicity, and sex (figure S1). For the validation cohort controls in the present study we matched the 48 stroke participants to the total pool of BIOREC and CPASS controls using propensity score matching (see Statistical Analysis section for details).
Plasma collection and storage
For all studies fasting blood samples were collected in the morning by venipuncture using EDTA tubes (Cardinal Health, OH, USA). Samples were placed on ice, delivered to the biorepository, and centrifuged at 2600 RPM for 10 min at 20° C. Platelet-poor plasma was carefully removed with a pipette without disturbing the buffy coat and frozen at −80° C. All sample processing was performed within approximately 4 hrs from sample collection.
MicroRNA analysis
Total RNA was isolated from plasma by first homogenizing plasma samples by adding 1000 µL of Qiazol reagent (QIAGEN, Valencia, CA) to 200 µL of plasma and vortexing. The lysate was further mixed with 200 µL of chloroform, vortexed and centrifuged at 4°C for 30 minutes. The aqueous phase containing total RNA fraction was processed further using the Qiagen miRNeasy Serum/Plasma Kit (QIAGEN, Valencia, CA) to isolate total RNA enriched in miRNA. 35 RNA concentration and purity were determined using the NanoDrop ND-1000 spectrophotometer (Thermo Fischer Scientific, Waltham, MA) and an Agilent 2100 Bioanalyzer Instrument (Agilent, Santa Clara, CA, USA). Two µL of total RNA at a concentration of 5 ng/µL was prepared for each sample Using a Qubit device (Invitrogen, Waltham, MA). Complementary DNA (cDNA) libraries were created using the TaqMan Advanced miRNA cDNA Synthesis Kit (Applied Biosystems, Foster City, CA) according to the manufacturer’s instructions. cDNAs were loaded onto TaqMan OpenArray Human Advanced MicroRNA Panel chips (Catalog #A32710, Applied Biosystems, Foster City, CA) containing 754 miRNA targets per sample. Quantitative RT-PCR was performed using a QuantStudio 12k Flex instrument with OpenArray block (Thermo Fisher Scientific, Waltham, MA). Chips were loaded using an accompanying Accufill instrument.
Pathway analysis and literature review
Pathway analysis was conducted using Ingenuity Pathway Analysis (IPA, Qiagen, Venlo, Netherlands) with the microRNA target filter set to include experimentally observed results. Given limited findings with pathway analysis, a separate literature review was performed to identify potential biological roles for dysregulated miRNAs (see discussion). The literature review preferentially included experimentally observed results from preclinical stroke models and when this was unavailable we identified studies showing the most common pathways regulated by the miRNA in other disease processes.
Statistical analysis
We limited potential differentially expressed miRNAs to those with cycle threshold (Ct) values <36 in at least half the total sample population (stroke and control participants combined from all studies). Delta Ct values were calculated using miR-16-5p as the endogenous control. Sensitivity analysis was also performed using miR-484 as an alternate endogenous control. The unequal variance, two-samples pooled t-test was used to determine p-values for the differential expression between the ischemic stroke and control groups for every miRNA based on its corresponding delta Ct values. In order to eliminate issues related to multiple testing, p-values were adjusted for multiple comparisons using the false discovery rate approach by Benjamini and Hochberg (FDR). 36 Those miRNAs that passed the cutoff of the combination of FDR adjusted p-value <0.05 and fold-change > |1.5| were considered to be significantly differentially expressed between the stroke and control groups. A paired t-test was used to determine whether the absolute value of the fold change was significantly different over time for the 8 miRNAs with significant differential expression at all time points in both cohorts as well as the 12 brain-enriched miRNAs significantly altered at 1 or more time points in either cohort. Propensity score matching was performed with the “MatchIt” package in R 37 set to “optimal”, matching for age, race, sex, hypertension, diabetes, atrial fibrillation, smoking, and statin use.
Results
Participant sample collection, functional measures, and demographics
The timing of blood sample collection and functional measures are shown in Table 1. Samples for the 15-day discovery cohort were collected slightly earlier and with less variability than the 15-day samples in the validation cohort (mean ± SD, 15.5 ± 2.5 days vs. 16.1 ± 3.5 days). The mean modified Rankin Scale (mRS), NIH Stroke Scale (NIHSS), and upper extremity Fugl-Meyer (UE-FM) scores all improved over time in the discovery cohort. While there was almost no difference between the mean 15-day mRS in the discovery and validation cohorts (3.9 ± 0.8 vs. 3.8 ± 0.5), there were greater differences in the 15-day NIHSS (6.7 ± 3.9 vs. 4.7 ± 1.7) and UE-FM (19.4 ± 17 vs. 30.2 ± 10.9), suggesting that the discovery cohort participants had more severe strokes with greater upper limb impairment. All 5-day post-stroke blood samples were collected at the acute care hospital and most 15- and 30-day post-stroke samples were collected at the acute rehabilitation facility (see supplementary data page 2 for further details). Ischemic stroke participants in the discovery cohort were slightly older (65.4 ± 11.4 vs. 62.3 ± 12.2 yrs) with a smaller percentage of African Americans (49% vs. 88%) compared to the validation cohort (Table 2). The ischemic stroke participants in both cohorts were well-matched to their respective controls with regard to age, sex, race, ethnicity, and cardiovascular comorbidities with the exception of hyperlipidemia.
Blood sample collection timing and functional measures for ischemic stroke participants in BIOREC/MORSE and CPASS.
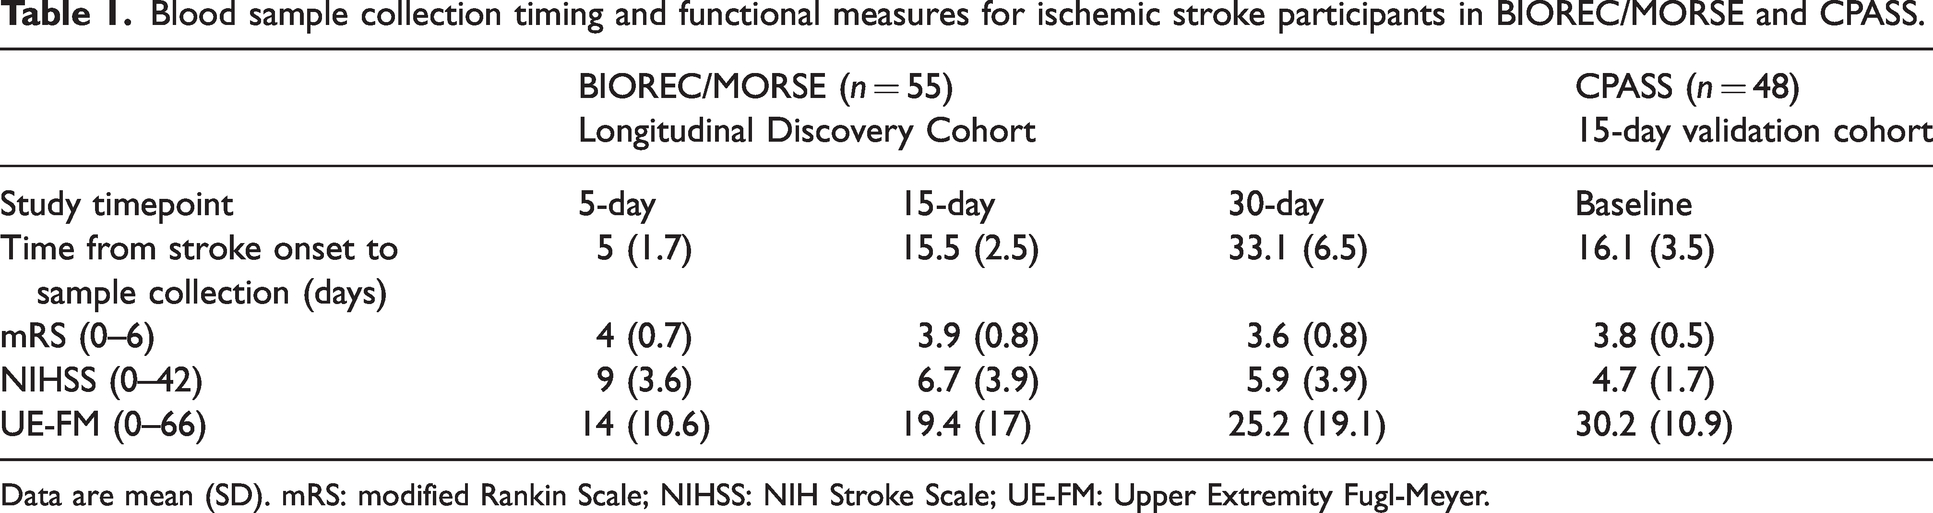
Data are mean (SD). mRS: modified Rankin Scale; NIHSS: NIH Stroke Scale; UE-FM: Upper Extremity Fugl-Meyer.
Baseline characteristics of ischemic stroke participants and matched controls for BIOREC/MORSE and CPASS, including standardized differences to gauge match fidelity.
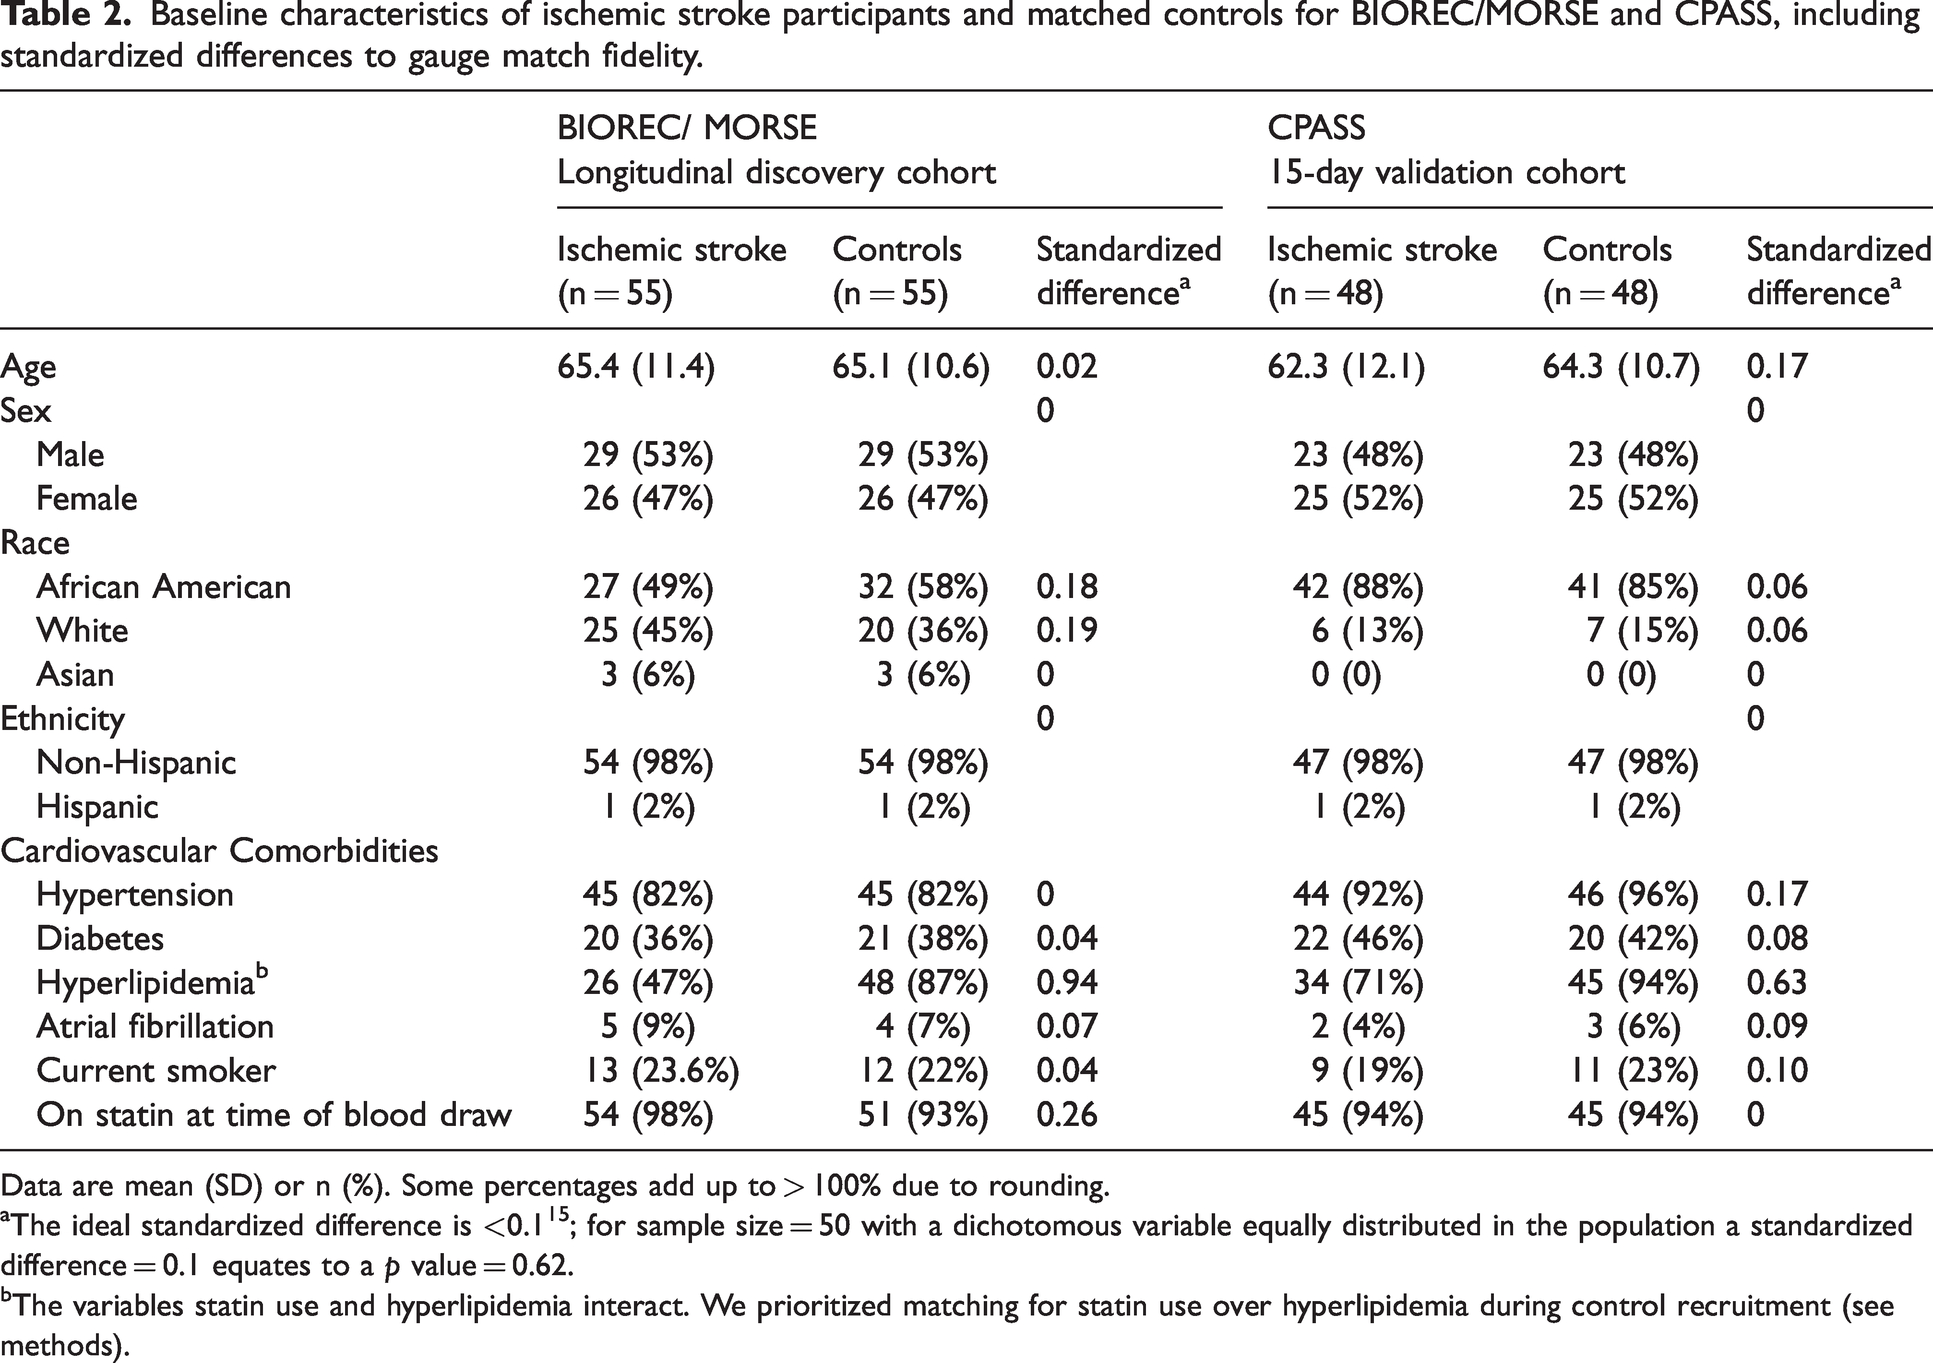
Data are mean (SD) or n (%). Some percentages add up to > 100% due to rounding.
The ideal standardized difference is <0.1 15 ; for sample size = 50 with a dichotomous variable equally distributed in the population a standardized difference = 0.1 equates to a p value = 0.62.
The variables statin use and hyperlipidemia interact. We prioritized matching for statin use over hyperlipidemia during control recruitment (see methods).
Eight dysregulated miRNAs at all study timepoints
To determine the evolution of miRNA expression over the first month post-stroke, we identified differentially expressed miRNAs between stroke participants and controls in the discovery and validation cohorts. There were 8 miRNAs with significantly altered expression at all timepoints in both cohorts (Figure 1(a)), 6 with decreased expression in stroke participants versus controls (miR-101-3p, miR-107, miR-16-2-3p, miR-19a-3p, miR-19b-3p, and miR-26b-3p) and 2 with increased expression (miR-199a-3p and miR-652-3p). Four miRNAs consistently demonstrated a sharp decrease in expression in stroke participants compared to controls with FDR-corrected p-values ≤0.01 across all study timepoints in the discovery cohort (miR-107, miR-16-2-3p, miR-19a-3p, and miR-19b-3p). A bi-clustering dendrogram (Figure 1(b) and supp fig S3) showed that most of the dysregulated miRNAs had increased expression in stroke patients vs. controls; the majority of the miRNAs with negative expression became less dysregulated over time. The number of particular miRNAs significantly dysregulated in the stroke versus control groups that overlap between each study time point and cohort are shown in Figure 2. There were no significant differences in expression for the 8 miRNAs between male and female participants (Table S1). The endogenous control miR-16-5p was not dysregulated in sensitivity analysis (supp fig S5).
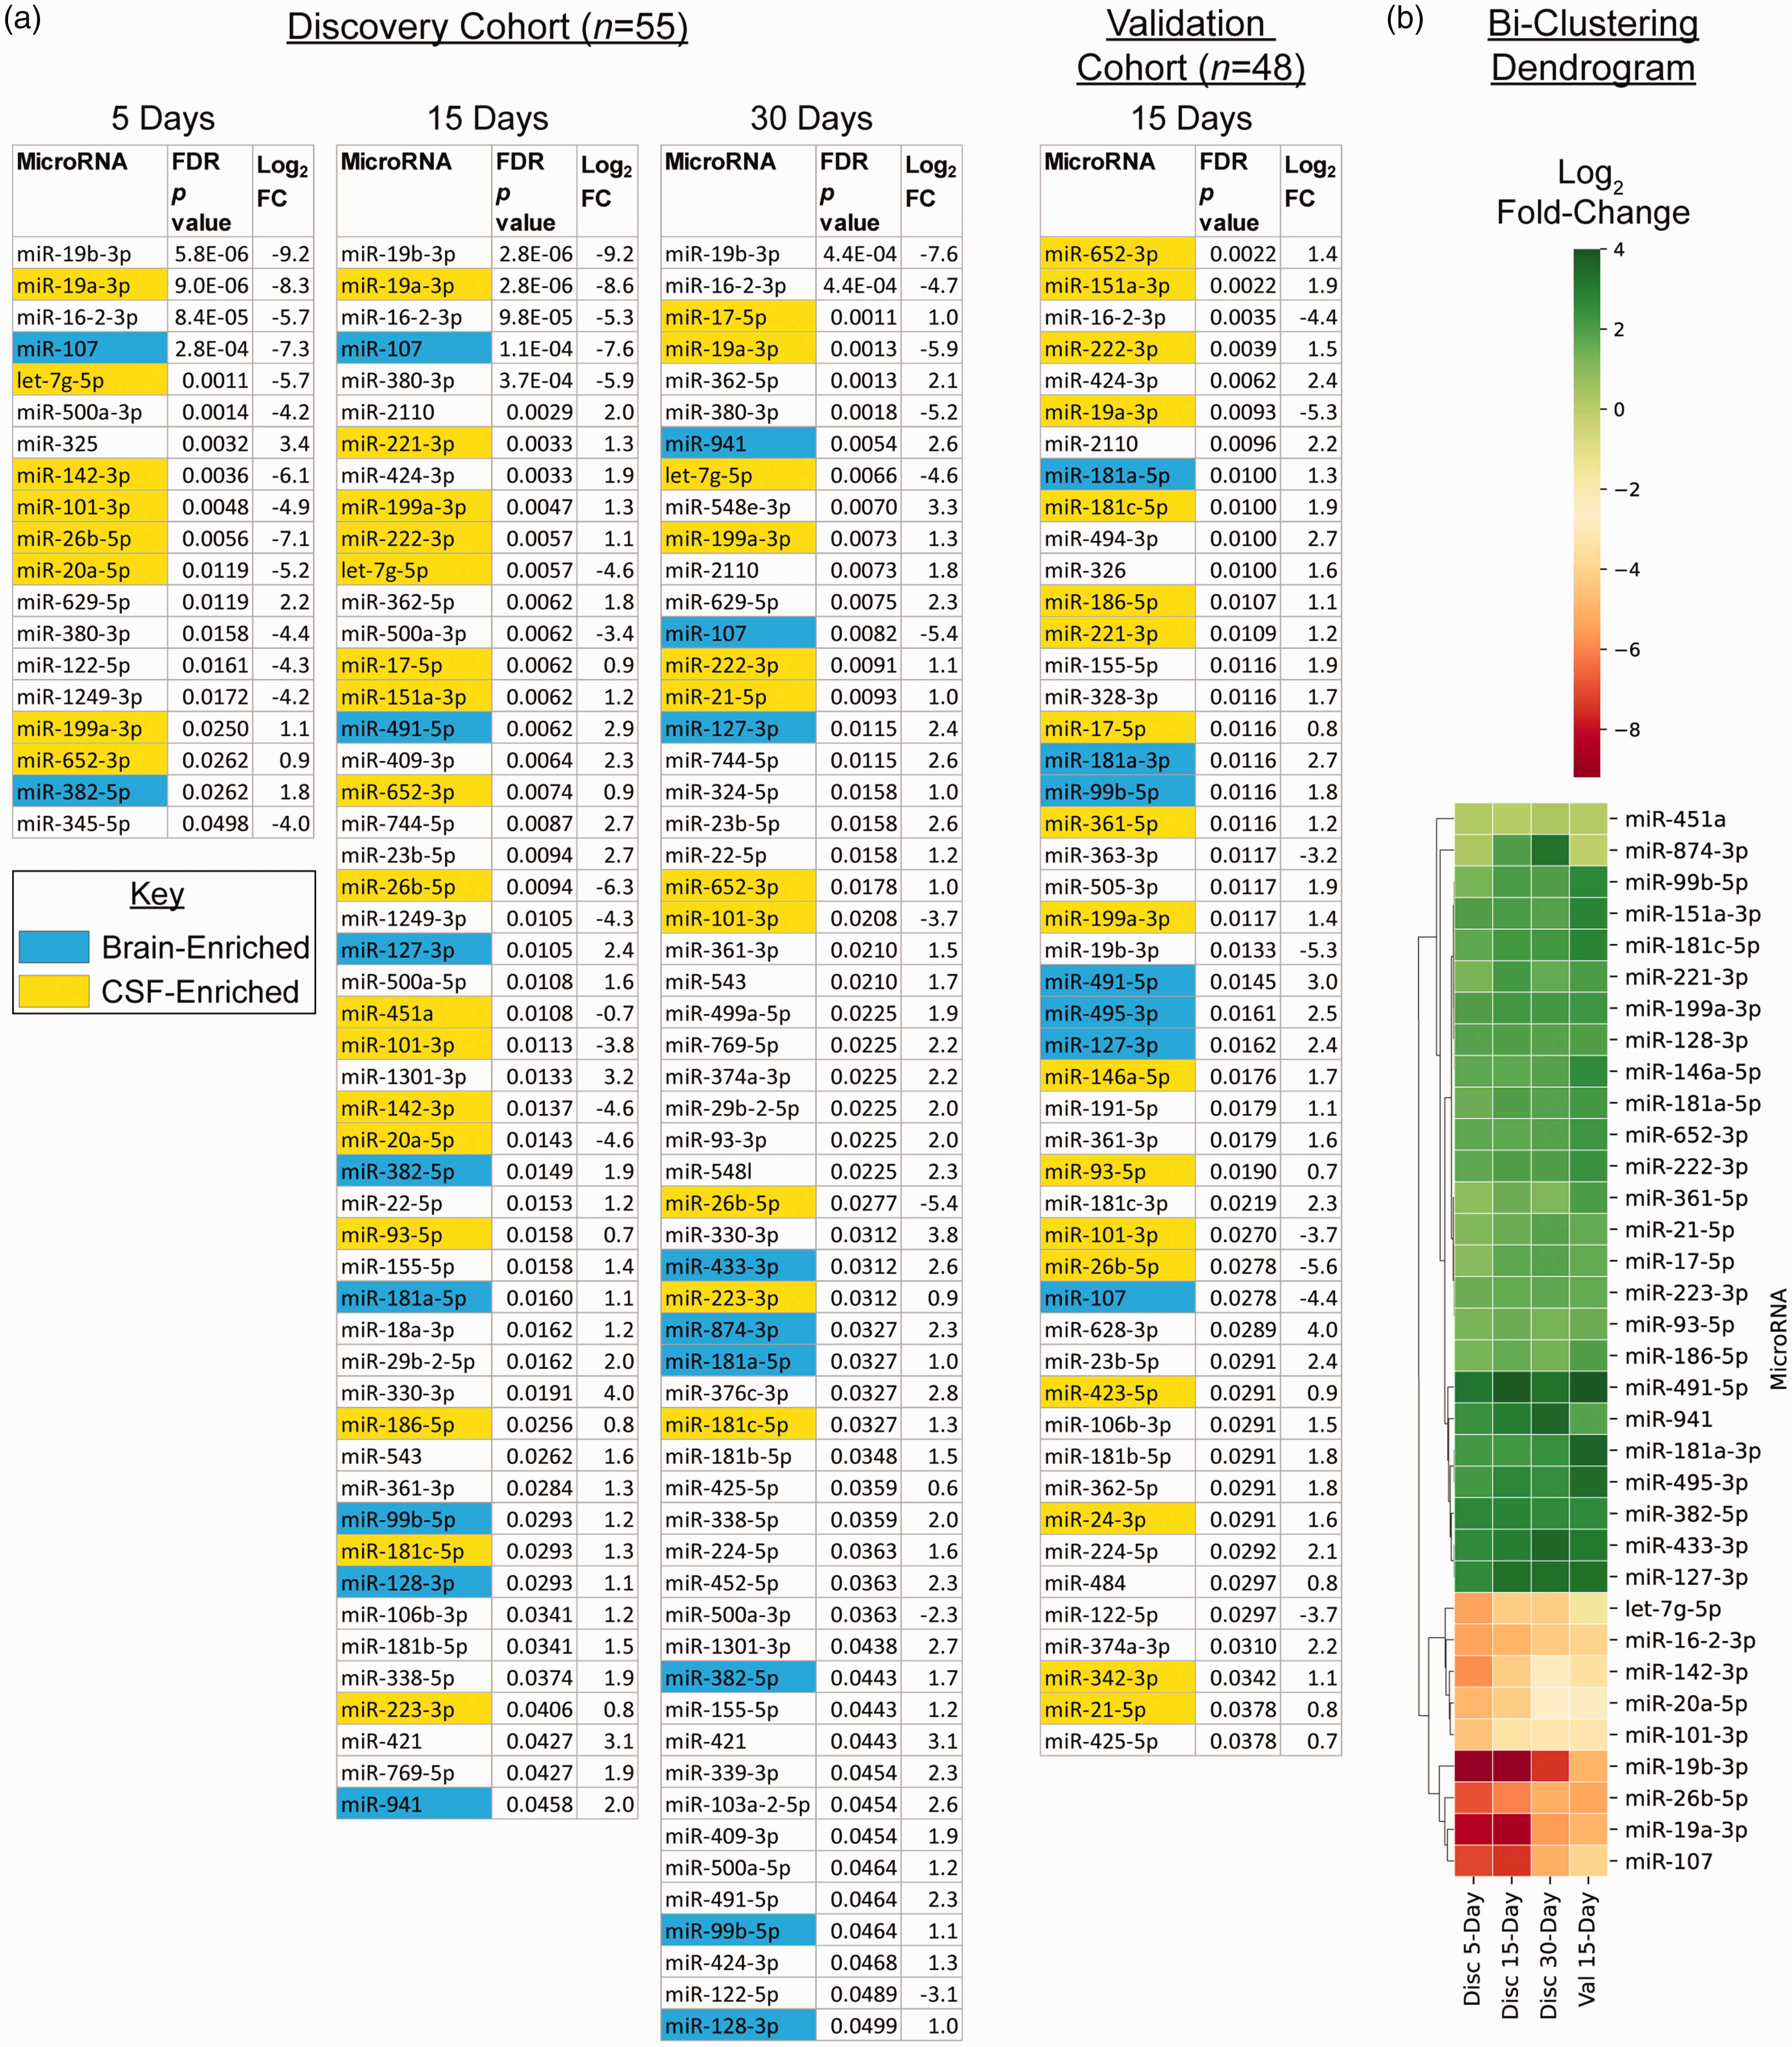
(a) MicroRNAs with significant differential expression (false discovery rate corrected p < 0.05 stroke vs. control participants) for the discovery cohort at 5, 15, and 30 days post-stroke, and the validation cohort at 15 days post-stroke. The number of significant miRNAs more than doubled from 5 to 15 days post-stroke. The brain- and CSF-enriched miRNAs are highlighted in blue and yellow respectively, identified from prior published data sets.38 –40 (b) Bi-clustering dendrogram separating miRNAs into two distinct groups based on stroke vs. control log2 fold-change. This list is limited to the 8 miRNAs dysregulated at all time points as well as all of the brain- and CSF-enriched miRNAs. For a complete dendrogram that includes all dysregulated miRNAs, see supp fig S3. FC – fold-change; FDR p value – false discovery rate corrected p value; Disc – discovery cohort; Val – validation cohort.
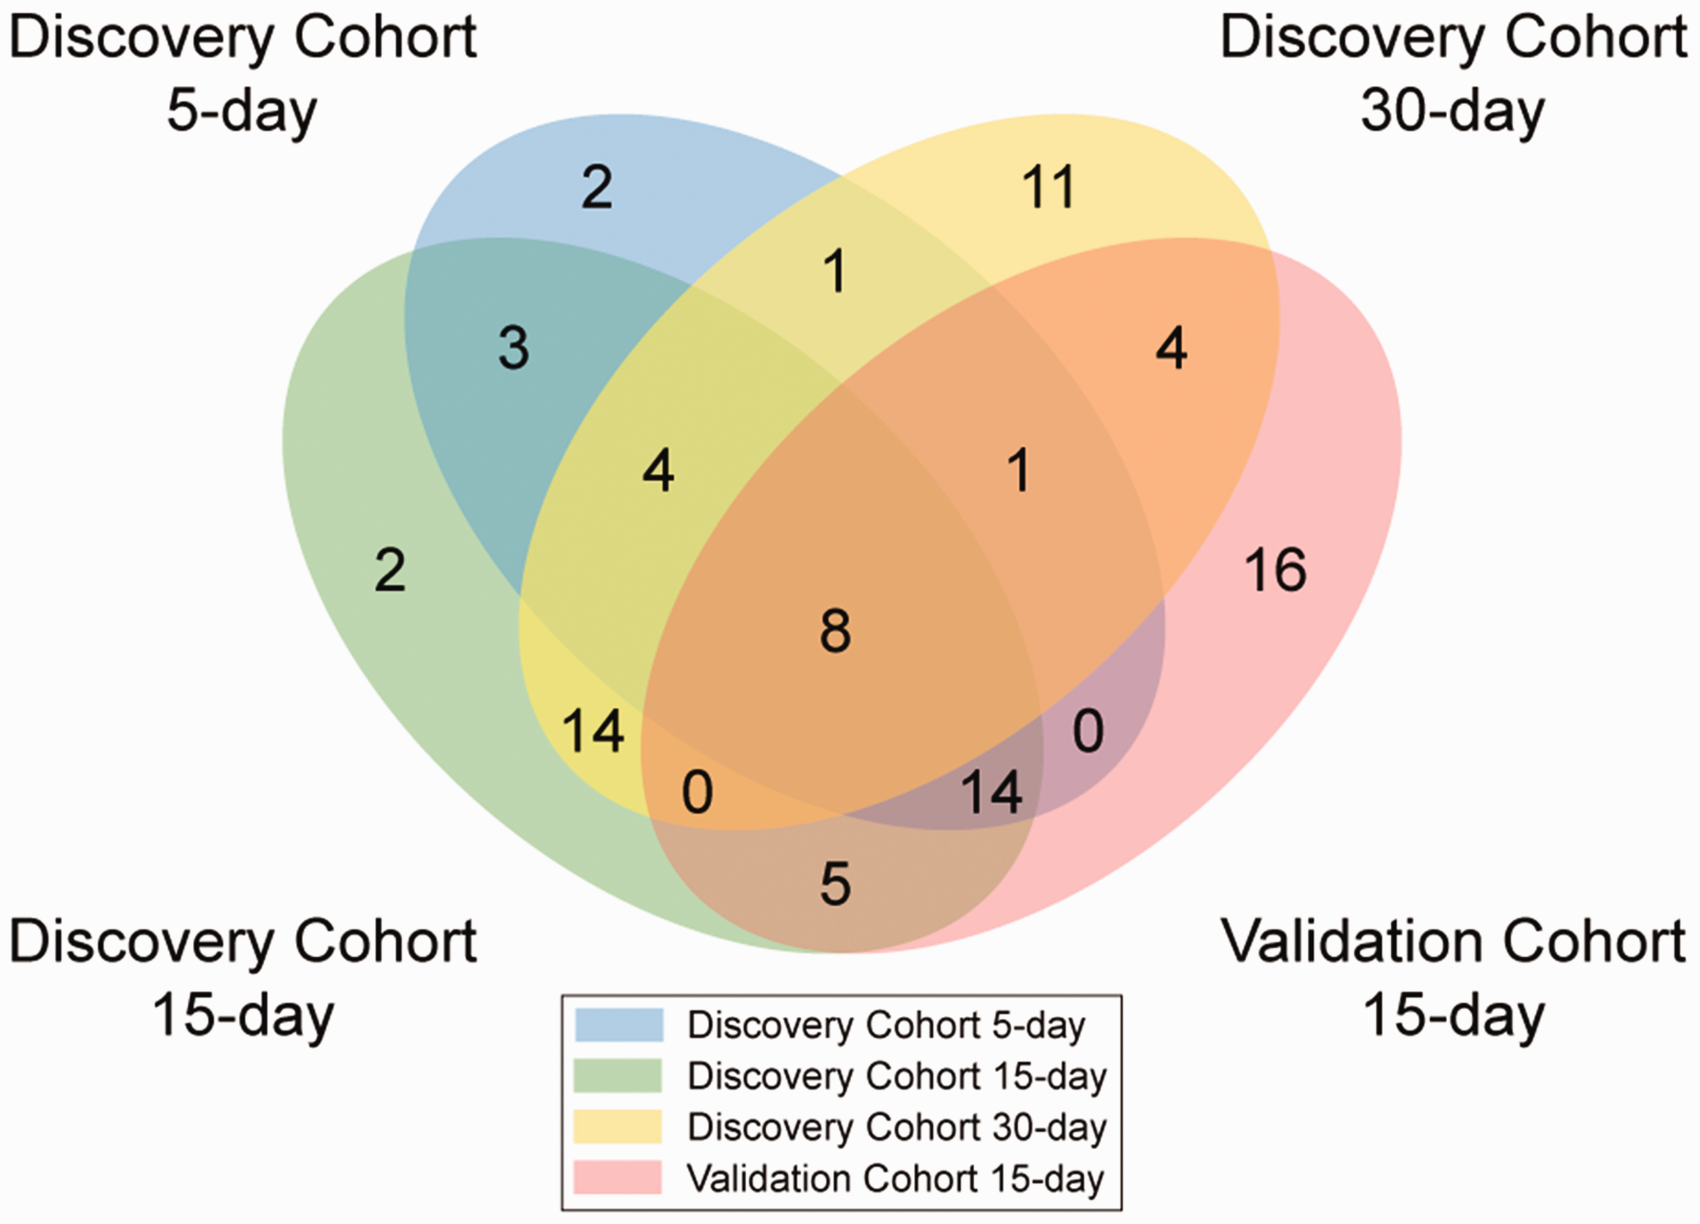
Venn diagram showing the number of microRNAs with significant differential expression between stroke and control participants shared between time points post-stroke in the discovery and validation cohorts.
Expansion of altered miRNAs fifteen to thirty days post-stroke
There was an expansion of significantly dysregulated miRNAs when comparing stroke to control participants (Figure 1(a)) from day 5 (19 miRNAs) to day 15 (50 miRNAs) in the discovery cohort that remained at day 30 (57 miRNAs); the validation cohort also had a large number of significantly dysregulated miRNAs at day 15 (48 miRNAs). At day 5 most significant miRNAs (14/19) showed decreased expression in stroke participants compared to controls whereas by day 30 most demonstrated increased expression (47/57).
Twelve dysregulated brain-enriched miRNAs at one or more time points
We used published lists of brain- and CSF-enriched miRNAs to identify the dysregulated miRNAs most likely to originate from the CNS (Figure 1(a)).38 –40 Of the brain-enriched miRNAs, we found downregulation of miR-107 and upregulation of 11 other miRNAs in stroke participants compared to controls at various timepoints in the two cohorts (miR-99-5p, miR-127-3p, miR-128-3p, miR-181a-3p, miR-181a-5p, miR-382-5p, miR-433-3p, miR-491-5p, miR-495-3p, miR-874-3p, and miR-941). There were no significant differences in expression for the 12 miRNAs between male and female participants (Table S1).
Evolution of fold change over time for dysregulated miRNAs
The 8 miRNAs with significant expression at all timepoints in stroke versus control participants in both studies cumulatively showed a decay in fold-change from 5 to 30 days back toward null differential expression (p < 0.01, Figure 3(a)). The significant brain-enriched miRNAs in stroke versus control participants cumulatively showed an increase in fold-change from day 5 to day 15 (p < 0.01, Figure 3(b)). Only 2 significant miRNAs flipped from negative to positive differential expression over time (miR-874-3p, and miR-93-3p) - one of these was brain-enriched. All other significantly dysregulated miRNAs in the discovery cohort remained increased or decreased in stroke participants relative to controls from day 5 to day 30.
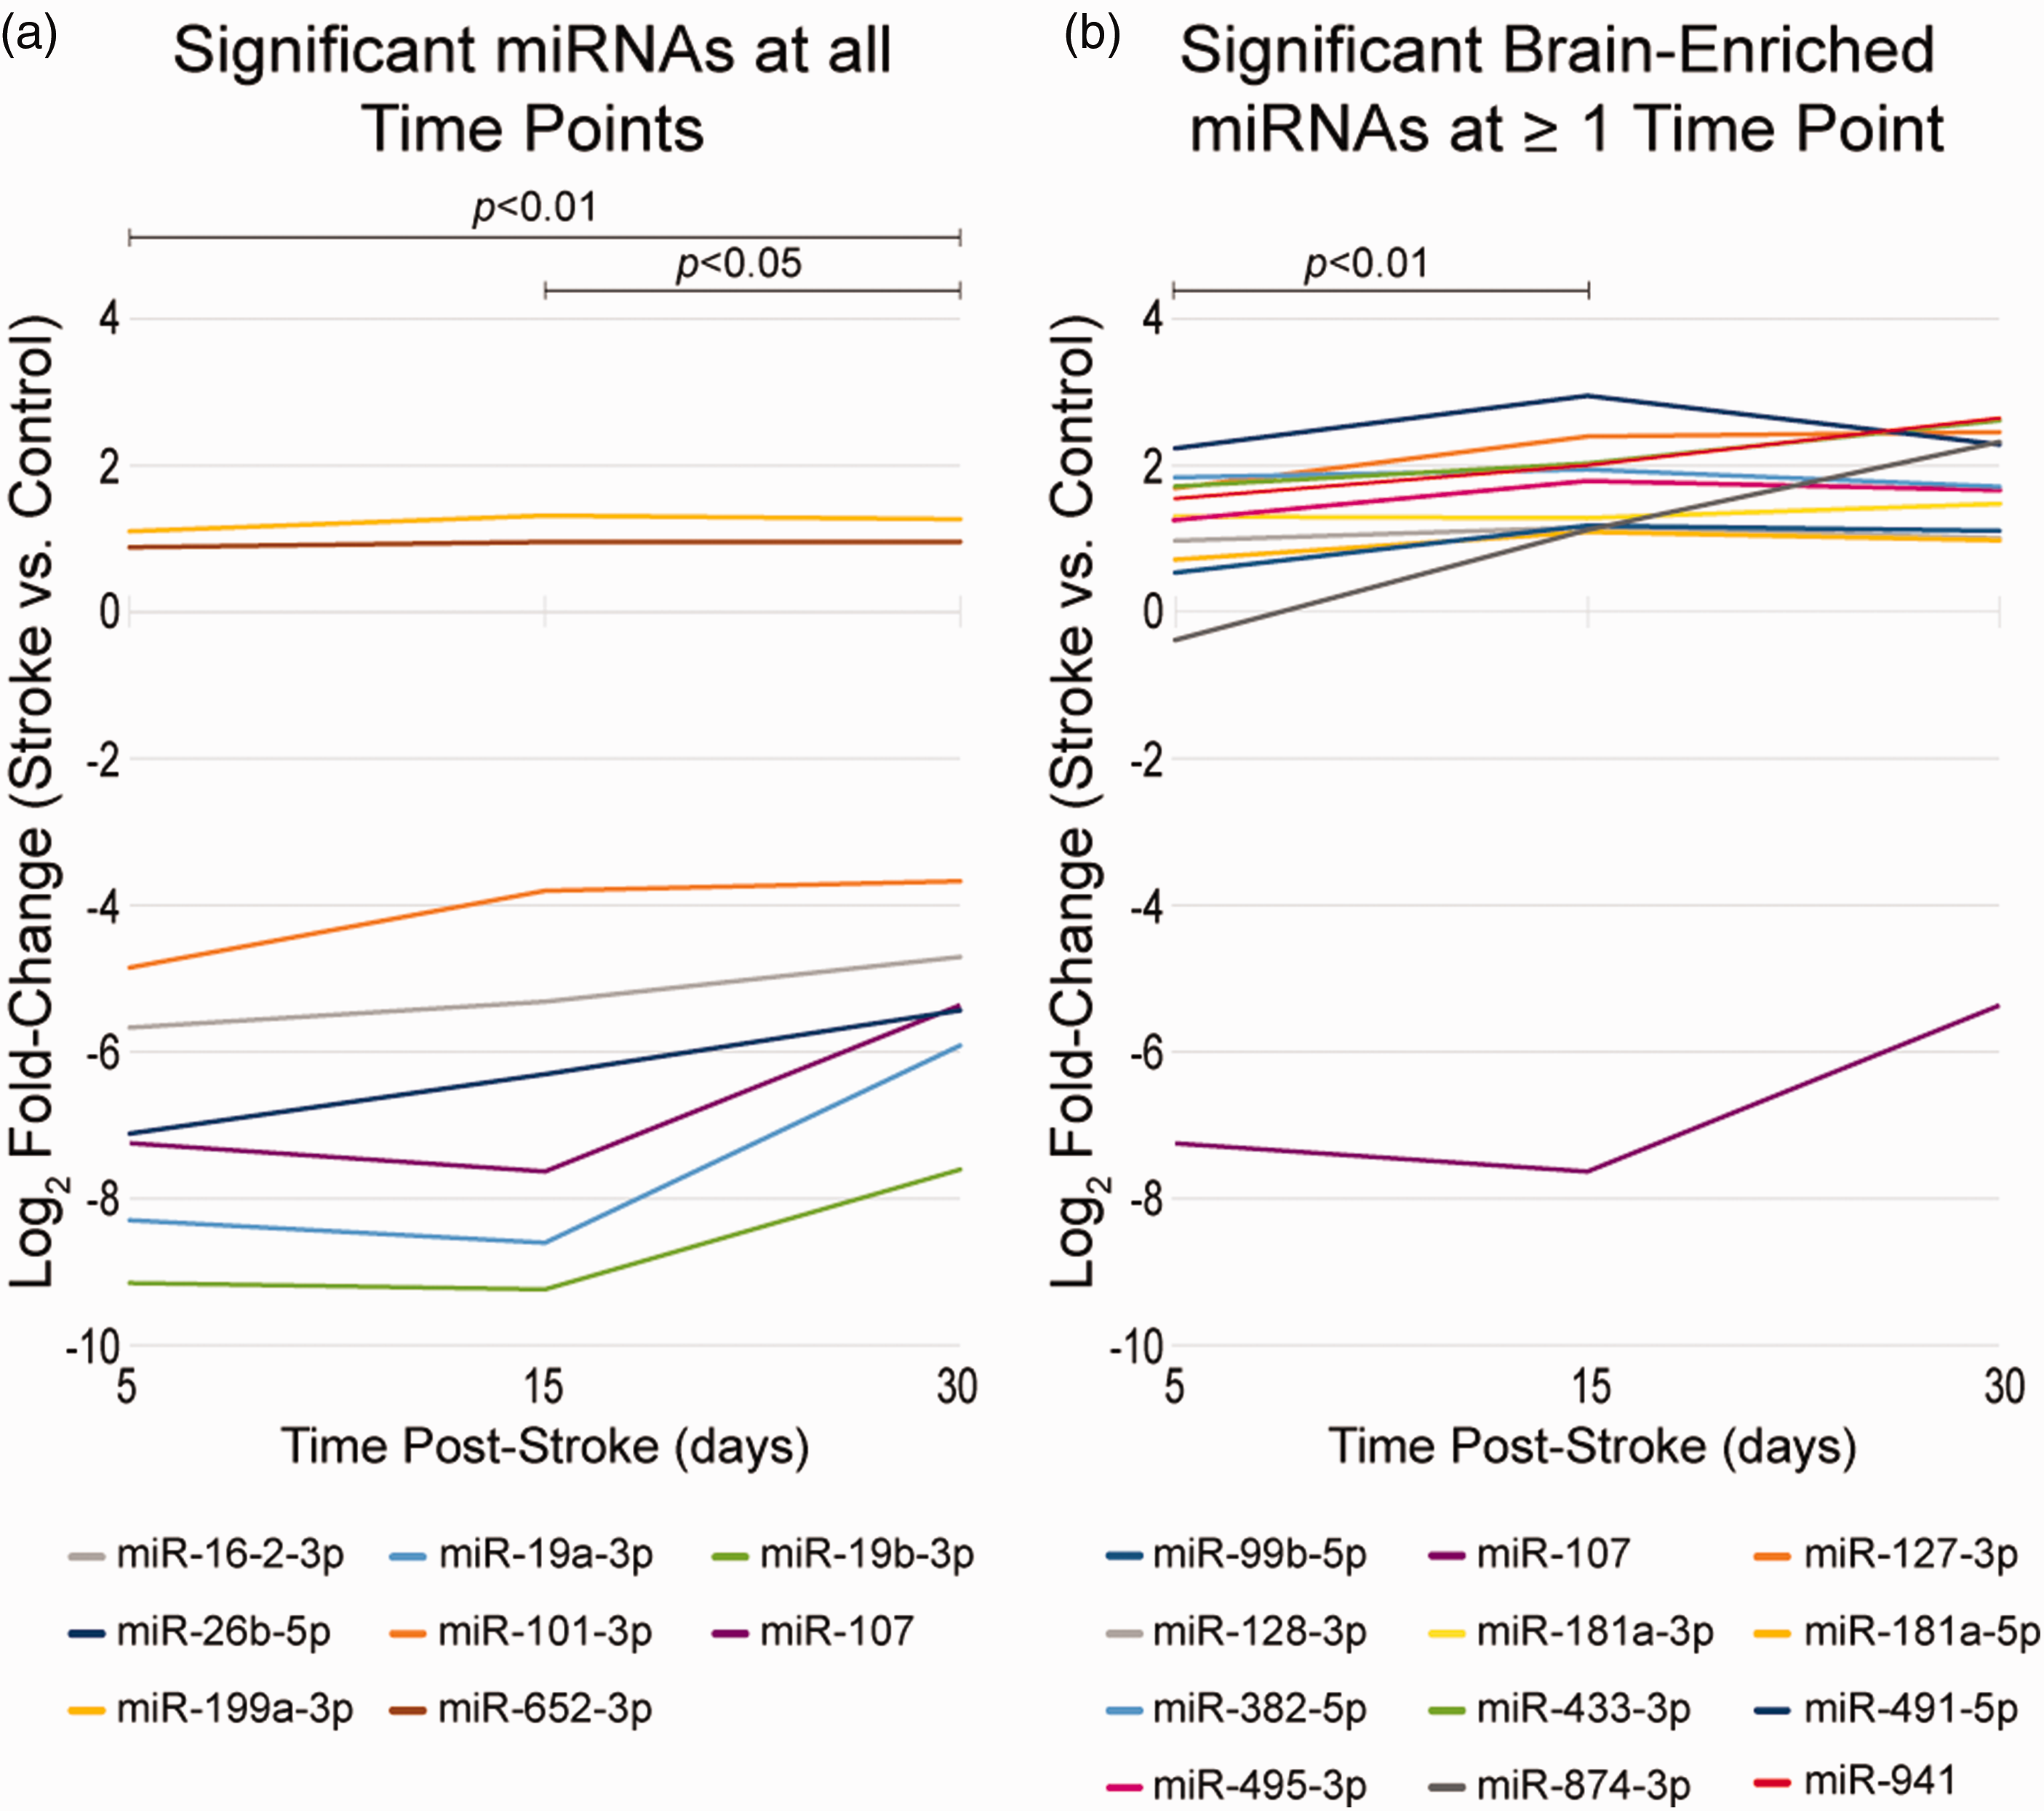
MicroRNA expression (stroke vs. controls) from 5–30 days post-stroke for: (a) the eight miRNAs showing significant differential expression at all time points in the discovery and validation cohorts, and (b) the twelve brain-enriched miRNAs with significant differential expression at 1 or more time points in the discovery or validation cohorts. All expression data plotted are from the discovery cohort since longitudinal data was not available for the validation cohort. In panel A the absolute value of the fold-changes for all 8 miRNAs showed significant change over time, suggesting possible decay toward null expression. In panel B the absolute value of the fold changes for all 12 miRNAs showed a significant change from 5 to 15 days post-stroke, suggesting a possible increase in the expression of brain-enriched miRNAs during this time span.
Pathway analysis
We performed pathway analysis linking mRNA targets with the 8 miRNAs dysregulated at all time points as well as the brain-enriched miRNAs dysregulated 5, 15, and 30 days post-stroke. For the 8 miRNAs altered at all time points in stroke versus control participants, 5 genes (PTEN, PLAG1, ICOS, EZH2, and PTGS2) were predicted to have coactivation due to downregulation of 2 miRNAs (Figure 4). There were no gene targets either coactivated or co-inhibited for the brain-enriched miRNAs identified for stroke versus control participants 5 and 15 days post-stroke (supp figs S4, S5). One gene target (RTL1) was co-inhibited by 2 of the dysregulated brain-enriched miRNAs in stroke versus control participants 30 days post-stroke (supp fig S6). We performed 4 separate core analyses in IPA assessing for canonical biological pathways shared between the 8 dysregulated miRNAs at all time points and the brain-enriched miRNAs at 5, 15, and 30 days post-stroke, which did not return any statistically significant results.
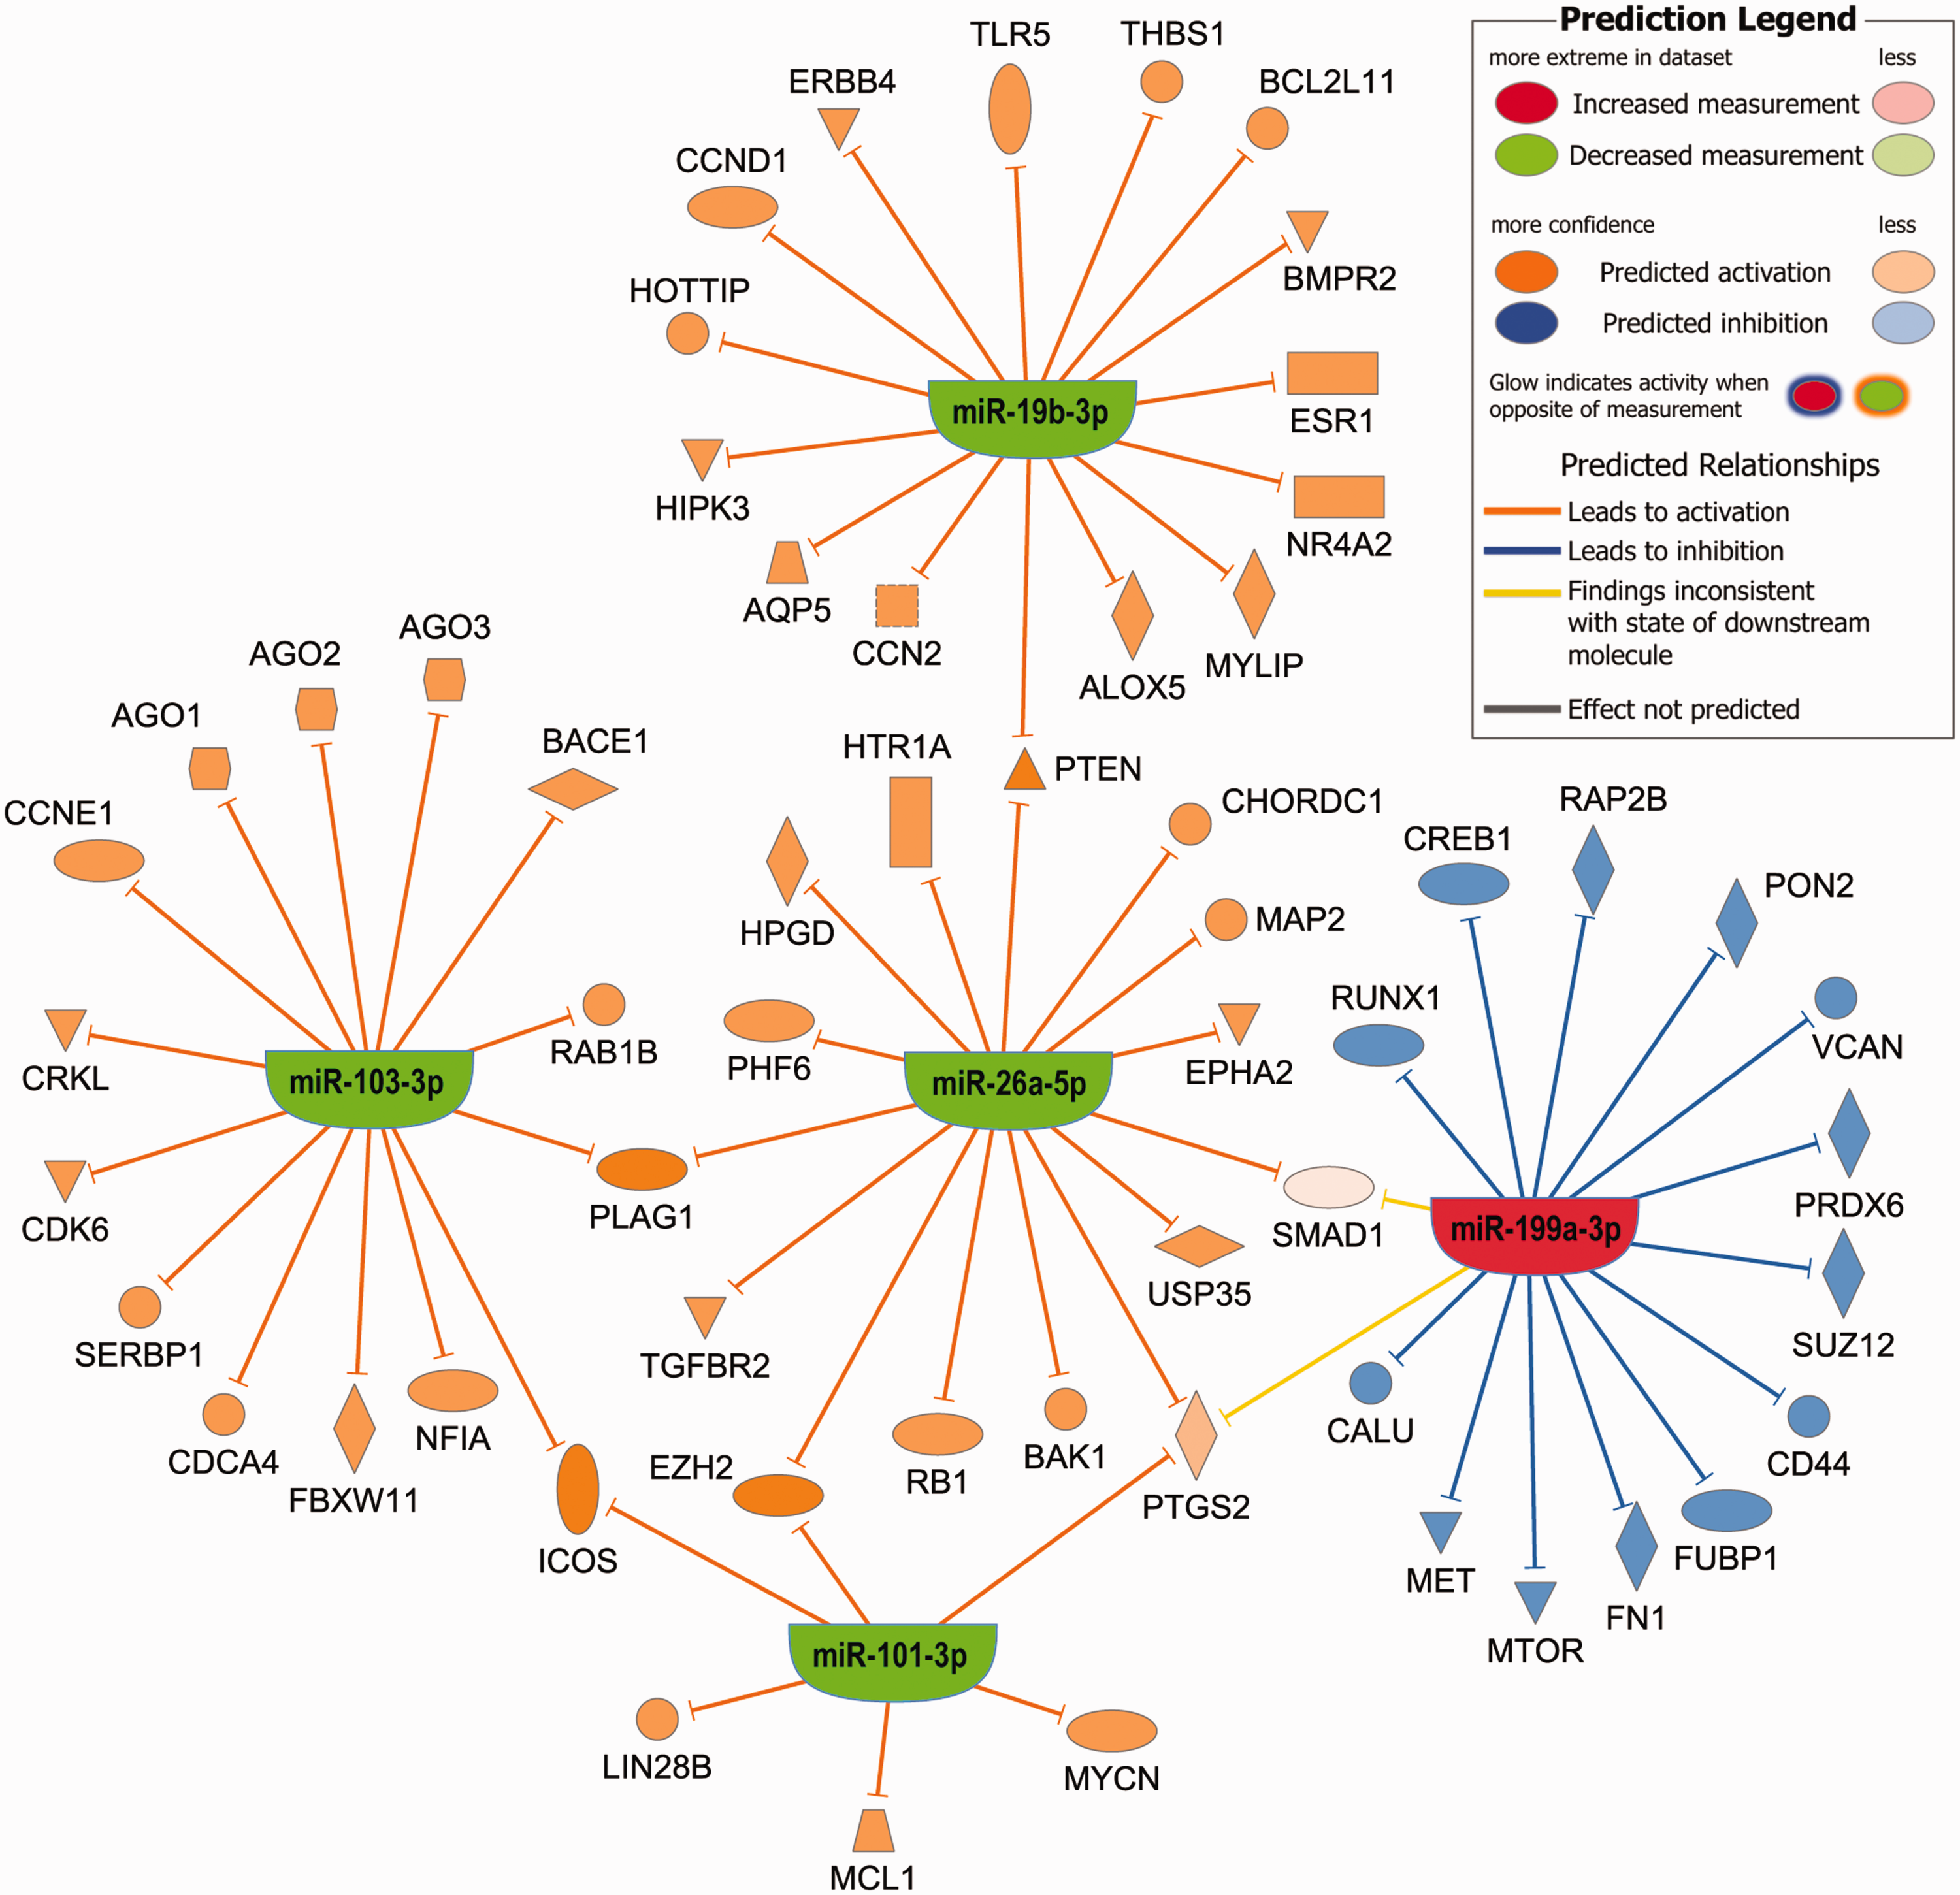
Pathway analysis for the 8 dysregulated miRNAs between stroke and control participants at all time points in both cohorts. Mir-107 mapped to miR-103-3p and miR-19a-3p mapped to miR-19b-3p since they share the same seed regions. Mir-382-5p and miR-16-2-3p had no experimentally observed data linking them to specific genes. The genes PTEN, PLAG1, ICOS, EZH2, and PTGS2 (COX2) were predicted to have coactivation due to decreased expression of 2 miRNAs (see discussion for further details).
Discussion
This study characterized plasma miRNA expression across the early recovery phase (5–30 days) post-stroke in humans. Eight miRNAs remained significantly altered in stroke participants compared to controls over this time in two separate stroke cohorts. There were additionally many miRNA populations that became more or less abundant at specific times post-stroke, as expected. However, we did not anticipate that the number of significantly dysregulated miRNAs would more than double from day 5 to days 15 and 30 post-stroke. Many of the miRNAs significantly altered due to stroke were enriched in brain or abundant in CSF in prior studies, which could suggest these plasma miRNAs are associated with the inflammation/apoptosis or neural repair processes that occur during this time span after stroke.
Eight significant miRNAs across all timepoints
Most of the eight plasma miRNAs showing altered expression across all timepoints in stroke participants versus controls were previously described in clinical or preclinical stroke. In most prior studies stroke caused an increase in miR-107 including in the 1st 24 hrs post-stroke in human and rodent blood, rodent brain tissue, and at 72 hrs in human CSF.14,41,42 Yet we show a consistent decrease in miR-107 expression from 5–30 days in stroke participants versus controls. Increased miR-107 has been associated with glutamate-mediated neurotoxicity as well as reduced angiogenesis.42,43 Considering that excitatory neurotoxicity typically only spans the first hours to days post-stroke, we suspect that decreased miR-107 in our study may be related to angiogenesis. Many prior stroke studies describe dysregulation of miR-16 (which implies the lead miR-16-5p strand), 8 but we only found downregulation of the passenger strand miR-16-2-3p similar to a study in hyperacute stroke. 11 MiR-16-2-3p is associated with apoptosis and suppression of cell proliferation,44,45 so decreased miR-16-2-3p could reflect a response to either prolong cell life or promote inflammation/repair. MiR-19a-3p decreased within 72 hrs post-stroke in human whole blood consistent with our findings in plasma at later time points. 9 MiR-19b-3p is closely related to miR-19a-3p in the miR-17/92 cluster. 46 MiR-19a/b-3p target 100’s of the same genes making it difficult to predict their effects, however, most rodent models suggest miR-19a-3p suppression reduces apoptosis post-stroke.47,48 Alternatively, injection of exosomes containing miR-19a-3p and miR-19b-3p contributed to neural plasticity in a rodent stroke model. 49 MiR-652 decreased 1–3 days post-stroke rodents 50 whereas we found increased expression in stroke participants versus controls from 5–30 days. MiR-652 may mitigate the generation of free radicals through NOX2 suppression. 50 It follows that if miR-652 expression changes directions from 3–5 days post-stroke, this could be a homeostatic mechanism to combat free radicals and prevent further brain injury. Mir-199a-3p lacks any data in clinical or preclinical stroke, but may promote cell survival. 51 MiR-101-3p was decreased in human plasma and rodent brain tissue 24 hrs post-stroke, consistent with our results, and may promote apoptosis and ischemic brain injury.11,52 MiR-26b-5p was also decreased in prior human and rodent studies, with most studies suggesting this increases apoptosis.11,53,54 In summary, most of the 8 miRNAs consistently dysregulated in stroke participants compared to controls 5–30 days after stroke are also altered < 24 hours post-stroke based on review of the literature. Many of the 8 miRNAs may mitigate further brain injury, but this remains speculative as most of these miRNAs also have wide-ranging effects systemically.
We also identified 5 potential gene targets predicted to have coactivation due to decreased expression of dysregulated miRNAs between stroke and control participants at all time points using pathway analysis. Pleomorphic adenoma gene 1 (PLAG1) causes cellular growth and was shown to induce neural progenitor cells to preferentially differentiate into neurons. 55 Similarly, enhancer of zeste homolog 2 (EZH2) acts to repress tumor suppressor genes and therefore activation may either promote inflammation 56 or cellular growth post-stroke. 57 Phosphatase and tensin homolog (PTEN) is a tumor suppressor gene known to inhibit axonal regeneration following experimental stroke. 58 Inducible T-cell costimulator (ICOS) activates T helper lymphocytes, and based on a preclinical stroke model, activation would increase mortality and worsen neurologic function. 59 Similarly, prostaglandin-endoperoxide synthase 2 (PTGS2), also known as COX-2, promotes inflammation and overexpression worsens stroke outcomes. 60 Thus, the genes with predicted coactivation may suggest that miRNAs simultaneously induce tissue growth/repair and inflammation/injury 5–30 days post-stroke in humans.
Brain-enriched miRNAs
The dysregulated miRNAs at specific timepoints 5–30 days after stroke included many enriched in brain.38 –40 All brain-enriched miRNAs were upregulated in stroke participants compared to controls with the exception of miR-107. Only miR-107 and miR-382-5p were significantly altered at 5 days post-stroke; both remained dysregulated at 15 and 30 days in the discovery cohort. MiR-107 may help regulate angiogenesis, as described above, whereas miR-382-5p inhibits cell proliferation in glioma and promoted neuronal apoptosis in a spinal cord injury model.61,62 MiR-491-5p was significantly elevated in stroke participants compared to controls in the discovery and validation cohorts only at 15 days post-stroke. MiR-491-5p promotes apoptosis. 63 Three brain-enriched miRNAs, miR-99b-5p, miR-127-3p and miR-181a-5p, were increased in stroke participants versus controls at 15 days post-stroke in both cohorts and at 30 days in the discovery cohort. MiR-99b-5p acts to suppress cell proliferation. 64 MiR-127-3p was associated with cell death in an aged rodent stroke model. 65 In a like manner, miR-181a-5p induced apoptosis in hippocampal neurons in the mouse. 66 Alternatively, miR-181a-5p may limit neutrophilic inflammation. 67 Two miRNAs, miR-181a-3p and miR-495-3p, showed increased expression in stroke participants versus controls at 15 days post-stroke, but only in the validation cohort. MiR-181a-3p was associated with decreased cellular proliferation much like the parent strand miR-181a-5p described above. 68 MiR-495-3p inhibits glioma proliferation. 69 Two miRNAs, miR-128-3p and miR-941, showed increased expression in stroke participants versus controls 15 and 30 days post-stroke, but only in the discovery cohort. MiR-128-3p was elevated in the CSF of participants with large infarcts 14 and may promote ischemic cell death. 70 In contrast, miR-941 is the only human specific miRNA enriched in brain and likely acts to maintain adult stem cell populations and alter neurotransmitter release from the neural presynaptic terminal. 40 The miR-941 host gene, DNAJC5, encodes the protein CSPα. Downregulation of CSPα was shown to protect axons and synapses in models of neurodegeneration and complete loss led to rapid neurodegeneration in mice.71,72 MiR-941 was the only dysregulated miRNA in the current study also found in our preliminary miRNA panel of upper limb recovery. 16 We found 2 brain-enriched miRNAs significantly upregulated in stroke participants versus controls solely at 30 days post-stroke: miR-433-3p and miR-874-3p. Overexpression of miR-433-3p resulted in apoptosis in glioma cells. 73 Rodent MCAO models suggest that upregulation of miR-874-3p is associated with decreased apoptosis and inflammation as well as improved behavioral outcomes.74,75 Stroke led to acute downregulation of serum miR-874-3p in clinical studies in contrast to our findings in plasma at 30 days.75,76
Pathway analysis revealed predicted co-inhibition of one gene target for the brain-enriched miRNAs dysregulated between stroke and control participants 30 days post-stroke. Retrotransposon like 1 (RT1) maintains fetal capillaries during late stage fetal development and promotes the proliferation of certain cancers. 77 Inhibition would therefore reduce cell growth. This aligns with the predicted roles of the co-inhibiting miRNAs acting on this gene, miR-127-3p and miR-433-3p, in apoptosis and cell death described above.
Timeline of biological changes related to brain-enriched miRNAs
By summarizing the findings from brain specific miRNAs in this study we can begin to piece together a conceivable timeline of events for post-ischemic biological changes in humans (Figure 5). With the exception of miR-107, miR-941, and miR-874-3p all brain specific miRNAs significantly different in stroke participants versus controls 5 to 30 days after stroke act to suppress cellular proliferation. Decreased proliferation could be beneficial if the result is limiting the harmful effects of initial stroke-related inflammation, however, we suspect these miRNA changes are more likely to be injurious. Most of the preclinical studies suggest these miRNAs promote apoptosis.61,64 –66 Furthermore, neural outgrowth is a form of cellular proliferation that can be hampered by upregulating tumor suppressor genes. 31 If these miRNA changes are indeed related to apoptosis it could suggest this process lasts longer in humans post-stroke than previously suspected.21,22 We additionally found changes that could be related to neural repair with the differential expression of miR-874-3p and miR-941 continuing to rise through day 30 post-stroke (Figure 3(b)). Based on the effects in rodent MCAO, miR-874-3p could conceivably confer protection to newly formed neural processes.74,75 Increased expression of miR-941 could suggest alterations related to synaptogenesis or synaptic pruning which are seen 15–30 days post-stroke in rodent models. 30
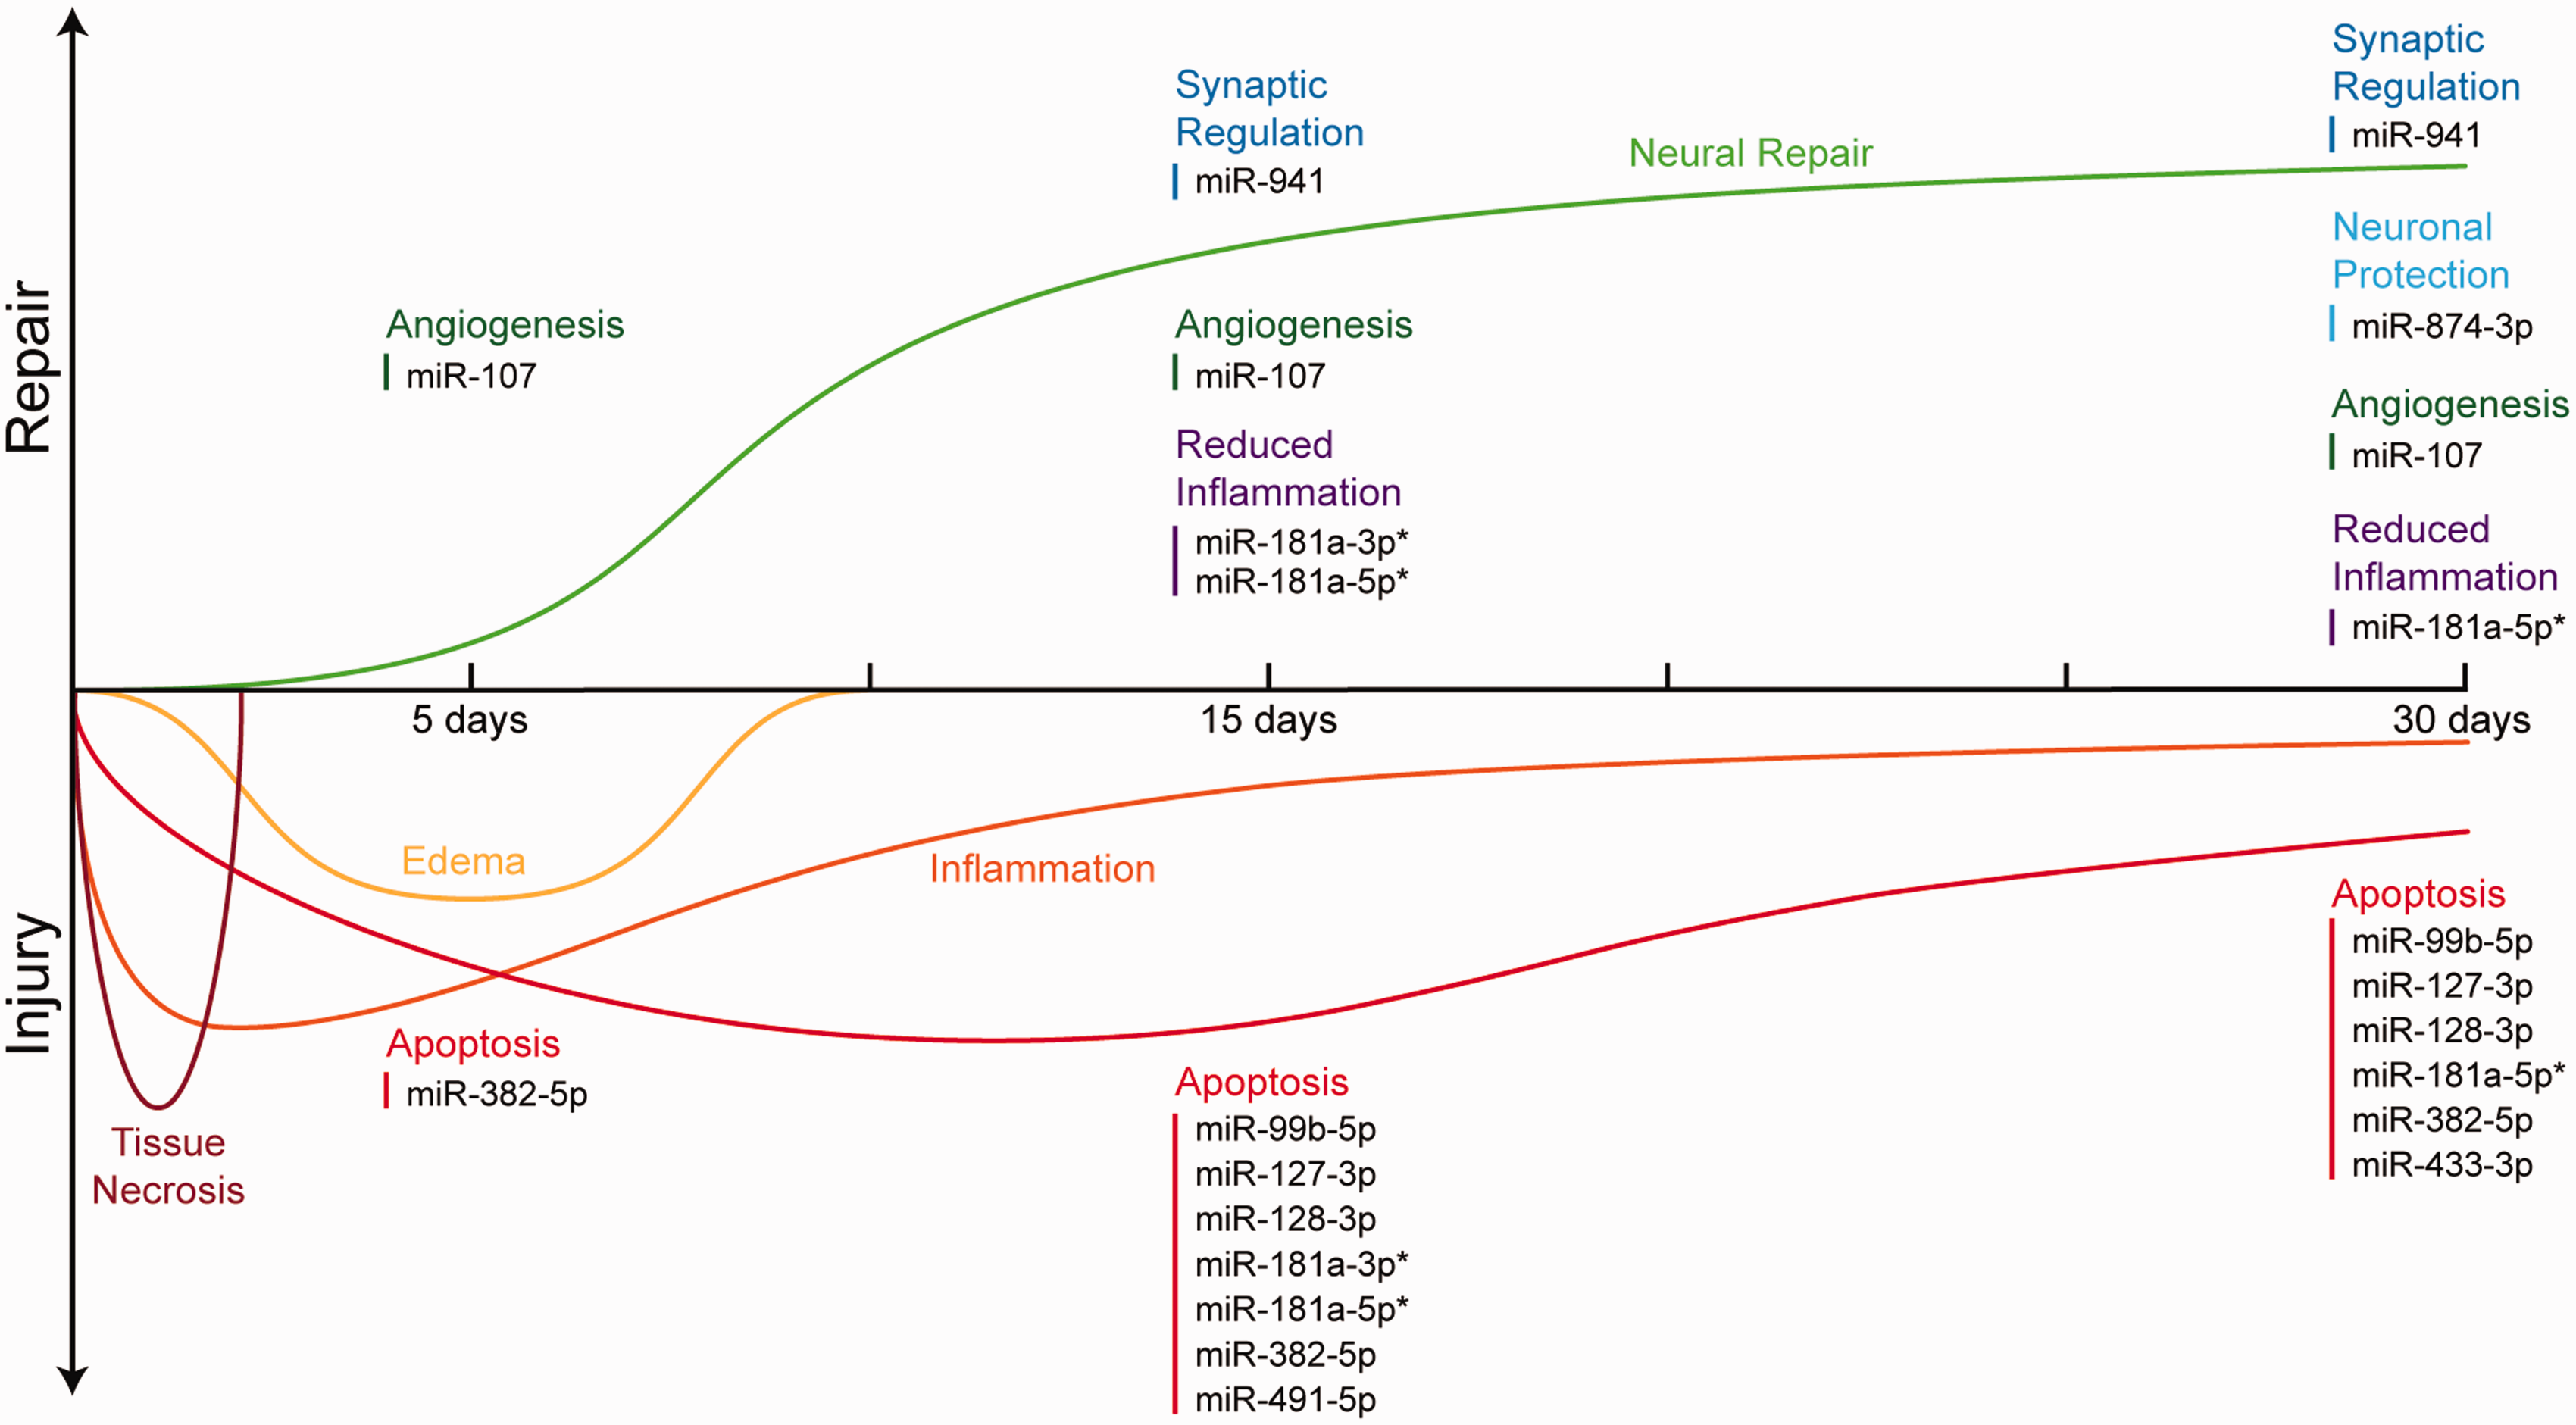
Theoretical timeline of events related to injury and neural repair over the first month post-stroke in humans. Brain-enriched miRNAs are listed at the specific time points when significant dysregulation was found for stroke vs. control participants. The suspected role for each miRNA is shown based on literature review. Neural repair includes neural outgrowth and synaptogenesis/synaptic pruning, but the timing of these events remains unknown in humans. *miRNAs listed for both repair and injury due to multiple possible roles depending on the downstream genes affected. The framework for this figure was reproduced with permission. 80
Human MiRNA targets for future preclinical studies
From a clinical perspective our findings point to a few strategies with potential to improve stroke outcomes after further testing in preclinical models. Most stroke models manipulate miRNAs in the hyperacute phase immediately after injury. Here we showed that miRNA expression continues to evolve and even expand 15–30 days post-stroke. It is possible that limiting the expression of some of the pro-apoptotic miRNAs 5–30 days post-stroke described above could promote neuronal survival and enhance neural outgrowth. Alternatively, targeting miRNAs that curb the initial inflammatory response could also help, but the timing is critical, as was recently shown in a rodent model of hemorrhagic stroke. 78 Promoting stem cell longevity or synapse regulation with miR-941 in a preclinical model would also be very interesting, but may prove difficult. Introducing a species to a novel miRNA is predicted to have mostly deleterious effects. 40 When considering the translational aspects of these findings, it is also important to keep in mind that all the participants in the current studies were undergoing rehabilitation therapy as standard of care which could contribute to alterations in miRNA expression.
Limitations
This study had a few limitations. There was no validation cohort for the 5- and 30-day post-stroke samples. The participants in the discovery cohort also had more severe strokes on average, which could explain some of the differences in the dysregulated miRNA profiles between the discovery and validation cohorts 15 days post-stroke. In addition, samples collected <24 hrs post-stroke would have helped determine whether the 8 miRNAs shown here were dysregulated acutely. The changing physical location of the patients over the first 30 days post-stroke (acute care hospital, inpatient rehabilitation facility, skilled nursing facility, or home) may also have introduced heterogeneity into the study. Our study also had many strengths including the validation cohort for the 15-day time point, very closely matched controls and longitudinal sampling.
Conclusions
Particular miRNAs remain dysregulated in ischemic stroke participants versus controls up to at least 30 days post-stroke in human plasma. There is also an expansion of significantly altered miRNAs from 15–30 days in stroke participants compared to controls including many enriched in brain or CSF. The brain-enriched miRNAs suggest mechanisms of ongoing apoptosis 5–30 days post-stroke and a simultaneous transition to neuronal protection and synapse regulation by day 30, but this remains speculative. Further clinical and preclinical studies linking these miRNA findings to gene expression/proteomics data will be useful to identify treatment targets to improve patient outcomes.
Supplemental Material
sj-pdf-1-jcb-10.1177_0271678X231196982 - Supplemental material for Expansion of plasma MicroRNAs over the first month following human stroke
Supplemental material, sj-pdf-1-jcb-10.1177_0271678X231196982 for Expansion of plasma MicroRNAs over the first month following human stroke by Matthew A Edwardson, Narayan Shivapurkar, James Li, Muhib Khan, Jamal Smith, Margot L Giannetti, Ruzong Fan and Alexander W Dromerick in Journal of Cerebral Blood Flow & Metabolism
Supplemental Material
sj-pdf-2-jcb-10.1177_0271678X231196982 - Supplemental material for Expansion of plasma MicroRNAs over the first month following human stroke
Supplemental material, sj-pdf-2-jcb-10.1177_0271678X231196982 for Expansion of plasma MicroRNAs over the first month following human stroke by Matthew A Edwardson, Narayan Shivapurkar, James Li, Muhib Khan, Jamal Smith, Margot L Giannetti, Ruzong Fan and Alexander W Dromerick in Journal of Cerebral Blood Flow & Metabolism
Supplemental Material
sj-pdf-3-jcb-10.1177_0271678X231196982 - Supplemental material for Expansion of plasma MicroRNAs over the first month following human stroke
Supplemental material, sj-pdf-3-jcb-10.1177_0271678X231196982 for Expansion of plasma MicroRNAs over the first month following human stroke by Matthew A Edwardson, Narayan Shivapurkar, James Li, Muhib Khan, Jamal Smith, Margot L Giannetti, Ruzong Fan and Alexander W Dromerick in Journal of Cerebral Blood Flow & Metabolism
Footnotes
Funding
The author(s) disclosed receipt of the following financial support for the research, authorship, and/or publication of this article: This work was supported by a grant from the National Institute of Neurological Disorders and Stroke (R61NS117196, MAE) and Spectrum Health Neuroscience Institute Intramural Grant (RI2018-016-19, MK). Additional support was provided in part by the Center for Brain Plasticity and Recovery, Georgetown University and MedStar National Rehabilitation Hospital.
Acknowledgements
The authors would like to thank the following individuals for their contributions to this work: Dave Chesla PA-ASCP, MHA, Leo Gallagher B.S., and Laurel Packard OTD. Complementary DNA synthesis and generation of OpenArray data was performed in the Johns Hopkins School of Medicine Genetic Resources Core Facility, RRID: SCR_018669.
Declaration of conflicting interests
The author(s) declared no potential conflicts of interest with respect to the research, authorship, and/or publication of this article.
Authors’ contributions
MAE and AWD conceived the study. MAE, MK and AWD were PIs for the clinical studies. NS performed RNA extraction and assisted in data analysis and interpretation. XL and RF performed statistical analysis. JS and MLG developed strategies for recruiting matched controls and enrolled participants. MAE wrote the initial manuscript and all authors edited and approved the final version with the exception of AWD who passed away August, 2021.
Supplementary material
Supplemental material for this article is available online.
References
Supplementary Material
Please find the following supplemental material available below.
For Open Access articles published under a Creative Commons License, all supplemental material carries the same license as the article it is associated with.
For non-Open Access articles published, all supplemental material carries a non-exclusive license, and permission requests for re-use of supplemental material or any part of supplemental material shall be sent directly to the copyright owner as specified in the copyright notice associated with the article.